Ethereum Poised to Resume Uptrend As Crucial On-Chain Metrics Turn Bullish
July 15 2020 - 9:27AM
NEWSBTC
Ethereum entered a consolidation period over the past week that has
led to the formation of a descending triangle on its 4-hour chart.
A horizontal trendline developed along with the swing lows while a
descending trendline formed along with the swing highs. The
continuation pattern estimates that a spike in demand for Ether
that allows […]
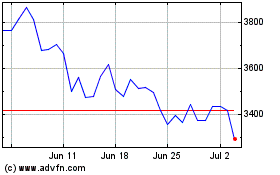
Ethereum (COIN:ETHUSD)
Historical Stock Chart
From Mar 2024 to Apr 2024

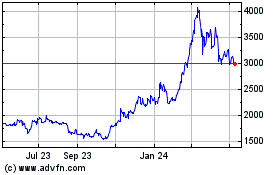
Ethereum (COIN:ETHUSD)
Historical Stock Chart
From Apr 2023 to Apr 2024
