Cardano (ADA) Price Nears A Pivotal Shift – A Breach Into The $0.3 Level?
August 30 2023 - 8:00PM
NEWSBTC
Cardano (ADA) enthusiasts are eagerly watching the charts as the
cryptocurrency’s price forms a distinctive triangle pattern,
suggesting an imminent breakout that could mark a significant shift
in its trajectory. This technical formation occurs when the
price fluctuations of an asset are confined within converging
trendlines, creating a triangle-like shape on the chart. Traders
interpret this pattern as a period of consolidation, often
preceding a substantial price movement. As Cardano’s price coils
within the confines of the triangle pattern, traders are bracing
for a potential decisive breakout in the days to come. The
prevailing trend, in this case, supports the notion of a likely
price ascent, and that is to make it to the $0.3 region. Related
Reading: Bitcoin Cash (BCH) Records Surprising 15% Rally – What’s
Behind It? However, market sentiment hints at the possibility of
sellers breaching the bottom trendline, leading to an extension of
the ongoing corrective trend. A report suggests that a retreat
below the pattern’s support trendline might trigger an approximate
8.5% downturn. Current Scenario And ADA Price Analysis At present,
Cardano’s price stands at $0.265, as reported by CoinGecko. The
cryptocurrency has experienced a modest 1.2% gain over the past 24
hours and a 3.0% increase in value over the course of the last
week. Nevertheless, the current triangle pattern indicates that
these gains might be overshadowed by a potentially more significant
movement. As of today, the market cap of ADA stood at $9.2 billion.
Chart: TradingView.com Reflecting on its history, Cardano reached
its all-time high price of $3.09 on Sept. 2, 2021, accompanied by a
market cap of around $95 billion on the same day. Notably, a
separate report underscores the consistent need for increased
demand for Cardano in order to align with its historical price
levels. This necessity arises due to the cryptocurrency’s
unique monetary expansion model, which introduces a fixed rate of
0.3% every five days for circulating the remaining tokens from the
‘reserve.’ This approach effectively curtails the rate at which ADA
is injected into the supply over time. Future Possibilities And
Investor Prospects Analysts speculate that the current ADA price
could potentially present an opportunity for investors to secure
substantial gains, if the layer-1 blockchain manages to match its
previous demand. This projection rests on the assumption that
historical demand for ADA could surge once again. Related Reading:
Lido (LDO) Price Inks Gains Alongside TVL Rise – What Traders
Should Expect As Cardano’s price tightens within the triangle
pattern, market participants hold their breath for the anticipated
breakout. Traders remain cautious, aware that a breach below the
pattern’s support trendline could lead to a notable downward
movement. (This site’s content should not be construed as
investment advice. Investing involves risk. When you invest, your
capital is subject to risk). Featured image from FX Empire
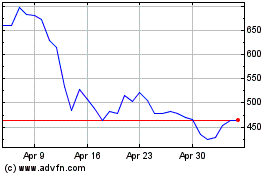
Bitcoin Cash (COIN:BCHUSD)
Historical Stock Chart
From Mar 2024 to Apr 2024

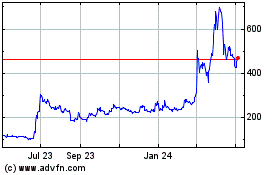
Bitcoin Cash (COIN:BCHUSD)
Historical Stock Chart
From Apr 2023 to Apr 2024
