SIFCO Industries, Inc. Announces Fiscal 2008 Third Quarter Financial Results
August 11 2008 - 8:00AM
Business Wire
SIFCO Industries, Inc. (AMEX: SIF) today announced financial
results for its fiscal 2008 third quarter, which ended June 30,
2008. Income from continuing operations before income taxes for the
third quarter of fiscal 2008 increased to $3.1 million, compared
with $2.5 million in the comparable fiscal 2007 period. Net income
for the third quarter of fiscal 2008 was $2.2 million, or $0.40 per
diluted share, compared with a net income of $0.4 million, or $0.07
per diluted share, in the comparable fiscal 2007 period. Income
from continuing operations for the third quarter of fiscal 2008 was
$2.1 million, or $0.38 per diluted share, compared with income from
continuing operations of $1.9 million, or $0.36 per diluted share,
in the comparable fiscal 2007 period. Income from discontinued
operations, net of tax, for the third quarter of fiscal 2008 was
$0.1 million, or income of $0.02 per diluted share, compared with a
loss from discontinued operations, net of tax, of $1.5 million, or
a loss of $0.29 per diluted share, in the comparable fiscal 2007
period. Net sales increased 13.8% in the third quarter of fiscal
2008 to $27.3 million compared with $24.0 million in the same
period a year ago. In the third quarter of fiscal 2008: Aerospace
Component Manufacturing Group net sales increased by $2.8 million,
or 16.5%, to $19.7 million, compared with $16.9 million in the
comparable 2007 period, Turbine Components Services and Repair
Group net sales were $3.6 million in the third quarters of both
fiscal 2008 and 2007, and Applied Surface Concepts Group net sales
increased $0.4 million, or 12.9%, to $3.9 million, compared with
$3.5 million in the comparable 2007 period. For the first nine
months of fiscal 2008, income from continuing operations before
income taxes increased to $8.4 million, compared with $7.2 million
in the comparable fiscal 2007 period. Included in income from
continuing operations before income taxes in the first nine months
of fiscal 2008 was $0.5 million of expense related to the business
settlement of a product dispute. Net income for the first nine
months of fiscal 2008 was $5.1 million, or $0.96 per diluted share,
compared with net income of $4.6 million, or $0.87 per diluted
share, in the comparable fiscal 2007 period. Income from continuing
operations for the first nine months of fiscal 2008 was $5.3
million, or $1.00 per diluted share, compared with income from
continuing operations of $6.5 million, or $1.23 per diluted share,
in the comparable fiscal 2007 period. Loss from discontinued
operations, net of tax, for the first nine months of fiscal 2008
was $0.2 million, or a loss of $0.04 per diluted share, compared
with loss from discontinued operations, net of tax, of $1.9
million, or a loss of $0.36 per diluted share, in the comparable
fiscal 2007 period. Included in loss from discontinued operations
in the first nine months of fiscal 2007 was $2.1 million of grant
income related to the expiration of certain grants. Net sales
increased 18.3% in the first nine months of fiscal 2008 to $76.5
million compared with $64.7 million for the same period a year ago.
In the first nine months of fiscal 2008: Aerospace Component
Manufacturing Group net sales increased by $9.5 million, or 21.3%
to $54.0 million, compared with $44.5 million in the comparable
2007 period, Turbine Component Services and Repair Group net sales
increased in the first nine months of fiscal 2008 by $1.8 million,
or 19.5% to $11.2 million, compared with $9.4 million in the
comparable 2007 period, and Applied Surface Concepts Group net
sales increased in the first nine months of fiscal 2008 by $0.5
million, or 4.5%, to $11.3 million, compared with $10.8 million in
the comparable 2007 period. Forward-Looking Language Certain
statements contained in this press release are �forward-looking
statements� within the meaning of the Private Securities Litigation
Reform Act of 1995, such as statements relating to financial
results and plans for future business development activities, and
are thus prospective. Such forward-looking statements are subject
to risks, uncertainties and other factors, which could cause actual
results to differ materially from future results expressed or
implied by such forward-looking statements. Potential risks and
uncertainties include, but are not limited to, economic conditions,
competition and other uncertainties detailed from time to time in
the Company�s Securities and Exchange Commission filings. The
Company�s Form 10-Q for the quarter ended June 30, 2008 can be
accessed through its website: www.sifco.com, or on the Securities
and Exchange Commission�s website: www.sec.gov. SIFCO Industries,
Inc. is engaged in the production and sale of a variety of
metalworking processes, services and products produced primarily to
the specific design requirements of its customers. The processes
and services include forging, heat-treating, coating, welding,
machining and selective electrochemical finishing. The products
include forged components, machined forged components and other
machined metal components, remanufactured component parts for
aerospace turbine engines, and selective electrochemical finishing
solutions and equipment. The Company�s operations are conducted in
three business segments: (1) Aerospace Component Manufacturing
Group, (2) Turbine Components Services and Repair Group, and (3)
Applied Surface Concepts Group. SIFCO Industries, Inc. Third
Quarter Ended June 30, 2008 (Amounts in thousands, except per share
data) � Consolidated Condensed Statements of Operations � � Third
Quarter Nine Months Ended June 30, Ended June 30, 2008 � 2007 �
2008 � 2007 � Net sales $ 27,333 � $ 24,022 $ 76,493 � $ 64,678 �
Cost of goods sold 20,977 18,435 58,492 49,118 Selling, general and
administrative expenses � 3,243 � 3,004 � 9,507 � 8,286 � Operating
income 3,113 2,583 8,494 7,274 Interest expense, net 19 52 130 104
Foreign currency exchange gain, net (8 ) (6 ) (12 ) (14 ) Other
expense (income), net (1 ) � 24 � � (1 ) � (9 ) Income from
continuing operations before income tax provision 3,103 2,513 8,377
7,193 Income tax provision � 1,035 � � 618 � � 3,031 � � 730 �
Income from continuing operations 2,068 1,895 5,346 6,463 Income
(loss) from discontinued operations, net of tax � 91 � � (1,532 ) �
(216 ) � (1,897 ) � Net income $ 2,159 � $ 363 � $ 5,130 � $ 4,566
� � � � Income per share from continuing operations: Basic $ 0.39 $
0.36 $ 1.01 $ 1.23 Diluted $ 0.38 $ 0.36 $ 1.00 $ 1.23 � Income
(loss) per share from discontinued operations, net of tax: Basic $
0.02 $ (0.29 ) $ (0.04 ) $ (0.36 ) Diluted $ 0.02 $ (0.29 ) $ (0.04
) $ (0.36 ) � Net income per share: Basic $ 0.41 $ 0.07 $ 0.97 $
0.87 Diluted $ 0.40 $ 0.07 $ 0.96 $ 0.87 � � Weighted average
number of common shares (basic) 5,294 5,252 5,290 5,237 Weighted
average number of common shares (diluted) 5,345 5,311 5,342 5,274
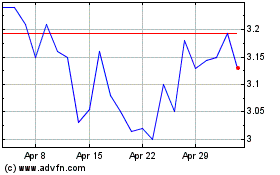
Sifco Industries (AMEX:SIF)
Historical Stock Chart
From Jun 2024 to Jul 2024

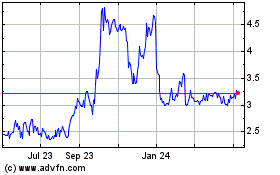
Sifco Industries (AMEX:SIF)
Historical Stock Chart
From Jul 2023 to Jul 2024
