UNITED
STATES
SECURITIES
AND EXCHANGE COMMISSION
Washington,
D.C. 20549
FORM
6-K
Report
of Foreign Private Issuer Pursuant to Rule 13a-16 or 15d-16
under the Securities Exchange Act of 1934
For
the month of February 2024
Commission
File Number 001-11444
| MAGNA
INTERNATIONAL INC. |
| (Exact
Name of Registrant as specified in its Charter) |
| |
| 337
Magna Drive, Aurora, Ontario, Canada L4G 7K1 |
| (Address
of principal executive office) |
Indicate
by check mark whether the registrant files or will file annual reports under cover Form 20-F or Form 40-F.
Form 20-F
☐ Form 40-F
☒
SIGNATURES
Pursuant
to the requirements of the Securities Exchange Act of 1934, the registrant has duly caused this report to be signed on its behalf
by the undersigned, thereunto duly authorized.
| |
|
|
MAGNA INTERNATIONAL INC. |
| |
|
|
|
| |
|
|
(Registrant) |
| Date: |
February 23, 2024 |
|
|
| |
|
|
|
| |
|
|
By: |
/s/ “Bassem Shakeel” |
| |
|
|
|
Bassem A. Shakeel, |
| |
|
|
|
Vice-President, Associate General Counsel and Corporate Secretary |
EXHIBITS
Exhibit 99.1
MAGNA
INTERNATIONAL INC.
Management’s
Discussion and Analysis of Results of Operations and Financial Position
Unless
otherwise noted, all amounts in this Management’s Discussion and Analysis of Results of Operations and Financial Position [“MD&A”]
are in U.S. dollars and all tabular amounts are in millions of U.S. dollars, except per share figures, which are in U.S. dollars. When
we use the terms “we”, “us”, “our” or “Magna”, we are referring to Magna International
Inc. and its subsidiaries and jointly controlled entities, unless the context otherwise requires.
This
MD&A should be read in conjunction with the audited consolidated financial statements for the year ended December 31, 2023 included
in our 2023 Annual Report to Shareholders.
This
MD&A may contain statements that are forward looking. Refer to the “Forward-Looking Statements” section in this MD&A
for a more detailed discussion of our use of forward-looking statements.
This
MD&A has been prepared as at February 22, 2024.
HIGHLIGHTS
INDUSTRY
PRODUCTION ENVIRONMENT
| • | Global
light vehicle production increased 8% in 2023, including increases of 9%, 11%, and 8% in
North America, Europe, and China, respectively. |
| | • | North American light vehicle production was negatively impacted by the
UAW labour strikes at certain customers during the third and fourth quarters of 2023. |
SALES
& EARNINGS
| • | Total
sales increased 13% to a record $42.8 billion, primarily reflecting higher global vehicle
production, the launch of new programs, and the acquisition of Veoneer Active Safety [“Veoneer
AS”], partially offset by the negative impact of lost vehicle production as a result
of the UAW labour strikes at certain customers during the third and fourth quarters of 2023. |
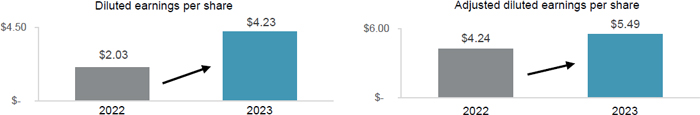
| • | Diluted
earnings per share were $4.23 and adjusted diluted earnings per share(1) were
$5.49 in 2023. Adjusted diluted earnings per share increased $1.25 compared to 2022 primarily
reflecting earnings on higher sales, including higher margins due to the impact of operational
excellence and cost initiatives, and productivity and efficiency improvements. These factors
were partially offset by higher launch, engineering, and other costs associated with new
assembly business, the negative impact of the UAW labour strikes, the net unfavourable impact
of commercial items, lower amortization of the initial value of public company securities,
higher launch costs associated with new manufacturing business, and the impact of acquisitions,
net of divestitures. |
CASH
& INVESTMENTS
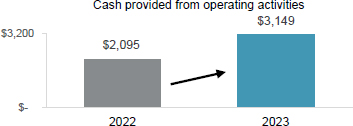
| • | Cash
generated from operating activities was $3.1 billion, compared to $2.1 billion in 2022, largely
reflecting an increase in net income and generation of cash from operating assets and liabilities
in 2023 compared to an investment in operating assets and liabilities in 2022. |
| • | We
continued to invest in our business, including: |
| • | $2.5
billion for fixed assets; |
| • | $562
million in investment and other asset spending; and |
| • | $1.5
billion for acquisitions and business combinations, and public and private equity investments,
including the acquisition of Veoneer AS. |
| • | We
paid dividends of $522 million in 2023. |
| • | Our
Board of Directors increased our quarterly dividend to $0.475 per share, our 14th consecutive
year of dividend increases. |
| • | We raised $2 billion in debt, comprised of Senior Notes and $400 million in a delayed-draw Term
Loan, fund the acquisition of Veoneer AS, invest in megatrend areas, and refinance €550 million in Senior Notes that came due
in 2023. |
STRATEGIC UPDATES
| • |
Active Safety –
we further advanced our position in Active Safety, including: |
| |
•
|
Completing the acquisition
of Veoneer AS, broadening our active safety portfolio with complementary products, customers,
geographies, engineering and software resources; |
|
| |
• |
Launching our innovative, Gen5
front camera module system on a high-volume program for a European-based global OEM, and winning further front camera module volume on the program for an additional region. |
|
| • |
Electrification – we continued to strengthen our business
in electrification, including through: |
| |
• |
Winning two additional integrated
e-drive programs for global OEMs, one based in North America and one in Europe; |
| |
•
|
Launching primary and secondary
e-drives on a battery electric vehicle program for a new customer; |
| |
•
|
Launching a first-to-market
modular eDecoupling unit to support multiple battery electric vehicle programs for |
| |
|
a German premium OEM; |
| |
•
|
Winning
significant new awards for battery enclosures on multiple OEM programs. |
| •
|
Sustainability
– we committed to sustainability and environmental stewardship by submitting net-zero emission targets for validation
by the Science Based Targets initiative, with a goal to achieve this target
by 2050, and meet our near-term Scope 1, 2 and 3 targets by 2030. |
Magna International Inc. Annual Report 2023 1
OVERVIEW
OUR
BUSINESS(2)
Magna
is more than one of the world’s largest suppliers in the automotive space. We are a mobility technology company built to innovate,
with a global, entrepreneurial-minded team of over 179,000(3) employees across 342 manufacturing operations and 104 product
development, engineering and sales centres spanning 28 countries. With 65+ years of expertise, our ecosystem of interconnected products
combined with our complete vehicle expertise uniquely positions us to advance mobility in an expanded transportation landscape. For further
information about Magna (NYSE:MGA; TSX:MG), please visit www.magna.com or follow us on social.
1
Adjusted diluted earnings per share is a Non-GAAP financial measure. Refer to the section “Use of Non-GAAP Measures”.
2
Manufacturing operations, product development, engineering and sales centres include certain operations accounted for under the
equity method.
3
Number of employees includes over 166,000 employees at our wholly owned or controlled entities and over 13,000 employees at operations
accounted for under the equity method.
2 Magna International Inc. Annual Report 2023
FORWARD-LOOKING
STATEMENTS
Certain
statements in this MD&A may constitute “forward-looking information” or “forward-looking statements” (collectively,
“forward-looking statements”). Any such forward-looking statements are intended to provide information about management’s
current expectations and plans and may not be appropriate for other purposes. Forward-looking statements may include financial and other
projections, as well as statements regarding our future plans, strategic objectives or economic performance, or the assumptions underlying
any of the foregoing, and other statements that are not recitations of historical fact. We use words such as “may”, “would”,
“could”, “should”, “will”, “likely”, “expect”, “anticipate”,
“believe”, “intend”, “plan”, “aim”, “forecast”, “outlook”, “project”,
“estimate”, “target” and similar expressions suggesting future outcomes or events to identify forward-looking
statements.
Forward-looking
statements in this document include, but are not limited to, statements relating to achievement of our near term emissions reductions
target and 2050 net zero target.
Forward-looking
statements are based on information currently available to us and are based on assumptions and analyses made by us in light of our experience
and our perception of historical trends, current conditions and expected future developments, as well as other factors we believe are
appropriate in the circumstances. While we believe we have a reasonable basis for making any such forward-looking statements, they are
not a guarantee of future performance or outcomes. Whether actual results and developments conform to our expectations and predictions
is subject to a number of risks, assumptions, and uncertainties, many of which are beyond our control, and the effects of which can be
difficult to predict, including the risk factors which are described later in this MD&A.
INDUSTRY
TRENDS
Our
operating results are primarily dependent on the levels of North American, European, and Chinese car and light truck production by our
customers. While we supply systems and components to every major original equipment manufacturer [“OEM”], we do not supply
systems and components for every vehicle, nor is the value of our content consistent from one vehicle to the next. As a result, customer
and program mix relative to market trends, as well as the value of our content on specific vehicle production programs, are also important
drivers of our results.
Ordinarily,
OEM production volumes are aligned with vehicle sales levels and thus affected by changes in such levels. Aside from vehicle sales levels,
production volumes are typically impacted by a range of factors, including: general economic and political conditions; labour disruptions;
free trade arrangements; tariffs; relative currency values; commodities prices; supply chains and infrastructure; availability and relative
cost of skilled labour; regulatory considerations, including those related to environmental emissions and safety standards; and other
factors.
Overall
vehicle sales levels are significantly affected by changes in consumer confidence levels, which may in turn be impacted by consumer perceptions
and general trends related to the job, housing, and stock markets, as well as other macroeconomic and political factors. Other factors
which typically impact vehicle sales levels and thus production volumes include: vehicle affordability; interest rates and/or availability
of credit; fuel and energy prices; relative currency values; regulatory restrictions on use of vehicles in certain megacities; government
subsidies to consumers for the purchase of low- and zero-emission vehicles; and other factors.
While
the foregoing economic, political, and other factors are part of the general context in which the global automotive industry operates,
there were a number of significant industry trends that impacted us during 2023, including:
| • | elevated
inflation in all markets in which we operate; |
| • | price
increases and surcharges from sub-suppliers impacted by inflationary pressures; |
| • | targeted
labour strikes by UAW members against certain Ford, General Motors and Stellantis facilities
in the U.S.; |
| • | supply
chain disruptions, including continued impact from the global shortage of semiconductor chips
that has materially affected global automotive production volumes since 2020; and |
| • | operational
inefficiencies as a result of our production lines being stopped/restarted unexpectedly. |
We
continue to implement a business strategy which is rooted in our best assessment as to the rate and direction of change in the automotive
industry, including with respect to trends related to vehicle electrification and advanced driver assistance systems, as well as future
mobility business models. Our short and medium-term operational success, as well as our ability to create long-term value through our
business strategy, are subject to a number of risks and uncertainties which are discussed later in this MD&A.
Magna International Inc. Annual Report 2023 3
USE
OF NON-GAAP FINANCIAL MEASURES
In
addition to results presented in accordance with accounting principles generally accepted in the United States of America [“U.S.
GAAP”], this report includes the use of Adjusted earnings before interest and taxes [“Adjusted EBIT”], Adjusted EBIT
as a percentage of sales, Adjusted diluted earnings per share, and Adjusted Return on Invested Capital [collectively, the “Non-GAAP
Measures”]. We believe these Non-GAAP financial measures provide additional information that is useful to investors in understanding
our underlying performance and trends through the same financial measures employed by our management. Readers should be aware that Non-GAAP
Measures have no standardized meaning under U.S. GAAP and accordingly may not be comparable to the calculation of similar measures by
other companies. We believe that Adjusted EBIT, Adjusted EBIT as a percentage of sales, Adjusted diluted earnings per share and Adjusted
Return on Invested Capital provide useful information to our investors for measuring our operational performance as they exclude certain
items that are not reflective of ongoing operating profit and facilitate a comparison with prior periods. The presentation of any Non-GAAP
Measures should not be considered in isolation or as a substitute for our related financial results prepared in accordance with U.S.
GAAP. Non-GAAP financial measures are presented together with the most directly comparable U.S. GAAP financial measure, and a reconciliation
to the most directly comparable U.S. GAAP financial measure, can be found in the “Non-GAAP Financial Measures Reconciliation”
section of this MD&A.
During 2023, we revised our calculations of Adjusted
EBIT, Adjusted diluted earnings per share and Adjusted Return on Invested Capital to exclude the amortization of acquired intangible
assets. The historical presentation of these Non-GAAP measures within this MD&A has also been updated to reflect the revised calculations.
Refer to the “Non-GAAP Financial Measures Reconciliation” section of this MD&A for further information.
RESULTS
OF OPERATIONS
AVERAGE
FOREIGN EXCHANGE
| | |
2023 | | |
2022 | | |
Change | |
| 1 Canadian dollar equals U.S. dollars | |
| 0.742 | | |
| 0.769 | | |
| -4 | % |
| 1 euro equals U.S. dollars | |
| 1.082 | | |
| 1.053 | | |
| +3 | % |
| 1 Chinese renminbi equals U.S. dollars | |
| 0.141 | | |
| 0.149 | | |
| -5 | % |
The
preceding table reflects the average foreign exchange rates between the most common currencies in which we conduct business and our U.S.
dollar reporting currency.
The
results of operations for which the functional currency is not the U.S. dollar are translated into U.S. dollars using the average exchange
rates for the relevant period. Throughout this MD&A, reference is made to the impact of translation of foreign operations on reported
U.S. dollar amounts where relevant.
Our
results can also be affected by the impact of movements in exchange rates on foreign currency transactions (such as raw material purchases
or sales denominated in foreign currencies). However, as a result of hedging programs employed by us, foreign currency transactions in
the current period have not been fully impacted by movements in exchange rates. We record foreign currency transactions at the hedged
rate where applicable.
Finally,
foreign exchange gains and losses on revaluation and/or settlement of monetary items denominated in a currency other than an operation’s
functional currency impact reported results. These gains and losses are recorded in selling, general and administrative expense.
LIGHT
VEHICLE PRODUCTION VOLUMES
Our
operating results are mostly dependent on light vehicle production in the regions reflected in the table below:
Light
Vehicle Production Volumes (thousands of units)
| | |
2023 | | |
2022 | | |
Change | |
| North America | |
| 15,589 | | |
| 14,280 | | |
| +9 | % |
| Europe | |
| 17,481 | | |
| 15,802 | | |
| +11 | % |
| China | |
| 28,581 | | |
| 26,363 | | |
| +8 | % |
| Other | |
| 27,577 | | |
| 26,107 | | |
| +6 | % |
| Global | |
| 89,228 | | |
| 82,552 | | |
| +8 | % |
Global
light vehicle production increased 8% in 2023, largely reflecting the rebalancing of supply chains in 2023 compared to the significant
industry production disruptions during 2022 caused by global semiconductor chip shortages.
4 Magna International Inc. Annual Report 2023
RESULTS
OF OPERATIONS – FOR THE YEAR ENDED DECEMBER 31, 2023
SALES
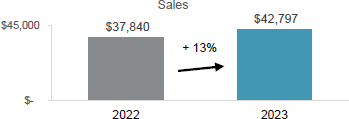
Sales
increased 13% or $4.96 billion to $42.80 billion for 2023 compared to $37.84 billion for 2022 primarily due to:
| • | the
launch of new programs during or subsequent to 2022; |
| • | higher
global light vehicle production; |
| • | acquisitions,
net of divestitures, subsequent to 2022, which increased sales by $814 million; and |
| • | customer
price increases to recover certain higher production input costs. |
These
factors were partially offset by:
| • | the
negative impact of lost vehicle production as a result of the UAW labour strikes at certain
customers during 2023, which decreased sales by approximately $325 million; |
| • | the
net weakening of foreign currencies against the U.S. dollar, which decreased reported U.S.
dollar sales by $91 million; and |
| • | net
customer price concessions subsequent to 2022. |
COST
OF GOODS SOLD
| | |
2023 | | |
2022 | | |
Change | |
| Material | |
$ | 26,309 | | |
$ | 23,388 | | |
$ | 2,921 | |
| Direct labour | |
| 3,164 | | |
| 2,791 | | |
| 373 | |
| Overhead | |
| 7,712 | | |
| 7,009 | | |
| 703 | |
| Cost of goods sold | |
$ | 37,185 | | |
$ | 33,188 | | |
$ | 3,997 | |
Cost
of goods sold increased $4.00 billion to $37.19 billion for 2023 compared to $33.19 billion for 2022, primarily due to:
| • | higher
material, direct labour and overhead associated with higher sales; |
| • | acquisitions,
net of divestitures, subsequent to 2022; |
| • | higher
launch, engineering and other costs associated with new assembly business; |
| • | commercial
items in 2023 and 2022, which had a net unfavourable impact on a year over year basis; |
| • | higher
pre-operating costs incurred at new facilities; and |
| • | higher
net production input costs, including for labour, partially offset by lower prices for energy,
certain commodities and freight. |
These
factors were partially offset by:
| • | productivity
and efficiency improvements, including lower costs at certain previously underperforming
facilities; |
| • | the
net weakening of foreign currencies against the U.S. dollar, which decreased reported U.S.
dollar costs of goods sold by $44 million; and |
| • | the
impact of operational excellence and cost initiatives. |
DEPRECIATION
Depreciation
increased $63 million to $1.44 billion for 2023 compared to $1.37 billion for 2022 primarily due to increased capital deployed at new
and existing facilities to support the launch of programs, and acquisitions, net of divestitures, subsequent to 2022, partially offset
by the end of production of certain programs.
AMORTIZATION
OF ACQUIRED INTANGIBLE ASSETS
Amortization
of acquired intangible assets increased $42 million to $88 million for 2023 compared to $46 million for 2022 primarily due to the acquisition
of Veoneer AS during the second quarter of 2023.
Magna International Inc. Annual Report 2023 5
SELLING,
GENERAL AND ADMINISTRATIVE [“SG&A”]
SG&A
expense increased $390 million to $2.05 billion for 2023 compared to $1.66 billion for 2022, primarily as a result of:
| • | higher
labour and benefit costs; |
| • | commercial
items in 2023 and 2022, which had a net unfavourable impact on a year over year basis; |
| • | acquisitions,
net of divestitures, subsequent to 2022; |
| • | higher
incentive compensation; |
| • | higher
investments in research, development and new mobility; |
| • | higher
restructuring costs; |
| • | higher
costs to accelerate our operational excellence initiatives; and |
| • | higher
pre-operating costs incurred at new facilities. |
These
factors were partially offset by lower provisions against certain accounts receivable and other balances.
INTEREST
EXPENSE, NET
During
2023, we recorded net interest expense of $156 million compared to $81 million for 2022. The $75 million increase was primarily a result
of interest expense on the $1.6 billion of Senior Notes issued during the first quarter of 2023, interest expense on the Term Loan entered
into during the first quarter of 2023, interest expense on higher short-term borrowings and higher interest rates. These factors we partially
offset by higher interest income earned on cash and investments due to higher interest rates.
EQUITY
INCOME
Equity
income increased $23 million to $112 million for 2023 compared to $89 million for 2022, primarily as a result of earnings on higher sales
at certain equity-accounted entities, and acquisitions subsequent to 2022, partially offset by higher launch costs, and higher production
input costs, net of customer recoveries.
OTHER
EXPENSE, NET
| | |
2023 | | |
2022 | |
| Investments (1) | |
$ | 201 | | |
$ | 221 | |
| Restructuring (2) | |
| 148 | | |
| 22 | |
| Veoneer AS transaction costs (3) | |
| 23 | | |
| — | |
| Impairments and loss on sale of operations in Russia (4) | |
| 16 | | |
| 376 | |
| Loss on sale of business (5) | |
| — | | |
| 58 | |
| Impairments (6) | |
| — | | |
| 26 | |
| Other expense, net | |
$ | 388 | | |
$ | 703 | |
| | |
2023 | | |
2022 | |
| Revaluation of public company warrants | |
$ | 110 | | |
$ | 173 | |
| Non-cash impairment charges (i) | |
| 90 | | |
| — | |
| Revaluation of public and private equity investments | |
| 1 | | |
| 49 | |
| Net gain on sale of public equity investments | |
| — | | |
| (1 | ) |
| Other expense, net | |
| 201 | | |
| 221 | |
| Tax effect | |
| (28 | ) | |
| (53 | ) |
| Net loss attributable to Magna | |
$ | 173 | | |
$ | 168 | |
| (i) | The
non-cash impairment charges relate to impairments of private equity investments and related
long-term receivables within Other assets. |
During
2023, we recorded restructuring charges of $117 million [$97 million after tax] in our Power & Vision segment, and $31 million [$27
million after tax] in our Body Exteriors & Structures segment, respectively.
For
the year ended December 31, 2022, we recorded restructuring charges of $22 million [$22 million after tax] in our Power & Vision
segment.
6 Magna International Inc. Annual Report 2023
| (3) | Veoneer
AS transaction costs |
During
2023, we incurred $23 million [$22 million after tax] of transaction costs relating to our acquisition of Veoneer AS. Refer to Note 7,
“Business Combinations”, to the consolidated financial statements included in this Report.
| (4) | Impairments
and loss on sale of operations in Russia |
During
2023, we completed the sale of all of our investments in Russia which resulted in a loss of $16 million [$16 million after tax]
including a net cash outflow of $23 million.
During
2022, we recorded a $376 million [$361 million after tax] impairment charge related to our investment in Russia as a result of the expected
lack of future cashflows and the uncertainties connected with the Russian economy. This included net asset impairments of $173 million
and a $203 million reserve against the related foreign currency translation losses that were included in accumulated other comprehensive
loss. The net asset impairments consisted of $163 million and $10 million in our Body Exteriors & Structures and Seating Systems
segments, respectively.
| (5) | Loss
on sale of business |
During
2022, we entered into an agreement to sell a European Power & Vision operation. Under the terms of the arrangement, we were contractually
obligated to provide the buyer with up to $42 million of funding, resulting in a loss of $58 million [$57 million after tax]. During
the first quarter of 2023, we completed the sales of this operation which resulted in a net cash outflow of $25 million.
During
2022, we recorded impairment charges of $22 million [$21 million after tax] in our Body Exteriors & Structures segment and $4 million
[$3 million after tax] in our Power & Vision segment, respectively.
INCOME
FROM OPERATIONS BEFORE INCOME TAXES
Income
from operations before income taxes was $1.61 billion for 2023 compared to $878 million for 2022. The $728 million increase was a result
of the following changes, each as discussed above:
| | |
2023 | | |
2022 | | |
Change | |
| Sales | |
$ | 42,797 | | |
$ | 37,840 | | |
$ | 4,957 | |
| | |
| | | |
| | | |
| | |
| Costs and expenses | |
| | | |
| | | |
| | |
| Cost of goods sold | |
| 37,185 | | |
| 33,188 | | |
| 3,997 | |
| Depreciation | |
| 1,436 | | |
| 1,373 | | |
| 63 | |
| Amortization of acquired intangible assets | |
| 88 | | |
| 46 | | |
| 42 | |
| Selling, general & administrative | |
| 2,050 | | |
| 1,660 | | |
| 390 | |
| Interest expense, net | |
| 156 | | |
| 81 | | |
| 75 | |
| Equity income | |
| (112 | ) | |
| (89 | ) | |
| (23 | ) |
| Other expense, net | |
| 388 | | |
| 703 | | |
| (315 | ) |
| Income from operations before income taxes | |
$ | 1,606 | | |
$ | 878 | | |
$ | 728 | |
INCOME
TAXES
| | |
2023 | | |
2022 | |
| Income taxes as reported | |
$ | 320 | | |
| 19.9 | % | |
$ | 237 | | |
| 27.0 | % |
| Tax effect on Other expense, net and Amortization of acquired
intangible assets | |
| 70 | | |
| (1.2 | ) | |
| 79 | | |
| (7.6 | ) |
| Adjustments to Deferred Tax Valuation Allowances | |
| 47 | | |
| 2.3 | | |
| 29 | | |
| 1.8 | |
| | |
$ | 437 | | |
| 21.0 | % | |
$ | 345 | | |
| 21.2 | % |
We
released valuation allowances against certain deferred tax assets in South America and North America during 2023 and in Europe during
2022 [“Adjustments to Deferred Tax Valuation Allowances”].
Excluding
the tax effect on Other expense, net and Amortization of acquired intangible assets, as well as the Adjustments to Deferred Tax Valuation
Allowances our effective income tax rate decreased to 21.0% for 2023 compared to 21.2% for 2022 primarily due to lower losses not benefitted
in Europe and higher non-taxable foreign exchange adjustments recognized for U.S. GAAP purposes. These factors were partially offset
by lower favourable changes in our reserves for uncertain tax positions and a change in mix of earnings.
Magna International Inc. Annual Report 2023 7
INCOME ATTRIBUTABLE TO NON-CONTROLLING
INTERESTS
Income attributable to non-controlling interests
was $73 million for 2023 compared to $49 million for 2022. This $24 million increase was primarily due to higher net income at our non-wholly
owned operations in China.
NET INCOME ATTRIBUTABLE TO
MAGNA INTERNATIONAL INC.
Net income attributable to Magna International
Inc. was $1.213 billion for 2023 compared to $592 million for 2022. This $621 million increase was as a result of an increase in income
from operations before income taxes of $728 million partially offset by increases in income taxes and income attributable to non-controlling
interests of $83 million and $24 million, respectively.
EARNINGS PER SHARE
| | |
2023 | | |
2022 | | |
% Change | |
| Earnings per Common Share | |
| |
| Basic | |
$ | 4.24 | | |
$ | 2.04 | | |
| + 108 | % |
| Diluted | |
$ | 4.23 | | |
$ | 2.03 | | |
| +
108 | % |
| Weighted average number of Common Shares outstanding (millions) |
| Basic | |
| 286.2 | | |
| 290.4 | | |
| - 1 | % |
| Diluted | |
| 286.6 | | |
| 291.2 | | |
| -
2 | % |
| Adjusted diluted earnings per share | |
$ | 5.49 | | |
$ | 4.24 | | |
| +
29 | % |
Diluted earnings per share was $4.23 for 2023
compared to $2.03 for 2022. The $2.20 increase was substantially a result of higher net income attributable to Magna International Inc.,
as discussed above, and a decrease in the weighted average number of diluted shares outstanding during 2023. The decrease in the weighted
average number of diluted shares outstanding was primarily due to the purchase and cancellation of Common Shares, during or subsequent
to 2022, pursuant to our normal course issuer bids.
Other expense, net, and the Amortization of acquired
intangible assets, each after tax, and Adjustments to Deferred Tax Valuation Allowances negatively impacted diluted earnings per share
by $1.26 in 2023 and $2.21 in 2022, respectively, as discussed. Adjusted diluted earnings per share, as reconciled in the "Non-GAAP
Financial Measures Reconciliation" section, was $5.49 for 2023 compared to $4.24 for 2022, an increase of $1.25.
8 Magna International Inc. Annual Report 2023
NON-GAAP PERFORMANCE MEASURES
- FOR THE YEAR ENDED DECEMBER 31, 2023
ADJUSTED EBIT AS A PERCENTAGE
OF SALES
The table below shows the change in Magna's Sales
and Adjusted EBIT by segment and the impact each segment's changes have on Magna's Adjusted EBIT as a percentage of sales for 2023 compared
to 2022:
| | |
Sales | | |
Adjusted
EBIT | | |
Adjusted EBIT
as a percentage
of sales | |
| 2022 | |
$ | 37,840 | | |
$ | 1,708 | | |
| 4.5 | % |
| Increase (decrease) related to: | |
| | | |
| | | |
| | |
| Body Exteriors & Structures | |
| 1,507 | | |
| 452 | | |
| + 0.9 | % |
| Power & Vision | |
| 2,444 | | |
| 166 | | |
| + 0.1 | % |
| Seating Systems | |
| 778 | | |
| 114 | | |
| + 0.2 | % |
| Complete Vehicles | |
| 317 | | |
| (111 | ) | |
| - 0.3 | % |
| Corporate and Other | |
| (89 | ) | |
| (91 | ) | |
| -
0.2 | % |
| 2023 | |
$ | 42,797 | | |
$ | 2,238 | | |
| 5.2 | % |
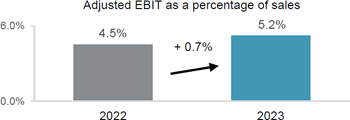
Adjusted EBIT as a percentage of sales increased
to 5.2% for 2023 compared to 4.5% for 2022 primarily due to:
| • | earnings
on higher sales including higher margins as a result of the impact of operational excellence
and cost initiatives; |
| • | productivity
and efficiency improvements, including lower costs at certain previously underperforming
facilities; and |
| • | lower
provisions against certain accounts receivable and other balances. |
These factors were partially offset by:
| • | higher
launch, engineering and other costs associated with new assembly business; |
| • | acquisitions,
net of divestitures, subsequent to 2022; |
| • | commercial
items in 2023 and 2022, which had a net unfavourable impact on a year over year basis; |
| • | the
negative impact of the UAW labour strikes during the third and fourth quarters of 2023; |
| • | higher
launch costs associated with new manufacturing business; |
| • | lower
amortization of the initial value of public company securities; |
| • | higher
pre-operating costs incurred at new facilities; |
| • | lower
scrap steel and aluminum recoveries; and |
| • | higher
investments in research, development and new mobility. |
Magna International Inc. Annual Report 2023 9
ADJUSTED RETURN ON INVESTED
CAPITAL
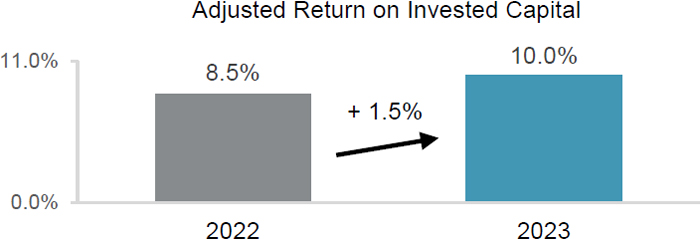
Adjusted Return on Invested Capital increased
to 10.0% for 2023 compared to 8.5% for 2022 as a result of an increase in Adjusted After-tax operating profits partially offset by higher
Average Invested Capital.
Average Invested Capital increased $1.85 billion
to $17.77 billion for 2023 compared to $15.92 billion for 2022, primarily due to:
| • | the
acquisition of Veoneer AS during 2023; |
| • | average
investment in fixed assets in excess of our average depreciation expense on fixed assets;
and |
| • | an
increase in average operating assets and liabilities. |
These factors were partially offset by:
| • | the
impairment of our Russian assets recorded during 2022; |
| • | lower
net investments in public and private equity companies and public company warrants; and |
| • | the
net weakening of foreign currencies against the U.S. dollar. |
10 Magna International Inc. Annual Report 2023
SEGMENT ANALYSIS
We are a global automotive supplier that has
complete vehicle engineering and contract manufacturing expertise, as well as product capabilities which include body, chassis, exterior,
seating, powertrain, active driver assistance, electronics, mechatronics, mirrors, lighting and roof systems. We also have electronic
and software capabilities across many of these areas.
Our reporting segments are: Body Exteriors &
Structures; Power & Vision; Seating Systems; and Complete Vehicles.
| | |
Sales | | |
Adjusted EBIT | |
| | |
2023 | | |
2022 | | |
Change | | |
2023 | | |
2022 | | |
Change | |
| Body Exteriors & Structures | |
$ | 17,511 | | |
$ | 16,004 | | |
$ | 1,507 | | |
$ | 1,304 | | |
$ | 852 | | |
$ | 452 | |
| Power & Vision | |
| 14,305 | | |
| 11,861 | | |
| 2,444 | | |
| 668 | | |
| 502 | | |
| 166 | |
| Seating Systems | |
| 6,047 | | |
| 5,269 | | |
| 778 | | |
| 218 | | |
| 104 | | |
| 114 | |
| Complete Vehicles | |
| 5,538 | | |
| 5,221 | | |
| 317 | | |
| 124 | | |
| 235 | | |
| (111 | ) |
| Corporate and Other | |
| (604 | ) | |
| (515 | ) | |
| (89 | ) | |
| (76 | ) | |
| 15 | | |
| (91 | ) |
| Total reportable segments | |
$ | 42,797 | | |
$ | 37,840 | | |
$ | 4,957 | | |
$ | 2,238 | | |
$ | 1,708 | | |
$ | 530 | |
BODY EXTERIORS & STRUCTURES
| | |
2023 | | |
2022 | | |
Change | |
| Sales | |
$ | 17,511 | | |
$ | 16,004 | | |
$ | 1,507 | | |
| +9 | % |
| Adjusted EBIT | |
$ | 1,304 | | |
$ | 852 | | |
$ | 452 | | |
| +53 | % |
| Adjusted EBIT as a percentage of sales | |
| 7.4 | % | |
| 5.3 | % | |
| | | |
| +2.1 | % |

Sales – Body Exteriors & Structures
Sales increased 9% or $1.51 billion to $17.51
billion for 2023 compared to $16.00 billion for 2022, primarily due to:
| • | the
launch of programs during or subsequent to 2022, including the: |
| • | Ford
F-Series Super Duty; |
| • | higher
global light vehicle production; and |
| • | customer
price increases to recover certain higher production input costs. |
These factors were partially offset by:
| • | the
negative impact of lost vehicle production as a result of the UAW labour strikes at certain
customers during 2023, which decreased sales by approximately $200 million; |
| • | the
net weakening of foreign currencies against the U.S. dollar, which decreased reported U.S.
dollar sales by $99 million; |
| • | lower
sales as a result of the substantial idling of our Russian facilities; and |
| • | net
customer price concessions subsequent to 2022. |
Magna International Inc. Annual Report 2023 11
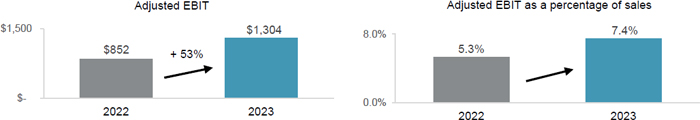
Adjusted EBIT and Adjusted EBIT as a percentage
of sales – Body Exteriors & Structures
Adjusted EBIT increased $452 million to $1,304
million for 2023 compared to $852 million for 2022 and Adjusted EBIT as a percentage of sales increased to 7.4% from 5.3%. These increases
were primarily due to:
| • | earnings
on higher sales including higher margins due to the impact of operational excellence and
cost initiatives; |
| • | productivity
and efficiency improvements, including lower costs at certain previously underperforming
facilities; |
| • | commercial
items in 2023 and 2022, which had a net favourable impact on a year over year basis; and |
| • | lower
provisions against certain accounts receivable and other balances. |
These factors were partially offset by:
| • | the
negative impact of the UAW labour strikes during the third and fourth quarters of 2023; |
| • | higher
restructuring costs; |
| • | higher
pre-operating costs incurred at new facilities; |
| • | lower
scrap steel and aluminum recoveries; and |
| • | the
net weakening of foreign currencies against the U.S. dollar, which had a $19 million unfavourable
impact on reported U.S. dollar Adjusted EBIT. |
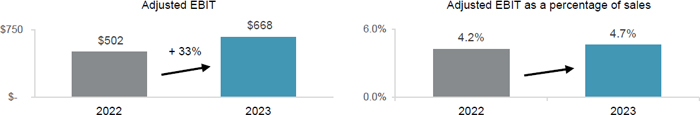
POWER & VISION
| | |
2023 | | |
2022 | | |
Change | |
| Sales | |
$ | 14,305 | | |
$ | 11,861 | | |
$ | 2,444 | | |
| +
21 | % |
| Adjusted EBIT | |
$ | 668 | | |
$ | 502 | | |
$ | 166 | | |
| +
33 | % |
| Adjusted EBIT as a percentage of sales | |
| 4.7 | % | |
| 4.2 | % | |
| | | |
| +
0.5 | % |
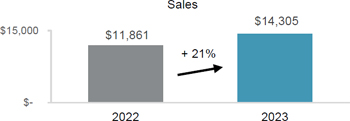
Sales – Power & Vision
Sales increased 21% or $2.44 billion to $14.31
billion for 2023 compared to $11.86 billion for 2022, primarily due to:
| • | the
launch of programs during or subsequent to 2022, including the: |
| • | acquisitions,
net of divestitures, subsequent to 2022, which increased sales by $820 million; |
| • | higher
global light vehicle production; and |
| • | customer
price increases to recover certain higher production input costs. |
12 Magna International Inc. Annual Report 2023
These factors were partially offset by:
| • | the
negative impact of lost vehicle production as a result of the UAW labour strikes at certain
customers during 2023, which decreased sales by approximately $80 million; |
| • | the
net weakening of foreign currencies against the U.S. dollar, which decreased reported U.S.
dollar sales by $47 million; and |
| • | net
customer price concessions subsequent to 2022. |
Adjusted EBIT and Adjusted EBIT as a percentage
of sales – Power & Vision
Adjusted EBIT increased $166 million to $668
million for 2023 compared to $502 million for 2022 and Adjusted EBIT as a percentage of sales increased to 4.7% from 4.2%. These increases
were primarily due to:
| • | earnings
on higher sales including higher margins due to the impact of operational excellence and
cost initiatives; |
| • | customer
recoveries net of higher production input costs, including for certain commodities, energy,
and freight, partially offset by higher prices for labour; |
| • | cost
savings and efficiencies realized, including as a result of restructuring actions taken; |
| • | higher
equity income; and |
| • | lower
net warranty costs of $15 million. |
These factors were partially offset by:
| • | commercial
items in 2023 and 2022, which had a net unfavourable impact on a year over year basis; |
| • | acquisitions,
net of divestitures, subsequent to 2022; |
| • | the
negative impact of the UAW labour strikes during the third and fourth quarters of 2023; and |
| • | the
net weakening of foreign currencies against the U.S. dollar, which had a $20 million unfavourable
impact on reported U.S. dollar Adjusted EBIT. |
SEATING SYSTEMS
| | |
2023 | | |
2022 | | |
Change | |
| Sales | |
$ | 6,047 | | |
$ | 5,269 | | |
$ | 778 | | |
| +
15 | % |
| Adjusted EBIT | |
$ | 218 | | |
$ | 104 | | |
$ | 114 | | |
| +
110 | % |
| Adjusted EBIT as a percentage of sales | |
| 3.6 | % | |
| 2.0 | % | |
| | | |
| +
1.6 | % |
Magna International Inc. Annual Report 2023 13
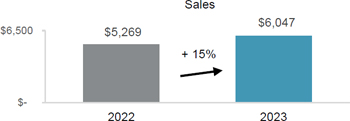
Sales – Seating Systems
Sales increased 15% or $778 million to $6.05
billion for 2023 compared to $5.27 billion for 2022, primarily due to:
| • | the
launch of programs during or subsequent to 2022, including the: |
| • | higher
global light vehicle production; and |
| • | customer
price increases to recover certain higher production input costs. |
These factors were partially offset by:
| • | the
net weakening of foreign currencies against the U.S. dollar, which decreased reported U.S.
dollar sales by $50 million; |
| • | the
negative impact of lost vehicle production as a result of the UAW labour strikes at certain
customers during 2023, which decreased sales by approximately $45 million; and |
| • | net
customer price concessions subsequent to 2022. |
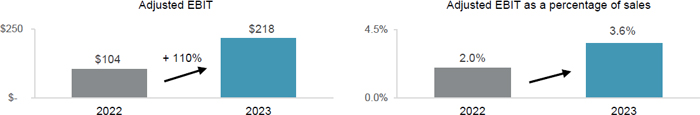
Adjusted EBIT and Adjusted EBIT as a percentage
of sales – Seating Systems
Adjusted EBIT increased $114 million to $218
million for 2023 compared to $104 million for 2022 and Adjusted EBIT as a percentage of sales increased to 3.6% from 2.0%. These increases
were primarily due to:
| • | earnings
on higher sales including higher margins due to the impact of operational excellence and
cost initiatives; |
| • | productivity
and efficiency improvements, including lower costs at certain previously underperforming
facilities; and |
| • | commercial
items in 2023 and 2022, which had a net favourable impact on a year over year basis. |
These factors were partially offset by:
| • | higher
production input costs net of customer recoveries, including for labour and certain commodities; |
| • | the
negative impact of the UAW labour strikes during the third and fourth quarters of 2023; |
| • | higher
net foreign exchange losses, primarily due to the weakening of the Argentine peso against
the U.S. dollar; |
| • | lower
equity income; and |
| • | the
net weakening of foreign currencies against the U.S. dollar, which had a $5 million unfavourable
impact on reported U.S. dollar Adjusted EBIT. |
14 Magna International Inc. Annual Report 2023
COMPLETE VEHICLES
| | |
2023 | | |
2022 | | |
Change | |
| Complete
Vehicle Assembly Volumes (thousands of units)(i) | |
| 105.1 | | |
| 112.2 | | |
| (7.1 | ) | |
| -
6 | % |
| Sales | |
$ | 5,538 | | |
$ | 5,221 | | |
$ | 317 | | |
| +
6 | % |
| Adjusted EBIT | |
$ | 124 | | |
$ | 235 | | |
$ | (111 | ) | |
| -
47 | % |
| Adjusted EBIT as a percentage of sales | |
| 2.2 | % | |
| 4.5 | % | |
| | | |
| -
2.3 | % |
| (i) | Vehicles produced at our Complete Vehicle
operations are included in Europe Light Vehicle Production volumes. |
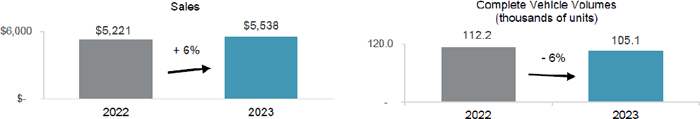
Sales – Complete Vehicles
Sales increased 6% or $317 million to $5.54 billion
for 2023 compared to $5.22 billion for 2022. The increase in sales was primarily due to favourable program mix and a $109 million increase
in reported U.S. dollar sales as a result of the strengthening of the euro against the U.S. dollar partially offset by lower assembly
volumes, including the end of production of the BMW 5-Series.
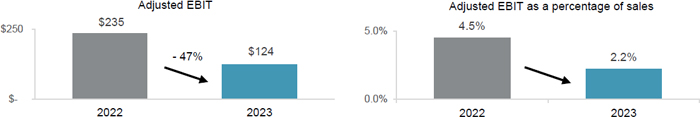
Adjusted EBIT and Adjusted EBIT as a percentage
of sales – Complete Vehicles
Adjusted EBIT decreased $111 million to $124
million for 2023 compared to $235 million for 2022 and Adjusted EBIT as a percentage of sales decreased to 2.2% from 4.5%. These decreases
were primarily due to:
| • | higher
launch, engineering and other costs associated with new assembly business; |
| • | commercial
items in 2023 and 2022, which had a net unfavourable impact on a year over year basis; and |
| • | lower
earnings on lower assembly volumes, net of contractual fixed cost recoveries on certain programs. |
These factors were partially offset by higher earnings due to favourable
program mix.
CORPORATE AND OTHER
Adjusted EBIT was a loss of $76 million for 2023
compared to income of $15 million for 2022. The $91 million decrease was primarily the result of:
| • | lower
amortization of the initial value of public company securities; |
| • | higher
incentive and stock-based compensation; |
| • | higher
investments in research, development and new mobility; |
| • | higher
labour and benefit costs; and |
| • | higher
costs to accelerate our operational excellence initiatives. |
These factors were partially offset by an increase
in fees received from our divisions and net transactional foreign exchange gains in 2023 compared to net transactional foreign exchange
losses in 2022.
Magna International Inc. Annual Report 2023 15
FINANCIAL
CONDITION, LIQUIDITY AND CAPITAL RESOURCES
OPERATING
ACTIVITIES
| | |
2023 | | |
2022 | | |
Change | |
| Net income | |
$ | 1,286 | | |
$ | 641 | | |
| | |
| Items not involving current cash flows | |
| 1,642 | | |
| 1,776 | | |
| | |
| | |
| 2,928 | | |
| 2,417 | | |
$ | 511 | |
| Changes in operating assets and liabilities | |
| 221 | | |
| (322 | ) | |
| 543 | |
| Cash provided from operating activities | |
$ | 3,149 | | |
$ | 2,095 | | |
$ | 1,054 | |
Cash
provided from operating activities
Comparing
2023 to 2022, cash provided from operating activities increased $1.05 billion primarily as a result of:
| • | a
$4.98 billion increase in cash received from customers; |
| • | higher
dividends received from equity investments of $84 million; and |
| • | a
$28 million decrease in cash taxes. |
These
factors were partially offset by:
| • | a
$2.84 billion increase in cash paid for materials and overhead; |
| • | a
$1.08 billion increase in cash paid for labour; and |
| • | a
$75 million increase in cash interest paid. |
Changes
in operating assets and liabilities
During
2023, we generated $221 million from operating assets and liabilities primarily consisting of:
| • | a
$637 million increase in other accrued liabilities; and |
| • | a
$501 million increase in accounts payable. |
These
factors were partially offset by:
| • | a
$687 million increase in production and other receivables; and |
| • | a
$246 million increase in tooling investment for current and upcoming program launches. |
16 Magna International Inc. Annual Report 2023
INVESTING
ACTIVITIES
| | |
2023 | | |
2022 | | |
Change | |
| Fixed asset additions | |
$ | (2,500 | ) | |
$ | (1,681 | ) | |
| | |
| Increase in investments, other assets and intangible assets | |
| (562 | ) | |
| (455 | ) | |
| | |
| Increase in public and private equity investments | |
| (11 | ) | |
| (29 | ) | |
| | |
| Fixed assets, investments, other assets and intangible assets additions | |
| (3,073 | ) | |
| (2,165 | ) | |
| | |
| Proceeds from dispositions | |
| 122 | | |
| 124 | | |
| | |
| Net cash (outflow) inflow from disposal of facilities | |
| (48 | ) | |
| 6 | | |
| | |
| Acquisitions | |
| (1,504 | ) | |
| (3 | ) | |
| | |
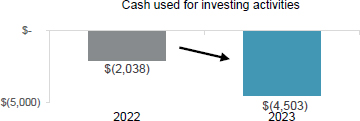
| Cash used for investing activities | |
$ | (4,503 | ) | |
$ | (2,038 | ) | |
$ | (2,465 | ) |
Cash
used for investing activities in 2023 was $2.47 billion higher compared to 2022. The change between 2023 and 2022 was primarily due to
the acquisition of Veoneer AS and a $908 million increase in cash used for fixed assets and other assets.
During
the fourth quarter of 2022, we entered into an agreement to sell a European Power & Vision operation in early 2023. During the first
quarter of 2023, we completed the sale of this operation which resulted in a net cash outflow of $25 million.
In
addition, during the third quarter of 2023, we completed the sale of all of our investments in Russia resulting in a net cash outflow
of $23 million.
FINANCING
ACTIVITIES
| | |
2023 | | |
2022 | | |
Change | |
| Issues of debt | |
$ | 2,083 | | |
$ | 54 | | |
| | |
| Increase in short-term borrowings | |
| 487 | | |
| 11 | | |
| | |
| Issue of Common Shares on exercise of stock options | |
| 20 | | |
| 8 | | |
| | |
| Contributions to subsidiaries by non-controlling interests | |
| 11 | | |
| 5 | | |
| | |
| Tax withholdings on vesting of equity awards | |
| (11 | ) | |
| (15 | ) | |
| | |
| Repurchase of Common Shares | |
| (13 | ) | |
| (780 | ) | |
| | |
| Dividends paid to non-controlling interest | |
| (74 | ) | |
| (46 | ) | |
| | |
| Dividends paid | |
| (522 | ) | |
| (514 | ) | |
| | |
| Repayments of debt | |
| (644 | ) | |
| (456 | ) | |
| | |
| Cash provided from (used for) financing activities | |
$ | 1,337 | | |
$ | (1,733 | ) | |
$ | 3,070 | |
During
the first quarter of 2023, we issued the following Senior Notes [the “Senior Notes”]:
| | |
| |
Amount in USD at | |
|
| | |
Issuance Date | |
Issuance Date | |
Maturity Date |
| Cdn$350 million Senior Notes at 4.950% | |
March 10, 2023 | |
$258 million | |
January 31, 2031 |
| €550 million Senior Notes at 4.375% | |
March 17, 2023 | |
$591 million | |
March 17, 2032 |
| $300 million Senior Notes at 5.980% | |
March 21, 2023 | |
$300 million | |
March 21, 2026 |
| $500 million Senior Notes at 5.500% | |
March 21, 2023 | |
$500 million | |
March 21, 2033 |
The
total cash proceeds received from the Senior Note issuances was $1,637 million, which consisted of $1,649 million of Senior Notes less
debt issuance costs of $12 million.
The
Senior Notes are unsecured obligations and do not include any financial covenants. We may redeem the Senior Notes in whole or in part
at any time, and from time to time, at specified redemption prices determined in accordance with the terms of the indenture governing
the Senior Notes. Refer to Note 16, “Debt” of our audited consolidated financial statements for the
year ended December 31, 2023.
Magna International Inc. Annual Report 2023 17
On
March 6, 2023, we entered into a syndicated, unsecured, delayed draw term loan [the “Term Loan”] with a 3-year tranche of
$800 million and 5-year tranche of $600 million. During the second quarter of 2023, we drew $100 million from the 3-year tranche and
$300 million from the 5-year tranche of the Term Loan. The amounts are drawn in advances of 1,3 or 6-month loans and may be rolled over
until the end of the 3- and 5-year terms. The remaining balance of the facility was subsequently cancelled.
Short-term
borrowings increased $487 million in 2023 primarily due to the issuance of Commercial Paper.
Cash
dividends paid per Common Share were $1.84 for 2023 compared to $1.80 for 2022.
FINANCING
RESOURCES
| | |
2023 | | |
2022 | | |
Change | |
| Liabilities | |
| | |
| | |
| |
| Short-term borrowings | |
$ | 511 | | |
$ | 8 | | |
| | |
| Long-term debt due within one year | |
| 819 | | |
| 654 | | |
| | |
| Current portion of operating lease liabilities | |
| 399 | | |
| 276 | | |
| | |
| Long-term debt | |
| 4,175 | | |
| 2,847 | | |
| | |
| Operating lease liabilities | |
| 1,319 | | |
| 1,288 | | |
| | |
| | |
$ | 7,223 | | |
$ | 5,073 | | |
$ | 2,150 | |
Financial
liabilities increased $2.15 billion to $7.22 billion as at December 31, 2023 primarily as a result of the $1.64 billion issuance of Senior
Notes during the first quarter of 2023, a $400 million increase in the Term Loan, and the issuance of $509 million of commercial paper
in the fourth quarter of 2023. These increases were offset by a $569 million repayment of Senior Notes.
CASH
RESOURCES
In
2023, our cash resources remain unchanged at $1.2 billion, primarily as a result of cash provided from operating and financing activities
being offset by cash used for investing activities, as discussed above. In addition to our cash resources at December 31, 2023, we had
term and operating lines of credit totaling $4.1 billion, of which $3.0 billion was unused and available.
On
March 6, 2023, we entered into a Term Loan with a 3-year tranche of $800 million and a 5-year tranche of $600 million. During the second
quarter of 2023, we drew $100 million from the 3-year tranche and $300 million from the 5-year tranche. The remaining balance of the facility
was subsequently cancelled.
On
April 27, 2023, we amended our $2.7 billion syndicated revolving credit facility, including to: (i) extend the maturity date from June
24, 2027 to June 24, 2028, and (ii) cancel the $150 million Asian tranche and allocate the equivalent amount to the Canadian tranche.
As of December 31, 2023, we have had limited borrowing under this credit facility.
On
May 26, 2023, we extended the maturity date of our $800 million 364-day syndicated revolving credit facility from June 24, 2023 to June
24, 2024. As of December 31, 2023, we have not borrowed any funds under this credit facility.
MAXIMUM
NUMBER OF SHARES ISSUABLE
The
following table presents the maximum number of shares that would be outstanding if all of the outstanding options at February 22, 2024
were exercised:
| Common Shares | |
| 286,866,376 | |
| Stock options (i) | |
| 5,572,829 | |
| | |
| 292,439,205 | |
| (i) | Options
to purchase Common Shares are exercisable by the holder in accordance with the vesting provisions
and upon payment of the exercise price as may be determined from time to time pursuant to
our stock option plans.
|
18 Magna International Inc. Annual Report 2023
CONTRACTUAL
OBLIGATIONS
A
purchase obligation is defined as an agreement to purchase goods or services that is enforceable and legally binding on us and that specifies
all significant terms, including: fixed or minimum quantities to be purchased; fixed, minimum or variable price provisions; and the approximate
timing of the transaction. Consistent with our customer obligations, substantially all of our purchases are made under purchase orders
with our suppliers which are requirements based and accordingly do not specify minimum quantities. Other long-term liabilities are defined
as long-term liabilities that are recorded on our consolidated balance sheet. Based on this definition, the following table includes
only those contracts which include fixed or minimum obligations.
At
December 31, 2023, we had contractual obligations requiring annual payments as follows:
| | |
2024 | | |
2025-
2026 | | |
2027-
2028 | | |
Thereafter | | |
Total | |
| Operating leases | |
$ | 326 | | |
$ | 535 | | |
$ | 401 | | |
$ | 779 | | |
$ | 2,041 | |
| Long-term debt | |
| 819 | | |
| 1,101 | | |
| 967 | | |
| 2,125 | | |
| 5,012 | |
| Unconditional purchase obligations: | |
| | | |
| | | |
| | | |
| | | |
| | |
| Materials and services | |
| 5,151 | | |
| 576 | | |
| 424 | | |
| 45 | | |
| 6,196 | |
| Capital | |
| 1,011 | | |
| 199 | | |
| 63 | | |
| 12 | | |
| 1,285 | |
| Total contractual obligations | |
$ | 7,307 | | |
$ | 2,411 | | |
$ | 1,855 | | |
$ | 2,961 | | |
$ | 14,534 | |
Our
unfunded obligation with respect to employee future benefit plans, which have been actuarially determined, was $550 million at December
31, 2023. These obligations are as follows:
| | |
Pension
Liability | | |
Retirement
Liability | | |
Termination and
Long Service Arrangements | | |
Total | |
| Projected benefit obligation | |
$ | 511 | | |
$ | 21 | | |
$ | 445 | | |
$ | 977 | |
| Less plan assets | |
| (427 | ) | |
| — | | |
| — | | |
| (427 | ) |
| Unfunded amount | |
$ | 84 | | |
$ | 21 | | |
$ | 445 | | |
$ | 550 | |
Foreign
Currency Activities
Our
North American operations negotiate sales contracts with OEMs for payment in U.S. dollars, Canadian dollars and Mexican pesos. Materials
and equipment are purchased in various currencies depending upon competitive factors, including relative currency values. Our North American
operations use labour and materials which are paid for in U.S. dollars, Canadian dollars and Mexican pesos. Our Mexican operations generally
use the U.S. dollar as the functional currency.
Our
European operations negotiate sales contracts with OEMs for payment principally in euros. Our European operations’ material, equipment
and labour are paid for principally in euros and U.S. dollars.
Our
Asian operations negotiate sales contracts with OEMs for payment principally in Chinese renminbi. Our Asian operations’ material,
equipment and labour are paid for principally in Chinese renminbi.
We
employ hedging programs, primarily through the use of foreign exchange forward contracts, in an effort to manage our foreign exchange
exposure, which arises when manufacturing facilities have committed to the delivery of products for which the selling price or material
purchases have been quoted in foreign currencies and for labour in countries where the local currency is not the divisions’ functional
currency. These commitments represent our contractual obligations to deliver products over the duration of the product programs, which
can last a number of years. The amount and timing of the forward contracts will be dependent upon a number of factors, including anticipated
production delivery schedules and anticipated production costs, which may be paid in the foreign currency. Despite these measures, significant
long-term fluctuations in relative currency values, in particular a significant change in the relative values of the U.S. dollar, Canadian
dollar, euro, Chinese renminbi or Mexican peso, could have an adverse effect on our profitability and financial condition (as discussed
throughout this MD&A).
Magna International Inc. Annual Report 2023 19
NON-GAAP
FINANCIAL MEASURES RECONCILIATION
During
2023, we revised our calculations of Adjusted EBIT, Adjusted diluted earnings per share and Adjusted Return on Invested Capital to exclude
the amortization of acquired intangible assets. Revenue generated from acquired intangible assets is included within revenue in determining
net income attributable to Magna. We believe that excluding the amortization of acquired intangible assets from these Non-GAAP measures
helps management and investors in understanding our underlying performance and improves comparability between our segmented results of
operations and our peers.
The
historical presentation of these Non-GAAP measures within this MD&A has also been updated to reflect the revised calculations.
The
reconciliation of Non-GAAP financial measures is as follows:
ADJUSTED
EBIT
| | |
2023 | | |
2022 | |
| Net income | |
$ | 1,286 | | |
$ | 641 | |
| Add : | |
| | | |
| | |
| Amortization of acquired intangible assets | |
| 88 | | |
| 46 | |
| Interest expense, net | |
| 156 | | |
| 81 | |
| Other expense, net | |
| 388 | | |
| 703 | |
| Income taxes | |
| 320 | | |
| 237 | |
| Adjusted EBIT | |
$ | 2,238 | | |
$ | 1,708 | |
ADJUSTED
EBIT AS A PERCENTAGE OF SALES
| | |
2023 | | |
2022 | |
| Sales | |
$ | 42,797 | | |
$ | 37,840 | |
| Adjusted EBIT | |
$ | 2,238 | | |
$ | 1,708 | |
| Adjusted EBIT as a percentage of sales | |
| 5.2 | % | |
| 4.5 | % |
ADJUSTED
DILUTED EARNINGS PER SHARE
| | |
2023 | | |
2022 | |
| Net
income attributable to Magna International Inc. | |
$ | 1,213 | | |
$ | 592 | |
| Add
(deduct): | |
| | | |
| | |
| Amortization
of acquired intangible assets | |
| 88 | | |
| 46 | |
| Other
expense, net | |
| 388 | | |
| 703 | |
| Tax
effect on Amortization of acquired intangible assets and Other expense, net | |
| (70 | ) | |
| (79 | ) |
| Adjustments
to Deferred Tax Valuation Allowances | |
| (47 | ) | |
| (29 | ) |
| Adjusted
net income attributable to Magna International Inc. | |
$ | 1,572 | | |
$ | 1,233 | |
| Diluted
weighted average number of Common Shares outstanding during the period (millions) | |
| 286.6 | | |
| 291.2 | |
| Adjusted
diluted earnings per share | |
$ | 5.49 | | |
$ | 4.24 | |
20 Magna International Inc. Annual Report 2023
ADJUSTED
RETURN ON INVESTED CAPITAL
Adjusted
Return on Invested Capital is calculated as Adjusted After-tax operating profits divided by Average Invested Capital for the period.
Average Invested Capital for the twelve month period is averaged on a five-fiscal quarter basis.
| | |
2023 | | |
2022 | |
| Net Income | |
$ | 1,286 | | |
$ | 641 | |
| Add (deduct): | |
| | | |
| | |
| Interest expense, net | |
| 156 | | |
| 81 | |
| Amortization of acquired intangible assets | |
| 88 | | |
| 46 | |
| Other expense, net | |
| 388 | | |
| 703 | |
| Tax effect on Interest expense, net, Amortization of acquired
intangible assets and Other expense, net | |
| (102 | ) | |
| (96 | ) |
| Adjustments to Deferred Tax Valuation
Allowances | |
| (47 | ) | |
| (29 | ) |
| Adjusted After-tax operating profits | |
$ | 1,769 | | |
$ | 1,346 | |
| | |
2023 | | |
2022 | |
| Total Assets | |
$ | 32,255 | | |
$ | 27,789 | |
| Excluding: | |
| | | |
| | |
| Cash and cash equivalents | |
| (1,198 | ) | |
| (1,234 | ) |
| Deferred tax assets | |
| (621 | ) | |
| (491 | ) |
| Less Current Liabilities | |
| (13,234 | ) | |
| (10,998 | ) |
| Excluding: | |
| | | |
| | |
| Short-term borrowing | |
| 511 | | |
| 8 | |
| Long-term debt due within one year | |
| 819 | | |
| 654 | |
| Current portion of operating lease liabilities | |
| 399 | | |
| 276 | |
| Invested Capital | |
$ | 18,931 | | |
$ | 16,004 | |
| | |
2023 | | |
2022 | |
| Adjusted After-tax operating profits | |
$ | 1,769 | | |
$ | 1,346 | |
| Average Invested Capital | |
$ | 17,771 | | |
$ | 15,924 | |
| Adjusted Return on Invested Capital | |
| 10.0 | % | |
| 8.5 | % |
Magna International Inc. Annual Report 2023 21
SIGNIFICANT ACCOUNTING POLICIES
AND CRITICAL ACCOUNTING ESTIMATES
Our significant accounting policies are more
fully described in Note 2, “Significant Accounting Policies”, to the consolidated financial statements included in this Report.
The preparation of the audited consolidated financial statements requires management to make estimates and assumptions that affect the
reported amounts of assets, liabilities, revenues and expenses and the related disclosure of contingent assets and liabilities, as of
the date of the consolidated financial statements. These estimates and assumptions are based on our historical experience, and various
other assumptions we believe to be reasonable in the circumstances. Since these estimates and assumptions are subject to an inherent
degree of uncertainty, actual results in these areas may differ significantly from our estimates.
We believe the following critical accounting
policies and estimates affect the more subjective or complex judgements and estimates used in the preparation of our consolidated financial
statements and accompanying notes. Management has discussed the development and selection of the following critical accounting policies
with the Audit Committee of the Board of Directors, and the Audit Committee has reviewed our disclosure relating to critical accounting
policies in this MD&A.
business combinations
We allocate the purchase price of an acquired
business to its identifiable assets and liabilities based on estimated fair values at the date of the acquisition. The excess of the
purchase price over the amount allocated to the assets and liabilities, if any, is recorded as goodwill.
Our purchase price allocation methodology contains
uncertainties because it requires management to make assumptions and to apply judgement to estimate the fair value of assets acquired
and liabilities assumed. When determining the fair values of assets acquired and liabilities assumed, management makes significant estimates
and assumptions and engages outside appraisal firms to assist in the fair value determination of identifiable intangible assets and any
other significant assets or liabilities. We adjust the preliminary purchase price allocation, as necessary, up to one year after acquisition
closing date as we obtain more information regarding assets acquired and liabilities assumed.
Unanticipated events or circumstances may occur
which could affect the accuracy of our fair value estimates, including assumptions regarding industry economic factors and business strategies.
Accordingly, there can be no assurance that the estimates, assumptions, and values reflected in the valuations will be realized, and
actual results could vary.
revenue recognition - complete
vehicle assembly arrangements
Our complete vehicle assembly contracts with
customers are complex and often include promises to transfer multiple products and services, some of which may be implicitly contracted.
Each good or service is evaluated to determine whether it represents a distinct performance obligation, and whether it should be characterized
as revenue or as a reimbursement of costs incurred. The total transaction price is then allocated to the distinct performance obligations
based on the expected cost plus a margin approach and recognized as revenue.
Significant interpretation and judgment is sometimes
required to determine the appropriate accounting for these contracts including: (i) combining contracts that may impact the allocation
of the transaction price between products and services; (ii) determining whether performance obligations are considered distinct and
are required to be accounted for separately or combined; and (iii) the allocation of the transaction price to each distinct performance
obligation and determining when to recognize revenue.
Impairment Assessments –
goodwilL, long-lived assetS, AND EQUITY METHOD INVESTMENTS
We review goodwill at the reporting unit level
for impairment in the fourth quarter of each year or more frequently if events or changes in circumstances indicate that goodwill might
be impaired. Goodwill impairment is assessed by comparing the fair value of a reporting unit to the underlying carrying value of the
reporting unit’s net assets, including goodwill. If a reporting unit’s carrying amount exceeds its fair value, an impairment
is recognized based on that difference. The fair value of a reporting unit is determined using the estimated discounted future cash flows
of the reporting unit.
In addition to our review of goodwill, we evaluate
fixed assets and other long-lived assets for impairment whenever indicators of impairment exist. Indicators of impairment include the
bankruptcy of a significant customer or the early termination, loss, renegotiation of the terms of, significant volume decrease in, or
delay in the implementation of, any significant production contract. If the sum of the future cash flows expected to result from the
asset, undiscounted and without interest charges, is less than the carrying amount of the asset, an asset impairment may be recognized
in the consolidated financial statements. The amount of impairment to be recognized is calculated by subtracting the fair value of the
asset from the carrying amount of the asset.
22 Magna International Inc. Annual Report 2023
As of December 31, 2023, we had equity method
investments of $987 million. We monitor our investments for indicators of other-than-temporary declines in value on an ongoing basis
in accordance with U.S. GAAP. If we determine that an other-than-temporary decline in value has occurred, we recognize an impairment
loss, which is measured as the difference between the book value and the fair value of the investment.
We believe that the impairment assessments for
goodwill, long-lived assets, and equity method investments contain “critical accounting estimates” because: (i) they are
subject to significant measurement uncertainty and are susceptible to change as management is required to make forward-looking assumptions
regarding the impact of improvement plans on current operations, in-sourcing and other new business opportunities, program pricing and
cost assumptions on current and future business, the timing of new program launches and future forecasted production volumes; and (ii)
any resulting impairment loss could have a material impact on our consolidated net income and on the amount of assets reported in our
consolidated balance sheet.
Warranty
We record product warranty costs, which include
product liability and recall costs. Under most customer agreements, we only account for existing or probable claims on product default
issues when amounts related to such issues are probable and reasonably estimable. Under certain complete vehicle assembly, powertrain
systems, and electronics contracts, we record an estimate of future warranty-related costs based on the terms of the specific customer
agreements and/or the Company’s warranty experience.
Product liability and recall provisions are established
based on our best estimate of the amounts necessary to settle existing claims. These estimates typically require assumptions from management
regarding: the number of units that may be returned; the cost of the product being replaced; labour to remove and replace the defective
part; and the customer’s administrative costs relating to the recall. In making this estimate, judgement is also required as to
the ultimate negotiated sharing of the cost between us, the customer and, in some cases a supplier. Where applicable, insurance recoveries
related to such provisions are also recorded.
We monitor warranty activity on an ongoing basis
and revise our best estimate as necessary. Due to the uncertainty and potential volatility of the factors contributing to developing
estimates of the amounts necessary to settle existing claims, actual product liability costs could be materially different from our best
estimate.
Income Taxes
The determination of our tax liabilities involves
dealing with uncertainties in the application of complex tax laws. Significant judgement and estimates are required in determining our
provision for income taxes, deferred tax assets and liabilities, and liabilities for unrecognized tax benefits. We recognize tax benefits
from uncertain tax positions only if it is more likely than not that the tax position will be sustained on examination by the taxing
authorities, based on the technical merits of the position. The tax benefits recognized in the financial statements from such positions
are then measured based on the largest benefit that has a greater than 50% likelihood of being realized upon ultimate settlement.
At December 31, 2023, we had gross unrecognized
tax benefits of $220 million excluding interest and penalties, of which $188 million, if recognized, would affect our effective tax rate.
The gross unrecognized tax benefits differ from the amount that would affect our effective tax rate due primarily to the impact of the
valuation allowances on deferred tax assets.
Deferred tax assets and liabilities are recognized
for the estimated future tax effects attributable to temporary differences between financial statement carrying value of existing assets
and liabilities and their respective tax bases and tax loss and credit carryforwards. Deferred tax assets and liabilities are measured
using the enacted tax rates and laws that will be in effect when the differences are expected to reverse. Accounting standards require
that we assess whether valuation allowances should be established or maintained against our deferred income tax assets, based on consideration
of all available evidence, using a “more-likely-than-not” standard. The factors used to assess the likelihood of realization
are: history of losses, forecasts of future pre-tax income and tax planning strategies that could be implemented to realize the deferred
tax assets. On a quarterly basis, we evaluate the realizability of deferred tax assets by assessing our valuation allowances and by adjusting
the amount of such allowances as necessary. We use tax planning strategies to realize deferred tax assets in order to avoid the potential
loss of these tax benefits. Changes in our estimates, due to unforeseen events or otherwise, could have a material impact on our financial
condition and results of operations. Refer to Note 12, “Income Taxes” of the notes to the consolidated financial statements
for additional information.
Employee Future Benefit Plans
The determination of the obligation and expense
for defined benefit pension, termination and long service arrangements and other post-retirement benefits, such as retiree healthcare
and medical benefits, is dependent on the selection of certain assumptions used by actuaries in calculating such amounts. Those assumptions
include, among others, the discount rate, expected long-term rate of return on plan assets and rates of increase in compensation costs.
Actual results that differ from the assumptions used are accumulated and amortized over future periods and therefore impact the recognized
expense in future periods. Significant changes in assumptions or significant plan amendments could materially affect our future employee
benefit obligations and future expense.
Magna International Inc. Annual Report 2023 23
At December 31, 2023, we had past service costs
and actuarial experience losses of $116 million included in accumulated other comprehensive income that will be amortized to future employee
benefit expense over the expected average remaining service life of employees or over the expected average life expectancy of retired
employees, depending on the status of the plan.
COMMITMENTS AND CONTINGENCIES
From time to time, we may be contingently liable
for litigation, legal and/or regulatory actions and proceedings and other claims. Refer to Note 23, “Contingencies” of our
audited consolidated financial statements for the year ended December 31, 2023.
For a discussion of risk factors relating to
legal and other claims/actions against us, refer to “Item 5. Risk Factors” in our Annual Information Form and Annual Report
on Form 40-F, each in respect of the year ended December 31, 2023.
CONTROLS AND PROCEDURES
Disclosure Controls and Procedures
Disclosure controls and procedures (as defined
in Rules 13a-15(e) and 15d-15(e) under the Securities Exchange Act of 1934, as amended [the “Exchange Act”]), are designed
to ensure that material information required to be disclosed in reports filed or submitted under the Exchange Act is recorded, processed,
summarized and reported on a timely basis, and that such information is accumulated and communicated to senior management, including
the Company’s Chief Executive Officer and Chief Financial Officer, as appropriate, to enable them to make timely decisions regarding
required disclosure of such information. We have conducted an evaluation of our disclosure controls and procedures as of December 31,
2023, under the supervision, and with the participation of our Chief Executive Officer and our Chief Financial Officer. Based on this
evaluation, our Chief Executive Officer and our Chief Financial Officer have concluded that our disclosure controls and procedures (as
this term is defined in the rules adopted by Canadian securities regulatory authorities and the United States Securities and Exchange
Commission [“SEC”]) are effective as of December 31, 2023.
Management’s Annual Report
on Internal Control over Financial Reporting
Internal control over financial reporting is
a process designed to provide reasonable, but not absolute, assurance regarding the reliability of financial reporting and preparation
of financial statements for external purposes in accordance with U.S. GAAP. Our management is responsible for establishing and maintaining
adequate internal control over financial reporting. Due to its inherent limitations, internal control over financial reporting may not
prevent or detect misstatements on a timely basis. Additionally, projections of any evaluation of the effectiveness of internal control
over financial reporting to future periods are subject to the risk that the controls may become inadequate because of changes in conditions,
or that the degree of compliance with the policies or procedures may deteriorate. Our management used the Committee of Sponsoring Organizations
of the Treadway Commission [“COSO”] Internal Control-Integrated Framework (2013) to evaluate the effectiveness of internal
control over financial reporting.
On June 1, 2023, we completed the acquisition
of 100% of the common shares of Veoneer AS. As permitted by securities rules and regulations, we have excluded Veoneer AS from our evaluation
of internal controls over financial reporting as of December 31, 2023. The excluded Veoneer AS assets constituted 4% of our total assets
as of December 31, 2023, and 2% of our sales for the year then ended.
Based on this evaluation, our Chief Executive
Officer and our Chief Financial Officer have assessed the effectiveness of our internal control over financial reporting and concluded
that, as at December 31, 2023, such internal control over financial reporting is effective. The Company’s internal control over
financial reporting as of December 31, 2023, has been audited by Deloitte LLP, an Independent Registered Public Accounting Firm, who
also audited the Company’s consolidated financial statements for the year ended December 31, 2023. Deloitte LLP expressed an unqualified
opinion on the effectiveness of the Company’s internal control over financial reporting. This report precedes our audited consolidated
financial statements for the year ended December 31, 2023.
Changes in Internal Controls
over Financial Reporting
Other than the addition of Veoneer AS operations
to our internal control over financial reporting, there have been no changes in our internal controls over financial reporting that occurred
during 2023 that have materially affected or are reasonably likely to materially affect, our internal control over financial reporting.
We are currently integrating Veoneer AS into our operations, compliance programs, and internal control process.
24 Magna International Inc. Annual Report 2023
RISK FACTORS
Our short and medium-term operational success,
as well as our ability to create long-term value through our business strategy, are subject to risks and uncertainties. The following
are the more significant risks:
Macroeconomic, geopolitical
and other risks
| • | Inflationary Pressures: We continue
to experience elevated inflation in all markets in which we operate, with higher commodity,
energy, labour, freight, and other production input pricing expected to persist in 2024.
While many of these input price increases will moderate over time, the increases in wage
levels we are currently experiencing are likely to have a longer-term effect on our cost
structure. Additionally, we may continue to experience price increases or surcharges from
sub-suppliers in connection with the inflationary pressures they face. The inability to offset
inflationary price increases, including through recoveries from our customers, modifications
to our products, continuous improvement actions or otherwise, could have a material adverse
effect on our profitability. |
| • | Interest Rates: Increasing global
inflation rates have spurred a cycle of monetary policy tightening, including through central
bank increases to key short term lending rates. The availability and cost of credit are both
factors affecting consumer confidence, which is a critical driver of vehicle sales and thus
automotive production. A material, sustained decrease in consumer demand for vehicles could
result in further reductions to vehicle production from levels assumed in our business plan,
which could have a material adverse effect on our profitability and financial condition.
Higher interest rates will have an adverse effect on our borrowing costs and, if prolonged,
could have an adverse effect on our profitability. |
| • | Geopolitical Risks: The occurrence
of geopolitical crises, including from the current military conflicts in Ukraine and Gaza,
could create a number of risks, including: disruption of energy supplies (particularly natural
gas and oil), shipping/transportation and logistics, vehicle production and/or supply chains;
weakening economic growth and consumer confidence; increasing physical or cybersecurity threats;
and/or worsening other risks described elsewhere in these Risk Factors, such as inflationary
pressures, commodity prices, relative foreign exchange rates and risks of doing business
in foreign markets. An expansion or worsening of existing geopolitical crises, or the occurrence
of significant new geopolitical risks, could have a material adverse effect on our business
and operations. |
RISKS RELATED TO THE AUTOMOTIVE
INDUSTRY
| • | Economic Cyclicality: Ordinarily,
the global automotive industry is cyclical, with potential for regional differences in the
timing of expansion and contraction of economic cycles. In normal industry cycles, lower
consumer confidence typically translates to lower vehicle sales and production volumes. Examples
of factors which often reduce consumer confidence include: worsening economic, political,
and other conditions; military conflict; increasing inflation (particularly fuel and energy
prices); and rising interest rates. A significant decline in vehicle production volumes from
levels assumed in our business plan could have a material adverse effect on our profitability
and financial condition. |
| • | Regional Production Volume Declines:
North America, Europe and China are key automotive producing regions for us, and our
operating results are primarily dependent on car and light truck production by our customers
in these regions. A significant or sustained decline in vehicle production volumes in any
or all these geographic regions could have a material adverse effect on our operations, sales,
and profitability. |
| • | Deteriorating Vehicle Affordability:
Vehicle affordability to consumers is becoming more challenged due to a combination of
factors, including: higher prices for electric vehicles; costs related to advanced electronic
systems; increasing vehicle finance costs due to rising interest rates; inflationary cost
increases impacting the entire bill of materials for a vehicle; and, in some cases, limited
vehicle supply. A material, sustained decrease in consumer demand for vehicles due to deteriorating
vehicle affordability could result in reductions to vehicle production from levels assumed
in our business plan, which could have a material adverse effect on our profitability and
financial condition. |
| • | Misalignment Between EV Production
and Sales: The automotive industry is transitioning from vehicles powered by internal
combustion engines (“ICE”) to electric vehicles (“EVs”), resulting
in significant, industry-wide capital investment in EV-related production capacity. At the
same time, there remains some uncertainty as to consumer acceptance of EVs due to issues
such as: vehicle affordability; availability of government subsidies; concerns regarding
evolving battery technologies; anxiety regarding driving range; adequacy of charging infrastructure;
the proliferation of new, EV-focused OEMs and/or new EV models with little or no operating
and warranty history; and other factors. Although the number of EVs sold globally is growing,
the rate of growth has moderated in some markets, with a misalignment between EV production/supply
and consumer demand for certain models. If planned production volumes for EV programs do
not materialize, we may not be able to recover our capital investments related to such programs,
or to recover such investments within the timeframes contemplated. |
Magna International Inc. Annual Report 2023 25
| • | Intense Competition: The automotive
supply industry is highly competitive and becoming more so. Some of our competitors have
higher or more rapidly growing market share than we do in certain product or geographic markets.
Additionally, a number of established electronics, semiconductor chip and contract manufacturing
companies have entered or expanded their presence in the automotive industry. At the same
time, disruptive technology innovators have been introducing novel product and service solutions
which traditional automotive suppliers may not be able to match. Failure to successfully
compete with existing or new competitors, including failure to grow our electronics and/or
EV content at or above the industry rates of growth for such products, could affect our ability
to fully implement our corporate strategy. |
STRATEGIC RISKS
| • | Alignment With “Car of
the Future”: The success of our corporate strategy is correlated in part
to our ability to evolve our product mix based on alignment with the global megatrends defining
the “Car of the Future.” Accordingly, we seek to grow our business and capabilities
in areas which are positively impacted by megatrends related to vehicle electrification,
autonomy, new mobility, and connectivity. Examples of such product areas include powertrain
electrification, advanced driver assistance systems (ADAS) and battery enclosures. Some systems
in our product portfolio are negatively impacted by the foregoing megatrends, including manual
transmissions, mechanical all-wheel drive/four-wheel drive systems and fuel tank systems.
The failure to grow our megatrend-aligned product areas at or above the industry rates of
growth for such products could have a material adverse effect on our profitability and financial
condition. |
| • | Evolving Business Risk Profile:
The risk profile of our business continues to evolve with the increasing importance to us
of product areas such as battery enclosures, electrified powertrains, ADAS and electronics,
as well as new mobility business models. With this continuing evolution, we may face new
or heightened risks, including: forecasting, planning and capital allocation risks due to
uncertainties regarding the shift from ICE to EV production volumes, take-rates for ADAS
systems and/or features offered to consumers as optional items; reduction in demand for certain
products which are unique to ICE vehicles; challenges in quoting for profitable returns on
products with leading-edge technologies and/or new service models for which we may not have
significant quoting experience; rigorous testing and validation requirements from OEM customers
for complex new products; increased warranty and recall risks on new products and leading-edge
technologies; increased product liability risks; heightened risk of technological obsolescence
of some of our products, processes and/or assets; and difficulties in attracting or retaining
employees with critical skills in high-demand areas. Realization of one or more such risks
could have a material adverse effect on our operations, profitability, or financial condition. |
| • | Technology and Innovation: While
we continue to invest in technology and innovation which we believe will be critical to our
long-term growth, the automotive industry is experiencing significant electrical, electronic,
and software-driven change and disruption. Our ability to anticipate changes in technology
and to successfully develop and introduce new and enhanced products and/or manufacturing
processes on a timely basis will be significant factors in our ability to remain competitive.
Additionally, our success is dependent on our ability to attract, develop and retain employees
with the required technical and/or software skills. If we are unsuccessful or are less successful
than our competitors in consistently developing innovative products and/or processes, we
may be placed at a competitive disadvantage in bidding for new business and may not be able
to recover some or all our engineering, research, and development costs, which could have
a material adverse effect on our profitability and financial condition and ability to fully
implement our corporate strategy. |
| • | Investments in Mobility and Technology
Companies: In addition to our development activities, we have invested in various mobility
and technology companies, as well as funds that invest in such companies. Such investments
are an important element of our long-term strategy, and we may make further investments in
such companies. However, investing in such companies involves a high degree of risk, including
the potential loss of some or all our investment value. There is currently no public market
for the shares or units of some of these investments and, as a result, we may be unable to
monetize such investments in the future. In some cases, we have shares or share purchase
warrants with technology-driven suppliers or OEMs with which we have commercial supply relations;
while the value of such equity may be affected by the commercial prospects of such programs,
our ability to exit our investments may be impaired by the existence of our commercial supply
relationship. Investments in companies or funds which are currently or subsequently become
publicly traded are “marked-to-market” quarterly, which may result in us recording
unrealized gains or losses in any given quarter. The realization of any of the foregoing
investment-related risks could have an adverse effect on our profitability and financial
condition. |
CUSTOMER-RELATED RISKS
| • | Customer Concentration: Although
we supply parts to all the leading OEMs, a significant majority of our sales are to six customers:
General Motors, BMW, Stellantis, Daimler, Ford, and Volkswagen. In light of the amount of
business we currently have with these six customers, our opportunities for incremental growth
with them may be limited. Additionally, growth rates of OEMs differ by region and segment,
with significant growth by some EV-focused OEMs in certain markets. Shifts in market share
away from our top customers could have a material adverse effect on our profitability to
the extent we are unable to offset such lost sales with sufficient sales growth with alternative
OEMs. |
26 Magna International Inc. Annual Report 2023
| • | Growth of EV-Focused OEMs: A number
of EV-focused OEMs, including Tesla, BYD, Changan, Fisker, Geely, Nio, Rivian, SAIC, and
VinFast, have emerged in recent years. While BYD and Tesla have become established global
OEMs, it remains too early to predict which of the other EV-focused OEMs will succeed globally.
Some of the China-based, EV-focused OEMs, such as BYD and Geely, are entering the European
market with vehicles exported from China, while VinFast has entered both the European and
North American markets with vehicles exported from Vietnam. Vehicle electrification is an
important component of our strategy, including through product areas such as electric drive
systems and battery enclosures, as well as services such as complete vehicle engineering
and contract vehicle manufacturing. While we are targeting growth with some of the newer
EV-focused OEMs, we do not have relations with all, nor are such relationships as well established
as those with our traditional customers. The failure to sufficiently grow our sales to those
EV-focused OEMs which achieve significant commercial success could adversely impact our long-term
strategy. At the same time, the failure of newer EV-focused OEMs to which we supply systems
or vehicles to achieve their sales projections could adversely impact the success of our
customer diversification and electrified product strategies, as well as create counterparty
risks described below. |
| • | Risks of Conducting Business with Fisker
and Other Newer EV-Focused OEMs: Conducting business with newer EV-focused OEMs, such
as Fisker, continues to alter the risk profile of our business and poses incremental risks
and challenges compared to our traditional customers, including as a result of: their relatively
short operating histories; limited financial, liquidity/capital or other resources; less
mature product development and validation processes; uncertain market acceptance of their
products/services; and untested business models. These factors may elevate our counterparty
risks in dealing with such OEMs, particularly with respect to recovery of: pre-production
(including tooling, engineering, and launch) and production receivables; inventory; fixed
assets and capitalized pre-production expenditures; as well as other third party obligations
related to such items. As at December 31, 2023, our balance sheet exposure related to these
factors was approximately $600 million, the majority of which related to Fisker. Additionally
in the case of Fisker, we hold share purchase warrants which are “marked-to-market”
quarterly, resulting in us recording unrealized gains or losses in any given quarter. The
inability of Fisker or other newer EV-focused OEMs to achieve commercial success, or the
bankruptcy or insolvency of Fisker or any such other OEM with which we conduct business,
could have a material adverse effect on our profitability and financial condition. |
| • | Dependence on Outsourcing: We depend
on outsourcing by OEMs, including the outsourcing of complete vehicle assembly to our contract
vehicle manufacturing business. The extent of such outsourcing is dependent on a number of
factors, including: the cost, quality, and timeliness of outsourced production relative to
in-house production by an OEM; the degree of unutilized capacity at an OEM’s facilities;
and collective bargaining agreements and labour relations between OEMs and labour unions.
Currently, OEMs in Europe and China have excess vehicle assembly capacity. Additionally,
since EVs have fewer components than vehicles with internal combustion engines, some OEMs
may insource production of certain components or systems to maintain employment levels committed
to in collective bargaining agreements and/or in connection with government incentives. A
reduction in outsourcing by OEMs, or the loss of any material production or assembly programs
combined with the failure to secure alternative programs with sufficient volumes and margins,
could have a material adverse effect on our profitability. |
| • | Customer Cooperation and Consolidation:
Competing OEMs have cooperated and collaborated in different ways to save costs, including
through: joint purchasing activities; platform sharing; powertrain sharing; joint R&D;
and regional joint ventures. Additionally, the automotive industry has experienced OEM consolidation,
with the last material example being the merger of Fiat Chrysler Automobiles and PSA Group
in 2021. While OEM cooperation and consolidation may present opportunities, they also present
a risk that we could lose future business or experience even greater pricing pressure on
certain production programs, either of which could have an adverse effect on our profitability. |
| • | Market Shifts: While we supply
parts for a wide variety of vehicles produced globally, we do not supply parts for all vehicles
produced, nor is the number or value of parts evenly distributed among the vehicles for which
we do supply parts. Shifts in market shares away from vehicles on which we have significant
content, as well as vehicle segments in which our sales may be more heavily concentrated,
could have a material adverse effect on our profitability. |
| • | Consumer Take Rate Shifts: Shifts
in consumer preferences may impact “take rates” for certain types of products
we sell. Examples of such products include: all-wheel drive systems; power liftgates; active
aerodynamics systems; ADAS; and complete vehicles with certain option packages or option
choices. Where shifts in consumer preferences result in higher “take rates” for
products that we do not sell or for products we sell at a lower margin, our profitability
may be adversely affected. |
| • | Customer Purchase Orders: Contracts
from our customers consist of blanket purchase orders which generally provide for the supply
of a customer’s annual requirements rather than a specific quantity of products and
can be terminated by a customer at any time. We may have various pre-production, tooling,
engineering, and other costs which cannot be recovered from our customers if a purchase order
is terminated and/or if forecast production volumes fail to materialize. The failure to recover
such costs could have an adverse effect on our profitability. |
| • | Potential OEM Production-Related Disruptions:
Any significant OEM production disruptions, including as a result of labour unrest at
customer or sub-supplier facilities, would lead to disruptions to our production, which could
have a material adverse effect on our sales, and profitability. |
Magna International Inc. Annual Report 2023 27
SUPPLY CHAIN RISKS
| • | Semiconductor Chip Supply Disruptions
and Price Increases: A global shortage of semiconductor chips for use in automotive applications
has had a material adverse effect on global automotive production volumes since 2020 and
may continue having some impact in 2024. In response to semiconductor chip shortages, OEMs
may continue to take actions such as: unplanned shutdowns of production lines and/or plants;
reductions in their vehicle production plans; and changes to their product mix. Such OEM
responses can result in a number of direct and indirect consequences for Tier 1 suppliers
like Magna, including: lower sales; significant production inefficiencies resulting from
our production lines being stopped/restarted unexpectedly when OEMs allocate scarce chips
to specific production programs; higher inventory levels; premium freight costs to expedite
shipments; other unrecoverable costs and charges, including from sub-suppliers which have
been adversely affected by higher chip prices and/or production inefficiencies; and increased
challenges in retaining employees through production disruptions. Although supplies of semiconductor
chips are significantly better than in the last two years, it remains unclear when supply
and demand for automotive semiconductor chips will fully rebalance. A worsening or prolongation
of the semiconductor chip shortage could have a material adverse effect on our operations,
sales, and profitability. |
| • | Supply Chain Disruptions: In addition
to the global shortage of semiconductor chips for automotive applications, OEMs and Tier
1 automotive suppliers may also experience supply disruptions or constraints on other critical
manufacturing inputs, for a number of different reasons, including: government regulation
or intervention; geopolitical and/or military conflict; interruption of shipping or other
transportation routes; natural catastrophes; labour disruptions; and pandemics. Supply chain
disruptions which prevent us from timely supplying products to our customers could result
in a range of potential adverse consequences, including: unrecoverable price increases; elevated,
unrecoverable costs such as those for premium freight or re-sourcing of supply; penalties
or business interruption claims by our customers; loss of future business; and reputational
damage. The impacts of prolonged supply chain disruptions or constraints could have a material
adverse effect on our operations and profitability. |
| • | Regional Energy Supply and Pricing:
Regional energy supplies have from time to time been disrupted due to geopolitical and
military conflict, supply/demand imbalances, government regulation, severe weather events,
and challenges related to the transition to renewable energy generation. Unforeseen supply
disruptions, demand spikes, prolonged energy disruptions and/or significant energy price
increases could have a material adverse effect on our operations and profitability. |
| • | Supply Base Condition: We rely
on a number of suppliers to supply us with a wide range of components required in connection
with our business. The financial health of automotive suppliers is impacted by a number of
factors, including economic conditions and production volumes. A significant worsening of
economic conditions or reduction in production volumes could deteriorate the financial condition
of our supply base, which could lead to, among other things: disruptions in the supply of
critical components to us or our customers; and/or temporary shutdowns of one of our production
lines or the production lines of one of our customers; all of which could have a material
adverse effect on our profitability. |
MANUFACTURING / OPERATIONAL
RISKS
| • | Product Launch: The launch of production
is a complex process, the success of which depends on a wide range of factors, including:
the timing and frequency of design changes by our customers relative to start of production;
product maturity and complexity; production readiness of our own, as well as our customers’
and suppliers’ manufacturing facilities; robustness of manufacturing and validation
processes; launch volumes; quality and production readiness of tooling and equipment; sufficiency
of skilled employees; and initial product quality. Failure by us to successfully launch a
new product or complete vehicle could result in commercial or litigation claims against us
which could have a material adverse effect on our profitability. Additionally, a significant
product or program launch failure could adversely affect our reputation and/or ability to
execute our strategy. |
| • | Operational Underperformance: From
time to time, we may have operating divisions which are not performing at expected levels
of profitability. The size and complexity of automotive manufacturing operations often makes
it difficult to achieve a quick turnaround of underperforming divisions. Significant underperformance
in our operating divisions could have a material adverse effect on our profitability and
operations. |
| • | Restructuring Costs: We may sell
some product lines and/or downsize, close, or sell some of our operating divisions. By taking
such actions, we may incur restructuring, downsizing and/or other significant non-recurring
costs. These costs may be higher in some countries than others and could have a material
adverse effect on our profitability. |
| • | Impairments: We have recorded significant
impairment charges related to equity interests in joint ventures, goodwill, and long-lived
assets in the past and may do so again in the future. The occurrence of any of a number of
potential scenarios could result in indicators of impairment, including: the early termination,
loss, renegotiation of the terms of, or delay in the implementation of, any significant production
contract; the technological obsolescence of any of our products or production assets; production
volumes that are lower than expected; and the insolvency of a customer. In conducting our
impairment analysis, we make forward-looking assumptions regarding: the impact of turnaround
plans on underperforming operations; new business opportunities; program price and cost assumptions
on current and future business; the timing and success of new program launches; and forecast
production volumes. To the extent such forward-looking assumptions are not met, any resulting
impairment loss could have a material adverse effect on our profitability. |
28 Magna International Inc. Annual Report 2023
| • | Skilled Labour Attraction/Retention:
Our business is based on successfully attracting, developing, and retaining employees
at all levels of the company from “shopfloor” to Executive Management. The markets
for highly skilled workers, as well as talented professionals and leaders in our industry
are extremely competitive, particularly in the major global automotive and technology centres
in which many of our operations are located. The inability to meet our needs for skilled
workers and talented professionals and leaders, whether through recruitment or internal training
and development activities could impact our ability to profitably conduct business and/or
effectively implement our strategy. |
| • | Leadership Expertise and Succession:
Effective succession planning programs and practices are a critical element of our overall
talent management strategy. We experienced a significant number of planned retirements in
the last few years and may experience similar waves in future years. As a result of such
retirements, we have multiple senior leaders recently appointed to roles at a time of significant
macroeconomic, geopolitical, industry and other disruptions discussed elsewhere in these
Risk Factors. While we believe that our leadership development and succession program has
been effective in facilitating leadership transitions to date, our ability to profitably
conduct business and/or successfully implement our strategy could be impacted by the failure
to: identify, train, develop and support high-performing leaders; ensure effective knowledge
transfers from transitioning leaders to successors; and/or otherwise promote organizational
robustness and resilience through leadership transitions in critical roles. |
PRICING RISKS
| • | Quote/Pricing Assumptions: The
time between award of new production business and start of production typically ranges between
two and four years. Since product pricing is typically determined at the time of award, we
are subject to significant pricing risk due to changes in input costs and quote assumptions
from the time of award through the start of production. This risk is elevated in a rising
inflation environment, particularly with respect to wages, energy, and commodities. The inability
to quote effectively, or the occurrence of a material change in input cost or other quote
assumptions between program award and production, could have a material adverse effect on
our profitability. |
| • | Customer Pricing Pressure/Contractual
Arrangements: We face ongoing pricing pressure from OEMs, including through: quoting
pre-requirements; long-term supply agreements with mutually agreed price reductions over
the life of the agreement; non-contractual annual price concession demands; pressure to absorb
costs related to product design, engineering and tooling, and/or amortize such costs through
the piece price for the product; pressure to assume incremental warranty costs; and OEM refusal
to fully offset inflationary price increases. OEMs possess significant leverage over their
suppliers due to their purchasing power and the highly competitive nature of the automotive
supply industry. As a result of the broad portfolio of parts we supply to our six largest
OEM customers, such customers may be able to exert greater leverage over us as compared to
our competitors. We attempt to offset price concessions and costs in a number of ways, including
through commercial negotiations with our customers, improved operating efficiencies and cost
reduction efforts. Our inability to fully offset price concessions, absorb design, engineering,
and tooling costs, and/or fully recover such costs over the life of production, could have
a material adverse effect on our profitability. Moreover, while we attempt to negotiate contractual
terms with our suppliers that align with the contractual terms between us and our OEM customers,
we may not always be successful in doing so. Any such gaps between our customer and supplier
contract terms could, in certain circumstances, have an adverse effect on our profitability. |
| • | Commodity Price Volatility: Prices
for certain key raw materials and commodities used in our parts, including steel, aluminum,
and resin, can be volatile. In some cases, our risk is mitigated because we purchase steel
or aluminum under customer resale programs. Where such commodity purchases are not made under
customer resale programs, we seek to offset commodity price increases by: passing such increases
to our customers; engineering products with reduced commodity content; implementing hedging
strategies; or otherwise. To the extent we are unable to offset commodity price increases,
such additional commodity costs could have an adverse effect on our profitability. |
| • | Scrap Steel/Aluminum Price Volatility:
Some of our manufacturing facilities generate a significant amount of engineered scrap
steel and/or aluminum in their manufacturing processes but recover some of the value through
the sale of such scrap. Scrap steel and scrap aluminum prices can also be volatile and do
not necessarily move in the same direction as steel or aluminum prices. Declines in scrap
steel/aluminum prices from time to time could have an adverse effect on our profitability. |
WARRANTY / RECALL RISKS
| • | Repair/Replacement Costs: We are
responsible for repair and replacement costs of defective products we supply to our customers.
Certain of our products, such as transmissions and battery enclosures, typically have a higher
unit and labour service cost in the event of replacement. Other products, such as cameras,
radars and side door latches, are supplied in multiples of two or four for a single vehicle,
which could result in significant cost in the event all need to be replaced. OEMs and/or
government regulators can initiate recalls of safety or regulated products, which could place
us at risk for the costs of the administrative costs of the recall in addition to the repair/replacement
costs of defective products, even in situations where we dispute the need for a recall or
the responsibility for any alleged defect. The obligation to repair or replace defective
products could have a material adverse effect on our operations and profitability. To the
extent such obligation arises as a result of a product recall, we may face reputational damage,
and the combination of administrative and repair/replacement costs could have a material
adverse effect on our profitability. |
Magna International Inc. Annual Report 2023 29
| • | Warranty Provisions: In certain
circumstances, we are at risk for warranty, product liability and recall costs. We are currently
experiencing increased customer pressure to assume greater warranty responsibility. Certain
customers seek to impose partial responsibility for warranty costs where the underlying root
cause of a product or system failure cannot be determined, or where the root cause is disputed,
as in the case of a warranty claim disclosed in the Contingencies note of our consolidated
financial statements. Warranty provisions for our products are based on our best estimate
of the amounts necessary to settle existing or probable claims related to product defects.
Warranty claims which exceed warranty provisions could have a material adverse effect on
our profitability. In addition, warranty provisions for our powertrain systems, electronics
and complete vehicle programs are also established based on our or our customers’ warranty
experience with the applicable type of product and, in some cases, the terms in the applicable
customer agreements. Actual warranty experience which results in costs that exceed our warranty
provisions, could have a material adverse effect on our profitability. |
| • | Product Liability: We cannot guarantee
that the design, engineering, testing, validation, and manufacturing measures we employ to
ensure high-quality products will be completely effective, particularly as electronic content
and product complexity increases and/or as we enter newer product areas such as e-Drives
or ADAS. If our products fail to perform as expected or as required by governmental regulations,
and/or to the extent any such failure results in, or is alleged to result in, bodily injury
and/or property damage or other losses, our customers or government regulators may initiate
a product recall of such products and/or third party product liability claims may be brought
against us. The defense of product liability claims, particularly class action claims in
North America, may be costly and judgements against us could impair our reputation and have
a material adverse effect on our profitability. |
CLIMATE CHANGE RISKS
| • | Transition Risks and Physical Risks:
Our Sustainability Report, which is appended to our current Annual Information Form /
Annual Report on Form 40-F, contains a detailed discussion of transitional and physical climate
change risks, along with our efforts to mitigate them. Readers are encouraged to review such
climate risk disclosures. |
| • | Strategic and Other Risks: A number
of the risk factors discussed above contain detailed discussion of strategic and other risks
related to the evolution of the automotive industry and our business within the context of
the transition to electromobility, including: Alignment with Car of the Future; Technology
and Innovation; Evolving Business Risk Profile; Growth of EV-Focused OEMs; and Risks of Conducting
Business with Fisker and Other Newer EV-Focused OEMs. Readers are encouraged to review this
entire Risk Factors section in its entirety. |
IT SECURITY / CYBERSECURITY RISKS
| • | IT/Cybersecurity Breach: Although
we have established and continue to enhance security controls intended to protect our IT
systems and infrastructure, there is no guarantee that such security measures will be effective
in preventing unauthorized physical access or cyber-attacks. A significant breach of our
IT systems could: result in theft of funds; cause disruptions in our manufacturing operations;
lead to the loss, destruction, or inappropriate use of sensitive data, including employees’
personal data; or result in theft of our, our customers’ or our suppliers’ intellectual
property or confidential information. The occurrence of any of the foregoing could adversely
affect our operations and/or reputation and could lead to claims against us that could have
a material adverse effect on our profitability. |
| • | Product Cybersecurity: The risk
of vehicle cyber-attacks has risen with the proliferation of technology designed to connect
vehicles to external networks. Although vehicle and systems-level cybersecurity controls
and protections are typically managed and/or specified by our OEM customers, we cannot provide
assurance that such controls and protections will be effective in preventing cyber intrusion
through one of our products. Furthermore, an OEM customer may still seek to hold us financially
responsible, even where the OEM specified the cybersecurity controls and protections. Any
such cyber intrusion could cause reputational damage and lead to claims against us that have
an adverse effect on our profitability. |
ACQUISITION RISKS
| • | Inherent Merger and Acquisition Risks:
Acquisitions are subject to a range of inherent risks, including the assumption of incremental
regulatory/compliance, pricing, supply chain, commodities, labour relations, litigation,
environmental, pensions, warranty, recall, IT, tax, or other risks. While due diligence on
an acquisition target is intended to mitigate such risks, these efforts may not always prove
to be sufficient in identifying all risks and liabilities related to the acquisition, including
as a result of: limited access to information; time constraints for conducting due diligence;
inability to access target company facilities and/or personnel; or other limitations in the
due diligence process. Additionally, we may identify risks and liabilities that we are not
able to sufficiently mitigate through appropriate contractual indemnities or other protections.
The realization of any such risks could have a material adverse effect on our profitability. |
| • | Acquisition Integration and Synergies:
We may not be able to successfully integrate or achieve anticipated synergies from our
acquisitions and/or such acquisitions may be dilutive in the short to medium term. Either
of these outcomes could have a material adverse effect on our profitability. |
30 Magna International Inc. Annual Report 2023
OTHER BUSINESS RISKS
| • | Joint Ventures: We conduct certain
of our operations through joint ventures under contractual arrangements under which we share
management responsibilities with our joint venture partners. Joint venture operations carry
a range of risks, including those relating to: failure of our joint venture partner(s) to
satisfy contractual obligations; potential conflicts between us and our joint venture partner(s);
strategic objectives of joint venture partners that may differ from our own; potential delays
in decision-making; a limited ability to implement some or all of our policies, practices
and controls, or to control legal and regulatory compliance, within the joint venture(s);
and other risks inherent to non-wholly-owned operations. The likelihood of such occurrences
and their potential effect on us vary depending on the joint venture arrangement, however,
the occurrence of any such risks could have an adverse effect on our operations, profitability,
and reputation. |
| • | Intellectual Property: We own intellectual
property that is important to our business and product portfolio. Our intellectual property
is an important factor in protecting our innovation activities and maintaining our competitive
advantage. From time to time, our intellectual property rights may be challenged, including
through the assertion of intellectual property infringement claims which could result in
us: being prevented from selling certain products; having to license the infringed product/technology;
and/or incurring monetary damages. The foregoing consequences could have an adverse effect
on our sales, profitability, and ability to fully implement our corporate strategy. |
| • | Risks of Doing Business in Foreign
Markets: Conducting business in markets outside our traditional markets of North America
and Europe carries a number of potential risks, including those relating to: political, civil
and economic instability and uncertainty; military conflict; corruption risks; high inflation
and our ability to recover inflation-related cost increases; trade, customs and tax risks;
potential sanctions and export control risk; expropriation risks; currency exchange rates;
currency controls; limitations on the repatriation of funds; insufficient infrastructure;
competition to attract and retain qualified employees; and other risks associated with conducting
business internationally. Expansion of our business in China is an element of our long-term
strategy and, as a result, our exposure to the risks described above may be greater in the
future. The likelihood of such occurrences and their potential effect on us vary from country
to country and are unpredictable, however, the occurrence of any such risks could have an
adverse effect on our operations, profitability, and financial condition. |
| • | Relative Foreign Exchange Rates:
Our profitability is affected by movements of our U.S. dollar reporting currency against
the Canadian dollar, the euro, the Chinese renminbi, and other currencies in which we generate
revenues and incur expenses. Significant long-term fluctuations in relative currency values,
in particular a significant change in the relative values of the U.S. dollar, Canadian dollar,
euro, or Chinese renminbi, could have an adverse effect on our profitability and financial
condition and any sustained change in such relative currency values could adversely impact
our competitiveness in certain geographic regions. |
| • | Currency Devaluation in Argentina:
Our sales in Argentina are generally paid to us in Argentine pesos. We import certain materials needed to generate these sales, and are
contractually obligated to pay in U.S. dollars or other foreign currencies for such materials. The Argentine peso has experienced significant
devaluation recently, including a loss of over 50% of its value relative to the U.S. dollar in December 2023 alone. Foreign exchange controls
imposed by the Government of Argentina have restricted our ability to easily exchange Argentine pesos for U.S. dollars and other foreign
currencies, increasing our exposure to foreign denominated payables. As a result, our profitability may be adversely affected by the impact
of further devaluation of the Argentine peso relative to foreign currencies. |
| • | Returns on Capital Investments:
In recent years, we have invested significant amounts of money in our business through capital
expenditures to support new facilities, expansion of existing facilities, purchases of production
equipment and acquisitions. We expect continued elevated capital expenditures in 2024 to
support program awards and our continued growth, including in megatrend areas. Returns achieved
on such investments in the past are not necessarily indicative of the returns we may achieve
on future investments and our inability to achieve returns on future investments which equal
or exceed returns on past investments could have a material adverse effect on our level of
profitability. |
| • | Financial Flexibility: The occurrence
of an economic shock not contemplated in our business plan, a rapid deterioration of conditions
or a prolonged recession could result in the depletion of our cash resources, which could
have a material adverse effect on our operations and financial condition. |
| • | Credit Ratings Changes: There is
no assurance that any credit rating currently assigned to us will remain in effect for any
period of time or that any rating will not be revised or withdrawn entirely by a rating agency
in the future. A downgrade in the credit ratings assigned to us by one or more agencies could
increase our cost of borrowing or impact our ability to negotiate loans, which could have
an adverse effect on our profitability, financial condition, and the trading price of our
Common Shares. |
| • | Stock Price Fluctuation: Trading
prices of our Common Shares cannot be predicted and may fluctuate significantly due to a
variety of factors, many of which are outside our control. |
Magna International Inc. Annual Report 2023 31
LEGAL, REGULATORY AND OTHER RISKS
| • | Legal and Regulatory Proceedings:
From time to time, we may become involved in regulatory proceedings, or become liable for
legal, contractual, and other claims by various parties, including customers, suppliers,
former employees, class action plaintiffs and others. Depending on the nature or duration
of any potential proceedings or claims, we may incur substantial costs and expenses, be required
to devote significant management time and resources to the matters and suffer reputational
damage as a result of regulatory proceedings. On an ongoing basis, we attempt to assess the
likelihood of any adverse judgements or outcomes to these proceedings or claims, although
it is difficult to predict final outcomes with any degree of certainty. Except as disclosed
from time to time in our consolidated financial statements and/or our MD&A, we do not
believe that any of the proceedings or claims to which we are currently a party will have
a material adverse effect on our profitability; however, we cannot provide any assurance
to this effect. |
| • | Changes in Laws: A significant
change in the current regulatory environment in our principal markets, including changes
in tax laws, laws related to vehicle emissions, and other laws which impose additional costs
on automotive manufacturers or consumers, could have an adverse effect on our profitability.
More than 135 jurisdictions have agreed to implement a new global minimum tax regime (“Pillar
Two”) based on model rules published by the Organization for Economic Co-operation
and Development. The proposed Pillar Two rules are intended to ensure that large multinational
enterprises pay a minimum tax of 15% on the income arising in each jurisdiction in which
they operate. Although the impact on Magna will depend on how each jurisdiction implements
the model rules, as well as profitability and local tax liabilities of Magna’s operations
in those jurisdictions, we do not believe that the proposed Pillar Two rules will have a
material adverse effect; however, we cannot provide any assurance to this effect. |
| • | Trade Agreements: Historical global
growth of the automotive industry has been aided by the free movement of goods, services,
people, and capital through bilateral and regional trade agreements, particularly in North
America and Europe. Introduction of measures which impede free trade could have a material
adverse effect on our operations and profitability. |
| • | Trade Disputes/Tariffs: International
trade disputes could, among other things, reduce demand for and production of vehicles, disrupt
global supply chains, distort commodity pricing, impair the ability of automotive suppliers
and vehicle manufacturers to make efficient long-term investment decisions, create volatility
in relative foreign exchange rates, and contribute to stock market volatility. The imposition
of sanctions, tariffs and/or escalation of trade disputes which interfere with automotive
supply chains could have an adverse effect on our operations and profitability. |
32 Magna International Inc. Annual Report 2023
Exhibit 99.2
 | Magna International Inc.
337
Magna Drive
Aurora,
Ontario L4G 7K1 |
| Tel | (905)
726-2462 |
| Fax | (905)
726-7164 |
Consolidated
Financial Statements
Magna
International Inc.
December
31, 2023
REPORT
OF INDEPENDENT REGISTERED PUBLIC ACCOUNTING FIRM
To
the Shareholders and the Board of Directors of Magna International Inc.
Opinion
on the Financial Statements
We
have audited the accompanying consolidated balance sheets of Magna International Inc. and subsidiaries (the “Company”)
as of December 31, 2023 and 2022, the related consolidated statements of income, comprehensive income, changes in equity, and
cash flows, for each of the two years in the period ended December 31, 2023, and the related notes (collectively referred to as
the “financial statements”). In our opinion, the financial statements present fairly, in all material respects, the
financial position of the Company as of December 31, 2023 and 2022, and the results of its operations and its cash flows for each
of the two years in the period ended December 31, 2023, in conformity with accounting principles generally accepted in the United
States of America.
We
have also audited, in accordance with the standards of the Public Company Accounting Oversight Board (United States) (PCAOB), the Company’s
internal control over financial reporting as of December 31, 2023, based on criteria established in
Internal Control — Integrated Framework (2013) issued by the Committee of Sponsoring Organizations of the Treadway Commission
and our report dated February 22, 2024, expressed an unqualified opinion on the Company’s internal control over financial reporting.
Basis
for Opinion
These
financial statements are the responsibility of the Company’s management. Our responsibility is to express an opinion on
the Company’s financial statements based on our audits. We are a public accounting firm registered with the PCAOB and are
required to be independent with respect to the Company in accordance with the U.S. federal securities laws and the applicable
rules and regulations of the Securities and Exchange Commission and the PCAOB.
We
conducted our audits in accordance with the standards of the PCAOB. Those standards require that we plan and perform the audit
to obtain reasonable assurance about whether the financial statements are free of material misstatement, whether due to error
or fraud. Our audits included performing procedures to assess the risks of material misstatement of the financial statements,
whether due to error or fraud, and performing procedures that respond to those risks. Such procedures included examining, on a
test basis, evidence regarding the amounts and disclosures in the financial statements. Our audits also included evaluating the
accounting principles used and significant estimates made by management, as well as evaluating the overall presentation of the
financial statements. We believe that our audits provide a reasonable basis for our opinion.
Critical
Audit Matter
The critical audit matter communicated below is a matter arising from the current period audit of the financial
statements that was communicated or required to be communicated to the audit committee and that: (1) relates to an account or disclosure
that is material to the consolidated financial statements and (2) involved our especially challenging, subjective, or complex judgment.
The communication of a critical audit matter does not alter in any way our opinion on the consolidated financial statements, taken as
a whole, and we are not, by communicating the critical audit matter below, providing a separate opinion on the critical audit matter or
on the accounts or disclosures to which it relates.
Veoneer
Active Safety Business (“Veoneer AS”) Business Combination — Refer to Note 7[a] to the financial statements
Critical Audit Matter Description
The Company acquired 100% of the common shares and voting interests of the entities holding Veoneer AS and recognized the assets acquired
and the liabilities assumed at fair value, including intangible assets. In determining the fair value of the intangible assets, specifically
related to technology, management was required to make assumptions around the future cash flows used in their valuation methodology.
While there are several estimates and assumptions that are required to determine the fair value of technology, the estimates and assumptions
with the highest degree of subjectivity are the forecasted revenues and the discount rate. This required a high degree of auditor judgment
and an increased extent of audit effort, including the need to involve fair value specialists.
How the Critical Audit Matter Was Addressed
in the Audit
Our audit procedures related to the assumptions
used to determine the fair value of technology included the following, among others:
| |
• |
Evaluated the effectiveness of controls over management’s process for determining the fair value of technology, including management’s controls over the forecasted revenues and the selection of the discount rate; |
| |
|
|
| |
• |
Evaluated the reasonableness of forecasted revenues by comparing the assumptions used in the projections to external market sources, historical data and results from other areas of the audit; |
| |
|
|
| |
• |
With the assistance of fair value specialists, evaluated the reasonableness of the discount rate by testing the source information underlying the determination of the discount rate and developing a range of independent estimates and comparing those to the discount rate selected by management. |
/s/ Deloitte LLP
Chartered Professional Accountants
Licensed Public Accountants
Toronto, Canada
February 22, 2024
We
have served as the Company’s auditor since 2014.
REPORT
OF INDEPENDENT REGISTERED PUBLIC ACCOUNTING FIRM
To
the Shareholders and the Board of Directors of Magna International Inc.
Opinion on Internal Control over Financial
Reporting
We have audited the internal control over financial
reporting of Magna International Inc. and subsidiaries (the “Company”) as of December 31, 2023, based on criteria established
in Internal Control—Integrated Framework (2013) issued by the Committee of Sponsoring Organizations of the Treadway Commission (COSO).
In our opinion, the Company maintained, in all material respects, effective internal control over financial reporting as of December 31,
2023, based on criteria established in Internal Control — Integrated Framework (2013) issued by COSO.
We have also audited, in accordance with the standards
of the Public Company Accounting Oversight Board (United States) (PCAOB), the consolidated financial statements as of and for the year
ended December 31, 2023 of the Company and our report dated February 22, 2024, expressed an unqualified opinion on those financial
statements.
As described in Management’s Annual Report
on Internal Control over Financial Reporting, management excluded from its assessment the internal control over financial reporting at
Veoneer Active Safety Business, which was acquired on June 1, 2023, and whose financial statements constitute 4% of total assets
and 2% of sales of the consolidated financial statement amounts as of and for the year ended December 31, 2023. Accordingly, our
audit did not include the internal control over financial reporting at Veoneer Active Safety Business.
Basis
for Opinion
The
Company’s management is responsible for maintaining effective internal control over financial reporting and for its assessment
of the effectiveness of internal control over financial reporting, included in the accompanying Management’s Annual Report
on Internal Control over Financial Reporting. Our responsibility is to express an opinion on the Company’s internal control
over financial reporting based on our audit. We are a public accounting firm registered with the PCAOB and are required to be
independent with respect to the Company in accordance with the U.S. federal securities laws and the applicable rules and regulations
of the Securities and Exchange Commission and the PCAOB.
We
conducted our audit in accordance with the standards of the PCAOB. Those standards require that we plan and perform the audit
to obtain reasonable assurance about whether effective internal control over financial reporting was maintained in all material
respects. Our audit included obtaining an understanding of internal control over financial reporting, assessing the risk that
a material weakness exists, testing and evaluating the design and operating effectiveness of internal control based on the assessed
risk, and performing such other procedures as we considered necessary in the circumstances. We believe that our audit provides
a reasonable basis for our opinion.
Definition
and Limitations of Internal Control over Financial Reporting
A
company’s internal control over financial reporting is a process designed to provide reasonable assurance regarding the
reliability of financial reporting and the preparation of financial statements for external purposes in accordance with generally
accepted accounting principles. A company’s internal control over financial reporting includes those policies and procedures
that (1) pertain to the maintenance of records that, in reasonable detail, accurately and fairly reflect the transactions and
dispositions of the assets of the company; (2) provide reasonable assurance that transactions are recorded as necessary to permit
preparation of financial statements in accordance with generally accepted accounting principles, and that receipts and expenditures
of the company are being made only in accordance with authorizations of management and directors of the company; and (3) provide
reasonable assurance regarding prevention or timely detection of unauthorized acquisition, use, or disposition of the company’s
assets that could have a material effect on the financial statements.
Because
of its inherent limitations, internal control over financial reporting may not prevent or detect misstatements. Also, projections
of any evaluation of effectiveness to future periods are subject to the risk that controls may become inadequate because of changes
in conditions, or that the degree of compliance with the policies or procedures may deteriorate.
/s/ Deloitte LLP
Chartered
Professional Accountants
Licensed
Public Accountants
Toronto,
Canada
February
22, 2024
MAGNA
INTERNATIONAL INC.
CONSOLIDATED
STATEMENTS OF INCOME
[U.S.
dollars in millions, except per share figures]
Years
ended December 31,
| | |
Note | | |
2023 | | |
2022 | |
| Sales | |
| | | |
$ | 42,797 | | |
$ | 37,840 | |
| | |
| | | |
| | | |
| | |
| Costs and expenses | |
| | | |
| | | |
| | |
| Cost of goods sold | |
| | | |
| 37,185 | | |
| 33,188 | |
| Selling, general and administrative | |
| | | |
| 2,050 | | |
| 1,660 | |
| Depreciation | |
| | | |
| 1,436 | | |
| 1,373 | |
| Amortization of acquired intangible assets | |
| | | |
| 88 | | |
| 46 | |
| Interest expense, net | |
| 16 | | |
| 156 | | |
| 81 | |
| Equity income | |
| | | |
| (112 | ) | |
| (89 | ) |
| Other expense, net | |
| 4 | | |
| 388 | | |
| 703 | |
| Income from operations before income taxes | |
| | | |
| 1,606 | | |
| 878 | |
| Income taxes | |
| 12 | | |
| 320 | | |
| 237 | |
| Net income | |
| | | |
| 1,286 | | |
| 641 | |
| Income attributable to non-controlling interests | |
| | | |
| (73 | ) | |
| (49 | ) |
| Net income attributable to Magna International Inc. | |
| | | |
$ | 1,213 | | |
$ | 592 | |
| | |
| | | |
| | | |
| | |
| Earnings per Common Share: | |
| 5 | | |
| | | |
| | |
| Basic | |
| | | |
$ | 4.24 | | |
$ | 2.04 | |
| Diluted | |
| | | |
$ | 4.23 | | |
$ | 2.03 | |
| | |
| | | |
| | | |
| | |
| Weighted average number of Common Shares outstanding during the year [in millions]: | |
| 5 | | |
| | | |
| | |
| Basic | |
| | | |
| 286.2 | | |
| 290.4 | |
| Diluted | |
| | | |
| 286.6 | | |
| 291.2 | |
See
accompanying notes
MAGNA
INTERNATIONAL INC.
CONSOLIDATED
STATEMENTS OF COMPREHENSIVE INCOME
[U.S.
dollars in millions]
Years
ended December 31,
| | |
Note | | |
2023 | | |
2022 | |
| Net income | |
| | | |
$ | 1,286 | | |
$ | 641 | |
| | |
| | | |
| | | |
| | |
| Other comprehensive income (loss), net of tax: | |
| 21 | | |
| | | |
| | |
| Net unrealized gain (loss) on translation of net investment in foreign operations | |
| | | |
| 166 | | |
| (531 | ) |
| Net unrealized gain on cash flow hedges | |
| | | |
| 94 | | |
| 1 | |
| Reclassification of net gain on cash flow hedges to net income | |
| | | |
| (56 | ) | |
| (20 | ) |
| Reclassification of net loss on pensions to net income | |
| | | |
| 1 | | |
| 6 | |
| Reclassification of loss on translation of net investment in foreign operations to income | |
| | | |
| — | | |
| 203 | |
| Pension and post-retirement benefits | |
| | | |
| (5 | ) | |
| 82 | |
| Other comprehensive income (loss) | |
| | | |
| 200 | | |
| (259 | ) |
| Comprehensive income | |
| | | |
| 1,486 | | |
| 382 | |
| Comprehensive income attributable to non-controlling interests | |
| | | |
| (56 | ) | |
| (13 | ) |
| Comprehensive income attributable to Magna International Inc. | |
| | | |
$ | 1,430 | | |
$ | 369 | |
See
accompanying notes
MAGNA
INTERNATIONAL INC.
CONSOLIDATED
BALANCE SHEETS
[U.S.
dollars in millions, except shares issued]
As
at December 31,
| | |
Note | | |
2023 | | |
2022 | |
| ASSETS | |
| | | |
| | | |
| | |
| Current assets | |
| | | |
| | | |
| | |
| Cash and cash equivalents | |
| 6 | | |
$ | 1,198 | | |
$ | 1,234 | |
| Accounts receivable | |
| | | |
| 7,881 | | |
| 6,791 | |
| Inventories | |
| 8 | | |
| 4,606 | | |
| 4,180 | |
| Prepaid expenses and other | |
| | | |
| 352 | | |
| 320 | |
| | |
| | | |
| 14,037 | | |
| 12,525 | |
| | |
| | | |
| | | |
| | |
| Investments | |
| 9 | | |
| 1,273 | | |
| 1,429 | |
| Fixed assets, net | |
| 10 | | |
| 9,618 | | |
| 8,173 | |
| Operating lease right-of-use assets | |
| 17 | | |
| 1,744 | | |
| 1,595 | |
| Intangible assets, net | |
| 13 | | |
| 876 | | |
| 452 | |
| Goodwill | |
| 11 | | |
| 2,767 | | |
| 2,031 | |
| Other assets | |
| 14, 18 | | |
| 1,319 | | |
| 1,093 | |
| Deferred tax assets | |
| 12 | | |
| 621 | | |
| 491 | |
| | |
| | | |
$ | 32,255 | | |
$ | 27,789 | |
| | |
| | | |
| | | |
| | |
| LIABILITIES AND SHAREHOLDERS’ EQUITY | |
| | | |
| | | |
| | |
| Current liabilities | |
| | | |
| | | |
| | |
| Short-term borrowing | |
| | | |
$ | 511 | | |
$ | 8 | |
| Accounts payable | |
| | | |
| 7,842 | | |
| 6,999 | |
| Other accrued liabilities | |
| 15 | | |
| 2,626 | | |
| 2,118 | |
| Accrued salaries and wages | |
| | | |
| 912 | | |
| 850 | |
| Income taxes payable | |
| | | |
| 125 | | |
| 93 | |
| Long-term debt due within one year | |
| 16 | | |
| 819 | | |
| 654 | |
| Current portion of operating lease liabilities | |
| 17 | | |
| 399 | | |
| 276 | |
| | |
| | | |
| 13,234 | | |
| 10,998 | |
| | |
| | | |
| | | |
| | |
| Long-term debt | |
| 16 | | |
| 4,175 | | |
| 2,847 | |
| Operating lease liabilities | |
| 17 | | |
| 1,319 | | |
| 1,288 | |
| Long-term employee benefit liabilities | |
| 18 | | |
| 591 | | |
| 548 | |
| Other long-term liabilities | |
| 19 | | |
| 475 | | |
| 461 | |
| Deferred tax liabilities | |
| 12 | | |
| 184 | | |
| 312 | |
| | |
| | | |
| 19,978 | | |
| 16,454 | |
| | |
| | | |
| | | |
| | |
| Shareholders’ equity | |
| | | |
| | | |
| | |
| Common Shares [issued: 2023 – 286,552,908; 2022 – 285,931,816] | |
| 20 | | |
| 3,354 | | |
| 3,299 | |
| Contributed surplus | |
| | | |
| 125 | | |
| 111 | |
| Retained earnings | |
| | | |
| 9,303 | | |
| 8,639 | |
| Accumulated other comprehensive loss | |
| 21 | | |
| (898 | ) | |
| (1,114 | ) |
| | |
| | | |
| 11,884 | | |
| 10,935 | |
| | |
| | | |
| | | |
| | |
| Non-controlling interests | |
| | | |
| 393 | | |
| 400 | |
| | |
| | | |
| 12,277 | | |
| 11,335 | |
| | |
| | | |
$ | 32,255 | | |
$ | 27,789 | |
Commitments
and contingencies [notes 16, 17, 22 and 23]
See
accompanying notes
On
behalf of the Board:
| /s/
“Peter Bowie” |
|
/s/
“Robert F. MacLellan” |
| |
|
|
| Director |
|
Chairman
of the Board |
MAGNA
INTERNATIONAL INC.
CONSOLIDATED
STATEMENTS OF CASH FLOWS
[U.S.
dollars in millions]
Years
ended December 31,
| | |
Note | | |
2023 | | |
2022 | |
| OPERATING ACTIVITIES | |
| | | |
| | | |
| | |
| Net income | |
| | | |
$ | 1,286 | | |
$ | 641 | |
| Items not involving current cash flows | |
| 6 | | |
| 1,642 | | |
| 1,776 | |
| | |
| | | |
| 2,928 | | |
| 2,417 | |
| Changes in operating assets and liabilities | |
| 6 | | |
| 221 | | |
| (322 | ) |
| Cash provided from operating activities | |
| | | |
| 3,149 | | |
| 2,095 | |
| | |
| | | |
| | | |
| | |
| INVESTMENT ACTIVITIES | |
| | | |
| | | |
| | |
| Acquisitions | |
| 7 | | |
| (1,504 | ) | |
| (3 | ) |
| Fixed asset additions | |
| | | |
| (2,500 | ) | |
| (1,681 | ) |
| Increase in investments, other assets and intangible assets | |
| | | |
| (562 | ) | |
| (455 | ) |
| Increase in public and private equity investments | |
| | | |
| (11 | ) | |
| (29 | ) |
| Proceeds from dispositions | |
| | | |
| 122 | | |
| 124 | |
| Net cash (outflow) inflow from disposal of facilities | |
| 4 | | |
| (48 | ) | |
| 6 | |
| Cash used for investing activities | |
| | | |
| (4,503 | ) | |
| (2,038 | ) |
| | |
| | | |
| | | |
| | |
| FINANCING ACTIVITIES | |
| | | |
| | | |
| | |
| Issues of debt | |
| 16 | | |
| 2,083 | | |
| 54 | |
| Increase in short-term borrowings | |
| | | |
| 487 | | |
| 11 | |
| Repayments of debt | |
| 16 | | |
| (644 | ) | |
| (456 | ) |
| Issue of Common Shares on exercise of stock options | |
| | | |
| 20 | | |
| 8 | |
| Tax withholdings on vesting of equity awards | |
| | | |
| (11 | ) | |
| (15 | ) |
| Repurchase of Common Shares | |
| 20 | | |
| (13 | ) | |
| (780 | ) |
| Contributions to subsidiaries by non-controlling interests | |
| | | |
| 11 | | |
| 5 | |
| Dividends paid to non-controlling interests | |
| | | |
| (74 | ) | |
| (46 | ) |
| Dividends | |
| | | |
| (522 | ) | |
| (514 | ) |
| Cash provided from (used for) financing activities | |
| | | |
| 1,337 | | |
| (1,733 | ) |
| | |
| | | |
| | | |
| | |
| Effect of exchange rate changes on cash and cash equivalents | |
| | | |
| (19 | ) | |
| (38 | ) |
| | |
| | | |
| | | |
| | |
| Net decrease in cash, cash equivalents during the year | |
| | | |
| (36 | ) | |
| (1,714 | ) |
| Cash and cash equivalents, beginning of year | |
| | | |
| 1,234 | | |
| 2,948 | |
| Cash and cash equivalents, end of year | |
| 6 | | |
$ | 1,198 | | |
$ | 1,234 | |
See
accompanying notes
MAGNA
INTERNATIONAL INC.
CONSOLIDATED
STATEMENTS OF CHANGES IN EQUITY
[U.S.
dollars in millions, except number of common shares]
| | |
Common Shares | | |
| | |
| | |
| | |
Non- | | |
| |
| | |
Number | | |
Stated
Value | | |
Contributed
Surplus | | |
Retained
Earnings | | |
AOCL [i] | | |
controlling
Interests | | |
Total
Equity | |
| | |
[in millions] | | |
| | |
| | |
| | |
| | |
| | |
| |
| Balance, December 31, 2021 | |
| 297.9 | | |
$ | 3,403 | | |
$ | 102 | | |
$ | 9,231 | | |
$ | (900 | ) | |
$ | 389 | | |
$ | 12,225 | |
| Net income | |
| | | |
| | | |
| | | |
| 592 | | |
| | | |
| 49 | | |
| 641 | |
| Other comprehensive loss | |
| | | |
| | | |
| | | |
| | | |
| (223 | ) | |
| (36 | ) | |
| (259 | ) |
| Contribution by non-controlling interests | |
| | | |
| | | |
| | | |
| | | |
| | | |
| 5 | | |
| 5 | |
| Purchase of non-controlling interests | |
| | | |
| | | |
| | | |
| | | |
| | | |
| (8 | ) | |
| (8 | ) |
| Shares issued on exercise of stock options | |
| 0.2 | | |
| 9 | | |
| (1 | ) | |
| | | |
| | | |
| | | |
| 8 | |
| Release of stock and stock units | |
| 0.5 | | |
| 21 | | |
| (21 | ) | |
| | | |
| | | |
| | | |
| — | |
| Tax withholdings on vesting of equity awards | |
| (0.2 | ) | |
| (2 | ) | |
| | | |
| (13 | ) | |
| | | |
| | | |
| (15 | ) |
| Repurchase and cancellation under normal course issuer bids [note 20] | |
| (12.6 | ) | |
| (141 | ) | |
| | | |
| (648 | ) | |
| 9 | | |
| | | |
| (780 | ) |
| Stock-based compensation expense | |
| | | |
| | | |
| 31 | | |
| | | |
| | | |
| | | |
| 31 | |
| Business combinations | |
| | | |
| | | |
| | | |
| | | |
| | | |
| 47 | | |
| 47 | |
| Dividends paid to non-controlling interests | |
| | | |
| | | |
| | | |
| | | |
| | | |
| (46 | ) | |
| (46 | ) |
| Dividends paid [$1.80 per share] | |
| 0.1 | | |
| 9 | | |
| | | |
| (523 | ) | |
| | | |
| | | |
| (514 | ) |
| Balance, December 31, 2022 | |
| 285.9 | | |
$ | 3,299 | | |
$ | 111 | | |
$ | 8,639 | | |
$ | (1,114 | ) | |
$ | 400 | | |
$ | 11,335 | |
| Net income | |
| | | |
| | | |
| | | |
| 1,213 | | |
| | | |
| 73 | | |
| 1,286 | |
| Other comprehensive income | |
| | | |
| | | |
| | | |
| | | |
| 217 | | |
| (17 | ) | |
| 200 | |
| Contribution by non-controlling interests | |
| | | |
| | | |
| | | |
| | | |
| | | |
| 11 | | |
| 11 | |
| Shares issued on exercise of stock options | |
| 0.5 | | |
| 25 | | |
| (5 | ) | |
| | | |
| | | |
| | | |
| 20 | |
| Release of stock and stock units | |
| 0.4 | | |
| 26 | | |
| (26 | ) | |
| | | |
| | | |
| | | |
| — | |
| Tax withholdings on vesting of equity awards | |
| (0.2 | ) | |
| (2 | ) | |
| | | |
| (9 | ) | |
| | | |
| | | |
| (11 | ) |
| Repurchase and cancellation under normal course issuer bids [note20] | |
| (0.2 | ) | |
| (2 | ) | |
| | | |
| (10 | ) | |
| (1 | ) | |
| | | |
| (13 | ) |
| Stock-based compensation expense | |
| | | |
| | | |
| 45 | | |
| | | |
| | | |
| | | |
| 45 | |
| Dividends paid to non-controlling interests | |
| | | |
| | | |
| | | |
| | | |
| | | |
| (74 | ) | |
| (74 | ) |
| Dividends paid [$1.84 per share] | |
| 0.2 | | |
| 8 | | |
| | | |
| (530 | ) | |
| | | |
| | | |
| (522 | ) |
| Balance, December 31, 2023 | |
| 286.6 | | |
$ | 3,354 | | |
$ | 125 | | |
$ | 9,303 | | |
$ | (898 | ) | |
$ | 393 | | |
$ | 12,277 | |
| (i) | AOCL
is Accumulated Other Comprehensive Loss. |
See
accompanying notes
MAGNA
INTERNATIONAL INC.
NOTES
TO CONSOLIDATED FINANCIAL STATEMENTS
[All
amounts in U.S. dollars and all tabular amounts in millions, except per share figures, unless otherwise noted]
| 1. | NATURE
OF OPERATIONS AND BASIS OF PRESENTATION |
Magna
International Inc. [collectively “Magna” or the “Company”] is a mobility technology company and a global supplier
in the automotive space. The Company’s systems approach to design, engineering and manufacturing touches nearly every aspect
of the vehicle. Magna has complete vehicle engineering and contract manufacturing expertise, as well as product capabilities which
include body, chassis, exterior, seating, powertrain, active driver assistance, electronics, mechatronics, mirrors, lighting and
roof systems. Magna also has electronic and software capabilities across many of these areas. In addition, the Company is leveraging
its capabilities and platform technologies in areas such as battery management, software stack and sensors to enter growing adjacent
mobility markets such as micromobility.
The
consolidated financial statements have been prepared in U.S. dollars following accounting principles generally accepted in the
United States [“GAAP”].
For
the year ended December 31, 2022, $46 million has been reclassified from Depreciation and amortization to Amortization of acquired
intangible assets on the consolidated statements of income to conform with current period presentation.
Principles
of consolidation
The
Consolidated Financial Statements include the accounts of Magna and its subsidiaries in which Magna has a controlling financial
interest and is the primary beneficiary. The Company presents non-controlling interests as a separate component within Shareholders’
equity in the Consolidated Balance Sheets. All intercompany balances and transactions have been eliminated.
Use
of estimates
The
preparation of the consolidated financial statements in conformity with GAAP requires management to make estimates and assumptions
that affect the amounts reported and disclosed in the consolidated financial statements and accompanying notes. Actual results
could differ from those estimates.
Foreign
currency translation
The
Company operates globally, which gives rise to a risk that its earnings and cash flows may be adversely impacted by fluctuations
in foreign exchange rates.
Assets
and liabilities of the Company’s operations having a functional currency other than the U.S. dollar are translated into U.S. dollars
using the exchange rate in effect at year end, and revenues and expenses are translated at the average rate during the year. Exchange
gains or losses on translation of the Company’s net investment in these operations are included in comprehensive income and are
deferred in accumulated other comprehensive loss. Foreign exchange gains or losses on debt that was designated as a hedge of the
Company’s net investment in these foreign operations are also recorded in accumulated other comprehensive loss.
Foreign
exchange gains and losses on transactions occurring in a currency other than an operation’s functional currency are reflected
in net income, except for gains and losses on foreign exchange contracts used to hedge specific future commitments in foreign
currencies and on intercompany balances which are designated as long-term investments. In particular, the Company uses foreign
exchange forward contracts for the sole purpose of hedging certain of the Company’s future committed foreign currency based outflows
and inflows. Most of the Company’s foreign exchange contracts are subject to master netting arrangements that provide for the
net settlement of contracts, by counterparty, in the event of default or termination. All derivative instruments, including foreign
exchange contracts, are recorded on the consolidated balance sheet at fair value. The fair values of derivatives are recorded
on a gross basis in prepaid expenses and other, other assets, other accrued liabilities or other long-term liabilities. To the
extent that derivative instruments are designated and qualify as cash flow hedges, the changes in their fair values are recorded
in other comprehensive income. Changes in the fair value of derivative instruments that do not qualify for hedge accounting are
recognized immediately in net income based on the nature of the underlying transaction. Amounts accumulated in other comprehensive
loss or income are reclassified to net income in the period in which the hedged item affects net income.
If
the Company’s foreign exchange forward contracts cease to be effective as hedges, for example if projected foreign cash inflows
or outflows declined significantly, gains or losses pertaining to the portion of the hedging transactions in excess of projected
foreign currency denominated cash flows would be recognized in net income at the time this condition was identified.
2023 Annual Financial Statements 1
MAGNA
INTERNATIONAL INC.
NOTES
TO CONSOLIDATED FINANCIAL STATEMENTS
[All
amounts in U.S. dollars and all tabular amounts in millions, except per share figures, unless otherwise noted]
| 2. | SIGNIFICANT
ACCOUNTING POLICIES |
Cash
and cash equivalents
Cash
and cash equivalents include cash on account, demand deposits and short-term investments with remaining maturities of less than
three months at acquisition.
Inventories
Production
inventories and tooling inventories manufactured in-house are valued at the lower of cost determined substantially
on a first-in, first-out basis, or net realizable value. Cost includes the cost of materials plus direct labour applied to the
product and the applicable share of manufacturing overhead.
Investments
The
Company accounts for investments in companies over which it has the ability to exercise significant influence, but does not hold
a controlling financial interest, under the equity method [“Equity method investments”]. The Company monitors its Equity
method investments for indicators of other-than-temporary declines in value on an ongoing basis. If the Company determines that
an other-than-temporary decline in value has occurred, it recognizes an impairment loss, which is measured as the difference between
the book value and the fair value of the investment. Fair value is generally determined using an income approach based on discounted
cash flows. The inputs utilized in the analyses are classified as Level 3 inputs within the fair value hierarchy as defined in
ASC 820, “Fair Value Measurement” and primarily consist of expected investee revenue and costs, estimated production
volumes and discount rates.
The
Company also has investments in private and publicly traded companies over which it does not have the ability to exercise significant
influence. The Company has elected to use the measurement alternative, defined as cost, less impairments, adjusted by observable
price changes to measure the private equity investments. The Company values its investments in publicly traded equity securities
using the closing price on the measurement date, as reported on the stock exchange on which the securities are traded.
Private
equity investments are subject to impairment reviews which considers both qualitative and quantitative factors that may have a
significant impact on the investee’s fair value. Upon determining that an impairment may exist, the security’s fair value is calculated
using the best information available, which may include cash flow projections or other available market data, and is compared
to its carrying value. An impairment is recognized immediately if the carrying value exceeds the fair value.
Long-lived
assets
Fixed
assets are recorded at historical cost. Depreciation is provided on a straight-line basis over the estimated useful lives of fixed
assets at annual rates of 2½% to 5% for buildings, 7% to 10% for general purpose equipment and 10% to 33% for special purpose
equipment.
Finite-lived
intangible assets, which have arisen principally through acquisitions, include customer relationship intangibles and patents and
technology. Amortization of these finite-lived intangible assets is included within Amortization of acquired intangible assets.
Amortization of other finite-lived intangible assets, including computer software and licenses, is included within Depreciation.
Finite-lived intangible assets are amortized on a straight-line basis over their estimated useful lives which range from 4 to
15 years.
The
Company assesses fixed and finite-lived intangible assets for recoverability whenever indicators of impairment exist. If the carrying
value of the asset exceeds the estimated undiscounted cash flows from the use of the asset, then an impairment loss is recognized
to write the asset down to fair value. The fair value of fixed and finite-lived intangible assets is generally determined using
estimated discounted future cash flows.
2023 Annual Financial Statements 2
MAGNA
INTERNATIONAL INC.
NOTES
TO CONSOLIDATED FINANCIAL STATEMENTS
[All
amounts in U.S. dollars and all tabular amounts in millions, except per share figures, unless otherwise noted]
Business
combinations
The
Company accounts for transactions in which it obtains control of a business in accordance with the acquisition method. The purchase
price of an acquired business is allocated to its identifiable assets and liabilities based on estimated fair values at the date
of the acquisition, and any excess is recorded as goodwill. During the measurement period, which may be up to one year following
the acquisition date, the Company may record adjustments to assets acquired and liabilities assumed. Acquisition related costs
incurred as a result of the business combination are expensed as incurred.
Goodwill
Goodwill
represents the excess of the cost of an acquired enterprise over the fair value of the identifiable assets acquired and liabilities
assumed less any subsequent write-downs for impairment. Goodwill is reviewed for impairment in the fourth quarter of each year,
or more frequently if indicators of potential impairment exist. Goodwill impairment is assessed based on a comparison of the fair
value of a reporting unit to the underlying carrying value of the reporting unit’s net assets, including goodwill. When the carrying
amount of the reporting unit exceeds its fair value, an impairment is recognized based on that difference. The fair value of a
reporting unit is determined using its estimated discounted future cash flows.
Tooling
and Pre-Production Engineering Costs Related to Long-Term Supply Agreements
The
Company incurs pre-production engineering and tooling costs related to the products produced for its customers under long-term
supply agreements. Customer reimbursements for tooling and pre-production engineering activities that are part of a long-term
supply arrangement are accounted for as a reduction of cost. Pre-production costs related to long-term supply arrangements with
a contractual guarantee for reimbursement and capitalized tooling are included in Other assets.
The
Company expenses all pre-production engineering costs for which reimbursement is not contractually guaranteed by the customer.
All tooling costs related to customer-owned tools for which reimbursement is not contractually guaranteed by the customer or for
which the Company does not have a non-cancelable right to use the tooling are also expensed.
Warranty
The
Company has assurance warranties and records product warranty liabilities based on its individual customer agreements. Under most
customer agreements, the Company only accounts for existing or probable claims on product default issues when amounts related
to such issues are probable and reasonably estimable. However, for certain powertrain systems, electronics, and complete vehicle
assembly contracts, the Company records an estimate of future warranty-related costs based on the terms of the specific customer
agreements and/or the Company’s warranty experience. Product liability and recall provisions are established based on the Company’s
best estimate of the amounts necessary to settle existing claims which typically take into account: the number of units that may
be returned; the cost of the product being replaced; labour to remove and replace the defective part; and the customer’s administrative
costs relating to the recall. Judgement is also required as to the ultimate negotiated sharing of the cost between the Company,
the customer and, in some cases, a supplier to the Company.
When
a decision to recall a product has been made or is probable, the Company’s portion of the estimated cost of the recall is recorded
as a charge to net income in that period. The Company monitors warranty activity on an ongoing basis and adjusts reserve balances
when it is probable that future warranty costs will be different than those previously estimated.
Income
taxes
The
Company uses the liability method of tax allocation to account for income taxes. Under the liability method of tax allocation,
deferred tax assets and liabilities are determined based on differences between the financial reporting and tax bases of assets
and liabilities and are measured using the enacted tax rates and laws that will be in effect when the differences are expected
to reverse. The Company assesses whether valuation allowances should be established or maintained against its deferred tax assets
based on consideration of all available evidence using a “more-likely-than-not” standard. The factors the Company uses
to assess the likelihood of realization are its history of losses, forecasts of future pre-tax income and tax planning strategies
that could be implemented to realize the deferred tax assets.
2023 Annual Financial Statements 3
MAGNA
INTERNATIONAL INC.
NOTES
TO CONSOLIDATED FINANCIAL STATEMENTS
[All
amounts in U.S. dollars and all tabular amounts in millions, except per share figures, unless otherwise noted]
No
deferred tax liability is recorded for taxes on undistributed earnings and translation adjustments of foreign subsidiaries if
these items are considered to be reinvested for the foreseeable future, until it becomes apparent that such earnings will be distributed
in the foreseeable future and the Company will incur further tax on remittance.
Recognition
of uncertain tax positions is dependent on whether it is more-likely-than-not that a tax position will be sustained upon examination,
including resolution of any related appeals or litigation processes, based on the technical merits of the position. A tax position
that meets the more-likely-than-not recognition threshold is measured at the largest amount of tax benefit that is greater than
50% likely of being realized upon ultimate settlement. The Company recognizes interest and penalties related to uncertain tax
positions in income tax expense.
Leases
The
Company determines if an arrangement is a lease or contains a lease at inception. Leases with an initial term of 12 months or
less are considered short-term and are not recorded on the balance sheet. The Company recognizes operating lease expense for these
leases on a straight-line basis over the lease term.
Operating
lease right-of-use [“ROU”] assets and operating lease liabilities are recognized based on the present value of the future
lease payments over the lease term at the commencement date. As the rate implicit in the lease is not readily determinable for
the Company’s operating leases, an incremental borrowing rate is generally used to determine the present value of future lease
payments. The incremental borrowing rate for each lease is based on the Company’s estimated borrowing rate over a similar term
to that of the lease payments, adjusted for various factors including collateralization, location and currency.
A
majority of the Company’s leases for manufacturing facilities are subject to variable lease-related payments, such as escalation
clauses based on consumer price index rates or other similar indices. Variable payments that are based on an index or a rate are
included in the recognition of the Company’s ROU assets and lease liabilities using the index or rate at lease commencement. Subsequent
changes to these lease payments due to rate or index updates are recorded as lease expense in the period incurred.
The
Company’s lease agreements generally exclude non-lease components, and do not contain any material residual value guarantees or
material restrictive covenants.
Employee
future benefit plans
The
cost of providing benefits through defined benefit pensions, lump sum termination and long-term service payment arrangements,
and post-retirement benefits other than pensions is actuarially determined and recognized in income using the projected benefit
method pro-rated on service and management’s best estimate of expected plan investment performance, salary escalation, retirement
ages of employees and, with respect to medical benefits, expected health care costs. Differences arising from plan amendments,
changes in assumptions and experience gains and losses that are greater than 10% of the greater of: [i] the accrued benefit obligation
at the beginning of the year; and [ii] the fair value [or market related value] of plan assets at the beginning of the year, are
recognized in income over the expected average remaining service life of employees. Plan assets are valued at fair value. The
cost of providing benefits through defined contribution pension plans is charged to income in the period in respect of which contributions
become payable.
The
funded status of the plans is measured as the difference between the fair value of the plan assets and the projected benefit obligation
[“PBO”]. The aggregate of all overfunded plans is recorded in other assets, and the aggregate of all underfunded plans
is recorded in long-term employee benefit liabilities. The portion of the amount by which the actuarial present value of benefits
included in the PBO exceeds the fair value of plan assets, payable in the next twelve months, is reflected in other accrued liabilities.
2023 Annual Financial Statements 4
MAGNA
INTERNATIONAL INC.
NOTES
TO CONSOLIDATED FINANCIAL STATEMENTS
[All
amounts in U.S. dollars and all tabular amounts in millions, except per share figures, unless otherwise noted]
Revenue
recognition
The
Company enters into contracts with its customers to provide production parts or assembled vehicles. Contracts do not commit the
customer to a specified quantity of products; however, the Company is generally required to fulfill its customers’ purchasing
requirements for the production life of the vehicle. Contracts do not typically become a performance obligation until the Company
receives a purchase order and a customer release for a specific number of parts or assembled vehicles at a specified price. While
long-term supply agreements may range from five to seven years, contracts may be terminated by customers at any time. Historically,
terminations have been minimal. Contracts may also provide for annual price reductions over the production life of the vehicle,
and prices are adjusted on an ongoing basis to reflect changes in product content/cost and other commercial factors.
Revenue
is recognized at the point in time when control of the parts produced or assembled vehicles are transferred to the customer according
to the terms of the contract. The amount of revenue recognized reflects the consideration that the Company expects to be entitled
to in exchange for those products based on purchase orders and ongoing price adjustments [some of which is accounted for as variable
consideration]. The Company uses the expected value method, taking into account historical data and the status of current negotiations,
to estimate the amount to which it expects to be entitled. Significant changes to the Company’s estimates of variable consideration
are not expected.
The
Company’s complete vehicle assembly contracts with customers are complex and often include promises to transfer multiple products
and services, some of which may be implicitly contracted. For these arrangements, each good or service is evaluated to determine
whether it represents a distinct performance obligation, and whether it should be characterized as revenue or reimbursement of
costs incurred. The total transaction price is then allocated to the distinct performance obligations based on the expected cost
plus a margin approach and amounts related to revenue are recognized as discussed above.
The
terms of the Company’s complete vehicle assembly contracts with customers differ with respect to the ownership of components
related to the assembly process. Under contracts where the Company acts as principal, purchased components in assembled vehicles are included in our inventory, accounts
payable and cost of sales. These costs are reflected in the revenue recognized from the sale of the final assembled vehicle to the customer
and are included in accounts receivable. Where a contract provides that the primary components are held on
consignment by the Company, the revenue recognized principally reflects the assembly fee.
The
Company also performs tooling and engineering activities for its customers that are not part of a long-term production arrangement.
Tooling and engineering revenue is recognized at a point in time or over time depending, among other considerations, on whether
the Company has an enforceable right to payment plus a reasonable profit, for performance completed to date. Over-time recognition
utilizes costs incurred to date relative to total estimated costs at completion, to measure progress toward satisfying performance
obligations. Revenue is recognized as control is transferred to customers, in an amount that reflects the consideration the Company
expects to be entitled to in exchange for those goods and services. For the year ended December 31, 2023, total tooling and engineering
sales were $785 million [2022 - $731 million].
The
Company’s customers pay for products received in accordance with payment terms that are customary in the industry, typically 30
to 90 days. The Company’s contracts with its customers do not have significant financing components.
Taxes
assessed by a governmental authority that are both imposed on, and concurrent with, a specific revenue-producing transaction that
are collected by the Company from a customer are excluded from revenue.
Contract
Assets and Liabilities
The
Company’s contract assets relate to the right to consideration for work completed but not yet billed and are included in Accounts
Receivable. Amounts may not exceed their net realizable value. As at December 31, 2023, the Company’s unbilled accounts receivable
balance was $765 million [2022 - $571 million]. Contract assets do not include the costs of obtaining or fulfilling a contract
with a customer, as these amounts are generally expensed as incurred.
Customer
advances are recorded as deferred revenue [a contract liability]. As at December 31, 2023 the contract liability balance was $570
million [2022 - $347 million]. As performance obligations were satisfied during 2023, the Company recognized $87 million [2022
- $130 million] of previously recorded contract liabilities into revenue.
2023 Annual Financial Statements 5
MAGNA
INTERNATIONAL INC.
NOTES
TO CONSOLIDATED FINANCIAL STATEMENTS
[All
amounts in U.S. dollars and all tabular amounts in millions, except per share figures, unless otherwise noted]
Government
assistance
The
Company makes periodic applications for financial assistance under available government assistance programs in the various jurisdictions
that the Company operates. Grants relating to capital expenditures are reflected as a reduction of the cost of the related assets.
Grants relating to current operating expenditures may be deferred and recognized in the consolidated statement of income over
the period necessary to match them with the costs that they are intended to compensate and are presented as a reduction of the
related expense. The Company also receives tax credits and tax super allowances, the benefits of which are recorded as a reduction
of income tax expense. In addition, the Company receives loans which are recorded as liabilities in amounts equal to the cash
received. When a government loan is issued to the Company at a below-market rate of interest, the loan is initially recorded at
its net present value and accreted to its face value over the period of the loan. The benefit of the below-market rate of interest
is accounted for similar to a government grant and is measured as the difference between the initial carrying value of the loan
and the cash proceeds received.
Research
and development
Costs
incurred in connection with research and development activities, to the extent not recoverable from the Company’s customers, are
expensed as incurred. For the years ended December 31, 2023 and 2022, research and development costs charged to expense, net of reimbursements, were $862
million and $649 million, respectively.
Restructuring
Restructuring
costs generally include employee termination benefits, as well as other costs resulting from restructuring actions. These actions
may result in employees receiving voluntary or involuntary termination benefits, which are mainly pursuant to union or other contractual
agreements or statutory requirements. Voluntary termination benefits are accrued when an employee accepts the related offer. Involuntary
termination benefits are accrued upon the commitment to a termination plan and when liabilities are determined to be probable
and estimable. Additional elements of severance and termination benefits associated with nonrecurring benefits may be recognized
rateably over each employee’s required future service period. All other restructuring costs are expensed as incurred.
Earnings
per Common Share
Basic
earnings per Common Share are calculated on net income attributable to Magna International Inc. using the weighted average number
of Common Shares outstanding during the year.
Diluted
earnings per Common Share are calculated on the weighted average number of Common Shares outstanding, including an adjustment
for stock options outstanding using the treasury stock method.
FUTURE
ACCOUNTING STANDARDS
Segment
Reporting
In
November 2023, the FASB issued ASU No. 2023-07, “Segment Reporting (Topic 280): Improvements to Reportable Segment Disclosures”,
which expands disclosure requirements, including enhanced disclosures of significant segment expenses. The amendments of this
ASU are effective for the Company’s December 31, 2024 annual reporting period, and interim periods beginning in the first
quarter of fiscal 2025. The adoption of ASU No. 2023-07 is not expected to have a significant impact on the Company’s consolidated
financial statements.
Income
Tax Disclosures
In
December 2023, the FASB issued ASU No. 2023-09, “Income Taxes (Topic 740): Improvements to Income Tax Disclosures”,
which expands existing guidance to require companies to disclose, among other items, specific categories in the rate reconciliation,
and income taxes paid disaggregated by jurisdiction. The amendments are effective for the Company’s December 31, 2025 annual
reporting period and is not expected to have a significant impact on the Company’s consolidated financial statements.
2023 Annual Financial Statements 6
MAGNA
INTERNATIONAL INC.
NOTES
TO CONSOLIDATED FINANCIAL STATEMENTS
[All
amounts in U.S. dollars and all tabular amounts in millions, except per share figures, unless otherwise noted]
Other
expense, net consists of significant items such as: impairment charges; restructuring costs generally related to significant plant
closures or consolidations; net losses (gains) on investments; gains or losses on disposal of facilities or businesses; and other
items not reflective of on-going operating profit or loss. Other expense, net consists of:
| | |
2023 | | |
2022 | |
| Investments [a] | |
$ | 201 | | |
$ | 221 | |
| Restructuring[b] | |
| 148 | | |
| 22 | |
| Veoneer Active Safety Business transaction costs [c] | |
| 23 | | |
| — | |
| Impairments and loss on sale of operations in Russia [d] | |
| 16 | | |
| 376 | |
| Loss on sale of business [e] | |
| — | | |
| 58 | |
| Impairments [f] | |
| — | | |
| 26 | |
| Other expense, net | |
$ | 388 | | |
$ | 703 | |
| | |
2023 | | |
2022 | |
| Revaluation of public company warrants | |
$ | 110 | | |
$ | 173 | |
| Non-cash impairment charges[i] | |
| 90 | | |
| — | |
| Revaluation of public and private equity investments | |
| 1 | | |
| 49 | |
| Net gain on sale of public equity investments | |
| — | | |
| (1 | ) |
| Other expense, net | |
| 201 | | |
| 221 | |
| Tax effect | |
| (28 | ) | |
| (53 | ) |
| Net loss attributable to Magna | |
$ | 173 | | |
$ | 168 | |
| [i] | The
non-cash impairment charges relate to impairments of private equity investments and related long-term receivables within Other
assets. |
For
the year ended December 31, 2023, the Company recorded restructuring charges of $117 million [$97 million after tax] in its Power & Vision segment, and $31 million [$27 million after tax] in its Body Exteriors & Structures segment, respectively.
For
the year ended December 31, 2022, the Company recorded restructuring charges of $22 million [$22 million after tax] for its Power & Vision segment.
| [c] | Veoneer
Active Safety Business transaction costs |
During
2023, the Company incurred $23 million [$22 million after tax] of transaction costs related to the acquisition of the Veoneer
Active Safety Business [“Veoneer AS”]. Refer to Note 7, “Business Combinations”, in these consolidated
financial statements.
| [d] | Impairments
and loss on sale of operations in Russia |
During
2023, the Company completed the sale of all of its investments in Russia which resulted in a loss of $16 million [$16
million after tax] including a net cash outflow of $23 million.
2023 Annual Financial Statements 7
MAGNA
INTERNATIONAL INC.
NOTES
TO CONSOLIDATED FINANCIAL STATEMENTS
[All
amounts in U.S. dollars and all tabular amounts in millions, except per share figures, unless otherwise noted]
During
2022, the Company recorded a $376 million [$361 million after tax] impairment charge related to its investment in Russia as a
result of the expected lack of future cashflows and the uncertainties connected with the Russian economy. This included net asset
impairments of $173 million and a $203 million reserve against the related foreign currency translation losses that were included
in accumulated other comprehensive loss. The net asset impairments consisted of $163 million and $10 million in our Body Exteriors
& Structures and Seating Systems segments, respectively.
| [e] | Loss
on sale of business |
During
the fourth quarter of 2022, the Company entered into an agreement to sell a European Power & Vision operation. Under the terms
of the arrangement, the Company was contractually obligated to provide the buyer with up to $42 million of funding, resulting
in a loss of $58 million [$57 million after tax]. During the first quarter of 2023, the Company completed the sale of this operation
which resulted in a net cash outflow of $25 million.
During
2022, the Company recorded impairment charges of $22 million [$21 million after tax] in its Body Exteriors & Structures segment
and $4 million [$3 million after tax] in its Power & Vision segment, respectively.
Earnings
per share are computed as follows:
| | |
2023 | | |
2022 | |
| Basic earnings per Common Share: | |
| | | |
| | |
| | |
| | | |
| | |
| Net income attributable to Magna International Inc. | |
$ | 1,213 | | |
$ | 592 | |
| | |
| | | |
| | |
| Weighted average number of Common Shares outstanding during the year | |
| 286.2 | | |
| 290.4 | |
| | |
| | | |
| | |
| Basic earnings per Common Share | |
$ | 4.24 | | |
$ | 2.04 | |
| | |
| | | |
| | |
| Diluted earnings per Common Share [a]: | |
| | | |
| | |
| | |
| | | |
| | |
| Net income attributable to Magna International Inc. | |
$ | 1,213 | | |
$ | 592 | |
| | |
| | | |
| | |
| Weighted average number of Common Shares outstanding during the year | |
| 286.2 | | |
| 290.4 | |
| Stock options and restricted stock | |
| 0.4 | | |
| 0.8 | |
| | |
| 286.6 | | |
| 291.2 | |
| | |
| | | |
| | |
| Diluted earnings per Common Share | |
$ | 4.23 | | |
$ | 2.03 | |
| [a] | Diluted
earnings per Common Share exclude 2.8 million [2022 – 1.3 million] Common Shares
issuable under the Company’s Incentive Stock Option Plan because these options were not
“in-the-money”. The dilutive effect of participating securities using the two-class
method was excluded from the calculation of earnings per share because the effect would
be immaterial. |
2023 Annual Financial Statements 8
MAGNA
INTERNATIONAL INC.
NOTES
TO CONSOLIDATED FINANCIAL STATEMENTS
[All
amounts in U.S. dollars and all tabular amounts in millions, except per share figures, unless otherwise noted]
| 6. | DETAILS
OF CASH FROM OPERATING ACTIVITIES |
| [a] | Cash
and cash equivalents consist of: |
| | |
2023 | | |
2022 | |
| Bank term deposits and bankers’ acceptances | |
$ | 502 | | |
$ | 720 | |
| Cash | |
| 696 | | |
| 514 | |
| | |
$ | 1,198 | | |
$ | 1,234 | |
| [b] | Items
not involving current cash flows: |
| | |
2023 | | |
2022 | |
| Depreciation | |
$ | 1,436 | | |
$ | 1,373 | |
| Amortization of acquired intangible assets | |
| 88 | | |
| 46 | |
| Amortization of other assets and intangible assets included in cost of goods sold | |
| 224 | | |
| 169 | |
| Deferred revenue amortization | |
| (159 | ) | |
| (201 | ) |
| Other non-cash charges | |
| 41 | | |
| 21 | |
| Deferred tax recovery | |
| (261 | ) | |
| (202 | ) |
| Equity income less than (in excess of) dividends received | |
| 37 | | |
| (24 | ) |
| Non-cash portion of Other expense, net [note 4] | |
| 236 | | |
| 594 | |
| | |
$ | 1,642 | | |
$ | 1,776 | |
| [c] | Changes
in operating assets and liabilities: |
| | |
2023 | | |
2022 | |
| Accounts receivable | |
$ | (819 | ) | |
$ | (798 | ) |
| Inventories | |
| (196 | ) | |
| (448 | ) |
| Prepaid expenses and other | |
| 15 | | |
| (43 | ) |
| Accounts payable | |
| 609 | | |
| 812 | |
| Accrued salaries and wages | |
| (23 | ) | |
| 20 | |
| Other accrued liabilities | |
| 636 | | |
| 250 | |
| Income taxes receivable | |
| (1 | ) | |
| (115 | ) |
| | |
$ | 221 | | |
$ | (322 | ) |
2023 Annual Financial Statements 9
MAGNA
INTERNATIONAL INC.
NOTES
TO CONSOLIDATED FINANCIAL STATEMENTS
[All
amounts in U.S. dollars and all tabular amounts in millions, except per share figures, unless otherwise noted]
On
June 1, 2023, the Company completed the acquisition of 100% of the common shares and voting interests of the entities holding
the Veoneer Active Safety Business. Veoneer AS supplies active safety products globally including active safety integration systems,
radar, camera systems, internal cabin sensing, thermal sensing, and light detection. The purchase price was $1,438 million [net
of $111 million cash acquired].
The
acquisition of Veoneer AS was accounted for as a business combination and is recorded in the Company’s Power & Vision
segment. The Company recorded a purchase price allocation for the assets acquired and liabilities assumed based on their estimated
fair values as of June 1, 2023. The following table summarizes the preliminary purchase price allocation:
| Non-cash working capital | |
$ | 100 | |
| Fixed assets | |
| 245 | |
| Other assets | |
| 96 | |
| Intangible assets | |
| 459 | |
| Goodwill | |
| 670 | |
| Other liabilities | |
| (98 | ) |
| Deferred tax liabilities | |
| (34 | ) |
| Purchase price | |
| 1,438 | |
| Receivable from seller | |
| 37 | |
| Net cash outflow | |
$ | 1,475 | |
The
estimated fair values of the assets acquired and liabilities assumed are based on the Company’s preliminary estimates and
assumptions. The preliminary purchase price allocation is subject to change within the measurement period and may be subsequently
adjusted to reflect final valuation results and other adjustments, primarily related to measurement of fixed assets and measurement
of intangible assets and goodwill.
Intangible
assets consist primarily of amounts recognized for the fair value of customer relationship intangibles and technology. These finite-lived
intangible assets are being amortized on a straight-line basis over a 7 year estimated useful life. Recognized goodwill is attributable
to the assembled workforce, expected synergies and other intangible assets that do not qualify for separate recognition, and is
not deductible for tax purposes.
On
September 11, 2022, Magna invested $25 million in Yulu Mobility, an electrified mobility provider in India. The investment in
Yulu Mobility has been recorded in investments on the consolidated balance sheets.
Magna
and Yulu Mobility also established a new battery swapping entity, Magna Yuma, to support electrification of mobility and required
infrastructure. Under the terms of the arrangement, Yulu Mobility contributed certain assets and intellectual property for a 49%
interest in Magna Yuma and Magna contributed cash of $52 million for a 51% controlling interest in Magna Yuma. The investment
in Magna Yuma was accounted for as a business combination and resulted in the recognition of fixed assets of $2 million, goodwill
of $20 million, intangible assets of $33 million, deferred tax liabilities of $8 million and non-controlling interests of $47
million.
2023 Annual Financial Statements 10
MAGNA
INTERNATIONAL INC.
NOTES
TO CONSOLIDATED FINANCIAL STATEMENTS
[All
amounts in U.S. dollars and all tabular amounts in millions, except per share figures, unless otherwise noted]
Inventories
consist of:
| | |
2023 | | |
2022 | |
| Raw materials and supplies | |
$ | 1,861 | | |
$ | 1,640 | |
| Work-in-process | |
| 450 | | |
| 427 | |
| Finished goods | |
| 569 | | |
| 537 | |
| Tooling and engineering | |
| 1,726 | | |
| 1,576 | |
| | |
$ | 4,606 | | |
$ | 4,180 | |
Tooling
and engineering inventory represents costs incurred on tooling and engineering services contracts in excess of billed and unbilled
amounts included in accounts receivable.
| | |
2023 | | |
2022 | |
| Equity method investments [a] | |
$ | 987 | | |
$ | 997 | |
| Public and private equity investments | |
| 230 | | |
| 290 | |
| Warrants [b] | |
| 34 | | |
| 142 | |
| Debt investments | |
| 22 | | |
| — | |
| | |
$ | 1,273 | | |
$ | 1,429 | |
| [a] | The
ownership percentages and carrying values of the Company’s principal equity method investments
at December 31 were as follows [in millions, except percentages]: |
| | |
| | |
2023 | | |
2022 | |
| LG Magna e-Powertrain Co., Ltd. [i] | |
| 49.0 | % | |
$ | 405 | | |
$ | 420 | |
| Litens Automotive Partnership [ii] | |
| 76.7 | % | |
$ | 332 | | |
$ | 337 | |
| Hubei HAPM Magna Seating Systems Co., Ltd. | |
| 49.9 | % | |
$ | 129 | | |
$ | 120 | |
| Beijing Electric Vehicle Co., Ltd. | |
| 49.0 | % | |
$ | 95 | | |
$ | 91 | |
| [i] | LG
Magna e-Powertrain [“LGM”] is a variable interest entity [“VIE’’]
and depends on the Company and LG Electronics for any additional cash needs. The Company
cannot make key operating decisions considered the most significant to the VIE, and is
therefore not the primary beneficiary. The Company’s known maximum exposure to
loss approximated the carrying value of its investment balance as at December 31, 2023. |
| [ii] | The
Company accounts for its investments under the equity method of accounting as a result
of significant participating rights that prevent control. |
| [b] | In
October 2020, the Company signed agreements with Fisker Inc. [“Fisker”] for
the platform sharing, engineering and manufacturing of the Fisker Ocean SUV. In connection
with the arrangement, Fisker issued approximately 19.5 million penny warrants to the
Company to purchase common stock, which vested during 2021 and 2022 based on specified
milestones for a total value of $320 million. The initial value attributable to the warrants
was deferred within other accrued liabilities and other long-term liabilities and is
being recognized in income as performance obligations are satisfied. |
Cumulative
unrealized gains and losses on equity securities held as at December 31, 2023 were $28 million and $323 million [$74 million and
$205 million as at December 31, 2022], respectively.
2023 Annual Financial Statements 11
MAGNA
INTERNATIONAL INC.
NOTES
TO CONSOLIDATED FINANCIAL STATEMENTS
[All
amounts in U.S. dollars and all tabular amounts in millions, except per share figures, unless otherwise noted]
A summary
of the total financial results, as reported by the Company's equity method investees, in the aggregate, at December 31 was as follows:
| Summarized Balance Sheets | |
2023 | | |
2022 | |
| Current assets | |
$ | 2,516 | | |
$ | 2,266 | |
| | |
| | | |
| | |
| Non-current assets | |
$ | 1,884 | | |
$ | 1,866 | |
| | |
| | | |
| | |
| Current liabilities | |
$ | 1,702 | | |
$ | 1,555 | |
| | |
| | | |
| | |
| Long-term liabilities | |
$ | 876 | | |
$ | 715 | |
| Summarized Income Statements | |
2023 | | |
2022 | |
| Sales | |
$ | 5,008 | | |
$ | 4,447 | |
| Cost of goods sold & expenses | |
| 4,863 | | |
| 4,363 | |
| Net income | |
$ | 145 | | |
$ | 84 | |
Sales
to equity method investees were approximately $83 million and $51 million for the years ended December 31, 2023 and 2022, respectively.
| Fixed assets consist of: | |
2023 | | |
2022 | |
| Cost | |
| | | |
| | |
| Land | |
$ | 188 | | |
$ | 181 | |
| Buildings | |
| 3,014 | | |
| 2,740 | |
| Machinery and equipment | |
| 19,226 | | |
| 17,258 | |
| | |
| 22,428 | | |
| 20,179 | |
| Accumulated depreciation | |
| | | |
| | |
| Buildings | |
| (1,394 | ) | |
| (1,310 | ) |
| Machinery and equipment | |
| (11,416 | ) | |
| (10,696 | ) |
| | |
$ | 9,618 | | |
$ | 8,173 | |
Included in the cost of fixed
assets are construction in progress expenditures of $2.6 billion [2022 - $1.5 billion] that have not been depreciated.
The following is a continuity
of goodwill by segment:
| | |
Body Exteriors
& Structures | | |
Power
& Vision | | |
Seating
Systems | | |
Complete
Vehicles | | |
Corporate | | |
Total | |
| Balance, December 31, 2021 | |
| 471 | | |
| 1,269 | | |
| 270 | | |
| 112 | | |
| — | | |
| 2,122 | |
| Acquisitions [note 7] | |
| — | | |
| — | | |
| — | | |
| — | | |
| 20 | | |
| 20 | |
| Foreign exchange and other | |
| (23 | ) | |
| (71 | ) | |
| (10 | ) | |
| (7 | ) | |
| — | | |
| (111 | ) |
| Balance, December 31, 2022 | |
| 448 | | |
| 1,198 | | |
| 260 | | |
| 105 | | |
| 20 | | |
| 2,031 | |
| Acquisitions [note 7] | |
| — | | |
| 670 | | |
| — | | |
| — | | |
| — | | |
| 670 | |
| Foreign exchange and other | |
| 4 | | |
| 60 | | |
| (2 | ) | |
| 4 | | |
| — | | |
| 66 | |
| Balance, December 31, 2023 | |
$ | 452 | | |
$ | 1,928 | | |
$ | 258 | | |
$ | 109 | | |
$ | 20 | | |
$ | 2,767 | |
2023 Annual Financial Statements 12
MAGNA
INTERNATIONAL INC.
NOTES
TO CONSOLIDATED FINANCIAL STATEMENTS
[All
amounts in U.S. dollars and all tabular amounts in millions, except per share figures, unless otherwise noted]
| [a] | The provision for income taxes differs from the expense that would be obtained
by applying the Canadian statutory income tax rate as a result of the following: |
| | |
2023 | | |
2022 | |
| Canadian statutory income tax rate | |
| 26.5 | % | |
| 26.5 | % |
| Tax on repatriation of foreign earnings | |
| 3.6 | | |
| 5.3 | |
| Net effect of losses not benefited | |
| 1.2 | | |
| 7.7 | |
| Non-taxable capital losses (gains) | |
| 1.2 | | |
| (0.3 | ) |
| Reserve for uncertain tax positions | |
| 0.6 | | |
| 0.4 | |
| Earnings of equity accounted investees | |
| (1.4 | ) | |
| (1.6 | ) |
| Foreign exchange re-measurement | |
| (1.7 | ) | |
| (0.6 | ) |
| Deductible inflationary adjustments | |
| (1.7 | ) | |
| (3.3 | ) |
| Valuation allowance on deferred tax assets | |
| (3.0 | ) | |
| (2.2 | ) |
| Foreign rate differentials | |
| (3.2 | ) | |
| 0.6 | |
| Research and development tax credits | |
| (4.1 | ) | |
| (7.1 | ) |
| Others | |
| 1.9 | | |
| 1.6 | |
| Effective income tax rate | |
| 19.9 | % | |
| 27.0 | % |
| [b] | The details of income (loss) before income taxes by jurisdiction
are as follows: |
| | | |
2023 | | |
2022 | |
| Canadian | | |
$ | (184 | ) | |
$ | (57 | ) |
| Foreign | | |
| 1,790 | | |
| 935 | |
| | | |
$ | 1,606 | | |
$ | 878 | |
| [c] | The details of the income tax provision are as follows: |
| | | |
2023 | | |
2022 | |
| Current | | |
| | | |
| | |
| Canadian | | |
$ | 24 | | |
$ | 5 | |
| Foreign | | |
| 557 | | |
| 452 | |
| | | |
| 581 | | |
| 457 | |
| | | |
| | | |
| | |
| Deferred | | |
| | | |
| | |
| Canadian | | |
| (26 | ) | |
| (25 | ) |
| Foreign | | |
| (235 | ) | |
| (195 | ) |
| | | |
| (261 | ) | |
| (220 | ) |
| | | |
$ | 320 | | |
$ | 237 | |
2023 Annual Financial Statements 13
MAGNA
INTERNATIONAL INC.
NOTES
TO CONSOLIDATED FINANCIAL STATEMENTS
[All
amounts in U.S. dollars and all tabular amounts in millions, except per share figures, unless otherwise noted]
| [d] | Deferred income taxes have been provided on temporary
differences, which consist of the following: |
| | |
2023 | | |
2022 | |
| Tax depreciation in excess of (less than) book depreciation | |
$ | 33 | | |
$ | (21 | ) |
| Tax on undistributed foreign earnings | |
| 4 | | |
| (34 | ) |
| Re-measurement of deferred tax assets | |
| (8 | ) | |
| (7 | ) |
| Net tax losses (benefit) utilization | |
| (25 | ) | |
| 10 | |
| Unrealized loss on remeasurement of investments | |
| (26 | ) | |
| (48 | ) |
| Change in valuation allowance on deferred tax assets | |
| (47 | ) | |
| (19 | ) |
| Net (increase) decrease in non-deductible liabilities | |
| (63 | ) | |
| 17 | |
| Book amortization in excess of tax amortization | |
| (112 | ) | |
| (89 | ) |
| Others | |
| (17 | ) | |
| (29 | ) |
| | |
$ | (261 | ) | |
$ | (220 | ) |
| [e] | Deferred tax assets and liabilities consist of the following temporary
differences: |
| | |
2023 | | |
2022 | |
| Assets | |
| | |
| |
| Tax benefit of loss carryforwards | |
$ | 892 | | |
$ | 760 | |
| Liabilities currently not deductible for tax | |
| 400 | | |
| 269 | |
| Operating lease liabilities | |
| 399 | | |
| 367 | |
| Other assets tax value in excess of book value | |
| 150 | | |
| 87 | |
| Tax credit carryforwards | |
| 90 | | |
| 87 | |
| Unrealized losses on remeasurement of investments | |
| 79 | | |
| 37 | |
| Unrealized loss on foreign exchange hedges and retirement liabilities | |
| 44 | | |
| 70 | |
| Others | |
| 29 | | |
| 29 | |
| | |
| 2,083 | | |
| 1,706 | |
| Valuation allowance against tax benefit of loss carryforwards | |
| (597 | ) | |
| (579 | ) |
| Other valuation allowance | |
| (221 | ) | |
| (198 | ) |
| | |
$ | 1,265 | | |
$ | 929 | |
| | |
| | | |
| | |
| Liabilities | |
| | | |
| | |
| Operating lease right-of-use assets | |
| 403 | | |
| 372 | |
| Tax depreciation in excess of book depreciation | |
| 232 | | |
| 186 | |
| Tax on undistributed foreign earnings | |
| 171 | | |
| 171 | |
| Unrealized gain on foreign exchange hedges and retirement liabilities | |
| 22 | | |
| 21 | |
| | |
| 828 | | |
| 750 | |
| | |
| | | |
| | |
| Net deferred tax assets | |
$ | 437 | | |
$ | 179 | |
The net
deferred tax assets are presented on the consolidated balance sheet in the following categories:
| | |
2023 | | |
2022 | |
| Long-term deferred tax assets | |
$ | 621 | | |
$ | 491 | |
| Long-term deferred tax liabilities | |
| (184 | ) | |
| (312 | ) |
| | |
$ | 437 | | |
$ | 179 | |
| [f] | Deferred income taxes have not been provided on $5.3 billion of undistributed
earnings of certain foreign subsidiaries, as the Company has concluded that such earnings should not give rise to additional tax
liabilities upon repatriation or are indefinitely reinvested. A determination of the amount of the unrecognized tax liability relating
to the remittance of such undistributed earnings is not practicable. |
2023 Annual Financial Statements 14
MAGNA
INTERNATIONAL INC.
NOTES
TO CONSOLIDATED FINANCIAL STATEMENTS
[All
amounts in U.S. dollars and all tabular amounts in millions, except per share figures, unless otherwise noted]
| [g] | Income taxes paid in cash [net of refunds] were $546 million for the year
ended December 31, 2023 [2022 - $560 million]. |
| [h] | As at December 31, 2023, the Company had domestic and foreign operating
loss carryforwards of $3.5 billion and tax credit carryforwards of $90 million. Approximately $2.3 billion of the operating losses
can be carried forward indefinitely. The remaining operating losses and tax credit carryforwards expire between 2024 and 2043. |
| [i] | As at December 31, 2023 and 2022, the Company's gross unrecognized tax benefits
were $220 million and $142 million, respectively [excluding interest and penalties], of which $188 million and $135 million, respectively,
if recognized, would affect the Company's effective tax rate. The gross unrecognized tax benefits differ from the amount that would
affect the Company's effective tax rate due primarily to the impact of the valuation allowance on deferred tax assets. A summary
of the changes in gross unrecognized tax benefits is as follows: |
| | |
2023 | | |
2022 | |
| Balance, beginning of year | |
$ | 142 | | |
$ | 142 | |
| Increase based on tax positions related to current year | |
| 28 | | |
| 52 | |
| Decrease based on tax positions of prior years | |
| — | | |
| (17 | ) |
| Settlements | |
| 1 | | |
| (10 | ) |
| Foreign currency translation | |
| 5 | | |
| (4 | ) |
| Statute expirations | |
| (14 | ) | |
| (21 | ) |
| Acquisitions [note 7] | |
| 58 | | |
| — | |
| | |
$ | 220 | | |
$ | 142 | |
As at December 31, 2023,
the Company recorded interest and penalties on unrecognized tax benefits of $35 million [2022 – $29 million], which reflects
an increase of $6 million [2022 – $3 million] in expenses related to changes in its reserves for interest and penalties.
The
Company operates in multiple jurisdictions and its tax returns are periodically audited or subject to review by both domestic and
foreign tax authorities. During the next twelve months, it is reasonably possible that, as a result of audit settlements, the conclusion
of current examinations, or the expiration of the statute of limitations in several jurisdictions, the Company may decrease the
amount of its gross unrecognized tax benefits [including interest and penalties] by approximately $31 million, which if recognized,
would affect its effective tax rate.
The Company
considers its significant tax jurisdictions to include Canada, the United States, Austria, Germany, Mexico and China. With few
exceptions, the Company remains subject to income tax examination in Germany for years after 2011, China and Mexico for years
after 2017, Canada and Austria for years after 2018, and U.S. federal jurisdiction for years after 2019.
2023 Annual Financial Statements 15
MAGNA
INTERNATIONAL INC.
NOTES
TO CONSOLIDATED FINANCIAL STATEMENTS
[All
amounts in U.S. dollars and all tabular amounts in millions, except per share figures, unless otherwise noted]
Intangible assets consist of:
| | |
Remaining | | |
| | |
| |
| | |
weighted average | | |
| | |
| |
| | |
useful life in years | | |
2023 | | |
2022 | |
| Cost | |
| | | |
| | | |
| | |
| Customer relationship intangibles | |
| 7 | | |
$ | 514 | | |
$ | 388 | |
| Patents and Technology | |
| 7 | | |
| 613 | | |
| 249 | |
| Computer software and other licenses | |
| 6 | | |
| 621 | | |
| 529 | |
| | |
| | | |
| 1,748 | | |
| 1,166 | |
| Accumulated depreciation | |
| | | |
| | | |
| | |
| Customer relationship intangibles | |
| | | |
| (236 | ) | |
| (194 | ) |
| Patents and Technology | |
| | | |
| (163 | ) | |
| (118 | ) |
| Computer software and other licenses | |
| | | |
| (473 | ) | |
| (402 | ) |
| | |
| | | |
$ | 876 | | |
$ | 452 | |
The Company recorded $137 million
and $106 million of amortization expense related to finite-lived intangible assets for the years ended December 31, 2023 and 2022,
respectively. The Company currently estimates annual amortization expense to be $153 million for 2024, $143 million for 2025, $131
million for 2026, $120 million for 2027 and $104 million for 2028.
Other assets consist of:
| | |
2023 | | |
2022 | |
| Preproduction costs related to long-term supply agreements | |
$ | 835 | | |
$ | 679 | |
| Long-term receivables | |
| 321 | | |
| 262 | |
| Unrealized gain on cash flow hedges [note 22] | |
| 4 | | |
| 26 | |
| Pension overfunded status [note 18[a]] | |
| 41 | | |
| 41 | |
| Other | |
| 118 | | |
| 85 | |
| | |
$ | 1,319 | | |
$ | 1,093 | |
The following is a continuity of the Company's
warranty accruals:
| | |
2023 | | |
2022 | |
| Balance, beginning of year | |
$ | 257 | | |
$ | 247 | |
| Expense, net | |
| 85 | | |
| 101 | |
| Settlements | |
| (91 | ) | |
| (77 | ) |
| Business combination [note 7] | |
| 12 | | |
| — | |
| Foreign exchange and other | |
| 7 | | |
| (14 | ) |
| | |
$ | 270 | | |
$ | 257 | |
2023 Annual Financial Statements 16
MAGNA
INTERNATIONAL INC.
NOTES
TO CONSOLIDATED FINANCIAL STATEMENTS
[All
amounts in U.S. dollars and all tabular amounts in millions, except per share figures, unless otherwise noted]
Short-term borrowings
On May 26, 2023, the Company
extended the maturity date of its $800 million 364-day syndicated revolving credit facility from June 24, 2023 to June 24, 2024.
The facility can be drawn in U.S. dollars or Canadian dollars. The Company had not borrowed any funds under this credit facility
as at December 31, 2023 and 2022.
| [b] | Commercial Paper Program |
The
Company has a U.S. commercial paper program [the "U.S. Program"] and a euro-commercial paper program [the "euro-Program"].
Under the U.S. Program, the Company may issue U.S. commercial paper notes [“the U.S. notes”] up to a maximum aggregate
amount of U.S. $2 billion. Under the euro-Program, the Company may issue euro-commercial paper notes [the "euro notes"]
up to a maximum aggregate amount of €500 million or its equivalent in alternative currencies. The U.S. notes and the euro
notes are guaranteed by the Company's existing global credit facility. As at December 31, 2023, $299 million of U.S. notes were
outstanding, with a weighted average interest rate of 5.57% and $210 million of Euro notes were outstanding, with a weighted average
interest rate of 4.02%. Maturities on amounts outstanding are less than three months. No amounts were outstanding as at December
31, 2022.
Long-term borrowings
| [a] | The Company's long-term debt, net of unamortized issuance costs, is substantially
uncollateralized and consists of the following: |
| | |
2023 | | |
2022 | |
| Senior Notes [note 16 [c]] | |
| | | |
| | |
| | |
| | | |
| | |
| $750 million Senior Notes due 2024 at 3.625% | |
$ | 750 | | |
| 749 | |
| $650 million Senior Notes due 2025 at 4.150% | |
| 648 | | |
| 647 | |
| $300 million Senior Notes due 2026 at 5.980% | |
| 298 | | |
| — | |
| €600 million Senior Notes due 2027 at 1.500% | |
| 662 | | |
| 640 | |
| $750 million Senior Notes due 2030 at 2.450% | |
| 745 | | |
| 744 | |
| Cdn$350 million Senior Notes due 2031 at 4.950% | |
| 263 | | |
| — | |
| €550 million Senior Notes due 2032 at 4.375% | |
| 604 | | |
| — | |
| $500 million Senior Notes due 2033 at 5.500% | |
| 495 | | |
| — | |
| €550 million Senior Notes due 2023 at 1.900% | |
| — | | |
| 588 | |
| Bank
term debt at a weighted average interest rate of 5.99% [2022 – 3.98%], denominated primarily
in USD and Chinese Renminbi [note 16 [d]] | |
| 510 | | |
| 114 | |
| Government loans at a weighted average interest rate of 0.12% [2022 – 0.12%], denominated
primarily in Canadian dollar and euro | |
| 8 | | |
| 8 | |
| Other | |
| 11 | | |
| 11 | |
| | |
| 4,994 | | |
| 3,501 | |
| Less due within one year | |
| 819 | | |
| 654 | |
| | |
$ | 4,175 | | |
$ | 2,847 | |
2023 Annual Financial Statements 17
MAGNA
INTERNATIONAL INC.
NOTES
TO CONSOLIDATED FINANCIAL STATEMENTS
[All
amounts in U.S. dollars and all tabular amounts in millions, except per share figures, unless otherwise noted]
| [b] | Future principal repayments on long-term debt are estimated to be as follows: |
| 2024 | | |
$ | 819 | |
| 2025 | | |
| 693 | |
| 2026 | | |
| 408 | |
| 2027 | | |
| 666 | |
| 2028 | | |
| 301 | |
| Thereafter | | |
| 2,125 | |
| | | |
$ | 5,012 | |
| [c] | During the first quarter of 2023, the Company
issued the following Senior Notes: |
| |
Issuance Date |
|
Maturity Date |
| Cdn$350 million Senior Notes at 4.950% |
March 10, 2023 |
|
January 31, 2031 |
| €550 million Senior Notes at 4.375% |
March 17, 2023 |
|
March 17, 2032 |
| $300 million Senior Notes at 5.980% |
March 21, 2023 |
|
March 21, 2026 |
| $500 million Senior Notes at 5.500% |
March 21, 2023 |
|
March 21, 2033 |
All of the Senior Notes
pay a fixed rate of interest semi-annually except for the €550 million and €600 million Senior Notes which pay a fixed
rate of interest annually. The Senior Notes are unsecured obligations and do not include any financial covenants. The Company may
redeem the Senior Notes in whole or in part at any time, at specified redemption prices determined in accordance with the terms
of each of the respective indentures governing the Senior Notes.
| [d] | On March 6, 2023, the Company entered into a syndicated, unsecured, delayed
draw term loan [the “Term Loan”] with a 3-year tranche of $800 million and 5-year tranche of $600 million. During the
second quarter of 2023, the Company drew $100 million from the 3-year tranche and $300 million from the 5-year tranche of the Term
Loan. The amounts are drawn in advances of 1, 3 or 6-month loans and may be rolled over until the end of the 3- and 5-year terms.
The remaining balance of the facility was subsequently cancelled. |
| [e] | On April 27, 2023, the Company amended its $2.7 billion syndicated revolving
credit facility, including to: (i) extend the maturity date from June 24, 2027 to June 24, 2028, and (ii) cancel the $150 million
Asian tranche and allocate the equivalent amount to the Canadian tranche. The Company had limited borrowing under this credit facility.
The facility also includes a $150 million Mexican tranche and a tranche for Canada, U.S. and Europe, which is fully transferable
between jurisdictions and can be drawn in U.S. dollars, Canadian dollars or Euros. As at December 31, 2023, there was no
amount outstanding [2022 - $1 million]. |
| [f] | Interest expense, net includes: |
| | |
2023 | | |
2022 | |
| Interest expense | |
| | | |
| | |
| Current | |
$ | 80 | | |
$ | 25 | |
| Long-term | |
| 162 | | |
| 101 | |
| | |
| 242 | | |
| 126 | |
| Interest income | |
| (86 | ) | |
| (45 | ) |
| Interest expense, net | |
$ | 156 | | |
$ | 81 | |
| [g] | Interest paid in cash was $242 million for the year ended December 31, 2023
[2022 - $128 million]. |
2023 Annual Financial Statements 18
MAGNA
INTERNATIONAL INC.
NOTES
TO CONSOLIDATED FINANCIAL STATEMENTS
[All
amounts in U.S. dollars and all tabular amounts in millions, except per share figures, unless otherwise noted]
| [a] | The Company has entered into leases primarily
for real estate, manufacturing equipment and vehicles with terms that range from 1 to 10 years, excluding land use rights which
generally extend over 90 years. These leases often include options to extend the term of the lease, most often for a period of
5 years. When it is reasonably certain that the option will be exercised, the impact of the option is included in the lease term
for purposes of determining total future lease payments. |
Costs associated with
the Company's operating lease expense were as follows:
| | |
2023 | | |
2022 | |
| Operating lease expense | |
$ | 353 | | |
$ | 344 | |
| Short-term lease expense | |
| 18 | | |
| 25 | |
| Variable lease expense | |
| 27 | | |
| 26 | |
| Total lease expense | |
$ | 398 | | |
$ | 395 | |
Supplemental information related to the
Company's operating leases is as follows:
| | |
2023 | | |
2022 | |
| Operating cash flows – cash paid | |
$ | 366 | | |
$ | 375 | |
| New right-of-use assets | |
$ | 320 | | |
$ | 167 | |
| Weighted-average remaining lease term | |
| 8 years | | |
| 8 years | |
| Weighted-average discount rate | |
| 5.4 | % | |
| 4.7 | % |
| [b] | Operating lease liabilities consist of: |
| Current operating liabilities | |
$ | 399 | | |
$ | 276 | |
| Non-current operating lease liabilities | |
| 1,319 | | |
| 1,288 | |
| Total lease liabilities | |
$ | 1,718 | | |
$ | 1,564 | |
| [c] | Future annual payments for operating leases are as follows: |
| | | |
2023[i] | |
| 2024 | | |
$ | 326 | |
| 2025 | | |
| 291 | |
| 2026 | | |
| 244 | |
| 2027 | | |
| 215 | |
| 2028 | | |
| 186 | |
| Thereafter | | |
| 779 | |
| | | |
| 2,041 | |
| Less: amount representing interest | | |
| 323 | |
| Total lease liabilities | | |
$ | 1,718 | |
| [i] Excludes $143 million of future payments for leases, primarily for manufacturing facilities, commencing during 2024. |
| [d] | The Company's finance leases were not material for any
of the periods presented. |
2023 Annual Financial Statements 19
MAGNA
INTERNATIONAL INC.
NOTES
TO CONSOLIDATED FINANCIAL STATEMENTS
[All
amounts in U.S. dollars and all tabular amounts in millions, except per share figures, unless otherwise noted]
18. LONG-TERM
EMPLOYEE BENEFIT LIABILITIES
Long-term
employee benefit liabilities consist of:
| | |
2023 | | |
2022 | |
| Defined benefit pension plans and other [a] | |
$ | 124 | | |
$ | 146 | |
| Termination and long-term service arrangements [b] | |
| 428 | | |
| 369 | |
| Retirement medical benefits plans [c] | |
| 20 | | |
| 20 | |
| Other long-term employee benefits | |
| 19 | | |
| 13 | |
| Long-term employee benefit obligations | |
$ | 591 | | |
$ | 548 | |
| [a] | Defined
benefit pension plans |
The
Company sponsors a number of defined benefit pension plans and similar arrangements for its employees. All pension plans are funded
to at least the minimum legal funding requirements, while European defined benefit pension plans are unfunded.
The
significant weighted average actuarial assumptions adopted in measuring the Company’s obligations and costs are as follows:
| | |
2023 | | |
2022 | |
| Projected benefit obligation | |
| | | |
| | |
| Discount rate | |
| 4.7 | % | |
| 4.8 | % |
| Rate of compensation increase | |
| 3.7 | % | |
| 3.6 | % |
| | |
| | | |
| | |
| Net periodic benefit cost | |
| | | |
| | |
| Discount rate | |
| 4.5 | % | |
| 2.8 | % |
| Rate of compensation increase | |
| 3.7 | % | |
| 2.9 | % |
| Expected return on plan assets | |
| 5.7 | % | |
| 4.6 | % |
2023 Annual Financial Statements 20
MAGNA INTERNATIONAL INC.
NOTES TO CONSOLIDATED FINANCIAL STATEMENTS
[All amounts in U.S. dollars and all tabular amounts in millions,
except per share figures, unless otherwise noted]
Information
about the Company’s defined benefit pension plans is as follows:
| | |
2023 | | |
2022 | |
| Projected benefit obligation | |
| | | |
| | |
| Beginning of year | |
$ | 498 | | |
$ | 689 | |
| Current service cost | |
| 6 | | |
| 9 | |
| Interest cost | |
| 22 | | |
| 14 | |
| Actuarial gains and changes in actuarial assumptions | |
| 5 | | |
| (155 | ) |
| Benefits paid | |
| (24 | ) | |
| (31 | ) |
| Acquisition [note 7] | |
| 4 | | |
| — | |
| Divestiture | |
| (10 | ) | |
| — | |
| Foreign exchange | |
| 10 | | |
| (28 | ) |
| End of year | |
| 511 | | |
| 498 | |
| | |
| | | |
| | |
| Plan assets at fair value [i] | |
| | | |
| | |
| Beginning of year | |
| 391 | | |
| 532 | |
| Return on plan assets | |
| 41 | | |
| (107 | ) |
| Employer contributions | |
| 7 | | |
| 11 | |
| Benefits paid | |
| (19 | ) | |
| (27 | ) |
| Foreign exchange | |
| 7 | | |
| (18 | ) |
| End of year | |
| 427 | | |
| 391 | |
| | |
| | | |
| | |
| Ending funded status – Plan deficit | |
$ | 84 | | |
$ | 107 | |
| | |
| | | |
| | |
| Amounts recorded in the consolidated balance sheet | |
| | | |
| | |
| Non-current asset [note 14] | |
$ | 41 | | |
$ | 41 | |
| Current liability | |
| 1 | | |
| 2 | |
| Non-current liability | |
| 124 | | |
| 146 | |
| Net liability | |
$ | 84 | | |
$ | 107 | |
| | |
| | | |
| | |
| Amounts recorded in accumulated other comprehensive income | |
| | | |
| | |
| Unrecognized
actuarial losses | |
$ | (75 | ) | |
$ | (86 | ) |
| | |
| | | |
| | |
| Net periodic benefit cost | |
| | | |
| | |
| Current service cost | |
$ | 6 | | |
$ | 9 | |
| Interest cost | |
| 22 | | |
| 14 | |
| Return on plan assets | |
| (21 | ) | |
| (23 | ) |
| Actuarial losses | |
| 3 | | |
| 3 | |
| Net periodic benefit cost | |
$ | 10 | | |
$ | 3 | |
2023 Annual Financial Statements 21
MAGNA INTERNATIONAL INC.
NOTES TO CONSOLIDATED FINANCIAL STATEMENTS
[All amounts in U.S. dollars and all tabular amounts in millions,
except per share figures, unless otherwise noted]
| [i] | The
asset allocation of the Company’s defined benefit pension plans at December 31, 2023
and the target allocation range for 2024 are as follows: |
| | |
2024 | | |
2023 | |
| Fixed income securities | |
| 60-86 | % | |
| 67 | % |
| Equity securities | |
| 19-45 | % | |
| 28 | % |
| Cash and cash equivalents | |
| 0-10 | % | |
| 5 | % |
| | |
| 100 | % | |
| 100 | % |
Substantially
all of the plan assets’ fair value has been determined using significant observable inputs [level 2] from indirect market prices
on regulated financial exchanges.
The
expected rate of return on plan assets was determined by considering the Company’s current investment mix, the historic performance
of these investment categories and expected future performance of these investment categories.
| [b] | Termination
and long-term service arrangements |
Pursuant
to labour laws and national labour agreements in certain European countries and Mexico, the Company is obligated to provide lump
sum termination payments to employees on retirement or involuntary termination, and long service payments contingent upon persons
reaching a predefined number of years of service.
The
weighted average significant actuarial assumptions adopted in measuring the Company’s projected termination and long-term service
benefit obligations and net periodic benefit cost are as follows:
| | |
2023 | | |
2022 | |
| Discount rate | |
| 5.3 | % | |
| 4.8 | % |
| Rate of compensation increase | |
| 3.7 | % | |
| 3.5 | % |
2023 Annual Financial Statements 22
MAGNA INTERNATIONAL INC.
NOTES TO CONSOLIDATED FINANCIAL STATEMENTS
[All amounts in U.S. dollars and all tabular amounts in millions,
except per share figures, unless otherwise noted]
Information
about the Company’s termination and long-term service arrangements is as follows:
| | |
2023 | | |
2022 | |
| Projected benefit obligation | |
| | | |
| | |
| Beginning of year | |
$ | 387 | | |
$ | 467 | |
| Current service cost | |
| 16 | | |
| 13 | |
| Interest cost | |
| 20 | | |
| 11 | |
| Actuarial losses (gains) and changes in actuarial assumptions | |
| 21 | | |
| (67 | ) |
| Benefits paid | |
| (24 | ) | |
| (18 | ) |
| Foreign exchange | |
| 25 | | |
| (19 | ) |
| Ending funded status – Plan deficit | |
$ | 445 | | |
$ | 387 | |
| | |
| | | |
| | |
| Amounts recorded in the consolidated balance sheet | |
| | | |
| | |
| Current liability | |
$ | 17 | | |
$ | 18 | |
| Non-current liability | |
| 428 | | |
| 369 | |
| Net liability | |
$ | 445 | | |
$ | 387 | |
| | |
| | | |
| | |
| Amounts recorded in
accumulated other comprehensive income | |
| | | |
| | |
| Unrecognized actuarial losses | |
$ | (59 | ) | |
$ | (38 | ) |
| | |
| | | |
| | |
| Net periodic benefit cost | |
| | | |
| | |
| Current service cost | |
$ | 16 | | |
$ | 13 | |
| Interest cost | |
| 20 | | |
| 11 | |
| Actuarial losses | |
| 7 | | |
| 7 | |
| Net periodic benefit cost | |
$ | 43 | | |
$ | 31 | |
2023 Annual Financial Statements 23
MAGNA INTERNATIONAL INC.
NOTES TO CONSOLIDATED FINANCIAL STATEMENTS
[All amounts in U.S. dollars and all tabular amounts in millions,
except per share figures, unless otherwise noted]
| [c] | Retirement
medical benefits plans |
The
Company sponsors a number of retirement medical plans which were assumed on certain acquisitions in prior years. These plans are
frozen to new employees and incur no current service costs. In addition, the Company sponsors a retirement medical benefits plan
that was amended during 2009 such that substantially all employees retiring on or after August 1, 2009 no longer participate in
the plan.
The
weighted average discount rates used in measuring the Company’s projected retirement medical benefit obligations and net
periodic benefit cost are as follows:
| | |
2023 | | |
2022 | |
| Retirement medical benefit obligations | |
| 4.8 | % | |
| 5.1 | % |
| Net periodic benefit cost | |
| 5.1 | % | |
| 3.1 | % |
| Health care cost inflation | |
| 6.7 | % | |
| 6.8 | % |
Information
about the Company’s retirement medical benefits plans are as follows:
| | |
2023 | | |
2022 | |
| Projected benefit obligation | |
| | | |
| | |
| Beginning of year | |
$ | 21 | | |
$ | 27 | |
| Interest cost | |
| 1 | | |
| 1 | |
| Employer contributions | |
| 1 | | |
| — | |
| Actuarial gains and changes in actuarial assumptions | |
| (3 | ) | |
| (6 | ) |
| Benefits paid | |
| (1 | ) | |
| (1 | ) |
| Foreign exchange | |
| 2 | | |
| — | |
| Ending funded status – Plan deficit | |
$ | 21 | | |
$ | 21 | |
| | |
| | | |
| | |
| Amounts recorded in the consolidated balance sheet | |
| | | |
| | |
| Current liability | |
$ | 1 | | |
$ | 1 | |
| Non-current liability | |
| 20 | | |
| 20 | |
| Net liability | |
$ | 21 | | |
$ | 21 | |
| | |
| | | |
| | |
Amounts recorded in accumulated other comprehensive income
Unrecognized actuarial gains | |
$ | 19 | | |
$ | 17 | |
| | |
| | | |
| | |
| Net periodic benefit cost | |
| | | |
| | |
| Interest cost | |
$ | 1 | | |
$ | 1 | |
| Actuarial gains | |
| (1 | ) | |
| (1 | ) |
| Net periodic benefit cost | |
$ | — | | |
$ | — | |
2023 Annual Financial Statements 24
MAGNA INTERNATIONAL INC.
NOTES TO CONSOLIDATED FINANCIAL STATEMENTS
[All amounts in U.S. dollars and all tabular amounts in millions,
except per share figures, unless otherwise noted]
| [d] | Future
benefit payments |
| | | |
Defined
benefit
pension plans | | |
Termination
and long
service
arrangements | | |
Retirement
medical
benefits plans | | |
Total | |
| Expected employer contributions - 2024 | | |
$ | 13 | | |
$ | 17 | | |
$ | 1 | | |
$ | 31 | |
| | | |
| | | |
| | | |
| | | |
| | |
| Expected benefit payments: | | |
| | | |
| | | |
| | | |
| | |
| 2024 | | |
$ | 27 | | |
$ | 17 | | |
$ | 1 | | |
$ | 45 | |
| 2025 | | |
| 26 | | |
| 19 | | |
| 1 | | |
| 46 | |
| 2026 | | |
| 27 | | |
| 22 | | |
| 1 | | |
| 50 | |
| 2027 | | |
| 29 | | |
| 25 | | |
| 1 | | |
| 55 | |
| 2028 | | |
| 30 | | |
| 31 | | |
| 2 | | |
| 63 | |
| Thereafter | | |
| 166 | | |
| 314 | | |
| 6 | | |
| 486 | |
| | | |
$ | 305 | | |
$ | 428 | | |
$ | 12 | | |
$ | 745 | |
19. OTHER
LONG-TERM LIABILITIES
Other
long-term liabilities consist of:
| | |
2023 | | |
2022 | |
| Long-term portion of income taxes payable | |
$ | 167 | | |
$ | 136 | |
| Long-term portion of deferred revenue | |
| 223 | | |
| 207 | |
| Asset retirement obligation | |
| 37 | | |
| 35 | |
| Long-term portion of fair value of hedges [note 21] | |
| 8 | | |
| 31 | |
| Other | |
| 40 | | |
| 52 | |
| | |
$ | 475 | | |
$ | 461 | |
2023 Annual Financial Statements 25
MAGNA INTERNATIONAL INC.
NOTES TO CONSOLIDATED FINANCIAL STATEMENTS
[All amounts in U.S. dollars and all tabular amounts in millions,
except per share figures, unless otherwise noted]
20. CAPITAL
STOCK
| [a] | At
December 31, 2023, the Company’s authorized, issued and outstanding capital stock are
as follows: |
Preference
shares - issuable in series -
99,760,000
authorized preference shares, issuable in series, none of which are currently issued or outstanding.
Common
Shares -
Common
Shares without par value [unlimited amount authorized] have the following attributes:
| [i] | Each
share is entitled to one vote per share at all meetings of shareholders. |
| [ii] | Each
share shall participate equally as to dividends. |
| [b] | The
Company had Normal Course Issuer Bid in place for the 12-month periods beginning November
2021 and 2022. |
On
February 12, 2024, the Toronto Stock Exchange [“TSX”] accepted the Company’s Notice of Intention to make a Normal
Course Issuer Bid relating to the purchase for cancellation, as well as purchases to fund the Company’s stock-based compensation
awards or programs and/or the Company’s obligations to its deferred profit sharing plans, of up to 0.3 million Magna Common
Shares [the “2024 Bid”], representing approximately 0.11% of the Company’s public float of Common Shares. The
Bid commenced on February 15, 2024 and will terminate no later than February 14, 2025.
The
following is a summary of the Normal Course Issuer Bids [number of shares in the table below are expressed in whole numbers]:
| | | |
2023 | | |
2022 | |
| | | |
Shares
purchased | | |
Cash
amount | | |
Shares
purchased | | |
Cash
amount | |
| 2021 Bid | | |
| — | | |
$ | — | | |
| 12,554,879 | | |
$ | 779 | |
| 2022 Bid | | |
| 239,296 | | |
| 13 | | |
| 6,608 | | |
| 1 | |
| | | |
| 239,296 | | |
$ | 13 | | |
| 12,561,487 | | |
$ | 780 | |
| [c] | The
following table presents the maximum number of shares that would be outstanding if all
the dilutive instruments outstanding at February 22, 2024 were exercised or converted: |
| Common Shares | |
| 286,866,376 | |
| Stock options [i] | |
| 5,572,829 | |
| | |
| 292,439,205 | |
| [i] | Options
to purchase Common Shares are exercisable by the holder in accordance with the vesting
provisions and upon payment of the exercise price as may be determined from time to time
pursuant to the Company’s stock option plans. |
2023 Annual Financial Statements 26
MAGNA INTERNATIONAL INC.
NOTES TO CONSOLIDATED FINANCIAL STATEMENTS
[All amounts in U.S. dollars and all tabular amounts in millions,
except per share figures, unless otherwise noted]
21. ACCUMULATED
OTHER COMPREHENSIVE LOSS
The
following is a continuity schedule of accumulated other comprehensive loss [“AOCL”]:
| | |
2023 | | |
2022 | |
| Accumulated net unrealized loss on translation of net investment in foreign operations | |
| | | |
| | |
| Balance, beginning of year | |
$ | (1,018 | ) | |
$ | (735 | ) |
| Net unrealized gain (loss) | |
| 183 | | |
| (495 | ) |
| Repurchase of shares under Normal Course Issuer Bids [note
20] | |
| (1 | ) | |
| 9 | |
| Recognition of cumulative translation adjustment loss in Russia [note 4] | |
| — | | |
| 203 | |
| Balance, end of year | |
| (836 | ) | |
| (1,018 | ) |
| | |
| | | |
| | |
| Accumulated net unrealized gain on cash flow hedges [b] | |
| | | |
| | |
| Balance, beginning of year | |
| 5 | | |
| 24 | |
| Net unrealized gain | |
| 94 | | |
| 1 | |
| Reclassification of net gain to net income [a] | |
| (56 | ) | |
| (20 | ) |
| Balance, end of year | |
| 43 | | |
| 5 | |
| | |
| | | |
| | |
| Accumulated net unrealized loss on other long-term liabilities [b] | |
| | | |
| | |
| Balance, beginning of year | |
| (101 | ) | |
| (189 | ) |
| Net unrealized (loss) gains | |
| (5 | ) | |
| 82 | |
| Reclassification of net loss to net income [a] | |
| 1 | | |
| 6 | |
| Balance, end of year | |
| (105 | ) | |
| (101 | ) |
| | |
| | | |
| | |
| Total accumulated other comprehensive loss [c] | |
$ | (898 | ) | |
$ | (1,114 | ) |
| [a] | The
effects on net income of amounts reclassified from AOCL, with presentation location,
were as follows: |
| | |
2023 | | |
2022 | |
| Cash flow hedges | |
| | | |
| | |
| Sales | |
$ | (32 | ) | |
$ | (15 | ) |
| Cost of sales | |
| 107 | | |
| 41 | |
| Income tax | |
| (19 | ) | |
| (6 | ) |
| Net of tax | |
| 56 | | |
| 20 | |
| | |
| | | |
| | |
| Other long-term liabilities | |
| | | |
| | |
| Cost of sales | |
| (1 | ) | |
| (8 | ) |
| Income tax | |
| — | | |
| 2 | |
| Net of tax | |
| (1 | ) | |
| (6 | ) |
| | |
| | | |
| | |
| Total net gain reclassified to net income | |
$ | 55 | | |
$ | 14 | |
2023 Annual Financial Statements 27
MAGNA INTERNATIONAL INC.
NOTES TO CONSOLIDATED FINANCIAL STATEMENTS
[All amounts in U.S. dollars and all tabular amounts in millions,
except per share figures, unless otherwise noted]
| [b] | The
amount of income tax (loss) benefit that has been allocated to each component of other
comprehensive loss is as follows: |
| | |
2023 | | |
2022 | |
| Accumulated net unrealized loss on translation of net investment in foreign operations | |
$ | 6 | | |
$ | 4 | |
| | |
| | | |
| | |
| Accumulated net unrealized gain on cash flow hedges | |
| | | |
| | |
| Balance, beginning of year | |
| — | | |
| (8 | ) |
| Net unrealized (loss) gain | |
| (35 | ) | |
| 2 | |
| Reclassification of net loss to net income | |
| 19 | | |
| 6 | |
| Balance, end of year | |
| (16 | ) | |
| — | |
| | |
| | | |
| | |
| Accumulated net unrealized loss on other long-term liabilities | |
| | | |
| | |
| Balance, beginning of year | |
| 6 | | |
| 25 | |
| Net unrealized gain (loss) | |
| 3 | | |
| (17 | ) |
| Reclassification of net gain to net income | |
| — | | |
| (2 | ) |
| Balance, end of year | |
| 9 | | |
| 6 | |
| | |
| | | |
| | |
| Total income tax (loss) benefit | |
$ | (1 | ) | |
$ | 10 | |
| [c] | The
amount of other comprehensive gain that is expected to be reclassified to net income
during 2024 is $64 million. |
22. FINANCIAL
INSTRUMENTS
| [a] | Foreign
exchange contracts |
At
December 31, 2023, the Company had outstanding foreign exchange forward contracts representing commitments to buy and sell various
foreign currencies. Significant commitments are as follows:
| | | |
For Canadian dollars | | |
For U.S. dollars | | |
For euros | |
Buy
(Sell) | | |
U.S.
dollar
amount | | |
Weighted
average
rate | | |
Peso
amount | | |
Weighted
average
rate | | |
U.S.
dollar
amount | | |
Weighted
average
rate | | |
Czech
Koruna
amount | | |
Weighted
average
rate | |
| 2024 | | |
| 18 | | |
| 1.313 | | |
| 4,104 | | |
| 0.043 | | |
| 23 | | |
| 0.870 | | |
| 1,641 | | |
| 0.037 | |
| 2024 | | |
| (397 | ) | |
| 0.779 | | |
| — | | |
| — | | |
| (40 | ) | |
| 1.141 | | |
| — | | |
| — | |
| 2025 | | |
| 4 | | |
| 1.352 | | |
| 320 | | |
| 0.045 | | |
| 1 | | |
| 0.941 | | |
| — | | |
| — | |
| 2025 | | |
| (234 | ) | |
| 0.780 | | |
| — | | |
| — | | |
| (16 | ) | |
| 1.076 | | |
| — | | |
| — | |
| 2026 | | |
| (72 | ) | |
| 0.782 | | |
| — | | |
| — | | |
| — | | |
| — | | |
| — | | |
| — | |
| | | |
| (681 | ) | |
| | | |
| 4,424 | | |
| | | |
| (32 | ) | |
| | | |
| 1,641 | | |
| | |
Based
on forward foreign exchange rates as at December 31, 2023 for contracts with similar remaining terms to maturity, the pre-tax
gains and losses relating to the Company’s foreign exchange forward contracts recognized in other comprehensive income were $79
million and $15 million, respectively [note 21].
The
Company does not enter into foreign exchange forward contracts for speculative purposes.
2023 Annual Financial Statements 28
MAGNA INTERNATIONAL INC.
NOTES TO CONSOLIDATED FINANCIAL STATEMENTS
[All amounts in U.S. dollars and all tabular amounts in millions,
except per share figures, unless otherwise noted]
| [b] | Financial assets and liabilities |
The Company’s financial assets
and liabilities consist of the following:
| | |
2023 | | |
2022 | |
| Financial assets | |
| | | |
| | |
| Cash and cash equivalents | |
$ | 1,198 | | |
$ | 1,234 | |
| Accounts receivable | |
| 7,881 | | |
| 6,791 | |
| Warrants and public and private equity investments | |
| 56 | | |
| 432 | |
| Long-term receivables included in other assets [note 14] | |
| 118 | | |
| 262 | |
| | |
$ | 9,253 | | |
$ | 8,719 | |
| | |
| | | |
| | |
| Financial liabilities | |
| | | |
| | |
| Short-term borrowing | |
$ | 511 | | |
$ | 8 | |
| Long-term debt (including portion due within one year) | |
| 4,994 | | |
| 3,501 | |
| Accounts payable | |
| 7,842 | | |
| 6,999 | |
| | |
$ | 13,347 | | |
$ | 10,508 | |
| | |
| | | |
| | |
| Derivatives designated as effective hedges, measured at fair value | |
| | | |
| | |
| Foreign currency contracts | |
| | | |
| | |
| Prepaid expenses | |
$ | 78 | | |
$ | 65 | |
| Other assets | |
| 4 | | |
| 26 | |
| Other accrued liabilities | |
| (13 | ) | |
| (43 | ) |
| Other long-term liabilities | |
| (8 | ) | |
| (31 | ) |
| | |
$ | 61 | | |
$ | 17 | |
| [c] | Derivatives designated as effective hedges, measured
at fair value |
The Company presents derivatives
that are designated as effective hedges at gross fair values in the consolidated balance sheets. However, master netting and other
similar arrangements allow net settlements under certain conditions. The following table summarizes the Company’s derivative foreign
currency contracts at gross fair value as reflected in the consolidated balance sheets and the unrecognized impacts of master netting
arrangements:
| | |
Gross
amounts
presented
in consolidated
balance sheets | | |
Gross
amounts
not offset
in consolidated
balance sheets | | |
Net
amounts | |
| December 31, 2023 | |
| | | |
| | | |
| | |
| Assets | |
$ | 82 | | |
$ | 7 | | |
$ | 75 | |
| Liabilities | |
$ | (20 | ) | |
$ | (7 | ) | |
$ | (13 | ) |
| December 31, 2022 | |
| | | |
| | | |
| | |
| Assets | |
$ | 91 | | |
$ | 42 | | |
$ | 49 | |
| Liabilities | |
$ | (74 | ) | |
$ | (42 | ) | |
$ | (32 | ) |
2023 Annual Financial Statements 29
MAGNA INTERNATIONAL INC.
NOTES TO CONSOLIDATED FINANCIAL STATEMENTS
[All amounts in U.S. dollars and all tabular amounts in millions,
except per share figures, unless otherwise noted]
| [d] | Supplier financing program |
The Company has supplier
financing programs with third-party financial institutions that provides financing to suppliers who provide tooling related materials.
This arrangement allows these suppliers to elect to be paid by a financial institution at a discount earlier than the maturity
date of the receivable, which may extend from 6 to 18 months. The Company will pay the full amount owing to the financial institution
on the maturity dates. Amounts outstanding under this program as at December 31, 2023 were $132 million [2022 – $135 million]
and are presented within accounts payable.
The Company determined
the estimated fair values of its financial instruments based on valuation methodologies it believes are appropriate; however, considerable
judgment is required to develop these estimates. Accordingly, these estimated fair values are not necessarily indicative of the
amounts the Company could realize in a current market exchange. The estimated fair value amounts can be materially affected by
the use of different assumptions or methodologies. The methods and assumptions used to estimate the fair value of financial instruments
are described below:
Cash and cash equivalents,
accounts receivable, accounts payable and short-term borrowings
Due
to the short period to maturity of the instruments, the carrying values as presented in the consolidated balance sheets are reasonable
estimates of fair values.
Publicly traded and private equity securities
The fair value of the Company’s
investments in publicly traded equity securities is determined using the closing price on the measurement date, as reported on
the stock exchange on which the securities are traded. [Level 1 input based on the GAAP fair value hierarchy.]
The Company estimates the
value of its private equity securities based on valuation methods using the observable transaction price at the transaction date
and other observable inputs including rights and obligations of the securities held by the Company. [Level 3 input based on the
GAAP fair value hierarchy.]
Warrants
The Company estimates the
value of its warrants based on the quoted prices in the active market for Fisker’s common shares. [Level 2 inputs based on the
GAAP fair value hierarchy.]
Term Loan
The Company’s Term
Loan consists of advances in the form of 1, 3 or 6-month loans, that may be rolled over until the end of the 3 and 5-year terms.
Due to the short-term maturity of each 1, 3 or 6 month loan, the carrying value as presented in the consolidated balance sheets
is a reasonable estimate of its fair value.
Senior Notes
At
December 31, 2023, the net book value of the Company’s Senior Notes was $4.5 billion and the estimated fair value was $4.4 billion.
The fair value of our Senior Notes are classified as Level 1 when quoted prices in active markets are available and Level 2 when
the quoted prices are from less active markets or when other observable inputs are used to determine fair value.
2023 Annual Financial Statements 30
MAGNA INTERNATIONAL INC.
NOTES TO CONSOLIDATED FINANCIAL STATEMENTS
[All amounts in U.S. dollars and all tabular amounts in millions,
except per share figures, unless otherwise noted]
The
Company’s financial assets that are exposed to credit risk consist primarily of cash and cash equivalents, accounts receivable,
and foreign exchange and commodity forward contracts with positive fair values. Cash and cash equivalents, which consist of short-term
investments, are only invested in bank term deposits and bank commercial paper with an investment grade credit rating. Credit risk
is further reduced by limiting the amount which is invested in certain major financial institutions.
The Company is also exposed
to credit risk from the potential default by any of its counterparties on its foreign exchange forward contracts. The Company mitigates
this credit risk by dealing with counterparties who are major financial institutions that the Company anticipates will satisfy
their obligations under the contracts.
In the normal course of
business, the Company is exposed to credit risk from its customers, substantially all of which are in the automotive industry and
are subject to credit risks associated with the automotive industry. For the year ended December 31, 2023, sales to the Company’s
six largest customers represented 76% [2022 - 79%] of the Company’s total sales; and substantially all of its sales are to customers
with which the Company has ongoing contractual relationships. The Company continues to develop and conduct business with newer
electric vehicle-focused customers, which poses incremental credit risk due to their relatively short operating histories; limited
financial resources; less mature product development and validation processes; uncertain market acceptance of their products/services;
and untested business models. These factors may elevate our risks in dealing with such customers, particularly with respect to
recovery of: pre-production (including tooling, engineering, and launch) and production receivables; inventory; fixed assets and
capitalized preproduction expenditures; as well as other third party obligations related to such items. As at December 31,
2023, the Company’s balance sheet exposure related to newer electric vehicle-focused customers was approximately $600 million,
the majority of which related to Fisker. In determining the allowance for expected credit losses, the Company considers changes
in customer’s credit ratings, liquidity, customer’s historical payments and loss experience, current economic conditions, and the
Company’s expectations of future economic conditions.
The Company is exposed
to fluctuations in foreign exchange rates when manufacturing facilities have committed to the delivery of products for which the
selling price has been quoted in currencies other than the facilities’ functional currency, and when materials and equipment are
purchased in currencies other than the facilities’ functional currency. In an effort to manage this net foreign exchange exposure,
the Company employs hedging programs, primarily through the use of foreign exchange forward contracts [note 22[a]].
The Company is not exposed
to significant interest rate risk due to the short-term maturity of its monetary current assets and current liabilities. In particular,
the amount of interest income earned on cash and cash equivalents is impacted more by investment decisions made and the demands
to have available cash on hand, than by movements in interest rates over a given period.
The Company is exposed
to interest rate risk on its Term Loan as the interest rate is variable, however the Company is not exposed to interest rate risk
on Senior Notes as the interest rates are fixed.
Public equity securities
and warrants
The Company’s public equity
securities and warrants are subject to market price risk due to the risk of loss in value that would result from a decline in the
market price of the common shares or underlying common shares.
2023 Annual Financial Statements 31
MAGNA INTERNATIONAL INC.
NOTES TO CONSOLIDATED FINANCIAL STATEMENTS
[All amounts in U.S. dollars and all tabular amounts in millions,
except per share figures, unless otherwise noted]
From time to time, the Company may become
involved in regulatory proceedings, or become liable for legal, contractual and other claims by various parties, including customers,
suppliers, former employees, class action plaintiffs and others. On an ongoing basis, the Company attempts to assess the likelihood
of any adverse judgments or outcomes to these proceedings or claims, together with potential ranges of probable costs and losses.
A determination of the provision required, if any, for these contingencies is made after analysis of each individual issue. The
required provision may change in the future due to new developments in each matter or changes in approach such as a change in settlement
strategy in dealing with these matters.
| [a] | In December 2023, the Company received a notification [the
“Notification Letter”] from a customer informing the Company as to the customer’s initial determination that one
of the Company’s operating groups bears responsibility for costs totaling $352 million related to two product recalls. The
Notification Letter has triggered a 90-day negotiation period regarding financial allocation of the total costs for the two recalls.
In the event such negotiations are not concluded successfully during this period, the customer has discretion under its Terms and
Conditions to debit Magna up to 50% of the parts and labour costs actually incurred related to the recalls. The Company believes that
the product in question met the customer’s specifications, and accordingly, is vigorously contesting the customer’s
determination. Magna does not currently anticipate any material liabilities. |
| [b] | The Company’s policy is to comply with all applicable laws, including antitrust and competition
laws. Based on a previously completed global review of legacy antitrust risks which led to a September 2020 settlement with the
European Commission and a June 2022 settlement with Brazil’s federal competition authority involving in both cases the supply
of closure systems, Magna does not currently anticipate any material liabilities. However, the Company could be subject to restitution
settlements, civil proceedings, reputational damage and other consequences, including as a result of the matters specifically referred
to above. |
| [a] | Magna is a mobility technology company and a global supplier in the automotive
space. Magna has complete vehicle engineering and contract manufacturing expertise, as well as product capabilities which include
body, chassis, exterior, seating, powertrain, active driver assistance, electronics, mechatronics, mirrors, lighting and roof systems.
Magna also has electronic and software capabilities across many of these areas. |
The Company is organized
under four operating segments: Body Exteriors & Structures, Power & Vision, Seating Systems, and Complete Vehicles. These
segments have been determined on the basis of technological opportunities, product similarities, and market and operating factors,
and are also the Company’s reportable segments.
The Company’s chief operating
decision maker uses Adjusted Earnings before Interest and Income Taxes [“Adjusted EBIT”] as the measure of segment profit
or loss, since management believes Adjusted EBIT is the most appropriate measure of operational profitability or loss for its reporting
segments.
During 2023, the Company
revised its calculation of Adjusted EBIT to exclude the amortization of acquired intangible assets. The Company believes that excluding
the amortization of acquired intangible assets from Adjusted EBIT helps management and investors in understanding its underlying
performance and improves comparability between its segmented results of operations and its peers. Adjusted EBIT is calculated by
taking Net income and adding back Amortization of acquired intangible assets, Income taxes, Interest expense, net and Other (income)
expense, net. The Adjusted EBIT presented in the tables below, including for the prior period, have been updated to reflect the
revised calculation.
The
accounting policies of each segment are the same as those set out under “Significant Accounting Policies” [note 2].
All intersegment sales and transfers are accounted for at fair market value.
2023 Annual Financial Statements 32
MAGNA INTERNATIONAL INC.
NOTES TO CONSOLIDATED FINANCIAL STATEMENTS
[All amounts in U.S. dollars and all tabular amounts in millions,
except per share figures, unless otherwise noted]
| [b] | The following tables show segment information for the
Company’s reporting segments and a reconciliation of Adjusted EBIT to the Company’s consolidated income before income taxes: |
| | |
2023 | |
| | |
Total
sales | | |
External
sales | | |
Adjusted
EBIT | | |
Depreciation | | |
Equity
loss
(income) | |
| Body Exteriors & Structures | |
$ | 17,511 | | |
$ | 17,199 | | |
$ | 1,304 | | |
$ | 716 | | |
$ | 4 | |
| Power & Vision | |
| 14,305 | | |
| 14,052 | | |
| 668 | | |
| 510 | | |
| (107 | ) |
| Seating Systems | |
| 6,047 | | |
| 6,027 | | |
| 218 | | |
| 89 | | |
| (3 | ) |
| Complete Vehicles | |
| 5,538 | | |
| 5,502 | | |
| 124 | | |
| 100 | | |
| (8 | ) |
| Corporate & Other [i] | |
| (604 | ) | |
| 17 | | |
| (76 | ) | |
| 21 | | |
| 2 | |
| Total Reportable Segments | |
$ | 42,797 | | |
$ | 42,797 | | |
$ | 2,238 | | |
$ | 1,436 | | |
$ | (112 | ) |
| | |
2022 | |
| | |
Total
sales | | |
External
sales | | |
Adjusted
EBIT | | |
Depreciation | | |
Equity
loss
(income) | |
| Body Exteriors & Structures | |
$ | 16,004 | | |
$ | 15,763 | | |
$ | 852 | | |
$ | 697 | | |
$ | 10 | |
| Power & Vision | |
| 11,861 | | |
| 11,636 | | |
| 502 | | |
| 473 | | |
| (77 | ) |
| Seating Systems | |
| 5,269 | | |
| 5,252 | | |
| 104 | | |
| 79 | | |
| (15 | ) |
| Complete Vehicles | |
| 5,221 | | |
| 5,180 | | |
| 235 | | |
| 107 | | |
| (10 | ) |
| Corporate & Other [i] | |
| (515 | ) | |
| 9 | | |
| 15 | | |
| 17 | | |
| 3 | |
| Total Reportable Segments | |
$ | 37,840 | | |
$ | 37,840 | | |
$ | 1,708 | | |
$ | 1,373 | | |
$ | (89 | ) |
| | |
2023 | |
| | |
Net
assets | | |
Investments | | |
Goodwill | | |
Fixed
assets,
net | | |
Fixed
asset
additions | |
| Body Exteriors & Structures | |
$ | 8,147 | | |
$ | 2 | | |
$ | 452 | | |
$ | 5,569 | | |
$ | 1,638 | |
| Power & Vision | |
| 7,880 | | |
| 696 | | |
| 1,929 | | |
| 2,991 | | |
| 664 | |
| Seating Systems | |
| 1,340 | | |
| 172 | | |
| 257 | | |
| 506 | | |
| 108 | |
| Complete Vehicles | |
| 574 | | |
| 100 | | |
| 109 | | |
| 453 | | |
| 65 | |
| Corporate & Other | |
| 1,066 | | |
| 303 | | |
| 20 | | |
| 100 | | |
| 25 | |
| Total Reportable Segments | |
$ | 19,007 | | |
$ | 1,273 | | |
$ | 2,767 | | |
$ | 9,619 | | |
$ | 2,500 | |
| | |
2022 | |
| | |
Net
assets | | |
Investments | | |
Goodwill | | |
Fixed
assets,
net | | |
Fixed
asset
additions | |
| Body Exteriors & Structures | |
$ | 7,168 | | |
$ | 6 | | |
$ | 448 | | |
$ | 4,557 | | |
$ | 928 | |
| Power & Vision | |
| 6,104 | | |
| 728 | | |
| 1,198 | | |
| 2,569 | | |
| 544 | |
| Seating Systems | |
| 1,377 | | |
| 143 | | |
| 260 | | |
| 486 | | |
| 101 | |
| Complete Vehicles | |
| 632 | | |
| 95 | | |
| 105 | | |
| 471 | | |
| 94 | |
| Corporate & Other | |
| 802 | | |
| 457 | | |
| 20 | | |
| 90 | | |
| 14 | |
| Total Reportable Segments | |
$ | 16,083 | | |
$ | 1,429 | | |
$ | 2,031 | | |
$ | 8,173 | | |
$ | 1,681 | |
| [i] | Included in Corporate and Other Adjusted EBIT are intercompany
fees charged to the automotive segments. |
2023 Annual Financial Statements 33
MAGNA INTERNATIONAL INC.
NOTES TO CONSOLIDATED FINANCIAL STATEMENTS
[All amounts in U.S. dollars and all tabular amounts in millions,
except per share figures, unless otherwise noted]
| [c] | The following table reconciles Net income from operations
to Adjusted EBIT: |
| | |
2023 | | |
2022 | |
| Net Income | |
$ | 1,286 | | |
$ | 641 | |
| Add: | |
| | | |
| | |
| Amortization of acquired intangible assets | |
| 88 | | |
| 46 | |
| Interest expense, net | |
| 156 | | |
| 81 | |
| Other expense, net | |
| 388 | | |
| 703 | |
| Income taxes | |
| 320 | | |
| 237 | |
| Adjusted EBIT | |
$ | 2,238 | | |
$ | 1,708 | |
| [d] | The following table reconciles Total Assets to Net Assets: |
| | |
2023 | | |
2022 | |
| Total Assets | |
$ | 32,255 | | |
$ | 27,789 | |
| Deduct assets not included in segment net assets: | |
| | | |
| | |
| Cash and cash equivalents | |
| (1,198 | ) | |
| (1,234 | ) |
| Deferred tax assets | |
| (621 | ) | |
| (491 | ) |
| Long-term receivables from joint venture partners | |
| (49 | ) | |
| (14 | ) |
| Deduct liabilities included in segment net assets: | |
| | | |
| | |
| Accounts payable | |
| (7,842 | ) | |
| (6,999 | ) |
| Accrued salaries and wages | |
| (912 | ) | |
| (850 | ) |
| Other accrued liabilities | |
| (2,626 | ) | |
| (2,118 | ) |
| Segment Net Assets | |
$ | 19,007 | | |
$ | 16,083 | |
| [e] | The following table aggregates external revenues by customer
as follows: |
| | |
2023 | | |
2022 | |
| General Motors | |
$ | 6,162 | | |
$ | 5,903 | |
| Daimler AG | |
| 5,785 | | |
| 4,953 | |
| BMW | |
| 5,334 | | |
| 5,243 | |
| Ford Motor Company | |
| 5,317 | | |
| 4,904 | |
| Stellantis | |
| 5,246 | | |
| 5,013 | |
| Volkswagen | |
| 4,684 | | |
| 3,872 | |
| Other | |
| 10,269 | | |
| 7,952 | |
| | |
$ | 42,797 | | |
$ | 37,840 | |
2023 Annual Financial Statements 34
MAGNA INTERNATIONAL INC.
NOTES TO CONSOLIDATED FINANCIAL STATEMENTS
[All amounts in U.S. dollars and all tabular amounts in millions,
except per share figures, unless otherwise noted]
| [f] | The following table summarizes external revenues and long-lived assets by geographic region: |
| | |
External Sales | | |
Fixed Assets, Net | |
| | |
2023 | | |
2022 | | |
2023 | | |
2022 | |
| North America | |
| | | |
| | | |
| | | |
| | |
| United States | |
$ | 10,855 | | |
$ | 9,648 | | |
$ | 2,297 | | |
$ | 1,860 | |
| Mexico | |
| 4,958 | | |
| 4,393 | | |
| 1,509 | | |
| 1,260 | |
| Canada | |
| 4,909 | | |
| 4,870 | | |
| 1,211 | | |
| 921 | |
| | |
| 20,722 | | |
| 18,911 | | |
| 5,017 | | |
| 4,041 | |
| Europe | |
| | | |
| | | |
| | | |
| | |
| Austria | |
| 6,926 | | |
| 6,617 | | |
| 787 | | |
| 737 | |
| Germany | |
| 4,403 | | |
| 3,800 | | |
| 831 | | |
| 832 | |
| Czech Republic | |
| 1,330 | | |
| 1,024 | | |
| 342 | | |
| 307 | |
| Poland | |
| 798 | | |
| 695 | | |
| 238 | | |
| 224 | |
| Italy | |
| 464 | | |
| 357 | | |
| 240 | | |
| 223 | |
| United Kingdom | |
| 442 | | |
| 343 | | |
| 162 | | |
| 163 | |
| Spain | |
| 390 | | |
| 351 | | |
| 81 | | |
| 75 | |
| France | |
| 337 | | |
| 381 | | |
| 77 | | |
| 61 | |
| Turkey | |
| 325 | | |
| 305 | | |
| 9 | | |
| 7 | |
| Sweden | |
| 322 | | |
| — | | |
| 150 | | |
| — | |
| Slovakia | |
| 273 | | |
| 206 | | |
| 329 | | |
| 299 | |
| Other Europe | |
| 207 | | |
| 216 | | |
| 214 | | |
| 203 | |
| | |
| 16,217 | | |
| 14,295 | | |
| 3,460 | | |
| 3,131 | |
| Asia Pacific | |
| | | |
| | | |
| | | |
| | |
| China | |
| 4,843 | | |
| 3,901 | | |
| 958 | | |
| 852 | |
| India | |
| 242 | | |
| 228 | | |
| 100 | | |
| 82 | |
| Other Asia Pacific | |
| 231 | | |
| 38 | | |
| 12 | | |
| 6 | |
| | |
| 5,316 | | |
| 4,167 | | |
| 1,070 | | |
| 940 | |
| Rest of World | |
| 542 | | |
| 467 | | |
| 72 | | |
| 61 | |
| | |
$ | 42,797 | | |
$ | 37,840 | | |
$ | 9,619 | | |
$ | 8,173 | |
2023 Annual Financial Statements 35
Exhibit 99.3
Consent of Independent Registered Public Accounting Firm
We consent to the incorporation by reference in Registration Statement
Nos. 333-270086 on Form F-10 and 333-271114, 333-210449 and 333-128257 on Form S-8 of our reports dated February 22, 2024, relating
to the consolidated financial statements of Magna International Inc. (the “Company”), and the effectiveness of the Company’s
internal control over financial reporting, appearing in this Current Report, dated February 23, 2024, on Form 6-K of the Company
for the year ended December 31, 2023.
/s/ Deloitte LLP
Chartered Professional Accountants
Licensed Public Accountants
Toronto, Canada
February 23, 2024
Magna (NYSE:MGA)
Historical Stock Chart
From Apr 2024 to May 2024

Magna (NYSE:MGA)
Historical Stock Chart
From May 2023 to May 2024
