false
0000839470
0000839470
2023-12-11
2023-12-11
iso4217:USD
xbrli:shares
iso4217:USD
xbrli:shares
UNITED STATES
SECURITIES AND EXCHANGE COMMISSION
WASHINGTON, D.C. 20549
FORM 8-K
CURRENT REPORT PURSUANT TO
SECTION 13 OR 15(D) OF THE
SECURITIES EXCHANGE ACT OF 1934
Date of Report (Date of earliest event reported):
December 11, 2023
WESTWATER RESOURCES, INC.
(Exact Name of Registrant as Specified in Charter)
| Delaware |
|
001-33404 |
|
75-2212772 |
| (State or Other Jurisdiction |
|
(Commission File Number) |
|
(IRS Employer |
| of Incorporation) |
|
|
|
Identification No.) |
6950 S. Potomac Street, Suite 300
Centennial, Colorado |
|
80112 |
| (Address of Principal Executive Offices) |
|
(Zip Code) |
Registrant’s telephone number, including
area code: (303) 531-0516
(Former Name or Former Address, if Changed Since
Last Report)
Check the appropriate box below if the Form 8-K filing is intended
to simultaneously satisfy the filing obligation of the registrant under any of the following provisions (see General Instruction A.2.
below):
| ¨ | Written communications pursuant to Rule 425 under the
Securities Act (17 CFR 230.425) |
| ¨ | Soliciting material pursuant to Rule 14a-12 under the
Exchange Act (17 CFR 240.14a-12) |
| ¨ | Pre-commencement communications pursuant to Rule 14d-2(b) under
the Exchange Act (17 CFR 240.14d-2(b)) |
| ¨ | Pre-commencement communications pursuant to Rule 13e-4(c) under
the Exchange Act (17 CFR 240.13e-4(c)) |
Securities registered pursuant to Section 12(b) of the Act:
| Title of Each Class |
|
Trading Symbol(s) |
|
Name of Each Exchange
on Which Registered |
| Common Stock, $0.001 par value |
|
WWR |
|
NYSE American |
Indicate by check mark whether the registrant is an emerging growth
company as defined in Rule 405 of the Securities Act of 1933 (§230.405 of this chapter) or Rule 12b-2 of the Securities Exchange
Act of 1934 (§240.12b–2 of this chapter).
Emerging growth company ¨
If an emerging growth company, indicate by check mark if the registrant
has elected not to use the extended transition period for complying with any new or revised financial accounting standards provided pursuant
to Section 13(a) of the Exchange Act. ¨
| Item 7.01 | Regulation FD Disclosure. |
On December 13, 2023, Westwater Resources, Inc. (the “Company”)
issued a press release announcing the completion of the Initial Assessment, with Economic Analysis, for the Company’s Coosa graphite deposit
in Alabama (the “Coosa Deposit”) and publication of the S-K 1300 Technical Report Summary (“TRS”) disclosing mineral
resources, including an economic analysis, for the Coosa Deposit. The TRS was completed by SLR International Corporation (“SLR”)
in compliance with Item 1300 of Regulation S-K and with an effective date of December 11, 2023.
A copy of the press release is furnished as Exhibit 99.1 to this Current
Report on Form 8-K and is incorporated herein by reference. The information contained in this Item 7.01, including Exhibit 99.1, is being
furnished and shall not be deemed “filed” for purposes of Section 18 of the Securities Exchange Act of 1934, as amended (the
“Exchange Act”), or otherwise subject to the liabilities of that section, or incorporated by reference in any filing under
the Securities Act of 1933, as amended, or the Exchange Act, except as shall be expressly set forth by specific reference in such filing.
On December 13, 2023, the Company issued the TRS for the Coosa Deposit.
The TRS and the related qualified person consent are filed as Exhibits 96.1 and 23.1, respectively, to this Current Report on Form 8-K
and are incorporated herein by reference.
| Item 9.01 |
Financial Statements and Exhibits. |
SIGNATURES
Pursuant to the requirements
of the Securities Exchange Act of 1934, the registrant has duly caused this report to be signed on its behalf by the undersigned hereunto
duly authorized.
Dated: December 13, 2023
| |
WESTWATER RESOURCES, INC. |
| |
|
|
| |
By: |
/s/ Steven M. Cates |
| |
Name: |
Steven M. Cates |
| |
Title: |
Senior Vice President–Finance and Chief Financial Officer |
Exhibit 23.1
SLR
International Corporation
1658 Cole Blvd, Suite 100, Lakewood, Colorado, 80401 |
 |
December 13, 2023
Consent
of Qualified Person
Re: Form 8-K of Westwater Resources, Inc.
(the “Company”)
SLR International Corporation (“SLR”),
in connection with the Company’s Current Report on Form 8-K dated December 13, 2023 and any amendments or supplements
and/or exhibits thereto (the “Form 8-K”), consents to:
| • | the
incorporation by reference by the Company and use of the technical report titled “Technical
Report Summary on the Coosa Project, Coosa County, Alabama, USA” (the “TRS”),
with an effective date of September 30, 2023 and dated December 11, 2023, that
was prepared in accordance with Subpart 1300 of Regulation S-K promulgated by the U.S. Securities
and Exchange Commission (S-K 1300), as an exhibit to and referenced in the Form 8-K; |
| • | the
incorporation by reference of the TRS into the Company’s Registration Statements on
Form S-3 Nos. 333-257434, 333-226926, 333-221687, 333-214657,
333-212845, 333-209024, and Form S-8 Nos. 333-264958, 333-257421, 333-250866, 333-226927,
333-193075, and 333-119661 (collectively, the “Registration Statements”); |
| • | the
use of and references to our name, including our status as an expert or “qualified
person” (as defined in S-K 1300), in connection with the Form 8-K, the Registration
Statements and the TRS; and |
| • | any
extracts from, or a summary of, the TRS in Form 8-K and included or incorporated by
reference in Form 8-K and the Registration Statements, and the use of any information
derived, summarized, quoted, or referenced from the TRS, or portions thereof, that was prepared
by us, that we supervised the preparation of, and/or that was reviewed and approved by us,
that is included or incorporated by reference in Form 8-K and the Registration Statements. |
SLR is responsible for authoring, and
this consent pertains to, the TRS. SLR certifies that it has read the Form 8-K and that it fairly and accurately represents the
information in the TRS for which it is responsible.
SLR International Corporation
Per:
(Signed) Grant A. Malensek
Grant A. Malensek, P.Eng.
Technical Director – US Mining
Advisory
Exhibit 96.1
Technical Report Summary on the Coosa
Project, Coosa County, Alabama, USA
S-K 1300 Report
Westwater Resources, Inc.
SLR Project No.: 138.20527.00002
Effective Date:
September 30, 2023
Signature Date:
December 11, 2023
Prepared by:
SLR International Corporation

Technical Report
Summary on the Coosa Project, Coosa County, Alabama, USA
SLR Project No.:
138.20527.00002
Prepared by
SLR International
Corporation
1658 Cole Blvd,
Suite 100
Lakewood, CO 80401
for
Westwater Resources, Inc.
6950 South Potomac
St., Suite 300
Centennial, CO 80112
Effective Date -
September 30, 2023
Signature Date -
December 11, 2023
| Distribution: |
1 copy - Westwater Resources, Inc. |
| |
1 copy - SLR International Corporation |
|
Westwater Resources, Inc. | Coosa Graphite Project
S-K 1300 Report |
December 11, 2023
SLR Project No.: 138.20527.00002 |
Table of Contents
| 1.0 | Executive Summary |
1-1 |
| | |
|
| 1.1 | Summary |
1-1 |
| 1.2 | Economic Analysis |
1-6 |
| 1.3 | Technical Summary |
1-12 |
| | |
|
| 2.0 | Introduction |
2-1 |
| | |
|
| 2.1 | Site Visits |
2-1 |
| 2.2 | Sources of Information |
2-1 |
| 2.3 | List of Abbreviations |
2-2 |
| | |
|
| 3.0 | Property Description |
3-1 |
| | |
|
| 3.1 | Location |
3-1 |
| 3.2 | Land Tenure |
3-1 |
| 3.3 | Underlying Agreement |
3-11 |
| 3.4 | Encumbrances |
3-12 |
| 3.5 | Royalties |
3-12 |
| 3.6 | Required Permits and Status |
3-12 |
| 3.7 | Other Significant Factors and Risks |
3-12 |
| | |
|
| 4.0 | Accessibility, Climate, Local Resources, Infrastructure
and Physiography |
4-1 |
| | |
|
| 4.1 | Accessibility |
4-1 |
| 4.2 | Climate |
4-1 |
| 4.3 | Local Resources |
4-1 |
| 4.4 | Infrastructure |
4-1 |
| 4.5 | Physiography |
4-1 |
| | |
|
| 5.0 | History |
5-1 |
| | |
|
| 5.1 | Prior Ownership |
5-1 |
| 5.2 | Exploration and Development History |
5-1 |
| 5.3 | Historical Resource Estimates |
5-4 |
| 5.4 | Past Production |
5-4 |
| | |
|
| 6.0 | Geological Setting, Mineralization, and Deposit |
6-1 |
| | |
|
| 6.1 | Regional Geology |
6-1 |
| 6.2 | Local Geology |
6-4 |
| 6.3 | Property Geology |
6-4 |
| 6.4 | Mineralization |
6-15 |
| 6.5 | Deposit Types |
6-15 |
| | i |  |
|
Westwater Resources, Inc. | Coosa Graphite Project
S-K 1300 Report |
December 11, 2023
SLR Project No.: 138.20527.00002 |
| 7.0 | Exploration |
7-1 |
| | |
|
| 7.1 | Exploration |
7-1 |
| 7.2 | Exploration Target |
7-5 |
| 7.3 | Drilling |
7-5 |
| 7.4 | Conclusions |
7-11 |
| | |
|
| 8.0 | Sample Preparation, Analyses, and Security |
8-1 |
| | |
|
| 8.1 | Sample Preparation and Analysis |
8-1 |
| 8.2 | Bulk Density |
8-3 |
| 8.3 | Quality Assurance and Quality Control |
8-5 |
| 8.4 | Sample Security |
8-29 |
| 8.5 | Conclusions |
8-30 |
| | |
|
| 9.0 | Data Verification |
9-1 |
| | |
|
| 10.0 | Mineral Processing and Metallurgical Testing |
10-1 |
| | |
|
| 10.1 | Introduction |
10-1 |
| 10.2 | 2013 Metallurgical Test Work |
10-1 |
| 10.3 | 2014 Metallurgical Test Work |
10-4 |
| 10.4 | 2014-2015 Metallurgical Test Work |
10-8 |
| 10.5 | 2015 Metallurgical Test Work |
10-15 |
| 10.6 | Proposed Flowsheet |
10-22 |
| 10.7 | Performance and Recovery Estimates |
10-23 |
| 10.8 | Qualified Person’s Opinion |
10-24 |
| | |
|
| 11.0 | Mineral Resource Estimates |
11-1 |
| | |
|
| 11.1 | Summary |
11-1 |
| 11.2 | Resource Database |
11-2 |
| 11.3 | Geological Interpretation |
11-3 |
| 11.4 | Statistical Analysis |
11-6 |
| 11.5 | Compositing |
11-8 |
| 11.6 | Variography |
11-10 |
| 11.7 | Bulk Density |
11-11 |
| 11.8 | Block Models |
11-12 |
| 11.9 | Search Strategy and Grade Interpolation Parameters |
11-12 |
| 11.10 | Cut-off Grade and Whittle Parameters |
11-13 |
| 11.11 | Classification |
11-13 |
| 11.12 | Block Model Validation |
11-15 |
| 11.13 | Grade-Tonnage Sensitivity |
11-20 |
| 11.14 | Mineral Resource Reporting |
11-22 |
| | ii | |
|
Westwater Resources, Inc. | Coosa Graphite Project
S-K 1300 Report |
December 11, 2023
SLR Project No.: 138.20527.00002 |
| 12.0 | Mineral Reserve Estimates |
12-1 |
| | |
|
| 13.0 | Mining Methods |
13-1 |
| | |
|
| 13.1 | Mine Design, Mining Method |
13-1 |
| 13.2 | Geomechanics, Ground Support |
13-1 |
| 13.3 | Dilution and Extraction |
13-1 |
| 13.4 | Cut-off Grade |
13-1 |
| 13.5 | Pit Optimization |
13-2 |
| 13.6 | Life of Mine Plan |
13-6 |
| 13.7 | Mine Equipment |
13-8 |
| | |
|
| 14.0 | Processing and Recovery Methods |
14-1 |
| | |
|
| 14.1 | Introduction |
14-1 |
| 14.2 | Process Flowsheet |
14-1 |
| 14.3 | Design Criteria |
14-1 |
| 14.4 | Process Description - Concentrator |
14-3 |
| | |
|
| 15.0 | Infrastructure |
15-1 |
| | |
|
| 15.1 | Access Roads |
15-1 |
| 15.2 | Power |
15-1 |
| 15.3 | Water |
15-1 |
| 15.4 | Accommodation Camp |
15-1 |
| 15.5 | Tailings Facility |
15-3 |
| | |
|
| 16.0 | Market Studies |
16-1 |
| | |
|
| 16.1 | Markets |
16-1 |
| 16.2 | Contracts |
16-2 |
| | |
|
| 17.0 | Environmental Studies, Permitting, and Plans, Negotiations,
or Agreements with Local Individuals or Groups |
17-1 |
| | |
|
| 17.1 | Summary |
17-1 |
| 17.2 | Environmental Studies |
17-1 |
| 17.3 | Environmental Permits |
17-1 |
| 17.4 | Closure |
17-2 |
| 17.5 | Conclusions and Recommendations |
17-2 |
| | |
|
| 18.0 | Capital and Operating Costs |
18-1 |
| | |
|
| 18.1 | Capital Costs |
18-1 |
| 18.2 | Operating Costs |
18-6 |
| | iii | |
|
Westwater Resources, Inc. | Coosa Graphite Project
S-K 1300 Report |
December 11, 2023
SLR Project No.: 138.20527.00002 |
| 19.0 | Economic Analysis |
19-1 |
| | |
|
| 19.1 | Base Case (Indicated and Inferred Mineral Resources) |
19-1 |
| 19.2 | Alternate Case (Indicated Mineral Resources Only) |
19-6 |
| | |
|
| 20.0 | Adjacent Properties |
20-1 |
| | |
|
| 21.0 | Other Relevant Data and Information |
21-1 |
| | |
|
| 22.0 | Interpretation and Conclusions |
22-1 |
| | |
|
| 22.1 | Geology and Mineral Resources |
22-1 |
| 22.2 | Mining |
22-1 |
| 22.3 | Mineral Processing and Metallurgical Testing |
22-2 |
| 22.4 | Environmental Studies, Permitting, and Plans, Negotiations,
or Agreements with Local Individuals or Groups |
22-2 |
| | |
|
| 23.0 | Recommendations |
23-1 |
| | |
|
| 23.1 | Exploration Drilling |
23-1 |
| 23.2 | Advancement of Coosa Graphite Mineral Resources |
23-1 |
| 23.3 | Environmental Studies, Permitting, and Plans, Negotiations,
or Agreements with Local Individuals or Groups |
23-2 |
| | |
|
| 24.0 | References |
24-1 |
| | |
|
| 25.0 | Reliance on Information Provided by the Registrant |
25-1 |
| | |
|
| 26.0 | Date and Signature Page |
26-1 |
| | |
|
| 27.1 | Zenith Quotation for 500 tph Graphite Line |
27-1 |
| | |
|
| 28.0 | Appendix 2 |
28-1 |
| | |
|
| 28.1 | SLR Cash Flow Summary Tables |
28-1 |
Tables
| Table 1-1: |
Summary of Carbon Graphite (Cg) Mineral Resources – Effective November 30, 2022 |
1-2 |
| Table 1-2: |
2024 Proposed Drilling Budget |
1-5 |
| Table 1-3: |
After-Tax Base Case Cash Flow Summary |
1-8 |
| Table 1-4: |
After-Tax Sensitivity Analyses |
1-9 |
| Table 1-5: |
Base Case LOM Capital Cost Estimate Summary |
1-18 |
| Table 3-1: |
Summary of Land Tenure Mineral Resources |
3-2 |
| Table 7-1: |
Summary of Drilling Parameters 2012-2022 |
7-6 |
| Table 8-1: |
Bulk Density Measurements |
8-4 |
| Table 8-2: |
List of CANMET CRM Used for Carbon by ALS Minerals 2012 |
8-7 |
| | iv | |
|
Westwater Resources, Inc. | Coosa Graphite Project
S-K 1300 Report |
December 11, 2023
SLR Project No.: 138.20527.00002 |
| Table 8-3: |
AGC Coosa CRM Recommended Values 2015 |
8-11 |
| Table 8-4: |
Westwater Coosa CSRM Values 2021-2022 |
8-12 |
| Table 10-1: |
Head Assays for 2013 Coosa Deposit Metallurgical Samples |
10-1 |
| Table 10-2: |
Carbon Speciation and Sulphur Analysis of Coosa Deposit Samples |
10-5 |
| Table 10-3: |
Carbon Speciation and Sulphur Analysis of Two Coosa Deposit Samples |
10-9 |
| Table 10-4: |
Total Carbon and Graphitic Carbon Grades for Eight Trench Samples |
10-9 |
| Table 10-5: |
Bond Ball Mill Work Index Results - AGC-12B (0-8) and AGC-10C (100-150) Samples |
10-9 |
| Table 10-6: |
Carbon Speciation and Sulphur Analysis of Flowsheet Development Samples and Composite |
10-16 |
| Table 11-1: |
Summary of Carbon Graphite Mineral Resources – Effective November 30, 2022 |
11-1 |
| Table 11-2: |
Resource Drill Hole Database |
11-2 |
| Table 11-3: |
Descriptive Statistics of Resource Assay Grades and Lengths |
11-6 |
| Table 11-4: |
Descriptive Statistics of Composite Assay Grades and Lengths |
11-10 |
| Table 11-5: |
Block Model Definition |
11-12 |
| Table 11-6: |
Interpolation Parameters |
11-12 |
| Table 11-7: |
Resource Pit Parameters |
11-13 |
| Table 11-8: |
Comparison of Block and Composite Graphite and Vanadium Grades |
11-20 |
| Table 11-9: |
Carbon Graphite Block Model Sensitivity to Cut-Off Grade (% Cg) |
11-20 |
| Table 11-10: |
Summary of Carbon Graphite Mineral Resources – Effective November 30, 2022 |
11-22 |
| Table 13-1: |
Economic and Technical Parameters Used in Pit Optimization |
13-2 |
| Table 13-2: |
Coosa Project Conceptual Production Schedule |
13-7 |
| Table 13-3: |
Coosa Project – Primary Mine Equipment Planned |
13-8 |
| Table 14-1: |
Summary of Process Design Criteria |
14-3 |
| Table 17-1: |
Required or Potentially Required Environmental Permits |
17-2 |
| Table 18-1: |
Base Case LOM Capital Cost Estimate Summary |
18-1 |
| Table 18-2: |
Mining Initial Capital Cost Estimate |
18-2 |
| Table 18-3: |
Process Plant Initial Capital Cost Estimate |
18-3 |
| Table 18-4: |
Infrastructure Initial Capital Cost Estimate |
18-4 |
| Table 18-5: |
FTSF Initial Capital Cost Estimate |
18-4 |
| Table 18-6: |
FTSF Sustaining Capital Cost Estimate |
18-6 |
| Table 18-7: |
FTSF Closure/Reclamation Cost Estimate |
18-6 |
| Table 18-8: |
Mine Operating Cost Estimate Summary |
18-7 |
| Table 18-9: |
Process Operating Cost Estimate Summary |
18-7 |
| Table 18-10: |
Project Headcount Estimate |
18-8 |
| Table 19-1: |
After-Tax Base Case Cash Flow Summary |
19-3 |
| Table 19-2: |
After-Tax Sensitivity Analyses |
19-4 |
| Table 23-1: |
2024 Proposed Drilling Budget |
23-2 |
| | v | |
|
Westwater Resources, Inc. | Coosa Graphite Project
S-K 1300 Report |
December 11, 2023
SLR Project No.: 138.20527.00002 |
Figures
| Figure 1-1: |
After-Tax NPV Sensitivity Analysis |
1-10 |
| Figure 1-2: |
After-Tax IRR Sensitivity Analysis |
1-11 |
| Figure 3-1: |
Location Map |
3-8 |
| Figure 3-2: |
Westwater Mineral Holdings Map |
3-9 |
| Figure 3-3: |
Target Areas |
3-10 |
| Figure 6-1: |
Regional Geology |
6-3 |
| Figure 6-2: |
Stratigraphic Column |
6-5 |
| Figure 6-3: |
Main Grid Area Showing Postulated Granitic Body |
6-11 |
| Figure 6-4: |
Main Grid Area with Conductivity Overlay |
6-12 |
| Figure 6-5: |
Main Grid Area with Conductivity Overlay and Amphibolite Outline |
6-13 |
| Figure 6-6: |
Conceptual Amphibolite Cross Section |
6-14 |
| Figure 7-1: |
Alabama Graphite 2012-2013 Channel Sample Location |
7-2 |
| Figure 7-2: |
TDEM Contour Map Showing Conductive Highs |
7-4 |
| Figure 7-3: |
Drilling Location Map |
7-8 |
| Figure 8-1: |
CRM NBM-1 2012 |
8-7 |
| Figure 8-2 : |
CRM MA-1b 2012 |
8-8 |
| Figure 8-3 : |
CRM DS-1 2012 |
8-9 |
| Figure 8-4: |
CRM STSD-3 2012 |
8-10 |
| Figure 8-5: |
Zscore Plot of CRM Standard A and Standard B 2015 |
8-11 |
| Figure 8-6: |
Zscore Plot of CSRM Std 1 through Std 4 2021 |
8-13 |
| Figure 8-7: |
Scatter Plot of Coarse Diorite Blanks 2012 |
8-14 |
| Figure 8-8: |
Scatter Plot of Coarse Diorite Blanks 2014 Trenching Program |
8-15 |
| Figure 8-9: |
Scatter Plot of Coarse Diorite Blanks 2015 |
8-16 |
| Figure 8-10: |
Scatter Plot of Granite Material Blanks 2021-2022 |
8-17 |
| Figure 8-11: |
Scatter Plot of Field Core Duplicates 2012 |
8-18 |
| Figure 8-12: |
Plot of Field Core Duplicate Mean versus Relative Difference 2012 |
8-19 |
| Figure 8-13: |
Scatter Plot of Field Core Duplicates 2014 Trenching Program |
8-20 |
| Figure 8-14: |
Scatter Plot of Field Core Duplicates 2015 |
8-21 |
| | vi | |
|
Westwater Resources, Inc. | Coosa Graphite Project
S-K 1300 Report |
December 11, 2023
SLR Project No.: 138.20527.00002 |
| Figure 8-15: |
Plot of Field Core Duplicate Mean versus Relative Difference 2015 |
8-22 |
| Figure 8-16: |
Scatter Plot of Field Core Duplicates 2021 |
8-23 |
| Figure 8-17: |
Plot of Field Core Duplicate Mean versus Relative Difference 2021 |
8-24 |
| Figure 8-18: |
Scatter Plot of Replicate Analyses of Hole AGC-03C |
8-25 |
| Figure 8-19: |
Scatter Plot of Replicate Analyses of Cg for Whole Drill Program |
8-26 |
| Figure 8-20: |
Plot of Mean vs. Relative Difference of % Cg for Replicate Samples |
8-27 |
| Figure 8-21: |
2021 External Duplicate Sample Results for U3O8% (SGS vs. Actlabs) |
8-28 |
| Figure 8-22: |
Mean vs. Relative Difference (SGS vs. Actlabs) |
8-29 |
| Figure 10-1: |
Open Circuit Flowsheet for April 2013 Coosa Deposit Samples |
10-2 |
| Figure 10-2: |
Total Carbon Grade Versus Total Carbon Recovery - 2013 Coosa Deposit Samples |
10-3 |
| Figure 10-3: |
Mass Recovery into Different Flake Sizes - 2013 Coosa Deposit Samples |
10-4 |
| Figure 10-4: |
Carbon Grade Versus Carbon Recovery Curves |
10-6 |
| Figure 10-5: |
Carbon Grades of Concentrate Size Fractions |
10-7 |
| Figure 10-6: |
Mass Recovery into Concentrate Size Fractions |
10-8 |
| Figure 10-7: |
Total Carbon Grade versus Recovery Curves - AGC-09C and AGC-12A Samples |
10-10 |
| Figure 10-8: |
Mass Recovery into Size Fractions - AGC-09C and AGC-12A Samples |
10-11 |
| Figure 10-9: |
Carbon Grades of Concentrate Size Fractions - AGC-09C and AGC-12A Samples |
10-12 |
| Figure 10-10: |
Total Carbon Grade versus Recovery Curves - Trench Samples |
10-13 |
| Figure 10-11: |
Mass Recovery into Size Fractions - Trench Samples |
10-14 |
| Figure 10-12: |
Carbon Grades of Concentrate Size Fractions - Trench Samples |
10-15 |
| Figure 10-13: |
Total Carbon Recovery as a Function of Grind Size |
10-17 |
| Figure 10-14: |
Mass Recovery into Size Fractions - Cleaner Tests F4 to F7 |
10-18 |
| Figure 10-15: |
Total Carbon Grades of Size Fractions - Cleaner Tests F4 to F7 |
10-19 |
| Figure 10-16: |
Mass Recovery into Size Fractions - Cleaner Tests F8 to F11 |
10-20 |
| Figure 10-17: |
Total Carbon Grades of Size Fractions - Cleaner Tests F8 to F11 |
10-21 |
| Figure 10-18: |
Proposed Coosa Deposit Flowsheet with Pre-cleaning |
10-22 |
| Figure 10-19: |
Projected Flake Size Distribution |
10-23 |
| Figure 11-1: |
Plan View of Coosa Geologic Model |
11-4 |
| Figure 11-2: |
Plan View of Coosa Weathering Model |
11-5 |
| Figure 11-3: |
Grade % Cg Histogram by Lithology |
11-7 |
| Figure 11-4: |
Assay Length Histogram |
11-9 |
| Figure 11-5: |
Variograms for QGS Main Grid |
11-11 |
| | vii | |
|
Westwater Resources, Inc. | Coosa Graphite Project
S-K 1300 Report |
December 11, 2023
SLR Project No.: 138.20527.00002 |
| Figure 11-6: |
QGS Swath Plot in X Direction |
11-16 |
| Figure 11-7: |
QGS Swath Plot in Y Direction |
11-17 |
| Figure 11-8: |
QGS Swath Plot in Z Direction |
11-18 |
| Figure 11-9: |
Cross Section Showing Block Grades and Composite Grades |
11-19 |
| Figure 11-10: |
Grade Tonnage Curve for Coosa Graphite |
11-21 |
| Figure 13-1: |
Whittle Optimization – Pit Shell Phases Layout |
13-4 |
| Figure 13-2: |
Coosa Project Pit-by-Pit Graph |
13-5 |
| Figure 14-1: |
Flowsheet for the Coosa Processing Plant |
14-2 |
| Figure 15-1: |
Infrastructure Layout General Schematic |
15-2 |
| Figure 15-2: |
Filtered Tailings Storage Facility Cross Section |
15-4 |
| Figure 16-1: |
Long Term Natural Flake Pricing Forecast |
16-2 |
| Figure 19-1: |
After-Tax NPV Sensitivity Analysis |
19-5 |
| Figure 19-2: |
After-Tax IRR Sensitivity Analysis |
19-6 |
Appendix Tables
| Table 28-1: |
Coosa IA Base Case Cash Flow Summary – US Customary Units |
28-2 |
| Table 28-2: |
Coosa IA Base Case Cash Flow Summary – Metric Units |
28-3 |
| | viii | |
Westwater Resources, Inc. | Coosa Graphite Project
S-K 1300 Report |
December 11, 2023
SLR Project No.: 138.20527.00002 |
SLR International Corporation (SLR)
was retained by Westwater Resources, Inc. (Westwater or the Company) to prepare an independent Technical Report Summary (TRS) on
the Coosa Graphite Project (the Project or Coosa), located in Coosa County, Alabama, USA. The purpose of this TRS is to disclose results
of an Initial Assessment (IA) of the Project, including an economic analysis, based on the Mineral Resource estimate with an effective
date of November 30, 2022. The Mineral Resource estimate was reported in the previous TRS dated December 1, 2022 and remains
unchanged as no additional work has been completed on the property since that time.
This TRS conforms to the United States
Securities and Exchange Commission’s (SEC) Modernized Property Disclosure Requirements for Mining Registrants as described in Subpart
229.1300 of Regulation S-K, Disclosure by Registrants Engaged in Mining Operations (S-K 1300) and Item 601 (b)(96) Technical Report Summary.
SLR visited the Project on April 21-23, 2022 and September 5, 2023.
Westwater is a 45-year old public company
currently focused on developing battery-grade natural graphite. Originally incorporated in 1977 as Uranium Resources, Inc. to mine
uranium in Texas, the Company has been reborn as an energy materials and technology developer. Westwater is focused on battery-grade
natural graphite after its acquisition of Alabama Graphite Corp. (AGC) in April 2018. AGC acquired the Project in 2012 based on
the geological setting. On April 23, 2018, Westwater acquired a 100% interest in AGC as part of a strategic decision to refocus
the Company to supply battery manufacturers with low-cost, high-quality, and high-margin natural graphite products. As a result of that
business transaction, Westwater became the owner of the Project.
The Coosa graphite deposit is located
at the southern end of the Appalachian Mountain range, in Coosa County, Alabama. The deposit area is approximately 50 miles south-southeast
of the city of Birmingham and 23 miles south-southwest of the town of Sylacauga. The Project’s mineral tenure is comprised of approximately
41,965 acres of privately owned mineral rights that the Company holds under a long-term lease. The Project is located in the flake graphite
belt of central Alabama, also known as the Alabama Graphite Belt.
A Mineral Resource estimate for the
Project, based on 205 drill holes totaling 39,434 ft, was completed by SLR with an effective date of November 30, 2022. Table 1-1
summarizes the Coosa Mineral Resources at a 1.98% graphitic carbon (Cg) cut-off grade envisaging an open pit mining scenario. Indicated
Mineral Resources total 26.0 million short tons (Mst) at an average grade of 2.89% Cg for a total of 754,000 st Cg. Inferred Mineral
Resources total 97.0 Mst at an average grade of 3.08% Cg for a total of 3.0 Mst Cg.
| | 1-1 | |
Westwater Resources, Inc. | Coosa Graphite Project
S-K 1300 Report |
December 11, 2023
SLR Project No.: 138.20527.00002 |
Table
1-1: Summary of Carbon Graphite (Cg) Mineral Resources – Effective November 30, 2022
| Classification |
Tonnage
(Mst) |
Grade Cg
(%) |
Contained Cg
(Mlb) |
Contained Cg
(000 st) |
Recovery
(%) |
| Indicated |
26 |
2.89 |
1,509 |
754 |
87.4 |
| Inferred |
97 |
3.08 |
5,996 |
2,998 |
87.4 |
Notes:
| 1. | The
S-K 1300 definitions were followed for Mineral Resources. |
| 2. | Mineral
Resources are constrained within a Whittle pit shell using a cut-off grade of 1.98% Cg. |
| 3. | Mineral
Resources are estimated using a long-term graphite concentrate price of US$1,100/st. |
| 4. | Bulk
density ranges from 1.68 t/m3 to 3.03 t/m3 (0.05 st/ft3
to 0.09 st/ft3). |
| 5. | Mining
dilution equals 5.0%. |
| 6. | Mineral
Resources that are not Mineral Reserves do not have demonstrated economic viability. |
| 7. | Numbers
may not add due to rounding. |
| 8. | Mineral
Resources are 100% attributable to Westwater. |
The Coosa graphite deposit is expected
to be mined by conventional small-scale open pit mining methods through several shallow pits (less than 100 ft deep each) that will be
developed over the life of the Project. At full-scale production, the mining rate will be approximately 3.33 million short tons per annum
(Mstpa), at an average grade of 3.21% Cg. Mine operations will employ small conventional loading and haulage equipment. The Coosa graphite
concentrator facilities are designed to process a nominal 3.2 Mstpa, or 8,770 tons per day (stpd) of run of mine (ROM) Cg ore to produce
an average of 99,000 stpa (90,000 tonnes per year) of flotation concentrate product grading 95% Cg.
An economic analysis was prepared with
a base case using Indicated and Inferred Mineral Resources (the latter being 89% of the total) which shows positive economics. The economic
analysis contained in this TRS is preliminary in nature and is based, in part, on Inferred Mineral Resources that are considered too
speculative geologically to have modifying factors applied to them that would enable them to be categorized as Mineral Reserves. There
is no certainty that economic forecasts on which this Initial Assessment is based will be realized.
In addition, since only 11% of the mineral
resources in the base case production schedule are Indicated Mineral Resources, the QP has determined that a stand alone alternative
case with only Indicated Resource tonnage is not economic using the assumptions and inputs outlined in the base case.
SLR offers the following interpretations
and conclusions on the Project:
| 1.1.1.1 | Geology
and Mineral Resources |
| · | Graphite
generally occurs as a result of metamorphism (regional or contact) of organic matter in sediments.
Flake graphite is assumed to be derived from fine-grained sediments rich in organic matter. |
| · | Graphite
ores mined historically were almost entirely from the weathered zone (60 ft to 100 ft), partly
because weathering is deep in this area and partly because the weathered rock could be gently
crushed without blasting. |
| | 1-2 | |
Westwater Resources, Inc. | Coosa Graphite Project
S-K 1300 Report |
December 11, 2023
SLR Project No.: 138.20527.00002 |
| · | The
sample preparation, analysis, and security procedures at Coosa are adequate for use in the
estimation of Mineral Resources. |
| · | The
quality assurance and quality control (QA/QC) programs as designed and implemented by Westwater
and its predecessor AGC meet current industry standard practice and the assay results within
the database are suitable for use in a Mineral Resource estimate. |
| · | No
significant database issues were identified and the SLR QP is of the opinion that the database
verification procedures for the Project comply with industry standards and are adequate for
the purposes of Mineral Resource estimation. |
| · | Relogging
of previously drilled holes in conjunction with new drilling information allowed for more
accurate interpretation and separation of lithologic units and improved understanding of
the geologic environment resulting in: |
| o | Improved
geologic model correlation to the 2014 Airborne Magnetic survey. |
| o | Identifying
widespread and strong vanadium (roscoelite) mineralization in very close association with
flake graphite mineralization. |
| · | The
Company has carried out an extensive geochemical sampling program to determine the presence
and intensity of vanadium mineralization at the Project. Vanadium potential tonnage and grade
are currently estimated to be 21.0 Mst to 67.0 Mst and 0.19% V2O5 to
0.13% V2O5, respectively. SLR notes that the potential quantity and
grade are conceptual in nature, there has been insufficient exploration to define a Mineral
Resource, and it is uncertain if further exploration will result in the target being delineated
as a Mineral Resource. |
| · | There
are no current Mineral Reserves at the Project. |
| · | Open
pit shovel and truck mining method is proposed for operations. |
| · | A
marginal cut-off grade of 2.1365% Cg is calculated based on a US$806/st graphite concentrate
price that results from applying a revenue factor of 0.8 to the Whittle pit shell parameters. |
| · | The
open pit optimization final pit selection is representative of a scenario that maximizes
net present value (NPV). |
| o | Selecting
a revenue factor of 0.80 essentially means that the base case graphite price has been scaled
down, resulting in a smaller pit shell, which means that lower mineralization tonnages at
higher grades are mined, leading to an improved NPV. |
| · | Total
mineralized material inventory for the Coosa Project is 72.7 Mst at a grade of 3.21% Cg. |
| · | A
conceptual production schedule based on optimized pit shells is developed with an annual
ore production of 3.33 Mst over a 22 year period with a waste to ore (W:O) stripping ratio
of 0.21:1. |
| · | Mining
costs and equipment are based on Infomine 2021 Edition for similar capacity surface mines,
and escalated based on the Mining Cost Service (MCS) indexes provided by Infomine April 2023
edition. |
| | 1-3 | |
Westwater Resources, Inc. | Coosa Graphite Project
S-K 1300 Report |
December 11, 2023
SLR Project No.: 138.20527.00002 |
| 1.1.1.3 | Mineral
Processing and Metallurgical Testing |
| · | The
Coosa graphite concentrator facilities are designed to process a nominal 3.201 Mstpa, or
8,771 tons per day (stpd) of run of mine (ROM) Cg ore to produce an average of 99,207 stpa
(90,000 tonnes per year) of flotation concentrate product grading 95% Cg. The projected recovery
of Cg to concentrate is 92% into a concentrate mass of 3.1% of the feed tonnage. |
| · | The
proposed processing plant flowsheet consists of conventional crushing, rod milling and ball
milling, flash flotation, conventional rougher flotation, and two stages of polishing grinding,
cleaner column and conventional scavenger flotation circuits. The critical stages to achieve
the required high concentrate grades and coarse flake sizes are the multistage polishing
and cleaning flotation operations. |
| 1.1.1.4 | Environmental
Studies, Permitting, and Plans, Negotiations, or Agreements with Local Individuals or Groups |
| · | The
primary permits anticipated for the Project are a Plan of Operations (PoO) and associated
Record of Decision (ROD) issued by the United States Army Corps of Engineers (USACOE) and
the Surface Mining of Non-fuel Minerals Permit and Plan of Reclamation issued by the Alabama
Department of Labor. Baseline studies will be required to support these and other permitting
efforts. |
| · | Stakeholder
engagement, including regulatory agencies, tribal entities, and the community will also be
required to support the permitting efforts. |
Westwater is considering a program to
advance the Project, which includes an initial budget estimate of approximately US$1,600,000, as presented in Table 1-2. SLR concurs
with this program. The program consists of two consecutive phases: (1) updating Mineral Resources following completion of the proposed
delineation drilling programs, and (2) carrying out engineering studies to advance the Project to a Pre-Feasibility Study (PFS)
level. The PFS will cover the following activities:
| · | metallurgical
test work, pilot plant, product testing |
| · | preliminary
environmental testing to identify any major deleterious elements and quantify the acid-generating
potential of the Coosa mineralization. |
| · | geotechnical
and hydrogeological studies |
| · | tailings
management facility design, material characterization and site geotechnical |
| · | environmental
management studies and data collection |
| · | capital
and operating cost estimation |
| · | infrastructure
evaluation and costing |
| · | project
management and administration |
| | 1-4 | |
Westwater Resources, Inc. | Coosa Graphite Project
S-K 1300 Report |
December 11, 2023
SLR Project No.: 138.20527.00002 |
| 1.1.2.1 | Exploration
Drilling |
| 1 | Complete
six-phase infill/delineation drilling activities in the NX, Fixico Mine, SW, Main Grid, Main
Grid/Fixico Mine and HS South areas of the Project to convert Inferred oxide resources to
the Indicated Mineral Resources category. This work is expected to require approximately
115 drill holes and 1,700 assays. The phased drilling programs are independent of each other
and can be conducted simultaneously or on an individual basis. The estimated cost to complete
the program is $936,000. |
| 2 | Drill
additional holes down dip and review the classification criteria as more data become available. |
| 1.1.2.2 | Advancement
of Coosa Graphite Mineral Resources |
| 1 | Complete
a PFS of the Project and update the S-K 1300 TRS accordingly after completion of the exploration
drilling program. |
| 2 | Revisit
and update mining and processing costs and recalculate cut-off grade. |
| 3 | Revisit
and update the Whittle pit with new cost parameters. |
| |
Table 1-2: |
2024 Proposed Drilling Budget |
| Category |
Item |
Number of Drill
Holes/Assay |
Total Feet
Drilled |
Unit Cost
(US$/ft) |
Budget
(US$) |
| Delineation Drilling |
Phase 1 - NX Area |
25 |
1,600 |
100 |
160,000 |
| |
Phase 2 - Fixico Mine Area |
35 |
2,300 |
100 |
230,000 |
| |
Phase 3 - SWX Area |
15 |
1,200 |
100 |
120,000 |
| |
Phase 4 - Main Grid Area |
15 |
1,200 |
100 |
120,000 |
| |
Phase 5 - Main Grid/Fixico Mine Area |
15 |
1,300 |
100 |
130,000 |
| |
Phase 6 - HS South Area |
10 |
700 |
100 |
70,000 |
| Laboratory Assay |
ActLabs (primary - 5ft interval) |
1,600 |
|
50 |
80,000 |
| |
SGS Labs (secondary - 25% primary) |
400 |
|
65 |
26,000 |
| Total Delineation Drilling |
|
|
|
|
936,000 |
| Advance Project |
PFS |
|
|
|
600,000 |
| Grand Total |
|
|
|
|
1,536,000 |
| | 1-5 | |
Westwater Resources, Inc. | Coosa Graphite Project
S-K 1300 Report |
December 11, 2023
SLR Project No.: 138.20527.00002 |
| 1.1.2.3 | Environmental
Studies, Permitting, and Plans, Negotiations, or Agreements with Local Individuals or Groups |
| 1. | Complete
baseline studies required for the permitting of the Project. |
| 2. | Engage
stakeholders including federal, state and local regulatory agencies as well as non-regulatory
stakeholders such as adjacent property owners, tribal entities and local communities. |
The economic analysis contained in this
TRS is preliminary in nature and is based, in part, on Inferred Mineral Resources that are considered too speculative geologically to
have modifying factors applied to them that would enable them to be categorized as Mineral Reserves. There is no certainty that economic
forecasts on which this Initial Assessment is based will be realized.
| 1.2.1 | Base
Case (Indicated and Inferred Mineral Resources) |
The Project base case cash flow is based
on Indicated and Inferred Mineral Resources (the latter being 89% of the total).
An after-tax Cash Flow Projection has
been generated from the LOM production schedule and capital and operating cost estimates and is summarized in Table 1-3. A summary of
the key criteria is provided below.
Revenue
| · | Mineralized
Material Inventory used for LOM planning: 72.7 Mst at 3.21% Cg with 2.33 Mst of contained
Cg (65.9 million tonnes at 3.21% Cg with 2.11 million tonnes contained Cg), 100% attributable
to Westwater. |
| · | An
average of 9,100 st (8,200 tonnes) mill feed per day mining from open pit for 4 Mst (3 million
tonnes) per year. |
| · | Mill
recovery averaging 92%. |
| · | 95%
C concentrate grade at 100% payable. |
| · | Average
annual Cg concentrate sales: 103,000 stpa (93,000 tonnes per year) |
| · | Graphite
price (CIF Kellyton Plant): US$998/st ($1,100/tonne). |
| · | Transport
to Kellyton Plant (CIF): $10.69/st ($11.90/tonne) derived from 70 mile round trip at $0.17/ton-mile |
Costs
| · | Pre-production
period: 24 months |
| · | LOM
production plan as summarized in this report. |
| · | Mine
life capital totals $293 million, including $142 million of sustaining capital. |
| · | Final
end of mine reclamation and closure costs: $43 million |
| · | Average
operating cost over the mine life is $15.41/st milled ($16.99/tonne milled). |
| | 1-6 | |
Westwater Resources, Inc. | Coosa Graphite Project
S-K 1300 Report |
December 11, 2023
SLR Project No.: 138.20527.00002 |
Taxation and Royalties
| · | Royalties:
Merchant 0.5% NSR up to a maximum of $150,000; Lessor 2% NSR. |
| · | Coosa
County Severance Tax: $5/st concentrate ($5.51/tonne) |
| · | 10
year Modified Accelerated Cost Recovery System (MACRS) depreciation method was used with
total allowance of $286.3 million taken during the LOM |
| · | Percentage
depletion method (14% for graphite) was used with total allowance of $305.4 million taken
during the LOM |
| · | Loss
Carry Forwards - Income tax losses may be carried forward indefinitely but may not be used
for prior tax years |
| · | Federal
tax rate of 21%, Alabama state income tax rate of 6.5% |
| 1.2.1.2 | Cash
Flow Analysis |
Table 1-3 presents a summary of the
Project Base Case economics at an Cg price of $998/st ($1,110/tonne). On a pre-tax basis, the undiscounted cash flow totals $714.1 million
over the mine life. The pre-tax net present value (NPV) at an 8% discount rate is $229.2 million and pre-tax Internal Rate of Return
(IRR) is 26.7%. On an after-tax basis for the base case, the undiscounted cash flow totals $608.2 million over the mine life. The after-tax
NPV at an 8% discount rate is $190.2 million and the after-tax IRR is 24.2%.
| | 1-7 | |
Westwater Resources, Inc. | Coosa Graphite Project
S-K 1300 Report |
December 11, 2023
SLR Project No.: 138.20527.00002 |
| |
Table 1-3: |
After-Tax Base Case Cash Flow Summary |
| Item |
Unit |
Value |
| Cg Price |
$/st |
998 |
| Cg Concentrate Sales |
Mst |
2.26 |
| Total Gross Revenue |
US$ M |
2,254 |
| Mining Costs |
US$ M |
(379) |
| Processing Costs |
US$ M |
(639) |
| G&A Costs |
US$ M |
(102) |
| Product Transport to Kellyton Plant Cost |
US$ M |
(28) |
| Production Taxes/Royalties |
US$ M |
(56) |
| Total Operating Costs |
US$ M |
(1,204) |
| Operating Margin |
US$ M |
1,050 |
| Operating Margin |
US$ M |
48% |
| Corporate Income Tax |
US$ M |
(139) |
| Operating Cash Flow |
US$ M |
911 |
| Development Capital |
US$ M |
(152) |
| Sustaining Capital |
US$ M |
(142) |
| Final Closure/Reclamation |
US$ M |
(43) |
| Total Capital |
US$ M |
(336) |
| |
|
|
| Pre-tax Free Cash Flow |
US$ M |
714.1 |
| Pre-tax NPV @ 8% |
US$ M |
229.2 |
| Pre-tax IRR |
% |
26.7 |
| |
|
|
| After-tax Free Cash Flow |
US$ M |
608.2 |
| After-tax NPV @ 8% |
US$ M |
190.2 |
| After-tax IRR |
% |
24.2 |
| | 1-8 | |
Westwater Resources, Inc. | Coosa Graphite Project
S-K 1300 Report |
December 11, 2023
SLR Project No.: 138.20527.00002 |
| 1.2.1.3 | Sensitivity
Analysis |
Project risks can be identified in both
economic and non-economic terms. Key economic risks were examined by running cash flow sensitivities:
Pre-tax IRR sensitivity over the base
case has been calculated for -20% to +20% variations. The sensitivities are shown in Table 1-4 and Figure 1-1 and Figure 1-2. The Project
is most sensitive to head grade, graphite price, and recovery, and only slightly less sensitive to operating cost and capital cost. The
sensitivities to metallurgical recovery, head grade, and metal price are nearly identical.
| |
Table 1-4: |
After-Tax Sensitivity Analyses |
| Variance |
Head Grade
(% Cg) |
NPV at 8%
(US$ millions) |
IRR |
| 80% |
2.57% |
48 |
12.9% |
| 90% |
2.89% |
119 |
18.9% |
| 100% |
3.21% |
190 |
24.2% |
| 110% |
3.53% |
261 |
29.1% |
| 120% |
3.85% |
332 |
33.8% |
| Variance |
Recovery
(%) |
NPV at 8%
(US$ millions) |
IRR |
| 90% |
82.8% |
119 |
18.9% |
| 95% |
87.4% |
155 |
21.6% |
| 100% |
92.0% |
190 |
24.2% |
| 105% |
96.6% |
226 |
26.7% |
| 108% |
99.4% |
247 |
28.2% |
| Variance |
Metal Prices
(US$/st Cg Concentrate) |
NPV at 8%
(US$ millions) |
IRR |
| 80% |
$798 |
46 |
12.6% |
| 90% |
$898 |
118 |
18.8% |
| 100% |
$998 |
190 |
24.2% |
| 110% |
$1,097 |
262 |
29.2% |
| 120% |
$1,197 |
335 |
34.0% |
| | 1-9 | |
Westwater Resources, Inc. | Coosa Graphite Project
S-K 1300 Report |
December 11, 2023
SLR Project No.: 138.20527.00002 |
| Variance |
Operating Costs
(US$/st) |
NPV at 8%
(US$ millions) |
IRR |
| 90% |
14.40 |
226 |
26.7% |
| 95% |
15.18 |
208 |
25.5% |
| 100% |
15.96 |
190 |
24.2% |
| 115% |
18.29 |
136 |
20.2% |
| 130% |
20.63 |
83 |
15.9% |
| Variance |
Capital Costs
(US$ M) |
NPV at 8%
(US$ M) |
IRR |
| 90% |
302 |
209 |
27.3% |
| 95% |
286 |
219 |
29.1% |
| 100% |
336 |
190 |
24.2% |
| 115% |
386 |
161 |
20.4% |
| 130% |
437 |
132 |
17.3% |
| |
Figure 1-1: |
After-Tax NPV Sensitivity Analysis |

| | 1-10 | |
Westwater Resources, Inc. | Coosa Graphite Project
S-K 1300 Report |
December 11, 2023
SLR Project No.: 138.20527.00002 |
| |
Figure 1-2: |
After-Tax IRR Sensitivity Analysis |

| 1.2.2 | Alternate
Case (Indicated Mineral Resources Only) |
Only 7 million tons, or 11%, of the
72.7 million tons in the base case production schedule are Indicated Mineral Resources. The QP has determined that a stand alone alternative
case with only Indicated resource tonnage is not economic using the assumptions and inputs outlined in the base case.
| | 1-11 | |
Westwater Resources, Inc. | Coosa Graphite Project
S-K 1300 Report |
December 11, 2023
SLR Project No.: 138.20527.00002 |
| 1.3.1 | Property
Description |
The Coosa graphite deposit is located
at the southern end of the Appalachian Mountain range, in the western part of Coosa County, Alabama, USA. The deposit area is approximately
50 miles (mi) south-southeast of the city of Birmingham and 23 mi south-southwest of the town of Sylacauga. The Project is located in
the Alabama Graphite Belt.
The Project consists of six primary
areas of interest: Northern Extension (NX), Main Grid, Southwest Extension (SW), Fixico Mine, HS-North, and HS-South. The approximate
geographical center of the target areas of interest is located at latitude 32°54’40.7”N and longitude 86°23’52.4”W.
Access to the Project site is via Highway US 280 for approximately 64 mi south from Birmingham, Alabama to State Highway AL-9S, then
approximately 10 miles west to State Highway AL-22 W, 12 mi west to Coosa County Road 29, and 12 mi north to the property.
The Coosa property mineral tenure is
comprised of approximately 41,965 acres of privately owned mineral rights held by Westwater under a long-term lease located in parts
of townships T. 21 N., T. 22 N., T. 23 N., and T. 24 N. and ranges R. 16 E., R. 17 E., R. 18 E., and R. 19 E. The western boundary is
approximately the Coosa River.
A 2% net smelter return (NSR) royalty
is payable by Westwater to the lessor from the commercial production and sale of graphite from the properties, as well as royalties for
any precious metals, mica, iron, magnetite, manganese, calcium carbonate, copper, tantalum, and rare earths commercially produced and
sold from the properties. An additional 0.5% NSR royalty is payable to Charles Merchant, an arm’s length party, who was engaged
as an independent contractor to assist AGC with establishing its graphite operations in Alabama.
The presence of graphitic schists in
Alabama was recognized before the Civil War (1861-1865) by M. Tuomey. Dr. Gessner, employed by the Confederate Government to recover
sulfur from the pyrite deposit at Pyriton, is credited with the first discovery of flake graphite in Alabama. The first commercial graphite
operation dates back to 1899 when the Allen Graphite Company built a mill near the Quenelda deposits in Clay County using a patented
oil flotation process and produced the first refined graphite in Alabama.
The mineral and surface rights of four
sections in the Fixico Mine area of the Project were acquired by the Fixico Mining Company (Fixico) in 1901-1902. The mine operated from
1902 to 1908. There is no record of the amount of graphite and grade produced.
AGC’s subsidiary, Alabama Graphite
Co. Inc. (Alabama Graphite), acquired the Project from Eugenia W. Dean (since 2014 the Estate of Eugenia W. Dean), Birmingham, Alabama
in 2012 and carried out exploration from 2012 to 2018, including channel sampling, trenching, airborne and ground geophysical surveys,
and four drilling programs.
Westwater acquired AGC on April 23,
2018. After acquisition, Westwater’s technical staff carried out a review of historical data and geologic information derived from
previous graphite exploration drilling and surface trenching programs at Coosa to determine the potential for the presence of substantial
vanadium mineralization at the Project. In late 2018, Company personnel carried out an extensive geochemical sampling program, collecting
nearly 2,000 samples from many previously completed drill holes and trenches, to determine the presence and intensity of vanadium mineralization
at Coosa. The laboratory analytical results of this sampling program outlined widespread and strong vanadium mineralization in very close
association with strong flake graphite mineralization at numerous localities within the Project area.
| | 1-12 | |
Westwater Resources, Inc. | Coosa Graphite Project
S-K 1300 Report |
December 11, 2023
SLR Project No.: 138.20527.00002 |
| 1.3.4 | Geological
Setting, Mineralization, and Deposit |
The Project is located at the southern
end of the Appalachian Mountain range, a northeast trending belt of folded and metamorphosed rocks of Neoproterozoic to Lower Paleozoic
age. These are covered by the Coastal Plain Sediments of Cretaceous and younger age in the southern half of Alabama. The rocks of the
southwestern end of the Appalachians are generally separated into four physiographic and geologic provinces which are, from northwest
to southeast: the Interior Low Plateau province, the Appalachian Plateau province, the Valley and Ridge province, and the Piedmont province.
The Alabama Graphite Belt is located in the Northern Piedmont.
The Northern Piedmont has three structural
blocks: the Talladega Block on the northwestern side with low grade greenschist facies metasedimentary and metavolcanic rocks; the central
Coosa Block with high grade, upper greenschist to kyanite and sillimanite grade metamorphic rocks, and abundant pegmatite and small granitoid
bodies; and the Tallapoosa Block on the southeastern side of high grade, middle to upper amphibolite facies metasedimentary, metavolcanic,
and metamorphosed ultramafic and mafic rocks, with large areas of quartz diorite to granitic plutonic rocks.
The host of the Project is the Higgins
Ferry Formation in the Wedowee Group of the Coosa Block. The Higgins Ferry Formation is defined as an interbedded sequence of four major
lithologic units, from top to bottom: a quartz-graphite schist (QGS), a mixed QGS-quartz-muscovite-biotite-graphite schist unit (called
INT or intermediate unit), quartz muscovite biotite graphite schist (QMBGS), and a quartz-biotite-garnet schist (QBGS).
The Coosa graphite deposits are flake
graphite deposits in high grade metamorphic rocks. Graphite flakes occur as part of the rock forming minerals in the schists. They are
often associated with disseminated pyrrhotite and minor pyrite. In places, the green vanadium (V) bearing muscovite, roscoelite,
also occurs. Minor late stage, straight-sided veinlets of cubic pyrite up to 10 mm wide with smectite clay cross cut the schistosity
and pegmatites. The deposits are characterized by deep weathering.
The lithologic sequence at Coosa, from
top to bottom, is QGS overlying INT, overlying QMBGS, overlying QBGS. QGS generally grades downward into INT, then into QMBGS, which
in turn grades downward into QBGS. QMBGS is more highly metamorphosed than QGS and less metamorphosed than QBGS. All of the units are
moderately to well foliated, with the foliations probably representing paleo-bedding of the original sedimentary rocks. In addition,
several amphibolite intrusives occur on the Project, cutting the metamorphic units and intruding them.
QGS is the main host of graphite mineralization
at Coosa. QGS can be fine to coarse grained, with minor small biotites and small to medium muscovites, and is usually well foliated.
Graphite grades are typically in the order of 2% to 4%, occasionally up to 5% to 7%. QGS also generally contains the largest amount of
vanadium-rich muscovite (roscoelite for a field term). Pyrite and/or pyrrhotite can be present, generally averaging less than 1% to 2%,
are fine grained, and occur as either disseminated grains or thin (hairline to 1/8 in. thick) veinlets along foliations. Occasional hairline
to 1/4 in. thick late pyrite veinlets are found cutting the foliations at high angles. Outcrops of QGS can be light green-gray to dark
green, depending on the amount of weathering and oxidation. Roscoelite imparts the light to dark green color to the QGS.
| | 1-13 | |
Westwater Resources, Inc. | Coosa Graphite Project
S-K 1300 Report |
December 11, 2023
SLR Project No.: 138.20527.00002 |
INT reflects a gradual increase in metamorphic
grade with depth and/or laterally from QGS towards QMBGS. Graphite ranges from 1% to 2%, occasionally up to 3%. In some places there
is a gradual increase in the grain size of muscovite and biotite as the QGS is metamorphosed to QMBGS. In other places, the INT unit
is marked by interlayers of QGS and QMBGS. These interlayers vary from several inches to several feet thick. Where there is a gradual
change from QGS to QMBGS, graphite grade decreases with increasing metamorphic grade. In areas with interlayers of QGS and QMBGS, the
QGS layers have higher graphite grade than the QMBGS layers. INT is rarely distinguishable in outcrop, due to limited vertical exposures
providing evidence of interlayering and due to the gradual grain size change from QGS to QMBGS. Roscoelite content in the INT decreases
with increasing metamorphism from QGS to QMBGS.
QMBGS is noticeable by its medium to
coarse grained nature and by the large biotites and muscovites that occur along foliations. Biotite can be honey colored to dark brown.
Pyrite and pyrrhotite can be present, usually less than 1% to 2% and fine to medium grained. QMBGS is well foliated, with the foliations
commonly moderately to strongly contorted. Outcrops can range from light to dark gray to grey-brown. Graphite assays are typically less
than 1% to 2%, with the graphite often being coarse grained due to recrystallization of the graphite grains.
Several surface exploration campaigns
were conducted between 2012 to 2015. Due to the lack of outcrop and dense vegetation, the exploration techniques used were rock sampling
in channels mainly along road cuttings, trenching, geophysics, and drilling. Since acquisition of the Project in 2018, Westwater has
completed in-fill/delineation diamond drilling for a total of 5,551 ft in 65 holes. The Company has also conducted a geochemical sampling
program using available core and trench material to determine the presence and intensity of vanadium mineralization at the Project.
To date, a total of 236 holes for 45,715
ft have been drilled at the Project, of which 205 holes totaling 39,434 ft were used in the Mineral Resource estimation. Since 2012,
most drilling was focused on the Main Grid and NX target areas of the Project.
| 1.3.6 | Mineral
Resource Estimate |
A Mineral Resource estimate was completed
by SLR using a conventional block modeling approach. The general workflow performed by SLR included the construction of a geological
or stratigraphic model representing the Higgins Ferry Group Graphitic Schist sequence in Seequent’s Leapfrog Geo (Leapfrog Geo)
from mapping, drill hole logging, and sampling data, which was used to define discrete domains and surfaces representing the upper contact
of each unit. The geologic model was then used to constrain resource estimation. The resource estimate used regularized block models,
the inverse distance squared (ID2) methodology, and length-weighted, 10 ft, uncapped composites to estimate the Cg and V in
a three-search pass approach, using hard boundaries between subunits, ellipsoidal search ranges, and search ellipse orientation informed
by geology. Average density values were assigned by lithological unit.
Estimates were validated using standard
industry techniques including statistical comparisons with composite samples and parallel nearest neighbor (NN) estimates, swath plots,
and visual reviews in cross-section and plan. A visual review comparing blocks to drill holes was completed after the block modeling
work was performed to ensure general lithologic and analytical conformance and was peer reviewed prior to finalization.
| | 1-14 | |
Westwater Resources, Inc. | Coosa Graphite Project
S-K 1300 Report |
December 11, 2023
SLR Project No.: 138.20527.00002 |
Mineral Resources have been classified
in accordance with the definitions for Mineral Resources in S-K 1300. Mineral Resources estimated by SLR used all drill results available
as of March 17, 2022, and are summarized in Table 1-1 with an effective date of November 30, 2022. No additional drilling has
been completed since that date and the Mineral Resource estimate remains current.
To ensure that all Mineral Resource
statements satisfy the “reasonable prospects for economic extraction” (RPEE) requirement, factors significant to technical
feasibility and potential economic viability were considered. Mineral Resources were defined and constrained within an open-pit shell
prepared by SLR and based on a US$1,100/st graphite value.
The SLR QP is of the opinion that with
consideration of the recommendations summarized in this section of the TRS, any issues relating to all relevant technical and economic
factors likely to influence the prospect of economic extraction can be resolved with further work. There are no other known legal, social,
or other factors that would affect the development of the Mineral Resources.
The Coosa Project is proposed to be
operated as a conventional open pit mine with 20 ft bench heights, using drilling and blasting for rock breakage, and excavator and trucks
for material handling.
Production from the mines is planned
to be fed to the nearby processing plant with a nominal capacity of 3.2 Mstpa (approximately 3.0 million tonnes per year).
| 1.3.8 | Mineral
Processing and Metallurgical Testing |
The Coosa concentrator plant was designed
for a nominal 3.2 Mstpa of ROM feed based on preliminary design criteria.
Mine haul trucks will tip into a surge
bin feeding a primary jaw crusher designed for 86% availability. The primary crushed mill feed will be conveyed to a 5/8 in. (15 mm)
sizing screen, with the oversize reporting to the secondary crusher and the undersize fed forward to the rod mill circuit.
A
150 ton fine feed bin will provide surge capacity for the grinding circuit, to ensure a constant feed rate to the rod mill. The rod mill
will operate in closed circuit with a 10 mesh scalping screen. Undersize from the screen will be fed to a flash flotation cell, with
the flash cell tailing pulp gravitating to the ball mill classification screen. The screen separates at a P80 of 450 μm,
with the oversize reporting to the mill and the undersize going to the rougher flotation feed box.
The rougher flotation stage will consist
of a bank of six conventional (“trough”) cells in series. Each cell will have independent airflow control. The rougher concentrate
is combined with the flash concentrate and pumped to a pre-cleaner flotation circuit consisting of a bank of five trough cells in series.
The pre-cleaner concentrate will be
dewatered using a vibrating screen with 230 mesh openings, with the screen oversize reporting to the first of two polishing scrubbers.
The scrubber discharge is combined with the screen undersize (solution) to serve as feed to the first cleaner column flotation cell.
Two stages of conventional scavenger flotation cells are used to recover Cg from the first cleaner tail, returning Cg concentrate to
the 1st cleaner column feed and 1st polishing scrubber feed screen, respectively.
| | 1-15 | |
Westwater Resources, Inc. | Coosa Graphite Project
S-K 1300 Report |
December 11, 2023
SLR Project No.: 138.20527.00002 |
First
cleaner flotation concentrate will be screened at 80 mesh (177 μm)
by the 2nd polishing scrubber feed screen, with the oversize reporting to the 2nd polishing scrubber ahead of 2nd column flotation
cells. The screen undersize will be thickened prior to attrition scrubbing and column flotation in a 3rd set of column flotation
cells. Final cleaner concentrate from both the 2nd and 3rd flotation column circuits are combined, thickened and
filtered in filter presses comprising the final concentrate product.
The slurry from the rougher and pre-cleaner
circuits will be pumped to the filtration facility near the tailings management facility. At the filtration plant, the slurry will be
thickened, filtered, and transported to the tailings management facility.
Reagents will be stored, mixed, and
distributed from a central reagents area. Frother, collector, and lime will be pumped from the reagents area to the flotation section
using peristaltic reagent pumps to accurately dose the process.
| 1.3.9 | Infrastructure
and Site Layout |
The Project infrastructure consists
of the following:
| · | Process
plant, mobile equipment and maintenance shops |
| · | Office/administration
area |
| · | Co-mingled
waste rock and Filtered Tailings Storage Facility (FTSF) |
This infrastructure is required to support
the final facility generating on average approximately 100,000 stpa of concentrate.
Office and dry facilities will be portable
offices located near the mill.
The site access road is approximately
3.4 miles from Coosa County Road 29. It will be upgraded to allow truck traffic to carry the flake concentrate from the mine to the purification
plant. This road will be maintained as a gravel road with the proper ditches and culverts for surface drainage.
Approximately 460,000 gal/d of fresh
water will be required to satisfy water demand for the process plant. This will come from water collection in the settling pond below
the FTSF as well as from a series of water wells.
Electrical power for the site will be
supplied by electrical grid power brought to the site. Access to the Alabama Power transmission line is possible with a 3.75 miles line
connecting to the west of the Project. The power line would follow existing roads to facilitate easy installation and periodic checks.
At full capacity, the plant will have
a connected load of 12.7 MW with an operating load of 11.6 MW. The mill will be serviced with a main substation and electrical power
distributed by a combination of cable ducts and aerial lines.
The FTSF will be located to the east
of the processing plant. The slurry material will be pumped to the filtration facility near the FTSF. After filtration, the solids will
be placed in the FTSF and compacted in place. The tailings from the oxidized zone are assumed to be non-acid generating, while the reduced
zone tailings are expected to be acid generating. These assumptions will need to be verified with material from the pilot plant test
work and further studies.
| | 1-16 | |
|
Westwater Resources, Inc. | Coosa Graphite Project
S-K 1300 Report |
December 11, 2023
SLR Project No.: 138.20527.00002 |
The waste rock will be mixed with the
filtered tailings to create a single dump platform for maintenance and reclamation purposes.
Based on the conceptual FTSF layout,
the tailings facility will provide storage for approximately 73 Mst (66 million tonnes) of tailings and 15 Mst (13.5 million tonnes)
of waste material, for a total capacity of 88 Mst (79.5 million tonnes).
For the economic analysis in this TRS,
the long term pricing forecast for natural flake graphite (North America Cost, Insurance, and Freight (CIF), 94-95% C, Real USD
basis) is a constant basket price of US$1,100 per tonne (US$998 per ton) delivered to Westwater’s Kellyton, AL plant. This represents
a conservative approach to pricing trends.
The Project is located on 2,667 acres
located in Coosa County, Alabama, approximately eight miles west of Rockford, Alabama. The Project area is forested with unpaved roads
throughout and the current land use is silviculture and recreational hunting. The southern border of the Project area is shared with
the Coosa Wildlife Management Area (WMA), and the Coosa WMA Shooting Range is located approximately one mile east.
The Project area is located within the
Mobile Bay watershed and the Coosa River water basin and includes multiple small tributaries to the Coosa River and Weogufka Creek.
| 1.3.12 | Capital
and Operating Costs |
The capital and operating cost estimates
for the Project are based on factored costs from other operations, the SLR QP’s judgment, and analogy. The change in the cost basis
for this TRS, due to the proposed increase in Cg production rates and the requirement for cost escalation, makes the accuracy, in the
SLR QP’s opinion, an American Association of Cost Engineers (AACE) International Class 5 cost estimate with an accuracy range
of -20% to -50% to +30% to +100%.
Table 18-1-5 summarizes the LOM capital
cost estimate for the 95,000 stpa to 105,000 stpa (86,000 to 95,000 tonnes per year) concentrate production schedule.
| | 1-17 | |
|
Westwater Resources, Inc. | Coosa Graphite Project
S-K 1300 Report |
December 11, 2023
SLR Project No.: 138.20527.00002 |
Table
1-5: Base Case LOM Capital Cost Estimate Summary
| Area |
(US$000) |
| Mining |
13,231 |
| Processing |
89,230 |
| Infrastructure |
17,180 |
| Tailings Facility |
31,919 |
| Total Development Capital |
151,559 |
| Mining |
22,284 |
| Processing/ Infrastructure |
6,786 |
| Tailings Facility |
112,636 |
| Total Sustaining Capital |
141,706 |
| Mine/Plant Closure/Reclamation |
8,736 |
| FTSF Closure/Reclamation |
33,975 |
| Total Closure/Reclamation |
42,711 |
| Grand Total |
335,977 |
The operating cost estimates in this
TRS were derived from MCS cost guides, a subscription-based cost database, that total $15.41/st mill feed ($16.99/tonne mill feed) as
follows:
| · | Mining:
$5.21/st mill feed, $4.33/st mined; ($5.75/tonne mill feed, $4.77/tonne mined) |
| · | Processing:
$8.80/st mill feed; ($9.70/tonne mill feed) |
| · | G&A:
$1.40/st mill feed; ($1.54/tonne mill feed) |
| · | Total:
$15.41/st mill feed ($16.99/tonne mill feed) |
| | 1-18 | |
|
Westwater Resources, Inc. | Coosa Graphite Project
S-K 1300 Report |
December 11, 2023
SLR Project No.: 138.20527.00002 |
SLR International Corp. (SLR) was retained
by Westwater Resources, Inc. (Westwater or the Company) to prepare an independent Technical Report Summary (TRS) on the Coosa Graphite
Project (the Project or Coosa), located in Coosa County, Alabama, USA. The purpose of this TRS is to disclose results of an Initial Assessment
(IA) of the Project, including an economic analysis, based on the Mineral Resource estimate with an effective date of November 30,
2022. The Mineral Resource estimate was reported in the previous TRS dated December 1, 2022 and remains unchanged as no additional
work has been completed on the property since that time.
This TRS conforms to United States Securities
and Exchange Commission’s (SEC) Modernized Property Disclosure Requirements for Mining Registrants as described in Subpart 229.1300
of Regulation S-K, Disclosure by Registrants Engaged in Mining Operations (S-K 1300) and Item 601 (b)(96) Technical Report Summary.
Westwater is a 45-year old public company
currently focused on developing battery-grade natural graphite. Originally incorporated in 1977 as Uranium Resources, Inc. to mine
uranium in Texas, the Company has been reborn as an energy materials and technology developer. Westwater is focused on battery-grade
natural graphite after its acquisition of Alabama Graphite Corp. (AGC) in April 2018. AGC acquired the Project in 2012 based on
the geologic setting. On April 23, 2018, Westwater acquired a 100% interest in AGC as part of a strategic decision to refocus the
Company to supply battery manufacturers with low-cost, high-quality, and high-margin natural graphite products. As a result of that business
transaction, Westwater became the owner of the Project.
The Coosa graphite deposit is located
at the southern end of the Appalachian Mountain range, in Coosa County, Alabama. The deposit area is approximately 50 miles south-southeast
of the city of Birmingham and 23 miles south-southwest of the town of Sylacauga. The Project’s mineral tenure is comprised of approximately
41,965 acres of privately owned mineral rights that the Company holds under a long-term lease. The Project is located in the flake graphite
belt of central Alabama, also known as the Alabama Graphite Belt.
SLR’s Qualified Person (QP) for
Geology and Mineral Resources visited the Project on April 21-23, 2022. The SLR QP toured the Kellyton Graphite Plant offices, warehouses,
operational areas, and processing facility (currently under construction), located in Kellyton, Alabama. At the Project, the SLR QP also
toured drilling and trench site locations in the deposit area, reviewed drill core logging and sampling procedures, reviewed geologic
cross sections and previous modeling procedures with Westwater’s geologist and other staff, and discussed ongoing and future exploration
plans.
An SLR waste management engineer visited
the site on September 5, 2023, accompanied by a Westwater geologist, in order to review locations of the proposed processing plant,
filtration process, Filtered Tailings Storage Facility (FTSF), and other areas around the Project.
| 2.2 | Sources
of Information |
During the preparation of this TRS,
discussions were held with personnel from Westwater:
| · | Mr. Cevat
Er, Chief Technical Officer –Westwater |
| · | Mr. Ted
Wilton, PG, CPG, MAIG, Consulting Geologist, Westwater |
| · | Mr. David
Greenan, Consulting Geologist, Westwater |
| · | Mr. Michael
Vineyard, Geologist, Alabama Graphite Products, LLC, a subsidiary of Westwater |
The documentation reviewed, and other
sources of information, are listed at the end of this TRS in Section 24.0 References.
| | 2-1 | |
|
Westwater Resources, Inc. | Coosa Graphite Project
S-K 1300 Report |
December 11, 2023
SLR Project No.: 138.20527.00002 |
The U.S. System for weights and units
has been used throughout this TRS. Tons are reported in short tons (st) of 2,000 lb unless otherwise noted. All currency in this TRS
is US dollars (US$) unless otherwise noted.
Abbreviations used in this TRS are listed
below.
| μ |
micron |
kVA |
kilovolt-amperes |
| μg |
microgram |
kW |
kilowatt |
| a |
annum |
kWh |
kilowatt-hour |
| A |
ampere |
L |
litre |
| bbl |
barrels |
lb |
pound |
| Btu |
British
thermal units |
L/s |
litres
per second |
| °C |
degree
Celsius |
m |
metre |
| C$ |
Canadian
dollars |
M |
mega
(million); molar |
| cal |
calorie |
m2 |
square
metre |
| cfm |
cubic
feet per minute |
m3 |
cubic
metre |
| cm |
centimetre |
masl |
metres
above sea level |
| cm2 |
square
centimetre |
m3/h |
cubic
metres per hour |
| d |
day |
mi |
mile |
| dia |
diameter |
min |
minute |
| dmt |
dry
metric tonne |
μm |
micrometre |
| dwt |
dead-weight
ton |
mm |
millimetre |
| fasl |
feet
above sea level |
mph |
miles
per hour |
| °F |
degree
Fahrenheit |
MVA |
megavolt-amperes |
| ft |
foot |
MW |
megawatt |
| ft2 |
square
foot |
MWh |
megawatt-hour |
| ft3 |
cubic
foot |
oz |
Troy
ounce (31.1035g) |
| ft/s |
foot
per second |
oz/st,
opt |
ounce
per short ton |
| g |
gram |
ppb |
part
per billion |
| G |
giga
(billion) |
ppm |
part
per million |
| Gal |
Imperial
gallon |
psia |
pound
per square inch absolute |
| g/L |
gram
per litre |
psig |
pound
per square inch gauge |
| Gpm |
Imperial
gallons per minute |
RL |
relative
elevation |
| g/t |
gram
per tonne |
s |
second |
| gr/ft3 |
grain
per cubic foot |
st |
short
ton |
| gr/m3 |
grain
per cubic metre |
stpa |
short
ton per year |
| ha |
hectare |
stpd |
short
ton per day |
| hp |
horsepower |
t |
metric
tonne |
| hr |
hour |
tpa |
metric
tonne per year |
| Hz |
hertz |
tpd |
metric
tonne per day |
| in. |
inch |
US$ |
United
States dollar |
| in2 |
square
inch |
USg |
United
States gallon |
| J |
joule |
USgpm |
US
gallon per minute |
| k |
kilo
(thousand) |
V |
volt |
| kcal |
kilocalorie |
W |
watt |
| kg |
kilogram |
wmt |
wet
metric tonne |
| km |
kilometre |
wt% |
weight
percent |
| km2 |
square
kilometre |
yd3 |
cubic
yard |
| km/h |
kilometre
per hour |
yr |
year |
| kPa |
kilopascal |
|
|
| | 2-2 | |
|
Westwater Resources, Inc. | Coosa Graphite Project
S-K 1300 Report |
December 11, 2023
SLR Project No.: 138.20527.00002 |
The Coosa graphite deposit is located
at the southern end of the Appalachian Mountain range, in the western part Coosa County, Alabama, USA. The deposit area is approximately
50 miles (mi) south-southeast of the city of Birmingham and 23 mi south-southwest of the town of Sylacauga. The Project is located in
the flake graphite belt of central Alabama, also known as the Alabama Graphite Belt.
The Coosa property mineral tenure is
comprised of approximately 41,965 acres of privately owned mineral rights held by Westwater under a long-term lease located in parts
of townships T. 21 N., T. 22 N., T. 23 N., and T. 24 N. and ranges R. 16 E., R. 17 E., R. 18 E., and R. 19 E. The western boundary is
approximately the Coosa River.
The primary target areas of interest
for this TRS are located in parts of Sections 4, 5, 6, 7, 8, and 9, T. 22 N, R. 17 E, Coosa County, Alabama. The primary area of interest
is referred to as the Coosa Graphite Project and is divided into six primary target areas but only five are contained in the Mineral
Resource estimate:
| 3 | Southwest
Extension (SW) |
| 5 | HS-North
(excluded from the Mineral Resource estimate due to limited drilling) |
The approximate geographical center
of the target areas of interest is located at 32°54’40.7”N and longitude 86°23’52.4”W. All surface data
coordinates are State Plane 1927 Alabama East FIPS 0101 (US feet) system. Maps of the Project location, mineral rights, and target areas
are provided in Figure 3-1, Figure 3-2, and Figure 3-3, respectively. A list of the mineral rights is presented in Table 3-1.
The mineral rights are patents of private
land issued between 1842 and 1860. The surface land rights were subsequently sold separately from the mineral rights and are now held
by a different owner. The ownership of the mineral rights is a matter of public record in the Probate Records of Coosa County, Alabama.
The authority for the State of Alabama non-fuel minerals surface mining is the Alabama Department of Labor, Mining Division. No assessment
work is required to hold mineral rights on private land. The mineral rights were granted in perpetuity. The Coosa mineral rights are
identified by their township, range, section and, where relevant, quarters, in the same manner as land rights, and do not have an identification
number or name. The mineral rights have not been surveyed.
As the mineral rights are patents of
private land and were issued before the introduction of the General Mining Law of 1872, which governs mining on Federal public lands,
this law is not applicable to the Project and the mineral rights are not held as either patented or unpatented lode claims. Thus, the
mineral rights do not have claim names and are not defined by metes and bounds.
| | 3-1 | |
|
Westwater Resources, Inc. | Coosa Graphite Project
S-K 1300 Report |
December 11, 2023
SLR Project No.: 138.20527.00002 |
Table
3-1: Summary of Land Tenure Mineral Resources
| Township |
Range |
Section |
Quarter |
Area
(acres) |
| T. 21 N. |
R. 16 E. |
Section 12 |
SW1/4 NE1/4, NW1/4, S1/2 SW1/4, NW1/4 SE1/4, S1/2 SE1/4 |
400 |
| T. 21 N. |
R. 17 E. |
Section 01 |
E1/2 NE1/4, NW1/¼E 1/4 |
120 |
| T. 21 N. |
R. 17 E. |
Section 06 |
NE1/4 |
160 |
| T. 21 N. |
R. 17 E. |
Section 07 |
SE1/4 SE1/4 |
40 |
| T. 21 N. |
R. 17 E. |
Section 08 |
SW1/4 NE1/4, SE1/4 NW1/4, E1/2 NE1/4 SW1/4, SE1/4 SW1/4, W1/2 SE1/4 |
220 |
| T. 21 N. |
R. 17 E. |
Section 11 |
NE1/4 |
160 |
| T. 21 N. |
R. 17 E. |
Section 27 |
SE1/4 SE1/4 |
40 |
| T. 21 N. |
R. 17 E. |
Section 33 |
SW1/4 NW1/4, fractional NW1/4 SW1/4 |
69 |
| T. 21 N. |
R. 18 E. |
Section 02 |
NW1/4 NW1/4; ALSO 10 acres off the East side of the NE1/4 NW1/4; Also, all that part of the NW1/4 NE1/4 lying North of the creek Containing 20 acres, more or less |
70 |
| T. 21 N. |
R. 18 E. |
Section 03 |
SW1/4 NE1/4, N1/2 NW1/4 |
120 |
| T. 21 N. |
R. 18 E. |
Section 04 |
A tract of land on the East side of the NE1/4 NE1/4, Containing 6.5 acres, more or less |
6.5 |
| T. 21 N. |
R. 18 E. |
Section 05 |
N1/2 SE1/4 |
80 |
| T. 21 N. |
R. 18 E. |
Section 07 |
SE1/4 NE1/4, NE1/4 SE1/4, SW1/4 SW1/4 |
120 |
| T. 21 N. |
R. 18 E. |
Section 09 |
SE1/4 NE1/4, NW/4 NW1/4, NE1/4 SW1/4 |
120 |
| T. 21 N. |
R. 18 E. |
Section 17 |
NE1/4 SW1/4 |
40 |
| T. 21 N. |
R. 18 E. |
Section 21 |
NW1/4 NW1/4 |
40 |
| T. 22 N. |
R. 16 E. |
Section 01 |
All |
640 |
| T. 22 N. |
R. 16 E. |
Section 02 |
All |
640 |
| T. 22 N. |
R. 16 E. |
Section 03 |
E1/2 NW1/4, SE1/4 SE1/4 |
120 |
| T. 22 N. |
R. 16 E. |
Section 04 |
NE1/4 NE1/4, S1/2 NE1/4, NW1/4 NW1/4, N1/2 SW1/4 NW1/4, E1/2 SW1/4, SW1/4 SW1/4, SE1/4 |
460.1 |
| T. 22 N. |
R. 16 E. |
Section 05 |
NE1/4 |
160 |
| | 3-2 | |
|
Westwater Resources, Inc. | Coosa Graphite Project
S-K 1300 Report |
December 11, 2023
SLR Project No.: 138.20527.00002 |
| Township |
Range |
Section |
Quarter |
Area
(acres) |
| T. 22 N. |
R. 16 E. |
Section 08 |
Lot A |
14.1 |
| T. 22 N. |
R. 16 E. |
Section 09 |
N1/2, SE1/4, E1/2 SW1/4 |
554.2 |
| T. 22 N. |
R. 16 E. |
Section 10 |
N1/2, N1/2 SW1/4, NW1/4 SE1/4, NE1/4 SE1/4 |
481.1 |
| T. 22 N. |
R. 16 E. |
Section 11 |
S1/2 NW1/4, S1/2 SW1/4, NW1/4 SW1/4 |
200 |
| T. 22 N. |
R. 16 E. |
Section 12 |
N1/2, SW1/4 |
480 |
| T. 22 N. |
R. 16 E. |
Section 13 |
All |
641.2 |
| T. 22 N. |
R. 16 E. |
Section 14 |
All |
640 |
| T. 22 N. |
R. 16 E. |
Section 15 |
S1/2, S1/2 NW1/4, NE1/4 NE1/4 |
440.5 |
| T. 22 N. |
R. 16 E. |
Section 16 |
All of fractional N1/2 |
196.7 |
| T. 22 N. |
R. 16 E. |
Section 22 |
NE1/4, S1/2 NW1/4, NE1/4 NW1/4, all of fractional S1/2 |
580 |
| T. 22 N. |
R. 16 E. |
Section 23 |
All of fractional S1/2 |
318.3 |
| T. 22 N. |
R. 16 E. |
Section 24 |
All |
640 |
| T. 22 N. |
R. 16 E. |
Section 25 |
N1/2 NE1/4, NW1/4, E1/2 SE1/4; also 10 acres in the Northeast Corner of the NW1/4 SW1/4; also, a fractional part containing 250 acres, more or less, as described in that certain deed from the trustees under the last will and testament of John R. Hegeman to Charles A. Dean, dated 11 November 1929, and recorded in Deed Book 6, page 582, in the land records of the Probate Judge's Office, Coosa County, Alabama. |
580 |
| T. 22 N. |
R. 16 E. |
Section 36 |
E1/2 |
320 |
| T. 22 N. |
R. 17 E. |
Section 01 |
NW1/4 NW1/4 |
40 |
| T. 22 N. |
R. 17 E. |
Section 02 |
SE1/4 NE1/4, N1/2 NW1/4, N1/2 SE1/4 |
200 |
| T. 22 N. |
R. 17 E. |
Section 03 |
All |
640 |
| T. 22 N. |
R. 17 E. |
Section 04 |
NW1/4 NE1/4, E1/2 SE1/4, E1/2 NW1/4, E1/2 SW1/4 |
280 |
| T. 22 N. |
R. 17 E. |
Section 05 |
All |
640.96 |
| T. 22 N. |
R. 17 E. |
Section 06 |
All |
640 |
| T. 22 N. |
R. 17 E. |
Section 07 |
All |
640 |
| | 3-3 | |
|
Westwater Resources, Inc. | Coosa Graphite Project
S-K 1300 Report |
December 11, 2023
SLR Project No.: 138.20527.00002 |
| Township |
Range |
Section |
Quarter |
Area
(acres) |
| T. 22 N. |
R. 17 E. |
Section 08 |
All |
640 |
| T. 22 N. |
R. 17 E. |
Section 09 |
All |
640 |
| T. 22 N. |
R. 17 E. |
Section 10 |
All, except E1/2 SE1/4 SW1/4 |
620 |
| T. 22 N. |
R. 17 E. |
Section 11 |
All, except E1/2 NW1/4 |
560 |
| T. 22 N. |
R. 17 E. |
Section 12 |
W1/2 except 8 acres in the SE corner of the SE1/4 SW1/4 |
312 |
| T. 22 N. |
R. 17 E. |
Section 13 |
E1/2 NW1/4 |
80 |
| T. 22 N. |
R. 17 E. |
Section 14 |
W1/2 NW1/4, SW1/4, W1/2 SE1/4, NE1/4 SE1/4 |
360 |
| T. 22 N. |
R. 17 E. |
Section 15 |
NE1/4, SW1/4, N1/2 SE1/4, SE1/4 SE1/4 |
440 |
| T. 22 N. |
R. 17 E. |
Section 17 |
All |
640 |
| T. 22 N. |
R. 17 E. |
Section 18 |
SW1/4, NE1/4 SE1/4, W1/2 NW1/4 SE1/4, S1/2 SE1/4 |
300 |
| T. 22 N. |
R. 17 E. |
Section 19 |
All |
640 |
| T. 22 N. |
R. 17 E. |
Section 20 |
N1/2, N1/2 S1/2 |
480 |
| T. 22 N. |
R. 17 E. |
Section 21 |
NE1/4 NE1/4, S1/2 NE1/4, NW1/4 NW1/4, S1/2 NW1/4, S1/2 |
560 |
| T. 22 N. |
R. 17 E. |
Section 22 |
All |
642 |
| T. 22 N. |
R. 17 E. |
Section 23 |
N1/2, Also, the South 15 acres of the SE1/4 SE1/4 |
335 |
| T. 22 N. |
R. 17 E. |
Section 24 |
SE1/4 SE1/4 |
40 |
| T. 22 N. |
R. 17 E. |
Section 25 |
All, except SW1/4 SE1/4 |
600 |
| T. 22 N. |
R. 17 E. |
Section 26 |
N1/2, SW1/4, W1/2 SE1/4, all NE1/4 SE1/4 North of Hatchett Creek |
580 |
| T. 22 N. |
R. 17 E. |
Section 27 |
N1/2 NE1/4, S1/2 NW1/4, SW1/4, W1/2 SE1/4, SE1/4 SE1/4 |
440.9 |
| T. 22 N. |
R. 17 E. |
Section 31 |
All |
640 |
| T. 22 N. |
R. 17 E. |
Section 32 |
All |
640 |
| T. 22 N. |
R. 17 E. |
Section 33 |
N1/2, SW1/4, NW1/4 SE1/4, SE1/4 SE1/4 |
560 |
| T. 22 N. |
R. 17 E. |
Section 34 |
S1/2 NW1/4, NE1/4 SW1/4 |
120 |
| | 3-4 | |
|
Westwater Resources, Inc. | Coosa Graphite Project
S-K 1300 Report |
December 11, 2023
SLR Project No.: 138.20527.00002 |
| Township |
Range |
Section |
Quarter |
Area
(acres) |
| T. 22 N. |
R. 17 E. |
Section 35 |
NW1/4 NE1/4, NE1/4 NW1/4 except 10 acres off the West side |
70 |
| T. 22 N. |
R. 18 E. |
Section 09 |
SW1/4 SE1/4, E1/2 SE1/4 |
120 |
| T. 22 N. |
R. 18 E. |
Section 10 |
N1/2 SW1/4 |
80 |
| T. 22 N. |
R. 18 E. |
Section 15 |
NW1/4 NW1/4 |
40 |
| T. 22 N. |
R. 18 E. |
Section 16 |
NE1/4 NW1/4, W1/2 W1/2 |
200 |
| T. 22 N. |
R. 18 E. |
Section 17 |
SW1/4 NE1/4, SE1/4, S1/2 SW1/4 |
280 |
| T. 22 N. |
R. 18 E. |
Section 18 |
S1/2 SE1/4 SE1/4 |
20 |
| T. 22 N. |
R. 18 E. |
Section 19 |
NE1/4 NE1/4, S1/2 NE1/4, S1/2 NW1/4, SW1/4, N1/2 SE1/4; Also, 25 acres lying South of Hatchett Creek in the NE1/4 NW1/4; Also, 20 acres lying East of Cox Mill Road in the SE1/4 SE1/4 |
485 |
| T. 22 N. |
R. 18 E. |
Section 20 |
N1/2 NE1/4; SW1/4 NE1/4 less 10 acres in the Southwest corner thereof; E1/2 NW1/4 less 2 acres now or formerly owned by J.D. Hardy, and less 10 acres East of the Old Road in the Southeast corner of the SE1/4 NW1/4; W1/2 NE1/4 SW1/4 less 1 acre at the church; 5 acres in the Northwest corner of the NE1/4 SE1/4; W1/2 W1/2 |
362 |
| T. 22 N. |
R. 18 E. |
Section 21 |
NW1/4 NW1/4 |
40 |
| T. 22 N. |
R. 19 E. |
Section 07 |
NE1/4 SE1/4 except 15 acres now or formerly owned by G.W. Miller |
25 |
| T. 23 N. |
R. 16 E. |
Section 03 |
S1/2, SE1/4 NW1/4 |
360 |
| T. 23 N. |
R. 16 E. |
Section 04 |
E1/2, NW1/4, N1/2 SW1/4, N1/2 S1/4 SW1/4 |
600 |
| T. 23 N. |
R. 16 E. |
Section 05 |
All |
643 |
| T. 23 N. |
R. 16 E. |
Section 07 |
Lot A |
42 |
| T. 23 N. |
R. 16 E. |
Section 08 |
NE1/4, NW1/4 less 13 acres covered by waters of the Coosa River |
307.1 |
| T. 23 N. |
R. 16 E. |
Section 10 |
W1/2 W1/2 |
160 |
| T. 23 N. |
R. 16 E. |
Section 11 |
W1/2 NE1/4, NE1/4 NW1/4, S1/2 NW1/4, NW1/4 SW1/4, SE1/4 SW1/4, S1/2 SE1/4 |
361.1 |
| T. 23 N. |
R. 16 E. |
Section 13 |
S1/2 NW1/4, NW1/4 NW1/4, W1/2 NE1/4 NW1/4, SW1/4 |
300 |
| T. 23 N. |
R. 16 E. |
Section 14 |
All |
641.1 |
| T. 23 N. |
R. 16 E. |
Section 15 |
All |
641.1 |
| | 3-5 | |
|
Westwater Resources, Inc. | Coosa Graphite Project
S-K 1300 Report |
December 11, 2023
SLR Project No.: 138.20527.00002 |
| Township |
Range |
Section |
Quarter |
Area
(acres) |
| T. 23 N. |
R. 16 E. |
Section 16 |
NE1/4 NE1/4, SW1/4 NW1/4, W1/2 SW1/4, SE1/4 SW1/4, S1/2 SE1/4 |
280 |
| T. 23 N. |
R. 16 E. |
Section 17 |
NE1/4 SW1/4, S1/2 S1/2 except that part covered by the waters of the Coosa River |
193.1 |
| T. 23 N. |
R. 16 E. |
Section 20 |
W1/2 NE1/4, N1/2 NW1/4, SE1/4 NW1/4, E1/2 SE1/4 |
280 |
| T. 23 N. |
R. 16 E. |
Section 21 |
All, except 10 acres in the Southwest corner of the NW1/4 NW1/4 |
630 |
| T. 23 N. |
R. 16 E. |
Section 22 |
All |
640 |
| T. 23 N. |
R. 16 E. |
Section 23 |
W1/2, W1/2 E1/2, NE1/4 NE1/4, SE1/4 SE1/4 |
560 |
| T. 23 N. |
R. 16 E. |
Section 24 |
SW1/4, NW1/4 NW1/4 |
200.1 |
| T. 23 N. |
R. 16 E. |
Section 25 |
All |
640.1 |
| T. 23 N. |
R. 16 E. |
Section 26 |
E1/2 NW1/4, NW1/4 NW1/4, 5 acres in the SW1/4 NW1/4, SE1/4 NE1/4, NE1/4 SE1/4, SW1/4 |
365.5 |
| T. 23 N. |
R. 16 E. |
Section 27 |
NW1/4, W1/2 NE1/4, NW1/2 NE1/4 NE1/4 (the Northwest half of NE1/4 NE1/4) |
260 |
| T. 23 N. |
R. 16 E. |
Section 28 |
S1/2 NE1/4, NE1/4 NE1/4, W1/2 NW1/4, the North 30 acres of the NE1/4 NW1/4, S1/2 |
531.5 |
| T. 23 N. |
R. 16 E. |
Section 29 |
All |
641.6 |
| T. 23 N. |
R. 16 E. |
Section 31 |
All of fractional section |
10 |
| T. 23 N. |
R. 16 E. |
Section 32 |
All of fractional section |
620.32 |
| T. 23 N. |
R. 16 E. |
Section 33 |
NW1/4, NW1/4 SW1/4, W1/2 NE1/4 SW1/4 |
220 |
| T. 23 N. |
R. 16 E. |
Section 34 |
E1/2 NE1/4, N1/2 SE1/4, SE1/4 SE1/4, all of the SW/14 NE1/4 lying East of Clay Creek |
230.8 |
| T. 23 N. |
R. 16 E. |
Section 35 |
SW1/4 NE1/4, NW1/4, N1/2 SW1/4, SW1/4 SW1/4, NW1/4 SE1/4, S1/2 SE1/4 SE1/4 |
380 |
| T. 23 N. |
R. 16 E. |
Section 36 |
All |
640 |
| T. 23 N. |
R. 17 E. |
Section 18 |
E1/2 SE1/4 |
80 |
| T. 23 N. |
R. 17 E. |
Section 19 |
S1/2, NW1/4 NE1/4 |
360 |
| T. 23 N. |
R. 17 E. |
Section 20 |
S1/2 |
320 |
| T. 23 N. |
R. 17 E. |
Section 28 |
N1/2 N1/2, SW1/4 NE1/4, SE1/4 NW1/4, N1/2 SE1/4, SE1/4 SE1/4 E1/2 SW1/4, SW1/4 SW1/4 |
480.8 |
| T. 23 N. |
R. 17 E. |
Section 29 |
All |
641.1 |
| | 3-6 | |
|
Westwater Resources, Inc. | Coosa Graphite Project
S-K 1300 Report |
December 11, 2023
SLR Project No.: 138.20527.00002 |
| Township |
Range |
Section |
Quarter |
Area
(acres) |
| T. 23 N. |
R. 17 E. |
Section 30 |
All |
640 |
| T. 23 N. |
R. 17 E. |
Section 31 |
All |
640 |
| T. 23 N. |
R. 17 E. |
Section 32 |
All |
640 |
| T. 23 N. |
R. 17 E. |
Section 33 |
NE1/4 NE1/4, NW1/4, SW1/4, S1/2 SE1/4, NE1/4 SE1/4 |
480 |
| T. 23 N. |
R. 17 E. |
Section 34 |
SW1/4 SW1/4, SE1/4 SE1/4 |
80 |
| T. 23 N. |
R. 18 E. |
Section 32 |
W1/2 NW1/4, NE1/4 NW1/4 |
120 |
| T. 23 N. |
R. 19 E. |
Section 20 |
NW1/4 SW1/4 |
40 |
| T. 24 N. |
R. 16 E. |
Section 32 |
NW1/4 NE1/4, S1/2 NE1/4, E1/2 NW1/4, SW1/4, N1/2 SE1/4, SE1/4 SE1/4 |
480 |
| Total |
|
|
|
41,964.9 |
| | 3-7 | |
|
Westwater Resources, Inc. | Coosa Graphite Project
S-K 1300 Report |
December 11, 2023
SLR Project No.: 138.20527.00002 |
Figure
3-1: Location Map
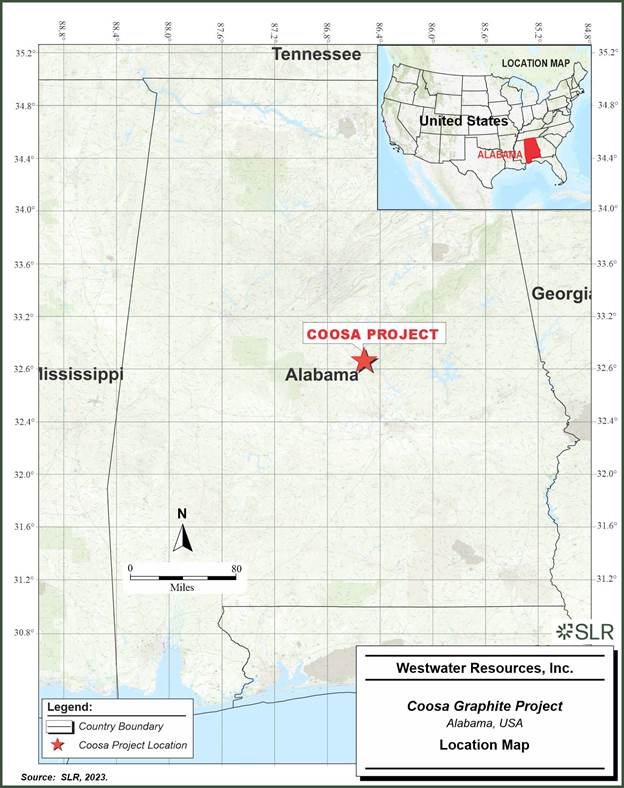
| | 3-8 | |
|
Westwater Resources, Inc. | Coosa Graphite Project
S-K 1300 Report |
December 11, 2023
SLR Project No.: 138.20527.00002 |
Figure
3-2: Westwater Mineral Holdings Map
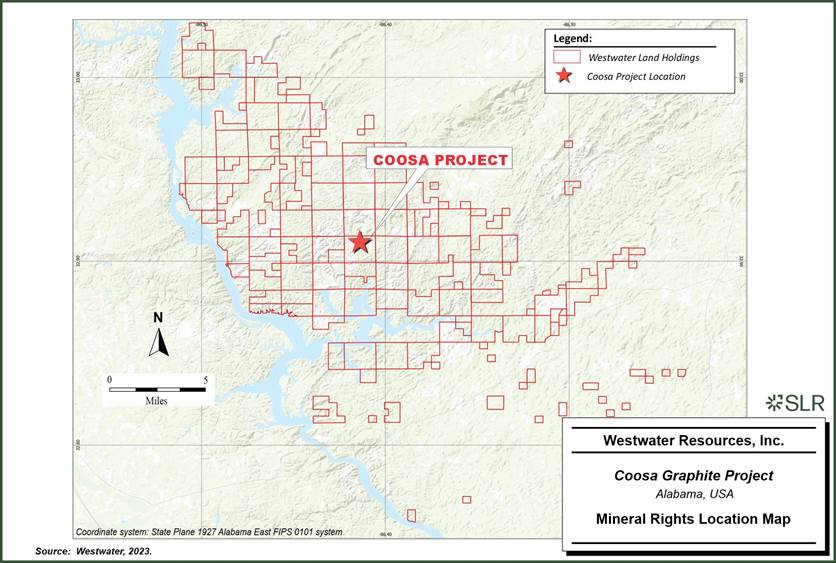
| | 3-9 | |
|
Westwater Resources, Inc. | Coosa Graphite Project
S-K 1300 Report |
December 11, 2023
SLR Project No.: 138.20527.00002 |
Figure
3-3: Target Areas
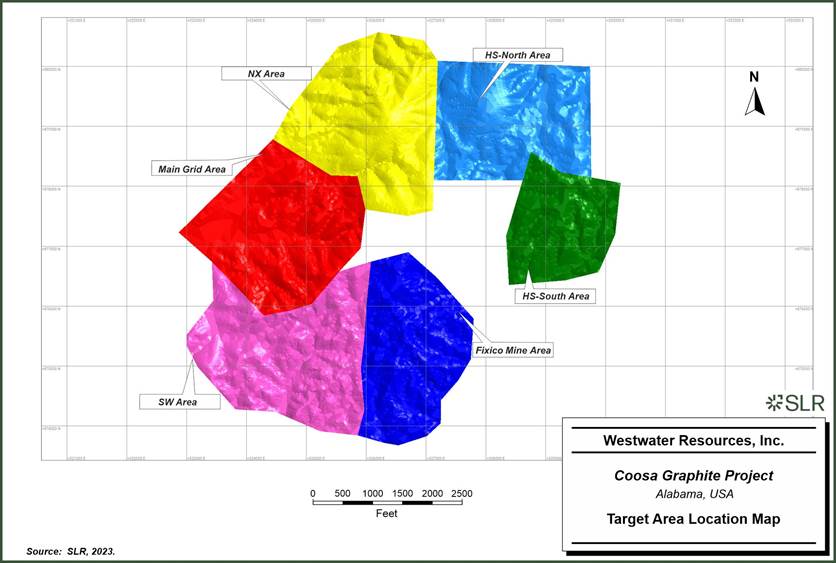
| | 3-10 | |
|
Westwater Resources, Inc. | Coosa Graphite Project
S-K 1300 Report |
December 11, 2023
SLR Project No.: 138.20527.00002 |
On August 1, 2012, AGC’s
subsidiary, Alabama Graphite Co. Inc. (Alabama Graphite), a company registered in Alabama, entered into a Mining Lease Agreement (the
Agreement) and Option with Eugenia W. Dean (since 2014 the estate of Eugenia W. Dean), Birmingham, Alabama pursuant to which it: (a) leased
the mineral rights in respect to an area with the potential for graphite comprising 14,020.86 acres (approximately 5,674 ha) in township
22N, range 17E, Coosa County, Alabama; and (b) received an option of first refusal to lease the mineral rights to adjacent areas
comprising 30,756.52 acres (12,447 ha). On November 5, 2012, Alabama Graphite exercised the option and leased an additional 27,944.02
acres (approximately 11,308 ha) of the remaining available acres under the same terms as in the initial agreement. The total property
under lease is now 41,964.88 acres (approximately 16,982 ha).
Under the terms of the Agreement, the
lease is for successive renewable five-year terms (not to exceed 70 years) in consideration of an initial cash payment of $30,000 and
annual advance royalty payments of $10,000, starting on July 1, 2015 (paid). Alabama Graphite also paid $1,000 for the Option and
was required to make annual payments of $1,000 to keep the Option in good standing. Alabama Graphite made a payment of $48,537 on November 5,
2012, to exercise the Option as an initial three-year payment through November 4, 2015, and issued 25,000 shares to the lessor.
Alabama Graphite is also obliged to
pay the lessor a net smelter returns (NSR) royalty of 2% from the commercial production and sale of graphite from the properties, as
well as royalties for any precious metals, mica, iron, magnetite, manganese, calcium carbonate, copper, tantalum, and rare earths commercially
produced and sold from the properties.
In connection with entering into the
Agreement and Option, Alabama Graphite engaged Charles Merchant (Merchant), an arm’s length party, as an independent contractor
to assist it with establishing its graphite operations in Alabama. As consideration for his services, Alabama Graphite paid Merchant
the cash sum of $320,000 and he is entitled to 800 common shares1 of the Company (the “Finder’s Shares”)
to him once Alabama Graphite has a surface rights agreement to engage in meaningful mining operations on the mineral interests for the
Coosa Graphite property. There is currently no surface rights agreement in place for the Coosa Graphite property.
| 1 | On August 1, 2012, an Agreement
was executed by Mr. Merchant, Alabama Graphite Company, Inc., and Keymark Resources, Inc. (Keymark), which provided Mr. Merchant with
an ownership interest in 500,000 shares of Keymark common stock but with that ownership only vesting on the Surface Rights Date. The
Surface Rights Date is the date when a Surface Rights Agreement is executed; a Surface Rights Agreement would allow AGC to engage in
meaningful mining operations on the mineral interests specified in the Agreement; and there is no Surface Rights Agreement currently
in place for any properties associated with the Coosa Graphite properties. At the time of the execution of the Agreement, Keymark was
the parent company for Alabama Graphite Company, Inc. On August 31, 2012, Keymark changed its name to Alabama Graphite Corp. (AGC). When
Westwater acquired AGC on April 23, 2018, each share of AGC common stock was exchanged for 0.08 shares of Westwater’s common stock.
In other words, the 500,000 shares of AGC’s stock became 40,000 shares of Westwater’s common stock. Further, one year later,
on April 23, 2019, following approval by Westwater’s stockholders and an action by the Westwater Board of Directors, a 1-for-50
reverse split of Westwater’s common stock became effective, and those 40,000 shares would now be only 800 shares. |
| | 3-11 | |
|
Westwater Resources, Inc. | Coosa Graphite Project
S-K 1300 Report |
December 11, 2023
SLR Project No.: 138.20527.00002 |
Alabama Graphite is obliged to pay Merchant
an additional $100,000 upon receipt by Alabama Graphite of a bankable feasibility study (FS) in respect of the leased property and a
further $150,000 upon full permitting of the leased property. This TRS is not an FS, and currently the Coosa Graphite property does not
have any permits. The Company is also obliged to pay Merchant NSR royalties of 0.5% up to an aggregate amount of $150,000 if and when
graphite mining operations commence on the leased property.
On November 23, 2020, Westwater
executed a temporary access permit (TAP) with Hancock Forest Management, Inc. (Hancock) which currently owns the surface rights
for the Coosa graphite properties. Hancock purchased the surface rights from Headwaters Investment Corp. in 2018. The TAP allows Westwater
to engage in core drilling and testing for graphite deposits, and to travel to the Project via vehicles on existing roads and routes,
until January 31, 2023. On January 28, 2021, the TAP was amended to allow access to the property even during the hunting season
provided hunter orange vests are worn.
Previously, AGC had a Surface Use Agreement
with Headwaters Investments Corporation covering 3,481 acres (1,409 ha). The first period of that agreement was until September 1,
2013, and it was renewed for a second period until September 30, 2015. The agreement covered the area of the drill grid and allowed
AGC to carry out exploration including sampling, trenching and drilling. Payments of $53,000 were made for the first period and $50,000
for the second period plus a guarantee of $20,000 placed in escrow. The payments were based on the amount of anticipated surface disturbance.
The Surface Use Agreement provided for unrestricted access to the property with the stipulation that AGC is responsible for reclamation
of any surface disturbance caused by its exploration activities.
Headwater Investments Corp. has fee
simple ownership of the surface rights. They are required to pay an annual property tax of $1.13 per acre. The property taxes have been
paid in full to date and the property is in good standing.
SLR is not aware of any royalties other
than those discussed in the previous sections.
| 3.6 | Required
Permits and Status |
Exploration, road access, and drilling
at the Project is subject to environmental permits from the Alabama Department of Environmental Management (ADEM) including a Construction
storm water permit under the National Pollutant Discharge Elimination System (NPDES), and General Permit #ALR1000000 authorizing discharges.
A Construction Best Management Practices Plan (CBMPP) was issued on March 12, 2021 for Westwater’s 2021-2022 drilling program
and expires on March 31, 2026.
| 3.7 | Other
Significant Factors and Risks |
SLR is not aware of any environmental
liabilities on the property. Provided that TAP is extended beyond its current expiration date of January 31, 2023, Westwater has
all required permits to conduct the proposed work on the property. SLR is not aware of any other significant factors and risks that may
affect access, title, or the right or ability to perform the proposed work program on the property.
| | 3-12 | |
|
Westwater Resources, Inc. | Coosa Graphite Project
S-K 1300 Report |
December 11, 2023
SLR Project No.: 138.20527.00002 |
| 4.0 | Accessibility,
Climate, Local Resources, Infrastructure and Physiography |
Access to the Project site is via Highway
US 280 for approximately 63 mi south from Birmingham, Alabama to State Highway AL-9S, then approximately 10 miles west to State Highway
AL-22 W, 12 mi west to Coosa County Road 29, and 12 mi north to the property. Sylacauga and Alexander City, Alabama, located approximately
24 mi and 38 mi respectively from the property are the closest small cities with hotels and services. The nearest major airport with
scheduled flights is in Birmingham, Alabama, and there is an airfield at Sylacauga. All material potentially mined from the Project will
be milled at the Project site and the concentrate will be transported to Westwater’s graphite processing plant located in Kellyton,
Alabama, approximately 35 mi to the east.
The climate zone of Alabama is classified
as humid subtropical (Cfa) under the Koppen Climate Classification. The Holdridge Life Zones Climate Classification is subtropical moist
forest.
The nearest climatic data available
is for Sylacauga. The average annual temperature is 61.7°F. The warmest month is July with an average temperature of 78.7°F
and the coolest month is January with an average temperature of 43.2°F. The maximum average high is 90.6°F in July, and
the minimum average low is 31.4°F in January. Average annual precipitation is 55.2 in. The wettest month is March with an average
of 5.9 in. Snow is rare with an average of 0.8 in. It is humid in the summer. The state is prone to tropical storms, hurricanes, thunderstorms,
and tornadoes. Due to the moderate climate in the Project area, the operating season is year round.
Personnel and supplies for future mining
operations are expected to be sourced from the nearby towns of Birmingham and Sylacauga, Alabama (50 mi and 23 mi, respectively). The
area within 10 mi of the property is very sparsely populated, so a mine would directly affect very few people. Mining has been a traditional
industry in the area, and marble quarries are still active.
There is no infrastructure in the immediate
area of the property, other than a network of well-maintained logging access roads. An electrical transmission line occurs approximately
one mile west of the drill grid. Water is abundant in small streams and in Mitchell Lake, a large impoundment on the Coosa River at the
western edge of the property.
The property is located in an area of
ridges and valleys with elevations of approximately 350 fasl to 1,200 fasl (106 masl to 365 masl). The area of the drill grid is a peneplain
surface dipping gently south at an elevation of 600 fasl to 700 fasl (183 masl to 214 masl) and incised by a meandering river system
to give a local relief of up to 300 ft (92 m). The elevations of the drill collars vary from approximately 351 fasl to 766 fasl (106
masl to 233 masl).
| | 4-1 | |
|
Westwater Resources, Inc. | Coosa Graphite Project
S-K 1300 Report |
December 11, 2023
SLR Project No.: 138.20527.00002 |
The land use is forestry with thick
mixed hardwoods and pines, and significant areas of pine plantations which are harvested every 20 to 25 years. There are clearings at
towns and for agriculture. Due to extensive weathering, natural outcrops are sparse and most useful exposures are in road cuts, stream
drainages, or old mine workings.
Weogufka Creek runs from northeast to
southwest on the north side of the drill grid, and joins Swamo Creek, the Coosa River, and the Mitchell Lake dam. This is a tributary
of the Alabama River which flows southwest, becomes the Mobile River, and then flows into the Gulf of Mexico at Mobile.
| | 4-2 | |
|
Westwater Resources, Inc. | Coosa Graphite Project
S-K 1300 Report |
December 11, 2023
SLR Project No.: 138.20527.00002 |
The long and complicated history of
ownership of the mineral and surface rights of the Project is described in the Preliminary Title Review dated May, 2021 and prepared
by Deborah L. S. Goetz of Landres Management Consultants, for Sections 3, 4, 5, 7, 8 and 9, Township 22 N, Range 17 E, where AGC and
Westwater have carried out exploration activities. A brief summary is provided below.
The mineral and surface rights of Sections
3, 4, 5, 7, 8 and 9 are patents of private land issued between 1842 and 1860. Most of them were acquired by the Fixico Mining Company
in 1901-02. Several other companies and individuals owned other parts. Following bankruptcy of Fixico in 1910, their mineral and surface
rights were acquired by John R. Hegeman. In 1929, the mineral rights were acquired by Charles A. Dean (senior). He acquired more mineral
rights over the years and, on his death in 1952, they passed to multiple heirs who sold a half interest to Robert A. Russell. In 1980,
Charles A. Dean, Junior, acquired all of the mineral rights from the other Dean heirs and the Russell heirs. On the death of Charles
A. Dean, Junior in 2008, the mineral rights were inherited by his wife, Eugenia W. Dean, and following her death in 2014, they were inherited
by the Estate of Eugenia W. Dean.
On August 1, 2012, AGC’s
subsidiary, Alabama Graphite, a company registered in Alabama, entered into a Mining Lease Agreement and Option with Eugenia W. Dean
(since 2014 the estate of Eugenia W. Dean), Birmingham, Alabama pursuant to which it: (a) leased the mineral rights in respect to
an area with the potential for graphite comprising 14,020.86 acres (approximately 5,674 ha) in township 22N, range 17E, Coosa County,
Alabama; and (b) received an option of first refusal to lease the mineral rights to adjacent areas comprising 30,756.52 acres (12,447
ha). On November 5, 2012, Alabama Graphite exercised the option and leased an additional 27,944.02 acres (approximately 11,308 ha)
of the remaining available acres under the same terms as in the initial agreement. The total property under lease is now 41,964.88 acres
(approximately 16,982 ha).
On April 23, 2018, Westwater acquired
a 100% interest in Alabama Graphite as part of a strategic decision to refocus the Company to supply battery manufacturers with low-cost,
high-quality, and high-margin natural graphite products. As a result of that business transaction, Westwater became the owner of the
Coosa Graphite Project, which was the principal asset of Alabama Graphite.
| 5.2 | Exploration
and Development History |
| 5.2.1 | The
Alabama Graphite Belt |
The following sections describe the
history of graphite mining and exploration in the Alabama Graphite Belt and is provided for background information on the regional setting
of the Coosa Project. The information is taken from published sources as summarized by Pallister and Thoenen (1948) and Durgin (2013).
These are not necessarily an indication of the mineralization that occurs on the Coosa Project.
The Alabama Graphite Belt is a 70 mi
long, northeast-trending belt in Clay, Coosa, and Chilton Counties. Most of the historical mines were in the northeast segment around
Ashland, Clay County (Area A of Pallister and Thoenen, 1948), approximately 18 mi long, separated by an 11 mi gap from the 40 mi long,
southwest segment extending from Goodwater, Coosa County, to Verbena, Chilton County (Areas B and C). The geology of the graphite deposits
at Ashland was described by Brown (1925). The Coosa Project occurs beside the historic Fixico Mine in the southwestern part of the belt
(Area C).
| | 5-1 | |
|
Westwater Resources, Inc. | Coosa Graphite Project
S-K 1300 Report |
December 11, 2023
SLR Project No.: 138.20527.00002 |
The presence of graphitic schists in
Alabama was recognized by M. Tuomey before the Civil War (1861-1865; Jones, 1929). Dr. Gessner, employed by the Confederate Government
to recover sulfur from the pyrite deposit at Pyriton, is credited with the first discovery of flake graphite in Alabama (Clemmer et al.,
1941). The first attempt at development was in 1888, however, an experimental mill using water for flotation was unsuccessful. The first
commercial graphite operation dates back to 1899 when the Allen Graphite Company built a mill near the Quenelda deposits in Clay County
using a patented oil flotation process and produced the first refined graphite in Alabama.
The Fixico Mine in Coosa County, adjacent
to the Project, and the Dixie Mine in Chilton County began operations in the early 1900s. By 1906, there were several mines in operation
and by 1913, the graphite industry was well established in central Alabama. World War I caused the disruption of foreign graphite imports,
leading to significantly higher prices and the Alabama graphite industry boomed. By 1918, there were 25 flotation plants operating in
the district with a total production in 1918 of 7.8 million pounds of graphite (Pallister and Thoenen, 1948).
The end of the war and the resumption
of foreign imports depressed prices and the Alabama graphite industry dwindled to seven operating plants in 1920. In 1929, the last two
mines in the district, the Ceylon Graphite Company in Coosa County and the Superior Flake Plant in Clay County, were closed.
At the start of World War II in 1939,
C. J. Johnson rebuilt the mill at the Ceylon Mine and began production of flake graphite on a small scale. In 1940, as a result of the
interruption of graphite imports from Madagascar, the US Bureau of Mines made a preliminary survey of the Alabama graphite deposits to
determine the viability of resumption of mining, with a report by Clemmer et al. (1941). As the demand for graphite rose, the War Production
Board, the Metals Reserve Company, and the Reconstruction Finance Corporation (all federally funded) turned their attention to the district,
and a detailed study of the district was carried out between 1942 and 1944 which resulted in a report by Pallister and Thoenen (1948).
Based on this report, the graphitic deposits were found to contain significant amounts of green vanadium-bearing mica (roscoelite). A
total of 11 mining areas including 49 graphite deposits were mapped and studied in detail for graphite and vanadium. More than nine miles
of access roads were built; 17,930 ft of bulldozer trenches, 2,670 ft of power scoop trenches, 5,234 ft of hand trenches, and 3,279 ft
of existing trenches were dug and sampled. Diamond drilling totaled 5,453 ft in 84 holes (Pallister and Thoenen, 1948).
A field laboratory was established in
Ashland with the capacity for pilot crushing-milling-flotation testing and graphite analyses. In 1943, the Crucible Flake Mill of Haile
Mines, Inc. and the Alabama Flake Graphite Co. plant (Gisler, 1943) began to produce. The three plants produced 8.1 Mlb of graphite,
with Alabama again ranking first in graphite production in the US. The Crucible Flake Mill was closed at the end of 1943, leaving only
two producers in the district.
After World War II, production declined
rapidly due to the resumption of imports and subsequent decline in prices. By 1950, only the Pocahontas Mine near Ashland and the Bama
Mine in Chilton County were still in production, and they closed in 1953. The Alabama graphite industry has been idle since that time.
The processing plants have all been dismantled, burned down, or overgrown, and the graphite workings are hidden under more than 60 years’
vegetation. With the current resurgence of interest in graphite deposits, attention is being turned again to the central Alabama Graphite
District.
| | 5-2 | |
|
Westwater Resources, Inc. | Coosa Graphite Project
S-K 1300 Report |
December 11, 2023
SLR Project No.: 138.20527.00002 |
Mineable grade graphite bodies were
greatly elongated along strike and were referred to as “leads”, and often included selvages of waste rock. Cameron and Weiss
(1960, p. 263) described the leads as follows:
The total length of some of the larger
leads may be measurable in miles, but the full length of a lead is not necessarily ore, for there is much variation in graphite content
both along and across strike. A typical section shows alternating layers of rocks of low graphite content, of high graphite content,
and of intermediate graphite content. The individual layers range from fractions of an inch (<1 cm) to 10 feet (3 m) in thickness,
with aggregate thickness in some cases greater than 100 feet (30 m). Exposures outside the mine workings are poor and none of the individual
leads Is exposed. The Pocahontas lead was traced by trenching along strike for approximately 4,000 feet (1,220 m) and Brown (1925) reported
that he was able to trace a lead on the Griesemer property for a like distance.
Two good examples of mines in the Ashland
area are the Quenelda Mine and the Pocahontas Mine. At Quenelda, there were seven pits spaced along the strike of the leads for approximately
2,000 ft (610 m). The pits were almost entirely in weathered mineralization along two leads 20 ft to 40 ft (6 m to 12 m) apart. The southeast
lead was 40 ft to 65 ft thick, and the northwest lead was 50 ft to 80 ft (15 m to 25 m) thick, with a strike of 55° to 75° to
the northeast and a dip of 55° to 85° to the southeast. Graphite grades averaged approximately 3.0%.
The Pocahontas Mine of the Alabama Flake
Graphite Company was one of the last operating mines in Alabama. The workings comprised three parallel open cuts in the leads that were
approximately 50 ft wide and several hundred feet long. The depth of weathering could exceed 80 ft (25 m). Pallister and Thoenen (1948)
indicated that the lead was shown to extend for another 2,400 ft (731 m) southwest from the third cut. The grade was reported to average
4.0% to 5.0% graphite in later years.
The two most significant mines in the
southwestern portion of the Alabama Graphite Belt were the Ceylon and Bama mines. The Ceylon deposit is located approximately eight miles
west of the town of Goodwater. One of the largest mines in the district, it operated from 1916 to 1929 and from 1939 to 1947. The principal
working developed during the later period was 925 ft long, up to 300 ft wide, and up to 70 ft deep on a series of leads striking 45°
to the northeast and dipping 55° to the southeast. The grade ranged from 2.0% to 6.0% graphite and averaged 3%.
The Bama Mine in Chilton County near
the southwest end of the graphite belt operated from 1925 to 1930 when the mill burned down. The main pit was 625 ft long, 150 ft wide,
and 40 ft to 80 ft deep. Two smaller pits approximately 200 ft long were mined along strike between the main pit and the mill. The deposits
trended 20° to 25° to the northwest and dipped 50° to 60° to the south, due to the presence of a large fold.
The Fixico Mine is located approximately
0.5 mi southeast of the Coosa Main Grid area and is a former producer that operated from 1902 to 1908. There is no record of the amount
of graphite and grade produced. Westwater geologists have located the old pits and the old wooden dam, described below. The mine was
described by Pallister and Thoenen (1948, pp. 72-73):
The Fixico graphite mine, named for
the Indian chief Fixico, who lived near the mine. It is in the southern part of sec. 8, T. 22 N., R. 17 E., 11 miles west of Rockford.
C. F. Whoolock, who first used a “flotation” process to separate graphite in 1898 at the A. A. Allen plant in Clay County,
operated the Fixico mine with his son Kennard. About 1902, they built a log dam, which is still intact, a mill, and houses for their
employees and operated the mine until about 1908. It is thus probably the oldest mine in Coosa County.
| | 5-3 | |
|
Westwater Resources, Inc. | Coosa Graphite Project
S-K 1300 Report |
December 11, 2023
SLR Project No.: 138.20527.00002 |
The graphitic schist that was mined
is exposed on the western slope of a tributary of Hatchett Creek, the backwater of which, caused by the Mitchell Dam, is not far from
the property. The western slope rises for over 100 ft above the creek level, and the pits open off a small cross valley. Mine pits were
opened at various levels and running at angles from northeast through west to southwest. The largest pit is about 10 ft above the creek
and extends northeast for a distance of 150 ft. It is 75 ft wide and 50 ft deep at the face. A short distance to the northwest are two
parallel pits each 100 ft long, 25 ft to 30 ft wide, and 30 ft deep with a narrow “horse” between them. The floor of these
pits is 40 feet higher than the floor of the largest pit. Four additional pits cut across the top of the slope towards the west, and
two more extend southwest at a lower level opposite the northeast pits.
The schist has a general N45°E strike
and 45°SE dip. The beds of graphitic schist extend for 150 ft to 200 ft in thickness, with barren layers between the schist beds.
The country to the northeast rises for 400 ft to 500 ft before it drops off, giving room for large possible reserves.
From 2012 to 2018, exploration on the
Project was carried out by AGC’s subsidiary Alabama Graphite and included channel sampling, trenching, airborne and ground geophysical
surveys, and drilling. Further details for Alabama Graphite’s exploration are provided in Section 7 of this TRS.
| 5.3 | Historical
Resource Estimates |
A thorough review was made of all the
known graphite producing areas in the Alabama Graphite Belt district in 1942-1944 (Pallister and Thoenen, 1948), which resulted in a
historical mineral resource estimate of 25,910,000 st in all classes. This included 11,059,000 st of “measured weathered ore reserves”,
3,351,000 st of “Inferred weathered ore”, and 11,500,000 st of “unweathered ore” in “Measured”, “Indicated”
and “Inferred” categories, with an average recoverable grade in the “Measured weathered ore” estimated at 3.0%
graphite (Pallister and Thoenen, 1948, p. 77).
These estimates are considered historical
in nature as they predate the introduction of the SEC standards and S-K 1300 and are quoted for information purposes only and should
not be relied upon. These are mineral resource estimates rather than mineral reserve estimates. The assumptions, parameters, and methods
used to make these estimates are not stated in the original publication. The historical resources include multiple deposits throughout
the Alabama Graphite District. They were made to evaluate the potential of the whole district. A QP has not completed sufficient work
to classify the historical estimate as current Mineral Resources or Mineral Reserves, and Westwater is not treating the historical resource
estimate as current Mineral Resources or Mineral Reserves.
There is no record of the amount of
graphite and grade produced from the Fixico Mine area and no production has taken place on other parts of the Project.
There has been historical production
from the Alabama Graphite Belt, however, the records are not complete. In 1899, the Allen Graphite Company “was able to produce
several hundred tons of graphite” (Jones, 1929). In 1917-1919 Alabama ranked first in production of flake graphite in the USA,
and again in 1943 (Pallister and Thoenen, 1948). Between 1913 and 1920, approximately 35.5 Mlb of graphite were produced, with the greatest
number of producers in 1918.
In 1929, three mills produced 3.5 Mlb
of graphite, but all were closed by 1930. In 1943, a total of 8.1 Mlb were produced, and two mills continued to produce until 1953. Production
statistics are unavailable.
| | 5-4 | |
|
Westwater Resources, Inc. | Coosa Graphite Project
S-K 1300 Report |
December 11, 2023
SLR Project No.: 138.20527.00002 |
| 6.0 | Geological
Setting, Mineralization, and Deposit |
The Project is located at the southern
end of the Appalachian Mountain range, a northeast trending belt of folded and metamorphosed rocks of Neoproterozoic to Lower Paleozoic
age. These are covered by the onlap Coastal Plain Sediments of Cretaceous and younger age in the southern half of Alabama. The geology
of Alabama is shown in Figure 6-1. The rocks of the southwestern end of the Appalachians are generally separated into four physiographic
and geologic provinces which are, from northwest to southeast: the Interior Low Plateau province, the Appalachian Plateau province, the
Valley and Ridge province, and the Piedmont province. The Alabama Graphite Belt is located in the Northern Piedmont.
The regional geology is described by
Raymond et al. (1988) in “Alabama Stratigraphy”. The Interior Low Plateau is a Paleozoic limestone plateau of moderate relief.
The Appalachian Plateau is underlain by a thick series of carbonates overlain by sandstones and shales of Cambrian to Pennsylvanian age.
The rocks have open folding and are moderately dissected resulting in sandstone and shale synclinal plateaus and, in the eastern part,
three linear anticlinal limestone valleys. The Valley and Ridge Province is a fold-thrust belt, with east dipping thrusts, of carbonates,
sandstones, and shales of Cambrian to Pennsylvanian age, similar to the stratigraphy of the Appalachian and Interior Low Plateaus. It
is separated from the Appalachian Plateau by a large scale east dipping thrust fault and consists of a series of subparallel ridges and
valleys.
The Piedmont Province is formed of Neoproterozoic
to early Paleozoic metamorphic rocks. The metamorphic grade increases across the Piedmont from lower greenschist facies in the northwest
to high grade migmatite facies in the southeast. It is divided into three lithotectonic provinces which are, from northwest to southeast:
the Northern Piedmont, Inner Piedmont, and Southern Piedmont, each bounded by major faults. The physiography of the Northern Piedmont
is characterized by prominent ridges with peaks up to 2,407 ft, becoming lower to the southeast. The Inner and Southern Piedmont provinces
have much more subdued topography.
The Northern Piedmont has three structural
blocks:
| · | The
Talladega Block on the northwestern side with low grade greenschist facies metasedimentary
and metavolcanic rocks (marble, phyllite, sandstone, chert, quartzite, greenstones); |
| · | The
central Coosa Block with high grade, upper greenschist to kyanite and sillimanite grade metamorphic
rocks (phyllite, schist, graphite schist, gneiss, migmatitic gneiss, quartzite, amphibolites),
including the Alabama Graphite Belt, and abundant pegmatite and small granitoid bodies; |
| · | The
Tallapoosa Block on the southeastern side of high grade, middle to upper amphibolite facies
metasedimentary rocks (phyllite, gneiss), metavolcanic (amphibolite) and metamorphosed ultramafic
and mafic rocks (pyroxenite, gabbro), with large areas of quartz diorite to granitic plutonic
rocks. |
The Coosa Block is thrust over the younger,
lower-greenschist facies metamorphic rocks of the Talladega Block along the Hollins Line Fault, located three miles northeast of the
Coosa graphite deposit.
| | 6-1 | |
|
Westwater Resources, Inc. | Coosa Graphite Project
S-K 1300 Report |
December 11, 2023
SLR Project No.: 138.20527.00002 |
The Inner Piedmont includes two groups
of high grade metamorphic rocks, including schists, gneisses, and amphibolites: the Dadeville (schist, amphibolite, gneiss, granitic
gneiss) and Opelika (schist, gneiss) complexes, with pyroxenite lenses and deformed granites.
The Southern Piedmont occupies the southeastern
corner of the region. It is also underlain by high grade metamorphic rocks of the Pine Mountain Block and the Wacoochee and Uchee complexes.
The Pine Mountain Block contains quartzite, quartzitic schists, and dolomitic marble. The Wacoochee Complex is largely granitic gneiss
and feldspathic muscovite-biotite schist. The Uchee Complex contains a dioritic gneiss and a leucocratic quartz diorite. Folding is much
less evident there.
Regionally, the Coosa Block is interpreted
to be part of the Eastern Blue Ridge terrane which formed on the rifted margin of Laurentia on the breakup of the Rodinia super-continent
in the Neoproterozoic, and consists of rifted margin metasedimentary and rift-related volcanic rocks (Hatcher, 2010). The southern part
underwent metamorphism to upper amphibolite facies in the Taconian orogeny at 460 to 455 Ma (Upper Ordovician) and is bounded on the
west side by the Taconian suture (Hollins Line Fault) which can be traced for the length of the Appalachians, with different names. The
Western Blue Ridge terrane including the Talladega belt is a Laurentian margin terrane of Neoproterozoic to Lower Carboniferous (Mississippian)
age which was deformed and accreted in the Devonian to Mississippian Neoacadian orogeny (Hatcher, 2010).
| | 6-2 | |
|
Westwater Resources, Inc. | Coosa Graphite Project
S-K 1300 Report |
December 11, 2023
SLR Project No.: 138.20527.00002 |
Figure
6-1: Regional Geology

| | 6-3 | |
|
Westwater Resources, Inc. | Coosa Graphite Project
S-K 1300 Report |
December 11, 2023
SLR Project No.: 138.20527.00002 |
Information on local geology is based
on an internal memorandum by David Greenan, Consulting Geologist, Westwater (Greenan, 2022) and other documentation provided to SLR by
Westwater.
The Coosa graphite deposit is hosted
in high grade metamorphic rocks. Graphitic carbon (Cg) material is present in two types of schist of an uncertain age ranging from Precambrian
to Paleozoic, a quartz-graphite schist, which generally has grades greater than 1% Cg, and a quartz-biotite-graphite schist, which has
grades generally less than 1% Cg.
The host schists exhibit both regional
and local folding as well as local-scale low and high angle faulting. Foliations within the mineralized intervals display a variety of
dips, ranging from low angle to steeply dipping features. A strong and well developed weathering profile is present in the mineralized
units throughout the Project area, with a strongly weathered zone (“saprolite”) exposed at the surface and locally extending
to a depth of up to 100 ft (31 m). The strongly weathered units overlie a “transition zone” of mixed oxidized and unoxidized
material, which in turn, overlies an unoxidized (unweathered or reduced) zone. While the strongly weathered graphitic schist is the primary
target of Westwater’s exploration and development evaluation, strong flake graphite mineralization is present in the transition
and unweathered zones as well. Graphite mineralization is widespread throughout Westwater’s surface and mineral property holdings,
however, the focus of previous exploration has been centered upon the so-called Main Grid area deposit, and its northeastern and southwestern
extensions and only portions of the HS-North, HS-South, and Fixico Mine target areas have been tested.
Information on property geology is based
on an internal memorandum by David Greenan, Consulting Geologist, Westwater (Greenan, 2022) and other documentation provided to SLR by
Westwater.
The host of the Project is the Higgins
Ferry Formation in the Wedowee Group of the Coosa Block (Figure 6-2). The Higgins Ferry Formation is defined as an interbedded sequence
of three major lithologic units, from top to bottom:
| 1 | Quartz-graphite
schist (QGS) |
| 2 | Mixed
QGS-quartz-muscovite-biotite-graphite schist (QMBGS) unit called INT or intermediate unit |
| 3 | Quart
muscovite biotite graphite schist (QMBGS) |
| 4 | Quartz-biotite-garnet
schist (QBGS) |
QGS grades downward into INT, then into
QMBGS, which in turn grades downward into QBGS. QMBGS is more highly metamorphosed than QGS and less metamorphosed than QBGS. In most
places, the mixed QGS-QMBGS unit (INT) consists of interlayers of finer grained QGS with QMBGS layers containing medium to large muscovites
and biotites, reflecting a gradual increase in metamorphic grade from the QGS to the QMBGS (Greenan, 2022).
| | 6-4 | |
|
Westwater Resources, Inc. | Coosa Graphite Project
S-K 1300 Report |
December 11, 2023
SLR Project No.: 138.20527.00002 |
Figure
6-2: Stratigraphic Column

| | 6-5 | |
|
Westwater Resources, Inc. | Coosa Graphite Project
S-K 1300 Report |
December 11, 2023
SLR Project No.: 138.20527.00002 |
In some places, QGS grades downward
into QMBGS without interlayering of the two units. The contact between these two units is somewhat arbitrary and is taken as where the
muscovites and biotites become much larger and more common than in the QGS and where the rock has larger, coarser foliations. This change
is reflected in the Cg assays, with the QMBGS generally having much lower Cg grades than the QGS.
In some of the drill core, the transformation
from QGS to QMBGS appears to have been caused by the introduction of a large number of pegmatites emplaced very close together. The heat
from this process caused recrystallization and regrowth of the muscovites and biotites. The heat also caused remobilization and growth
of the Cg flakes, giving rise to medium to very large Cg flakes in many of these zones. Cg grades are sometimes lower due to the pegmatites,
while the flake size is larger.
Overall, metamorphism increases with
depth. This may be caused by the depth of a lithological unit and/or regional metamorphism, or by a buried heat source below the QBGS
(contact metamorphism). Near the bottom of some of the holes, the QBGS has gneissic intervals. These are suggested to be fingers/sills
of a gneissic intrusive that may have caused the different metamorphic grades.
Metamorphic grade can also increase
laterally, with a transition from QGS to INT to QMBGS. Changes such as these appear to be evidence of a contact metamorphic aureole,
possibly from a buried amphibolite or other intrusive body. These types of changes, along with thrust faulting, help explain the apparent
lack of horizontal and/or vertical continuity of the various lithologies in the cross sections. Increasing metamorphic grade from QGS
to QMBGS also generally correlates with lower Cg values, indicating that the Cg was driven off by the metamorphism. In general, metamorphic
grades increase from east to west in the Main Grid area. Kyanite and sillimanite increase closer to the large amphibolite intrusive that
occurs to the east of the Main Grid area. These also increase closer to a postulated buried granitic intrusive that occurs on the southeast
end of Line 05 in the Main Grid area (Figure 6-3).
There is no definitive correlation between
the different iron oxides (jarosite, goethite, and hematite) and Cg mineralization. However, areas with more jarosite ± goethite
generally occur above more pyritic unoxidized QGS. Quartz veins/veinlets that cut the foliations usually have more hematite than jarosite
or goethite. Hematite is most common in and close to amphibolite sills and intrusives.
There appears to be at least two distinct
generations of quartz veins.
| 1 | White
to light gray quartz veins 2 in. to 12 in. thick emplaced mostly along and parallel to foliations
without causing contortion of the foliations. Since they mimic the foliations, in the Main
Grid area they usually occur at low angles. |
| 2 | White,
more massive quartz veins 2 in. to 24 in. thick cutting across the foliations at high angles,
often with hematite on the selvages. These often cause contortions of the foliations and
often appear to cause small-scale offsets in what appears to be a normal-fault sense of movement.
These types of veins appear to be more common in proximity to the various amphibolite intrusives
and cut both the amphibolites and the metasediments. |
In addition to
the quartz veins, there are two types of pegmatites found on the Project:
| 1 | Fine
to medium grained quartz-albite to albite-quartz pegmatites, sometimes with possible remobilized
vanadium giving them a greenish color. This type of pegmatite generally occurs along foliations. |
| | 6-6 | |
|
Westwater Resources, Inc. | Coosa Graphite Project
S-K 1300 Report |
December 11, 2023
SLR Project No.: 138.20527.00002 |
| 2 | Medium
to coarse grained albite-quartz pegmatites that are often argillically altered and occur
in the upper plate of a postulated thrust fault. These pegmatites often cut across the foliations
at a shallow to fairly steep angle. Thrusting is evidenced by slickensides along, or at a
low angle to, foliations. |
Larger Cg flakes
often appear to be from remobilized carbon/graphite and are generally associated with/found in:
| 1 | Fractures
in quartz veins and pegmatites. |
| 2 | The
margins of granitic sills, quartz veins, and pegmatites. |
| 3 | In
the QMBGS unit near the QGS contact in and along the margins of the large muscovites and
biotites, especially in areas with larger quantities of pegmatites. |
| 4 | In
microfractures in the QGS in the sulfide zone. |
In addition to
larger Cg flakes occurring in the QMBGS unit, larger, coarser grained Cg flakes appear to occur more often in areas that have been more
fractured, with the Cg occupying the fractures and microfractures, in particular in the QGS, INT, and QMBGS units. Quartz veins
and pegmatites that have been fractured also often have larger Cg flakes occupying the fractures, including what looks like veinlets
of graphite, some of which may be amorphous. Larger Cg flakes can also often occur on the edges of the pegmatites and quartz veins, providing
more evidence of remobilization of the Cg. Further evidence of remobilized graphite is observed in the sulfidic portions of some of the
core, where Cg flakes can be seen cutting across and/or causing embayments in pyrite. Good examples of this occur in drill hole AGC-F04
at 79.5 ft (24.2 m).
Granitic sills
appear to have been one of the earliest episodes of intrusives and are sometimes cut by later pegmatites. The granitic sills appear to
have been emplaced in thermal equilibrium with the metasediments as there are no visible alteration haloes on the selvages of the granitic
sills. Granitic sills can range from 0.5 in. up to 12 in. thick. Based on the relogging of the AGC holes, there appears to be a granitic
body beneath the drill holes in the Main Grid area in the vicinity of holes AGC-H05, I06, and J05, continuing southwest close to
drill hole AGC-I04 (Figure 6-3). In many cases, these are associated with increased Cg flake size and increased fracturing of the host
rock. However, the granitic sills themselves are rarely cut by Cg veinlets or have Cg flakes in fractures.
In
the Main Grid area, foliations generally strike 20˚ to
35˚ to the northeast, dipping at 10˚ to
45˚ to the southeast. The foliations generally flatten with depth.
Steeper foliations appear to be related to a northwest directed thrust fault or, more accurately, zone of thrusting. The presence of
steeper foliations on and near surface in the trenches and drill holes in the Main Grid, NX, SW Extension, Fixico Mine, HS-North, and
HS-South areas also points to a thrust fault. In general, foliations flatten with depth, especially in the finer grained QGS layers.
This
thrust fault extends from the SW Extension area through the Main Grid area and continues through the NX area, trends approximately 20˚
northeast from just west of hole AGC-15-L006 on its southwest end up to just
west of AGC-15-G20 on the northeast end. This thrust is evidenced by fault/fracture zones in the drill holes near this proposed fault,
along with highly contorted foliations and slickensides along the foliations. Much of the core exhibits slickensides along the foliations
(which in outcrop often have shallow dips to the southeast), indicating subhorizontal (probably thrust-fault related) movement. These
occur in the QGS in roscoelite-rich layers, and in Cg-rich and pyrite-rich layers. These often occur in multiple foliations close together,
which indicates that the units slid over each other like a deck of cards, with large quantities of small movement in many layers. In
spite of the large books of muscovite and biotite, slickensides in the QMBGS unit have not been observed.
| | 6-7 | |
|
Westwater Resources, Inc. | Coosa Graphite Project
S-K 1300 Report |
December 11, 2023
SLR Project No.: 138.20527.00002 |
Highly contorted
foliations furnish further evidence of thrusting. These occur more often in and near layers with slickensides, especially in areas with
granitic sills, pegmatites, and quartz veins. The contortion of the foliations would help to take up the strain of thrusting. The siliceous
nature of the various intrusives would prevent slipping, forcing them to contort in order to take up the strain of thrusting. Several
of the drill pad cuts have highly contorted foliations that appear to indicate west-northwest directed thrusting. This occurs in areas
where amounts of remobilized graphite along the contacts of the sills or veins with the country rock are not large.
The granitic sills,
pegmatites, and the early generation of quartz veins extend parallel with and along the foliations and generally do not cut the foliations,
except possibly at low angles. If the foliations are contorted, the quartz veins, pegmatites, and granitic sills are also contorted.
These indicate that the granitic sills, pegmatites, and early generation quartz veins were emplaced before the deformation and contortions
of the foliations occurred. If the contorted foliations are related to thrust faulting, that means that the early quartz veins, pegmatites,
and granitic sills were emplaced before thrust faulting occurred. Due to their brittle nature, only the quartz veins are shattered where
they are highly contorted.
Pegmatites in the
southeast part of the Main Grid area and in the Fixico Mine area are often of a different nature than those that occur to the north and
west. This may partly be due to these occurring in the upper plate of the thrust fault, which may have encountered a different intrusive
environment before thrusting occurred. These pegmatites are often larger/thicker, coarser grained, and often have clasts of the country
rock (usually QGS) within them. They are also generally argillically altered and cut across the foliations of the QGS at shallow to moderately
steep angles. These all indicate a more dynamic emplacement environment, possibly closer to an igneous source. Similar to the granitic
sills, there is no visible evidence of thermal alteration along the contacts of the pegmatites with the country rock, indicating that
they were in thermal equilibrium when the pegmatites were emplaced.
In the geologic
literature, the graphite in the lithologic units at Coosa is believed to be stratabound and stratiform (Greenan, 2022). Near and within
areas of thrust faulting at Coosa, the Cg appears to cut across the strata, but this may be due to the offsetting and stacking of the
layers by thrusting.
Cg grades in the
QGS are generally higher than in the INT, which usually has higher Cg grades than QMBGS, with almost no Cg in the QBGS, due to much higher
temperatures driving off the graphite. Cg grades also appear to be higher in the NX, SW Extension, Fixico Mine, and HS areas than in
the Main Grid area. These higher Cg grades correlate well with higher V-rich muscovite content but are not always related to each other.
Note that most of the Main Grid area appears to be in the lower plate, underneath the thrust fault.
Grain size/coarseness
of the QGS unit is usually larger in the upper plate of the thrust fault. V-rich mica grains/clots are also larger in the upper plate
of the thrust. This may be related to the original protolith being coarser grained, and/or related to the depositional environment, wherein
the upper plate portion of the QGS was deposited in an area with more vanadium in solution. Deformation within the QGS is also much more
pronounced in the upper plate of the thrust fault, indicating that above the main thrust plane there is a zone of thrusting, with multiple
layers stacked over each other. In the eastern portion of the Man Grid area and in the NX, SW Extension, Fixico, and HS areas, a generally
larger graphite flake size is coincident with the larger grain size.
In addition to
graphite, vanadium may be able to be recovered from the schists at the Project. Vanadium occurs in a V-rich mica called roscoelite. This
is somewhat of a “field term” at Coosa, where the “roscoelite” does not necessarily have a sufficiently high
concentration of vanadium to be “true” roscoelite. Roscoelite occurs in the QGS, INT, and QMBGS units, with lower to
much lower amounts in the QMBGS unit. There is an approximately 50% correlation between the V and Cg grades, but higher Cg does not necessarily
mean higher V, and vice versa. This may be due to vanadium being carried in solution under oxidizing conditions and deposited in anoxic
environments where the graphite and graphite precursors would occur. Breaking out the different lithologies and oxidized versus reduced
might show a higher V:Cg correlation in the reduced portions. The oxidized portions might be more problematic due to mobility of vanadium
in oxidized environments, with the amount of remobilization/leaching of vanadium possibly dependent on the amount/strength of oxidation,
the size of the V-rich muscovite flakes, and the type of (iron) oxides involved.
| | 6-8 | |
|
Westwater Resources, Inc. | Coosa Graphite Project
S-K 1300 Report |
December 11, 2023
SLR Project No.: 138.20527.00002 |
Although there
does not appear to be a correlation between iron oxides and graphite grades, there does appear to be an inverse relationship between
the amount of the various iron oxides and the amount of roscoelite. Areas with higher amounts of jarosite, goethite, and/or hematite
often have lower amounts of roscoelite and/or the roscoelite has leached edges. This could be due to vanadium being very mobile in an
oxidizing environment, with oxidation of pyrite ± pyrrhotite causing acidic groundwater that caused the vanadium to go into solution.
This leaching of vanadium from oxidized schists at Coosa may partly be responsible for the V: Cg correlation being not higher than approximately
50%.
In the QMBGS, the
roscoelite is often metamorphosed and remobilized into light to medium green glassy clots/layers (in the AGC logs, this was noted as
“possible nephrite”). Westwater indicates that Harold Stowell of the University of Alabama and his students are working on
thin sections that include this type of material to provide a definite identification of its mineralogy.
Some of the white
clays that occur in the upper portions of the drill holes in zones with high Cg may be weathered and/or altered roscoelite. These white
clays often have Cg in or on their margins. None of the other clays have this type of association. Harold Stowell and his students are
examining thin section samples of some of this material to provide a more definitive identification.
There is a large
amphibolite body in the northeast part of the NX area, near drill holes AGC-007, AGC-008, and AGC-009 and underlying proposed drill holes
CD-3, CD-4, and NX-17. In general, this amphibolite appears to mimic the resistivity high on the airborne geophysical map. It should
be noted that core recovery from some of these holes is not good and the few pieces of core in the boxes appear to be weathered, oxidized
amphibolite, and some pieces are weakly magnetic. Figure 6-4 and Figure 6-5, below, show the conductivity low associated with the amphibolite
and the outline of the amphibolite based on core photos, core, and reconnaissance surface mapping, respectively. Another amphibolite,
possibly part of the same one mentioned above, occurs to the east, on the north side of the HS area, and forms outcrops along the county
road.
The
upper portion of hole AGC-15-K20 appears to be weathered amphibolite, often intruding into the QBGS, grading downward into highly contorted
QBGS, often with gneissic textures. Hole AGC-009 begins in what appears to be weathered amphibolite, with an inverted stratigraphy below
it, going from QBGS downward into mixed QMBGS-QGS (INT) and then into QGS. This inverted stratigraphy, coupled with the approximately
45° dips
of the foliations on the surface caused by the thrust fault, may be the reasons that Alabama Graphite interpreted high angle tight isoclinal
folds with repetition of beds in the geology of this area. A more plausible explanation of the geology is that the amphibolite in the
area outlined on Figure 6-6 was originally much thicker and occurs as a sill or cap over the metamorphic package. This served as a heat
engine to metamorphose the sediments, causing higher metamorphic grades near the contact, including kyanite and sillimanite, with decreasing
in metamorphic grade away from the amphibolite. Note that this only applies to the metasediments underneath the amphibolite, as those
on and near the lateral margins do not show a high degree of metamorphism. This may be due to the near vertical contact, which would
have allowed heat to quickly escape and prevented higher grade metamorphism of the country rock.
| | 6-9 | |
|
Westwater Resources, Inc. | Coosa Graphite Project
S-K 1300 Report |
December 11, 2023
SLR Project No.: 138.20527.00002 |
The increasing
metamorphic grade with depth may be an indication of a larger amphibolite or other intrusive body (possibly gneissic) at depth. The amphibolite
exposed on the surface may be a plug or apophysis off of this intrusive. Mapping of the road cuts of the areas surrounding the amphibolite,
working outward from the margins, to see if the metamorphic grade of the metasediments decreases away from the amphibolite, may help
confirm this suggestion.
The intrusion of
the amphibolite appears to have occurred after thrusting, as the QGS on the surface has quartz veins at or near the contact and is often
clay altered on the margins of the amphibolite. Further away from the margins of the amphibolite, weak to strong acid leaching of the
QGS occurs, with sometimes mostly silica and Cg remaining in the QGS (as seen in hole AGC-15-J11). This may have been caused by the oxidation
of pyrite in reduced QGS, coupled with the high iron content of the amphibolite, forming sulfuric acid and leaching the QGS. This acid
leaching is very subtle in outcrop and float and would require detailed surface mapping to try to define it on the surface.
In general, the
amphibolite appears to have intruded into the QGS unit parallel with the foliations, following zones of weakness, and very rarely appearing
to cut the foliations. In many cases, the amphibolite sills occur adjacent to/in contact with granitic sills and/or pegmatites. Larger
bodies of amphibolite often have quartz veins within them and/or on their edges. Sills of the amphibolite within the QGS, as exposed
in the cut for the pad for hole NX-17, do not appear to have been offset or deformed by thrusting, also indicating that the amphibolite
was intruded after thrusting occurred.
There is very little
to no thermal metamorphism in the QGS along the contacts with the amphibolite sills, granitic sills, or pegmatite sills. This indicates
that these were all in thermal equilibrium when they intruded the metasediments. While this may sound contradictory compared to the proposed
contact metamorphism related to the amphibolite mentioned above, the lack of alteration may be due to the relatively quick emplacement
of the sills.
Besides the change in metamorphic grade
from the QGS to QMBGS to QBGS, the most common evidence of metamorphism is conversion of roscoelite to kyanite or sillimanite. This can
occur in the QGS, INT, and QMBGS units. In some places, the roscoelite appears to have been remobilized into thicker layers up to
one to three inches thick with a somewhat porcelaneous to glassy texture. In some places, the change from mica to kyanite or sillimanite
occurs in highly contorted foliations in or near proposed thrust planes, indicating that this change may be more related to local pressure
and temperature changes than regional metamorphism. Increased sillimanite and/or kyanite are also associated with lower Cg grades.
| | 6-10 | |
|
Westwater Resources, Inc. | Coosa Graphite Project
S-K 1300 Report |
December 11, 2023
SLR Project No.: 138.20527.00002 |
Figure
6-3: Main Grid Area Showing Postulated Granitic Body

| | 6-11 | |
|
Westwater Resources, Inc. | Coosa Graphite Project
S-K 1300 Report |
December 11, 2023
SLR Project No.: 138.20527.00002 |
Figure
6-4: Main Grid Area with Conductivity Overlay

| | 6-12 | |
|
Westwater Resources, Inc. | Coosa Graphite Project
S-K 1300 Report |
December 11, 2023
SLR Project No.: 138.20527.00002 |
Figure
6-5: Main Grid Area with Conductivity Overlay and Amphibolite Outline

| | 6-13 | |
|
Westwater Resources, Inc. | Coosa Graphite Project
S-K 1300 Report |
December 11, 2023
SLR Project No.: 138.20527.00002 |
Figure
6-6: Conceptual Amphibolite Cross Section

| | 6-14 | |
|
Westwater Resources, Inc. | Coosa Graphite Project
S-K 1300 Report |
December 11, 2023
SLR Project No.: 138.20527.00002 |
Graphite flakes occur as part of the
rock forming minerals in the schists. They are often associated with disseminated pyrrhotite and minor pyrite. In places, the green vanadium
bearing muscovite, roscoelite, also occurs. Minor late stage, straight-sided veinlets of cubic pyrite up to 10 mm wide with smectite
clay cross cut the schistosity and pegmatites.
Graphite ores mined historically were
almost entirely from the weathered zone (60 ft to 100 ft), partly because weathering is deep in this area and partly because the weathered
rock could be gently crushed without blasting, liberating the graphite without significantly reducing the size of the larger flakes.
The oxide and transition zones were
logged in core and modelled for resource estimation. The oxide zone is defined as the zone of total oxidation of sulfides to give an
orange-red-brown color to core, and a much softer rock. The base of the oxide zone is often sharp and occurs over an interval of less
than one foot. The transition zone is defined as the zone of partial oxidation of sulfides and the rock is significantly crumblier than
the underlying reduced or sulfide zone. The top of the transition zone is marked by the first appearance of sulfides downhole, and the
base is marked by the disappearance of iron oxides, and a marked increase in hardness. Generally, there is more oxidation on fractures
and veins in this zone.
The main schist compositions and logging
units defined by Westwater geologists (Figure 6-2) in drill core are as follows:
Quartz-graphite schist (QGS): This
schist is both finer grained and better laminated than the QMBGS unit. The color varies from dark gray to black. Contorted foliation
and pegmatites are less common. Pyrite and pyrrhotite are both finer grained and more abundant than in the QMBGS unit and form laminae
parallel to foliation. Graphite is more abundant in this unit, with grades higher than 1% Cg.
Mixed QMBGS/QGS (INT): The QMBGS
and QGS are commonly interbedded at a centimeter scale forming a mixed unit with graphite grades higher than 1% Cg.
Quartz-muscovite-biotite-graphite
schist (QMBGS): This schist is medium to coarse grained in texture and is characterized by large porphyroblasts of muscovite. The
color varies from medium gray to dark gray-green. It is moderately foliated and commonly contorted, with lenticular pegmatites parallel
to foliation. Pyrite and pyrrhotite are common accessory minerals and occur as large, disseminated grains. Sillimanite fibers have been
observed. Graphite flakes are generally coarse in this unit, although the average carbon content is generally less than 1% Cg.
Quartz-biotite-garnet schist (QBGS):
This unit is subordinate to both the QMBGS and QGS units. It is medium grained and medium to dark gray-green in color. The garnets
are usually fine grained with a diameter of about one millimeter, but in places are up to 5 mm to 10 mm. The garnets are light pink in
color, suggesting a high manganese (spessartine) content. Foliation is irregular with abundant pegmatites. Pyrite is sparse. Graphite
is sparse and grades are less than 1% Cg.
Graphite deposits occur in three forms:
flake graphite, vein graphite, and amorphous graphite. These are described by Mitchell (1993):
| · | Graphite
generally occurs as a result of metamorphism (regional or contact) of organic matter in sediments.
Flake graphite is assumed to be derived from fine grained sediments rich in organic matter.
As metamorphic grade increases, carbonaceous material converts to “amorphous”
graphite. Flake graphite forms from its amorphous precursor at or beyond amphibolite grade
metamorphism (Landis, 1971). Vein graphite is assumed to form by partial volatilization of
graphite and subsequent recrystallization during regional granulite and/or charnockite facies
metamorphism. Amorphous graphite is generally considered to have originated by thermal or
regional metamorphism of coal or carbonaceous sediments. |
| | 6-15 | |
|
Westwater Resources, Inc. | Coosa Graphite Project
S-K 1300 Report |
December 11, 2023
SLR Project No.: 138.20527.00002 |
| · | Positive
vanadium and nickel anomalies and negative boron anomalies are possible signatures for graphite
if geochemical survey data are available. The presence of sulphides and trace amounts of
uranium may be an indicator. |
Landis (1971) tentatively concluded
that graphite formation is primarily dependent on metamorphic temperature and forms above 750°F (400°C), with pressure and variation
in starting material constituting secondary controls.
The Coosa graphite deposits are flake
graphite deposits in high grade metamorphic rocks. They are associated with anomalous vanadium, including the vanadium-mica roscoellite,
and nickel, as well as other elements.
| | 6-16 | |
|
Westwater Resources, Inc. | Coosa Graphite Project
S-K 1300 Report |
December 11, 2023
SLR Project No.: 138.20527.00002 |
Prior to Westwater acquiring the property
in 2018, Alabama Graphite conducted several surface exploration campaigns between 2012 to 2015. Due to the lack of outcrop and dense
vegetation, the exploration techniques used were rock sampling in channels mainly along road cuttings, trenching, geophysics, and drilling.
Westwater has conducted additional in-fill/delineation diamond drilling (DD) in the Project area during 2021 and 2022. The Company has
also conducted a geochemical sampling program using available core and trench material to determine the presence and intensity of vanadium
mineralization at the Project.
Channel sampling was carried out initially
by Alabama Graphite close to the Coosa target and later over a large area around it. A total of 1,025 channel samples were reported taken
at 328 locations in 2012 to 2014, as shown in Figure 7-1. This comprised 115 samples in 2012 (a further 113 samples had unreliable analyses
and the results were discarded), 268 samples in 2013, and 642 samples in 2014. One to sixteen samples would be taken at each sample locality,
with an average of 3.125 samples per locality. The distribution of sample locations was not systematic due to the lack of rock outcrop
and dense vegetation. Samples were typically collected along road cuts where bedrock was exposed. Small trenches were excavated by hand
with a pickaxe and shovel, and ranged from two to three inches in depth and 5 ft to 35 ft in length. The trenches were typically cut
perpendicular to the bedrock foliation to provide a representative sample of the outcrop and expose structural features such as foliation.
Before the sample was collected, a global
positioning system (GPS) was used to record the location of the start of the trench and all measurements were recorded in a field notebook
and later tabulated into a Microsoft (MS) Excel database. Material collected from the trench was placed in a sample bag and labeled.
| | 7-1 | |
|
Westwater Resources, Inc. | Coosa Graphite Project
S-K 1300 Report |
December 11, 2023
SLR Project No.: 138.20527.00002 |
Figure
7-1: Alabama Graphite 2012-2013 Channel Sample Location

| | 7-2 | |
|
Westwater Resources, Inc. | Coosa Graphite Project
S-K 1300 Report |
December 11, 2023
SLR Project No.: 138.20527.00002 |
A program of mechanical trenching was
carried by Alabama Graphite in the winter of 2014 using an excavator. A total of 30 trenches were dug with a total length of 10,790 ft
(3,289 m). Of these, nine trenches with a total length of 3,600 ft were dug in the Coosa resource estimate area and used in the database
for the resource estimate, and another 21 trenches with a total length of 7,190 ft were dug on exploration targets.
The objective was to cut long trenches
across the strike of the graphite mineralization in the grid area to infill between DD holes and demonstrate continuity of near surface
mineralization. Trenches were also dug on geophysical exploration targets away from the drill grid. The average depth of the trenches
was 4 ft to 5 ft with a maximum depth of 8 ft (2.4 m). The trenches were backfilled and revegetated as soon as they had been sampled.
The trenches were treated as low angle
drill holes for surveying, sampling, logging, and the database. The starting point (collar) of the trench was surveyed by GPS, and measurements
of azimuth and inclination were taken by compass and tape at 25 ft (7.6 m). These were treated as downhole directional surveys to plot
the trench. Samples were surveyed by compass and tape to give length, azimuth, and inclination. Samples were taken continuously in 5
ft lengths from the base of the wall of the trench using a geological hammer and a plastic core box as a receptacle. A 20 lb to 25 lb
bulk composite sample was also collected on 25 ft (7.6 m) lengths for metallurgical test work.
Alabama Graphite carried out two trial
ground geophysical surveys in 2014. A GEM2 ground frequency domain EM survey was carried out using a GEM2 instrument along roads and
had a depth of penetration of 50 ft (15.2 m). In addition, a ground time-domain electromagnetic (TDEM) survey was tested but not found
to be useful due to the high contrast in the EM response between the oxide and reduced (unweathered) zones.
A helicopter borne magnetic, radiometric,
and TDEM survey was carried out by the contractor Prospectair (Québec) in March 2014 over exploration areas surrounding the
Coosa resource estimate area (Figure 7-2). Data processing and interpretation were completed by Dubé & Desaulniers Geoscience
(Québec) and are described in a report by Dubé (2014).
The survey covered two areas named Coosa
North, centered on the Coosa Main Grid area, and Coosa South, over the Bama project in Chilton County, which is not described further
in this TRS. A total of 554 line miles were flown on Coosa North on lines oriented 126° with a 328 ft line spacing, and perpendicular
control lines spaced at 3,280 ft (999 m). The average height above the ground of the helicopter was 291 ft (88.7 m). Graphite targets
were defined based on high conductivity from the TDEM survey (graphite and/or sulfides) combined with magnetic lows (no pyrrhotite),
as shown in Figure 7-2. A number of these targets were followed up by channel sampling, trenching and, in some cases, drilling.
| | 7-3 | |
|
Westwater Resources, Inc. | Coosa Graphite Project
S-K 1300 Report |
December 11, 2023
SLR Project No.: 138.20527.00002 |
Figure
7-2: TDEM Contour Map Showing Conductive Highs

Note: High = Pink and Orange, Low=Blue
and White
| | 7-4 | |
|
Westwater Resources, Inc. | Coosa Graphite Project
S-K 1300 Report |
December 11, 2023
SLR Project No.: 138.20527.00002 |
In early 2018, Westwater’s technical
staff carried out a review of historical data and geologic information derived from previous graphite exploration drilling and surface
trenching programs at the Project to determine the potential for the presence of substantial vanadium mineralization. This work identified
significant potential for the discovery of vanadium mineralization in the Project area.
In late 2018, Company personnel carried
out an extensive geochemical sampling program, collecting nearly 2,000 samples from many previously completed drill holes and trenches,
to determine the presence and intensity of vanadium mineralization at the Project. The laboratory analytical results of this sampling
program outlined widespread and strong vanadium mineralization in very close association with flake graphite mineralization at numerous
localities within the Project area.
The vanadium mineralization at the Project
occurs principally as the mineral roscoelite, a medium to dark green mica mineral that has been a global source for vanadium for more
than one hundred years. In addition to the presence of widespread vanadium mineralization in drill hole and trench samples, impressive
zones of vanadium mineralization have been outlined in surface exposures at several locations within the Project area.
In late 2018, Westwater personnel carried
out an extensive geochemical sampling program, collecting nearly 2,000 samples from many previously completed drill holes and trenches,
to determine the presence and intensity of vanadium mineralization at the Project. The laboratory analytical results of this sampling
program outlined widespread and strong vanadium mineralization in very close association with flake graphite mineralization at numerous
localities within the Project area.
Due to the limited number of assays
collected and wide-spaced drilling between holes sampled for vanadium, all the vanadium pentoxide (V2O5) is considered
to be exploration potential. Vanadium potential tonnage and grade are currently estimated to range from 21.0 Mst to 67.0 Mst and 0.19%
V2O5 to 0.13% V2O5, respectively. SLR notes that the potential quantity and grade are conceptual
in nature, there has been insufficient exploration to define a Mineral Resource, and it is uncertain if further exploration will result
in the exploration target being delineated as a Mineral Resource. Westwater currently has no exploration plans or programs as of this
TRS to further evaluate the exploration potential of vanadium mineralization.
Core DD on the property is the principal
method of exploration and delineation of graphite mineralization after initial targeting using rock sampling and geophysical surveys.
Drilling can generally be conducted year-round on the Project.
As of the effective date of this TRS,
Westwater and its predecessor companies have completed 45,715 ft of drilling in 236 holes (181 DD = 33,117 ft, 24 Sonic = 1,303 ft, 31
Trenches = 11,295 ft) over the Project, as summarized in Table 7-1 and illustrated in Figure 7-3.
| | 7-5 | |
|
Westwater Resources, Inc. | Coosa Graphite Project
S-K 1300 Report |
December 11, 2023
SLR Project No.: 138.20527.00002 |
| Table 7-1: |
Summary of Drilling Parameters 2012-2022 |
| Owner |
Year |
Drill
Hole
Type |
Target
Area |
Number
of
Drill Holes |
Total
Depth
Drilled (ft) |
| Alabama Graphite |
2012 |
DD |
NX |
6 |
3,002 |
| |
|
|
Main |
5 |
2,513 |
| |
|
|
SW |
1 |
500 |
| |
2012 Total |
|
|
12 |
6,015 |
| |
|
|
|
|
|
| |
2013 |
DD |
Main |
57 |
14,415 |
| |
2013 Total |
|
|
57 |
14,415 |
| |
|
|
|
|
|
| |
2014 |
DD |
Main |
1 |
47 |
| |
|
SONIC |
NX |
5 |
253 |
| |
|
|
Main |
1 |
47 |
| |
|
|
SW |
2 |
120 |
| |
|
|
HS-South |
3 |
168 |
| |
|
|
HS-North |
5 |
257 |
| |
|
|
(blank) |
8 |
458 |
| |
|
TRENCH |
NX |
4 |
2,475 |
| |
|
|
Main |
4 |
1,025 |
| |
|
|
SW |
2 |
400 |
| |
|
|
HS-South |
3 |
800 |
| |
|
|
HS-North |
5 |
1,645 |
| |
|
|
(blank) |
10 |
3,600 |
| |
|
|
FIXICO |
3 |
1,350 |
| |
2014 Total |
|
|
56 |
12,645 |
| |
|
|
|
|
|
| |
2015 |
DD |
NX |
19 |
2,839 |
| |
|
|
Main |
6 |
895 |
| |
|
|
SW |
12 |
1,600 |
| |
|
|
HS-South |
6 |
855 |
| |
|
|
FIXICO |
3 |
900 |
| |
2015 Total |
|
|
46 |
7,089 |
| Alabama Graphite Total |
|
|
|
171 |
40,164 |
| |
|
|
|
|
|
| | 7-6 | |
|
Westwater Resources, Inc. | Coosa Graphite Project
S-K 1300 Report |
December 11, 2023
SLR Project No.: 138.20527.00002 |
| Owner |
Year |
Drill
Hole
Type |
Target
Area |
Number
of
Drill Holes |
Total
Depth
Drilled (ft) |
| Westwater Resources |
2021 |
DD |
NX |
16 |
1,305 |
| |
|
|
Main |
20 |
1,562 |
| |
|
|
SW |
7 |
639 |
| |
|
|
HS-South |
1 |
102 |
| |
|
|
HS-North |
2 |
219 |
| |
|
|
FIXICO |
8 |
736 |
| |
2021 Total |
|
|
54 |
4,563 |
| |
|
|
|
|
|
| |
2022 |
DD |
Main |
1 |
87 |
| |
|
|
HS-South |
7 |
629 |
| |
|
|
HS-North |
1 |
102 |
| |
|
|
FIXICO |
2 |
170 |
| |
2022 Total |
|
|
11 |
988 |
| Westwater Resources Total |
|
|
|
65 |
5,551 |
| |
|
|
|
|
|
| Grand Total |
|
|
|
236 |
45,715 |
| | 7-7 | |
|
Westwater Resources, Inc. | Coosa Graphite Project
S-K 1300 Report |
December 11, 2023
SLR Project No.: 138.20527.00002 |
| Figure 7-3: | Drilling
Location Map |

| | 7-8 | |
|
Westwater Resources, Inc. | Coosa Graphite Project
S-K 1300 Report |
December 11, 2023
SLR Project No.: 138.20527.00002 |
Six drilling campaigns have been carried
out by Westwater and its predecessor AGC at the Project from 2012 to 2022. Drilling focused in the NX and Main Grid areas, however, exploration
drilling has also been completed on the remaining three areas. Between 2012 and 2015, 171 drill holes totaling 40,164 ft were completed
by Alabama Graphite. From 2021 to March 15, 2022, Westwater completed 65 DD holes totalling 5,551 ft (1,692 m).
In 2021, all drill core, including core
previously collected by Alabama Graphite, was transported from drill sites and from Alabama Graphite’s prior office in Sylacauga
to the Westwater core facility located in Kellyton, Alabama, via pick-up. Core was logged, photographed, sampled, and stored in core
racks at the core logging facility.
Of the 236, 205 holes totaling 39,434
ft were drilled in the Coosa target area and are used in the database for the Mineral Resource estimate. The remaining 31 holes totaling
6,281 ft, exploration holes drilled in the HS-North area (13) or isolated single holes (18) outside the Coosa block model boundaries,
were excluded from the resource estimation.
Alabama Graphite conducted four drilling
programs at the Project between 2012 and 2015 comprising 171 drill holes totaling 40,164 ft (12,242 m).
| 7.3.1.1 | 2012
Diamond Drilling (Stratigraphic Lines) |
The first program of diamond drilling
was carried out between September 27, 2012, and October 23, 2012, and consisted of two northwesterly trending fences of six
holes each for a total of 6,003 ft (holes AGC-001 through AGC-012). All fence holes were drilled at an inclination of -50° perpendicular
to the stratified graphite horizons to gain information regarding the stratigraphy and graphite distribution. The two fences were approximately
3,000 ft to 3,800 ft apart, with hole spacing averaging 500 ft (152.4 m). The fence holes were core holes of HQ (2.5 in.) diameter and
were drilled to a nominal depth of 500 ft (152.4 m).
| 7.3.1.2 | 2012
Diamond and Sonic Drilling (Resource Grid) |
The second drilling program was carried
out between October 23, 2012, and December 21, 2012, and consisted of 57 vertical holes drilled on a 200 ft x 200 ft grid in
the Main Grid area for a total of 14,415 ft (4,394 m). The holes were numbered by the grid location and included holes AGC-A04 to AGC-J09.
The grid drilling was a combination of sonic core and HQ core. Diamond drilling gave low core recovery (<50%) in the upper weathered
zone so a sonic drill was used to drill core through the weathered zone and set casing for the HQ diamond core drill. This method proved
to be very effective due to the approximately 100% core recovery from the sonic drill, however, in some holes there is a gap of up to
10 ft in sampling between the end of the sonic core and the start of the diamond core.
| 7.3.1.3 | 2014
Sonic Drilling for Exploration |
Twenty-four sonic holes were drilled
in summer 2014 for a total of 1,303 ft numbered AGC-10S, AGC-12S, AGC-14-K03S, and AGC-14-01S to AGC-14-21S. The core diameter was HQ.
Eleven of these holes were located in
the Coosa resource area and are included in the database for the Mineral Resource estimate. Of these eleven, holes AGC-14-010S and AGC-14-012S
were re-drilled in the upper parts of diamond drill holes AGC-010 and AGC-012, but are treated as separate drill holes as they were not
pre-collars; three holes (AGC-14-13S, AGC-14-18S, and AGC-14-20S) were deepened by diamond drilling in 2015 (respectively holes AGC-15-H14,
AGC-15-I19, and ACG-15-I21); and one hole was not deepened and is only a sonic hole (AGC-14-K03S).
| | 7-9 | |
|
Westwater Resources, Inc. | Coosa Graphite Project
S-K 1300 Report |
December 11, 2023
SLR Project No.: 138.20527.00002 |
The other 13 sonic holes drilled in
2014 were exploration holes to test geophysical anomalies away from the Coosa resource area and were not used in the database for the
Mineral Resource estimate.
| 7.3.1.4 | 2015
Diamond Drilling Program |
The 2015 drilling program was designed
to extend the Main Grid and resource to the north and south, with the emphasis on the oxide and transition zones. A different drill contractor
was used, Dycus Diamond Drilling LLC (3D Drilling) of Wytheville, Virginia, with two truck mounted Longyear 38 drill rigs. The contractor
was chosen for their ability to achieve high core recoveries of almost 100% in the oxide and transition zones by drilling at a slower
rate with less weight on the bit. The core diameter was HQ. The three deeper exploration holes were reduced to NQ (1.9 in.) diameter
at 150 ft depth.
A total of 37 diamond drill holes for
5,333.5 ft were drilled on the Coosa resource grid in 2015, of which three holes totaling 142.0 ft were pre-collared by sonic drilling
in 2014. The holes were numbered by the year and grid location and are AGC-15-E003 to AGC-15-O006.
In addition, nine holes for 1,755 ft
were drilled on two exploration targets in 2015, Fixico Mine (holes AGC-15-FIX01 to AGC-15-FIX03) and Holy Schist (holes AGC-15-HS01
to AGC-15-HS06). One of these was pre-collared by sonic drilling in 2014. These holes were not used in the database for the Coosa Mineral
Resource estimate.
Downhole surveys of the diamond drill
holes were taken by the drilling company with a Reflex Instruments EZ Shot Survey tool (all 2012 holes, 22 of the 2015 holes) or a Multishot
tool (24 of the 2015 holes). The instruments were adjusted for the local magnetic declination of 3.5° west and recorded the azimuths
relative to grid north. Measurements were made at the end of the hole and, in the deeper holes, at a midway depth. Downhole surveys were
not carried out on the sonic drill holes as they were short and vertical, and most were pre-collars for diamond drill holes.
Drill collars are capped by plastic
pipe with a cap and cemented in place. Collar locations were surveyed with a high precision 2005 Trimble GeoXM GPS unit with submeter
accuracy. The collars of the 2014 sonic holes were surveyed with a handheld Garmin GPS unit with lower accuracy 3 m to 5 m (10 ft to
16 ft). The datum used was NAD83 UTM Zone 16N in meters.
| 7.3.2 | Westwater
Resources Inc. |
| 7.3.2.1 | 2021-2022
Diamond Drilling Program |
From late May 2021 to mid-March 2022,
Westwater completed 5,551 ft of drilling in 65 drill holes. More than 95% of the footage drilled was NQ. The drilling campaign had three
main objectives: confirmation of historic drilling results, infill drilling to test the continuity of the Cg mineralization, and collection
of drill core for vanadium geochemical assessment.
No downhole surveys were completed due
to the shallow depth of drilling, with an average depth of 85 ft (25.9 m).
| | 7-10 | |
|
Westwater Resources, Inc. | Coosa Graphite Project
S-K 1300 Report |
December 11, 2023
SLR Project No.: 138.20527.00002 |
The SLR QP is of the opinion that the
drilling and sampling procedures at Coosa are consistent with generally recognized industry best practices. The resultant drilling pattern
is sufficiently dense to interpret the geometry and the boundaries of graphite mineralization with confidence. The core samples were
collected by trained personnel using procedures meeting generally accepted industry best practices. The process was conducted or supervised
by suitably qualified geologists.
No detailed hydrogeological or geotechnical
studies have been conducted to date.
The SLR QP is of the opinion that the
samples are representative of the source materials, and there is no evidence that the sampling process introduced a bias. Accordingly,
there are no known sampling or recovery factors that could materially impact the accuracy and reliability of drilling results.
| | 7-11 | |
|
Westwater Resources, Inc. | Coosa Graphite Project
S-K 1300 Report |
December 11, 2023
SLR Project No.: 138.20527.00002 |
| 8.0 | Sample
Preparation, Analyses, and Security |
| 8.1 | Sample
Preparation and Analysis |
Information in the following sections
contained in this TRS have been derived, and in some instances extracted, from the subsequent drilling programs discussed above and documentation
and standard operating procedures (SOP) supplied to SLR by Westwater for review.
| 8.1.1 | AGC
Channel Samples 2012 Preparation and Analysis |
AGC initially used Mineral Labs, Inc.
(Mineral Labs) of Salyersville, Kentucky (not accredited) and Société Générale de Surveillance (SGS) at Lakefield,
Ontario (ISO/IEC 17025:2005 certified) for sample preparation and carbon analyses of channel samples taken in 2012 and for the first
drill hole, AGC-001C. Both laboratories are independent of AGC.
The first batch of 113 channel samples
was prepared by Mineral Labs at their laboratory in Birmingham, Alabama, and analyzed for carbon by the loss on ignition (LOI) method
at their laboratory in Salyersville. These results were subsequently found to be erroneous and too high and were discarded.
The second batch of 115 channel samples
was prepared and analyzed for carbon by the LECO method by SGS Lakefield and were shown to be reliable by secondary check analyses at
ALS Minerals in Elko, Nevada (ISO/IEC 17025:2005 certified/accredited). The sample pulps were also analyzed at Mineral Labs, and comparison
with the other laboratories showed that the Mineral Labs assays were unreliable.
Core from the first drill hole, AGC-001C,
was submitted to SGS at their laboratory in Birmingham, Alabama for preparation. The pulps were sent to SGS Lakefield for carbon analysis.
The marble blank samples were reported to contain greater than 11% Cg because of inadequate acid removal of carbonate carbon prior to
the LECO analysis. In addition, it was found that the sample preparation laboratory in Birmingham had only prepared a few pieces of core
from each bag instead of the entire sample. The SGS analyses of hole AGC-001C were not used. After these failed results, the unprepared
samples, rejects, and pulps were retrieved from the two SGS laboratories, recombined by AGC, and submitted to ALS Minerals for preparation
and analysis.
| 8.1.2 | AGC
2012–2015 Preparation |
All further sampling from 2012 through
2015 samples was prepared and analyzed either by ALS Minerals in Elko, Nevada and Vancouver, British Columbia (ISO 9000:2008 registered
and ISO 17025 accredited in North America) or by Activation Laboratories Ltd. (Actlabs) in Ancaster, Ontario (ISO 9000:2008 registered
and ISO 17025 accredited, as well as accredited to CAN-P-1579, which is specific to mineral analysis laboratories). All three laboratories
are independent of AGC and Westwater. ALS Minerals was used as the primary laboratory for the 2012 and 2013 drill programs and Actlabs
as the secondary laboratory; this was reversed for the 2014 and 2015 drilling, trenching, and sampling programs.
Samples were prepared by ALS Minerals
at their laboratory in Elko, Nevada. The sample preparation procedure was to log the samples into the tracking system and add a bar code
label (procedure code LOG-22), weight the samples (code WEI-21), dry them at high temperature of up to 120°C (code DRY-21), fine
crush by jaw crusher to greater than 70% passing -2 mm (code CRU-31), split off 1,000 g using a riffle splitter (code SPL-21), and pulverize
the 1,000 g split to greater than 85% passing 75 microns (200 mesh) in a ring and puck style grinding mill (code PUL-32). The entire
sample preparation method is referred to by ALS Minerals as code PREP-31B.
| | 8-1 | |
|
Westwater Resources, Inc. | Coosa Graphite Project
S-K 1300 Report |
December 11, 2023
SLR Project No.: 138.20527.00002 |
Samples were prepared by Actlabs at
their laboratory in Ancaster, Ontario. The sample preparation procedure was to log the samples into the tracking system and add a bar
code label, weight the samples, dry them at 60°C, crush the entire sample by jaw crusher to greater than 90% passing 10 mesh (1.7
mm), split off 250 g using a riffle splitter, and pulverize the split to greater than 95% passing 150 mesh (105 microns) in a mild steel
ring and puck style grinding mill. The sample preparation method is referred to by Actlabs as code RX1.
| 8.1.3 | AGC
2012–2015 Analysis |
ALS Minerals shipped the sample pulps
from Elko, Nevada, to their laboratory in Vancouver, British Columbia for analysis. A 1 g subsample of the sample pulp was analyzed for
total carbon by sample combustion in a LECO induction furnace at high temperature which generates carbon dioxide. This is quantitatively
detected by infrared spectroscopy and reported as percent carbon, with a range of detection of 0.01% to 50% C (code C-IR07). Inorganic
carbon (carbonate) was analyzed by carbon dioxide (CO2) coulometry, with a range of detection of 0.2% to 15% CO2
(code C-GAS05). The procedure is to acidify the sample with perchloric acid (HClO4) in a heated reaction vessel to evolve
free carbon dioxide. This is subsequently transferred to a CO2 coulometer using a carbon-free gas, where the CO2
is quantitatively absorbed and reacts with monoethanolamine in the presence of an indicator that fades in color with increasing CO2
concentration. The color change is detected by a photo-cell and is used to determine the amount of CO2 in the sample.
Carbon is calculated from carbon dioxide and the results are rounded to two decimal points and one decimal point respectively. Check
calculations often show variation of ±0.01% carbon due to rounding.
The sample weight and results for C
(C-IR07), C (C-GAS05) and CO2 (C-GAS05) were reported to AGC on MS Excel spreadsheets and in Certificates of Analysis in secure
Adobe Acrobat file format, transmitted by email and available on a secure internet sample tracking site called Webtrieve™.
Graphite carbon was calculated by AGC
by subtracting inorganic carbon from total carbon. This assumes that the only other form of carbon present in the samples, other than
graphite carbon, is contained within carbonates.
Multi-element analysis was carried out
for one entire drill hole (AGC-010) by ALS Minerals at their Reno, Nevada laboratory. The samples were analyzed for 53 elements by aqua
regia digestion and inductively coupled plasma mass spectrometry (ICP-MS) analysis (method code ME-MS41L).
| | 8-2 | |
|
Westwater Resources, Inc. | Coosa Graphite Project
S-K 1300 Report |
December 11, 2023
SLR Project No.: 138.20527.00002 |
Actlabs analyzed graphitic carbon on
0.5 g samples in an Eltra resistance or induction furnace with measurement by infrared spectrometer (method code 5D-C Graphitic Infrared).
The samples were subjected to a multistage furnace treatment to remove all forms of carbon with the exception of graphitic carbon, with
no acid digestion required. The samples were heated to 1,000°C in nitrogen in a resistance or induction furnace to burn off CO2
in carbonate and any organic carbon, leaving graphite carbon behind. The residue was then combusted in an oxygen environment to
oxidize the graphite to determine the graphite content. The laboratory report graphite carbon (C-Graph) with a lower limit of detection
of 0.05%. The sample weight and results for Cg were reported to AGC on MS Excel spreadsheets and in Certificates of Analysis in Adobe
Acrobat file format.
| 8.1.4 | Westwater
2021-2022 Analysis |
During 2021 and 2022 drilling programs,
Westwater continued to use Actlabs as its primary laboratory with secondary checks being completed by SGS.
Samples were prepared by Actlabs at
their laboratory in Ancaster, Ontario. The sample preparation procedure was to log the samples into the tracking system and add a bar
code label, weigh the samples, dry them at 60°C, crush the entire sample by jaw crusher to greater than 90% passing 10 mesh (1.7
mm), split off 250 g using a riffle splitter, and pulverize the split to greater than 95% passing 150 mesh (105 microns) in a mild steel
ring and puck style grinding mill. The sample preparation method is referred to by Actlabs as code RX1.
Analysis for graphitic carbon was carried
out by SGS in accordance with its procedure for graphitic carbon determination in ores, concentrates, and metallurgical test products
by hydrochloric acid leach and combustion infrared (IR) detection.
A weighed sample is roasted in oven
at 500 C for one hour to remove all organic carbon. Carbonate carbon is then leached/evolved using HCl. The sample is then dried to remove
the chlorides. The residue is mixed with metal accelerators and placed in the LECO IR combustion system. The residual carbon is taken
as graphitic carbon. With high grade carbon, samples are wetted with methanol prior to acid addition.
Samples higher than 30% graphitic carbon
are analyzed on the SC632 instrument. The SC632 uses high temperature combustion followed by IR detection to determine concentrated carbon
content in a wide variety of organic materials as well as some inorganic materials such as soil, cement, and limestone.
A total of 263 specific gravity measurements
were carried out by ALS Minerals at their laboratory in Elko, Nevada, in 2013 on three-inch to five-inch (7.6 cm to 12.7 cm) samples
of split core provided by AGC from several holes from the 2012 program. The holes were selected to ensure representability of different
rock types. A further 12 determinations were made by ALS Minerals in 2015 on samples from the oxide and transition zones in the 2015
drill program. Seven check specific gravity determinations were made by Actlabs in September 2015.
During the 2021-2022 Westwater drilling
campaign an additional 121 bulk density measurements were sent to Actlabs with 89 of the measurements taken within the oxide horizon
(Table 8-1).
| | 8-3 | |
|
Westwater Resources, Inc. | Coosa Graphite Project
S-K 1300 Report |
December 11, 2023
SLR Project No.: 138.20527.00002 |
At ALS Minerals, bulk density was determined
after wax coating the sample (ALS Minerals method OA-GRA08n) while at Actlabs the specific gravity was determined without wax coating
(code Specific Gravity Core).
| Table 8-1: | Bulk
Density Measurements |
| Year |
Redox
Boundary |
Rock
Type |
Number
of
Bulk
Density
Assays |
Average
Density
(ft3/st) |
Average
Density
(g/cm3) |
Average
Density
(st/ft3) |
| 2013 |
ox |
QGS |
1 |
13.52 |
2.37 |
0.0740 |
| |
rd |
PEG |
33 |
12.09 |
2.65 |
0.0827 |
| |
|
QGS |
59 |
11.84 |
2.71 |
0.0845 |
| |
|
INT |
100 |
11.83 |
2.71 |
0.0846 |
| |
|
QMBGS |
53 |
11.90 |
2.69 |
0.0841 |
| |
|
QBGS |
17 |
11.16 |
2.87 |
0.0897 |
| 2013
Total |
|
|
263 |
11.84 |
2.71 |
0.0845 |
| |
|
|
|
|
|
|
| 2015 |
ox |
QGS |
6 |
13.93 |
2.31 |
0.0721 |
| |
tr |
QGS |
5 |
12.47 |
2.57 |
0.0803 |
| |
|
QMBGS |
1 |
12.71 |
2.52 |
0.0787 |
| 2015
Total |
|
|
12 |
13.22 |
2.44 |
0.0761 |
| |
|
|
|
|
|
|
| 2021 |
ox |
QAL |
1 |
11.78 |
2.72 |
0.0849 |
| |
|
PEG |
3 |
15.19 |
2.18 |
0.0682 |
| |
|
QGS |
83 |
12.99 |
2.50 |
0.0781 |
| |
|
QMBGS |
2 |
14.16 |
2.27 |
0.0707 |
| |
tr |
QGS |
15 |
11.93 |
2.69 |
0.0840 |
| |
|
INT |
2 |
11.71 |
2.74 |
0.0854 |
| |
rd |
QGS |
8 |
12.67 |
2.54 |
0.0794 |
| |
|
INT |
1 |
14.18 |
2.26 |
0.0705 |
| |
|
QMBGS |
5 |
12.94 |
2.48 |
0.0775 |
| |
|
QBGS |
1 |
11.24 |
2.85 |
0.0890 |
| 2021
Total |
|
|
121 |
12.87 |
2.52 |
0.0787 |
| |
|
|
|
|
|
|
| Grand
Total |
|
|
396 |
12.20 |
2.64 |
0.0825 |
Notes: Redox Boundaries include oxidized
(ox), transitional (tr), and reduced/unweathered (rd).
| | 8-4 | |
|
Westwater Resources, Inc. | Coosa Graphite Project
S-K 1300 Report |
December 11, 2023
SLR Project No.: 138.20527.00002 |
| 8.3 | Quality
Assurance and Quality Control |
Quality assurance (QA) consists of evidence
to demonstrate that the assay data has precision and accuracy within generally accepted limits for the sampling and analytical method(s) used
in order to have confidence in a resource estimate. Quality control (QC) consists of procedures used to ensure that an adequate level
of quality is maintained in the process of collecting, preparing, and assaying the exploration drilling samples. In general, QA/QC programs
are designed to prevent or detect contamination and allow assaying (analytical), precision (repeatability), and accuracy to be quantified.
In addition, a QA/QC program can disclose the overall sampling-assaying variability of the sampling method itself.
| 8.3.1 | AGC
2012–2015 Drilling |
Between 2012 and 2015, AGC had a comprehensive
QA/QC program for trench and drill core samples that met the best practices guidelines within industry standards. QA/QC samples were
not inserted in the channel samples as these are not used for resource estimation.
AGC inserted one coarse blank in every
20 samples and took one field (core) duplicate in every 20 samples, giving approximately 10% QC samples. No certified reference materials
(CRM) were available commercially for graphite carbon for the 2012 to 2014 programs. For the 2012 drill programs, AGC monitored the laboratory’s
internal standard data.
In 2015 AGC, established the use of
two CRM and inserted one CRM in every 20 samples in the 2015 drill program.
After the individual drill programs
were complete, a replicate (check) analyses were made of approximately 10% of all samples at the second laboratory.
| 8.3.2 | Westwater
Resources 2021–2022 Drilling |
Since acquiring
the property in 2018, Westwater has developed a comprehensive QA/QC program for drill core sample. The program continues the procedures
previously established by AGC and meets the best practices guidelines currently used within the industry.
Westwater geologists
insert at least one CRM and one duplicate for each hole, even if they are less than 100 ft (30.5 m) deep (industry standard of 5% would
mean one standard or one blank, and one duplicate per 100 ft (30.5 m), using a five foot sample interval).
The core samples
are placed in plastic bags that are wire-tied shut, with five samples put into a rice bag, which are then put into wooden shipping boxes.
The standards and blanks are also placed into plastic bags, similar to the core samples, but each standard and blank will be double bagged
before being put into the rice bags with the other samples in order to help prevent confusion at the laboratory as to placement of the
standards and blanks in the sample stream.
| 8.3.2.1 | Certified
Reference Materials (CRM) |
The insertion of
CRM, as mentioned above, will be randomized as to which standard is used and when they are inserted in the sample stream. To increase
randomization and checks on the laboratory, standards will occasionally be inserted after blanks in the sample stream. Exceptions to
the randomization include:
| · | Occasionally
standards will be inserted after visually high grade samples to provide a further check on
the laboratory. |
| · | A
standard close to the mining cut-off grade of 2% Cg will be inserted after some of the samples
that visually appear to contain approximately 2% Cg. |
| · | Drill
hole numbers were removed from corresponding sample numbers which provided another quality
control check on the laboratories. |
| | 8-5 | |
|
Westwater Resources, Inc. | Coosa Graphite Project
S-K 1300 Report |
December 11, 2023
SLR Project No.: 138.20527.00002 |
The drill holes
will be cut and sampled in the order that they were drilled. Because all of the planned holes at Coosa are less than 120 ft (36.6 m),
multiple holes will be submitted to the laboratory at the same time. One blank of 50 g (two envelopes) will be inserted into the sample
stream at the beginning of each hole, and one blank will be inserted at the end of the group of holes to be submitted at the same time.
Other blanks (at least one per hole) will be inserted after a randomly selected visually high grade interval.
Duplicates should
be taken in a more orderly fashion, at least one every ten samples, or at least one per hole even for holes less than 50 ft (15.2 m)
deep. These should include both visually high-grade and near cut-off grade samples to provide more certainty as to the assay results.
| 8.3.3 | Certified
Reference Materials |
Results of the regular submission of
CRMs are used to identify issues with specific sample batches, and biases associated with the laboratory. Results of the CRM sample analyses
are plotted monthly in control charts with upper and lower limits of the acceptable values and the certified value.
| 8.3.3.1 | AGC
2012 Drill Program |
No CRMs were available commercially
for graphite in order to maintain an independent control. Instead, the internal standards used by the laboratory, ALS Minerals, were
plotted. Four standards, with a range of carbon grades, were used routinely. The recommended values and upper and lower limits (defined
as two standard deviations from the recommended value or the 95% confidence limits (P95)), as supplied by ALS Minerals, are
listed in Table 8-2. These samples were manufactured by CANMET Mining and Mineral Services Laboratories, Ottawa, Canada as part of the
Canadian Certified Reference Materials Project (CCRMP). These samples are certified for other elements and carbon is uncertified and
is given as an “informational value”, “provisional value” or “approximate value”. Plots of the results
of total carbon analyses by sample are shown in Figure 8-1 through Figure 8-4. The results are within the upper and lower confidence
limits and show no trends or drift with time, thus indicating that the analyses have good precision and accuracy.
| | 8-6 | |
|
Westwater Resources, Inc. | Coosa Graphite Project
S-K 1300 Report |
December 11, 2023
SLR Project No.: 138.20527.00002 |
| Table 8-2: |
List of CANMET CRM Used for Carbon by ALS Minerals 2012 |
| Standard |
Ct
% Value |
Ct
% P95 Lower Limit |
Ct
% P95 Upper Limit |
| NBM-1 |
0.79 |
0.75 |
0.83 |
| MA-1b |
2.44 |
2.34 |
2.54 |
| DS-1 |
3.13 |
3.01 |
3.25 |
| STSD-3 |
8.4 |
8.09 |
8.71 |
Notes:
| 2. | Rec
– Recommended Standard Ct % Value |
| 3. | LL
– Lower P95 Confidence Limit |
| 4. | UL
– Upper P95 Confidence Limit |
| Figure 8-1: | CRM NBM-1 2012 |

Source: Westwater, 2022
| | 8-7 | |
|
Westwater Resources, Inc. | Coosa Graphite Project
S-K 1300 Report |
December 11, 2023
SLR Project No.: 138.20527.00002 |
| Figure 8-2 : |
CRM MA-1b 2012 |

Source: Westwater, 2022
| | 8-8 | |
|
Westwater Resources, Inc. | Coosa Graphite Project
S-K 1300 Report |
December 11, 2023
SLR Project No.: 138.20527.00002 |
| Figure 8-3 : |
CRM DS-1 2012 |

Source: Westwater, 2022
| | 8-9 | |
|
Westwater Resources, Inc. | Coosa Graphite Project
S-K 1300 Report |
December 11, 2023
SLR Project No.: 138.20527.00002 |
| Figure 8-4: |
CRM STSD-3 2012 |
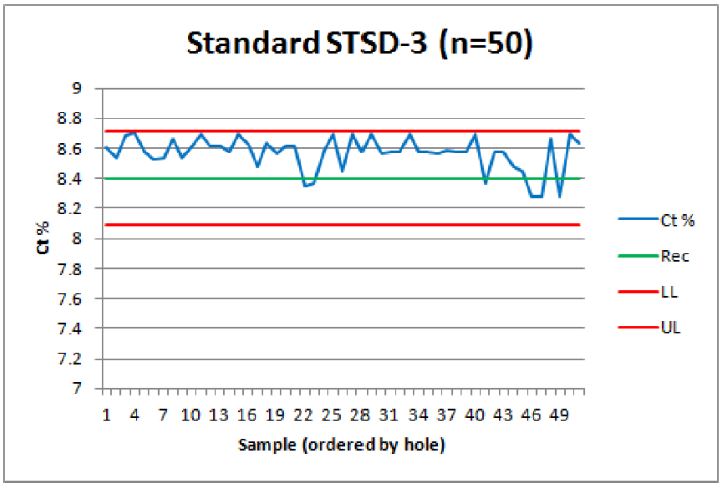
Source: Westwater, 2022
| 8.3.3.2 | AGC
2015 Drill Program |
AGC had two CRMs made by Actlabs in
2015 using coarse rejects of oxidized graphite schist from Coosa trench samples. The samples were pulverized, mixed, and homogenized,
and 10 samples of each were analyzed at four laboratories (Actlabs, SGS, ALS Minerals, and Acme), from which the mean and standard deviation
were calculated (the Acme data was not used as they use a different assaying method and digestion which gave a different mean and standard
deviation). The recommended values are shown in Table 8-3.
The CRM results are monitored using
control charts which are graphs with sample number or time on the x-axis and values on the y-axis. There are horizontal lines for the
recommended mean value (green), and ±2 (yellow) and ±3 (red) standard deviations (SD). CRM values within ± 2SD are
accepted; an isolated sample above ± 2SD but below ± 3SD is acceptable but is a warning; two consecutive samples above
± 2SD are rejected; and any sample above ± 3SD is rejected.
Zscore plots of the results of the Cg
analyses by sample (time) is shown in Figure 8-5. The results are acceptable and show no trends or drift with time and indicate that
the analyses have good precision and accuracy.
| | 8-10 | |
|
Westwater Resources, Inc. | Coosa Graphite Project
S-K 1300 Report |
December 11, 2023
SLR Project No.: 138.20527.00002 |
| Table 8-3: |
AGC Coosa CRM Recommended Values 2015 |
| CSRM |
Cg
% Value |
Standard
Deviation Cg% |
| Standard
A |
2.47 |
0.0395 |
| Standard
B |
4.07 |
0.1403 |
| Figure 8-5: |
Zscore Plot of CRM Standard A and Standard B 2015 |

Source: SLR, 2022
| | 8-11 | |
|
Westwater Resources, Inc. | Coosa Graphite Project
S-K 1300 Report |
December 11, 2023
SLR Project No.: 138.20527.00002 |
| 8.3.3.3 | Westwater
2021-2022 Drill Program |
Westwater obtained
four CRMs certified for carbon and one blank from CDN Resource Laboratories, Ltd. (CDN), located in Langley, British Columbia, Canada
to account for different grade ranges (Table 8-4).
| Table 8-4: | Westwater
Coosa CSRM Values 2021-2022 |
STD
Name |
CSRM |
Cg
%
Value |
SD |
±2SD
|
Mean-
2SD |
Mean+2S
D |
Mean-
3SD |
Mean+3S
D |
| Std
1 |
CDN-GR-1 |
3.12 |
0.0550 |
0.1100 |
3.01 |
3.23 |
2.96 |
3.29 |
| Std
2 |
CDN-GR-2 |
1.93 |
0.1050 |
0.2100 |
1.72 |
2.14 |
1.62 |
2.25 |
| Std
3 |
CDN-GR-3 |
2.39 |
0.0550 |
0.1100 |
2.28 |
2.50 |
2.23 |
2.56 |
| Std
4 |
CDN-GR-4 |
1.01 |
0.0450 |
0.0900 |
0.92 |
1.10 |
0.88 |
1.15 |
| Blank |
CDN-BL-10 |
0 |
|
|
|
|
|
|
A total of 113 CRMs were inserted in
the 2021-2022 sampling analysis, representing an insertion ratio of 10.0% considering all the samples. SLR received the CRM results,
prepared control charts, and analyzed temporal and grade trends. Figure 8-6 presents the results for the Std 1 through Std 4 CRMs and
indicates moderately good precision of the laboratory for STD 2, STD 3, and STD 4 and only small low bias in some cases. However, approximately
56% of STD 1 are outside the lower and upper limits of ±2SD. One sample from STD 2 is outside ±2SD.
Westwater did not rerun any additional
checks on the failed batches and the cause of the STD 1 failures is suspected to be poor homogeneity in the standard sample quality.
SLR is of the opinion that the STD 1 results are not materially impacting the Mineral Resource estimate or have relevance for this TRS
but recommends that Westwater check and/or remove STD 1 for future assay analysis.
| | 8-12 | |
|
Westwater Resources, Inc. | Coosa Graphite Project
S-K 1300 Report |
December 11, 2023
SLR Project No.: 138.20527.00002 |
| Figure 8-6: | Zscore Plot of CSRM Std 1 through
Std 4 2021 |

Source: SLR, 2022
Blank material is used to assess contamination
or sample-cross contamination during sample preparation and to identify sample numbering errors.
| 8.3.4.1 | AGC
2012 Drill Program |
Coarse blanks were inserted in the drill
and trench samples at approximately one every 100 ft (30.5 m), which equals one in every twentieth sample (approximately 5%).
Local marble was initially used as a
blank but reported high C in LECO analyses because of problems with incomplete dissolution of carbonate. The blank was then changed to
diorite in the form of coarse rock chips of 1 in. to 2 in. (2.5 cm to 5.1 cm) size bought as landscape rock from a local hardware store.
Neither of these samples were analyzed previously for carbon or other elements. The diorite blank was introduced together with the marble
blank from hole AGC-002C, and diorite was used exclusively from hole AGC-007C onwards. A total of 18 marble blanks and 221 diorite blanks
were analyzed out of a total of 3,856 unknown drill samples in the 2012 drill programs (6.2% total blanks including 5.7% diorite blanks;
note that the total unknown samples analyzed was higher and some have been eliminated from the database due to overlap between core samples
and sonic samples). The diorite blanks are plotted in Figure 8-7 with reference lines at the lower limit of detection (0.01%), and five
and ten times the lower limit of detection (LLD), 0.05% and 0.10%, respectively. Eleven samples (5% of the blanks) are greater than 0.10%,
including four samples (1.8%) above 0.20% Cg, with values of 0.23%, 0.37%, 1.35%, and 1.91% Cg, which may be due to contamination, sample
switches, or mislabeling.
| | 8-13 | |
|
Westwater Resources, Inc. | Coosa Graphite Project
S-K 1300 Report |
December 11, 2023
SLR Project No.: 138.20527.00002 |
The diorite blanks from the 2014 trenching
program are shown in a scatter plot in Figure 8-8, which indicates that all but two samples were below the detection limit.
| Figure 8-7: | Scatter Plot of Coarse Diorite
Blanks 2012 |

Source: Westwater, 2022
| | 8-14 | |
|
Westwater Resources, Inc. | Coosa Graphite Project
S-K 1300 Report |
December 11, 2023
SLR Project No.: 138.20527.00002 |
| Figure 8-8: | Scatter Plot of Coarse Diorite
Blanks 2014 Trenching Program |
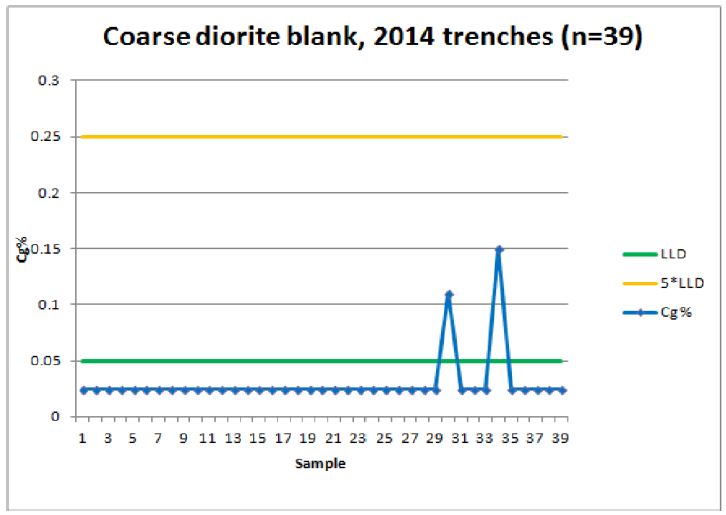
Source: Westwater, 2022
| | 8-15 | |
|
Westwater Resources, Inc. | Coosa Graphite Project
S-K 1300 Report |
December 11, 2023
SLR Project No.: 138.20527.00002 |
| 8.3.4.2 | AGC
2015 Drill Program |
The diorite blanks from the 2015 drilling
program are shown in a scatter plot in Figure 8-9 which shows that all samples were below the detection limit.
| Figure 8-9: | Scatter Plot of Coarse Diorite
Blanks 2015 |

Source: SLR, 2022
Note: Samples below detection limit
were replaced by half of the detection limit
| 8.3.4.3 | Westwater
2021–2022 Drill Program |
Westwater uses a certified blank material
(BL-10) sourced at CDN which consists of blank granitic material. Blank material was inserted at a rate of 8.0% in 2021-2022. SLR prepared
charts of the blank sample results against the recommended upper limit, set at five times the lower detection limit of the analytical
method.
Results of the blank analysis are presented
in Figure 8-10, and indicate few samples with contamination, with no failures (i.e., results above the recommended upper limit).
| | 8-16 | |
|
Westwater Resources, Inc. | Coosa Graphite Project
S-K 1300 Report |
December 11, 2023
SLR Project No.: 138.20527.00002 |
| Figure 8-10: | Scatter Plot of Granite Material
Blanks 2021-2022 |

Source: SLR, 2022
Note: Samples below detection limit
were replaced by half of the detection limit
Duplicate samples are used to monitor
preparation, assay precision, and grade variability as a function of sample homogeneity and laboratory error.
| 8.3.5.1 | AGC
2012 Drill Program |
One field (core or trench) duplicate
was collected approximately every 100 ft (30.5 m), which equals one in every twentieth sample (approximately 5%).
Core duplicates were taken by cutting
the normal half core sample lengthwise to give two one-quarter core samples which were submitted for analysis as original and subsequent
duplicate. These samples are half of the weight of normal half-core samples, which may thus introduce greater inhomogeneity than average.
Trench duplicates were made by taking another sample along the same channel as the original.
A total of 160 pairs of field duplicates
were analyzed out of a total of 3,856 unknown drill samples (4.1%) from the 2012 drill programs. The results are shown in a scatter plot
in Figure 8-11 and in a plot of relative difference versus original value in Figure 8-12. These show that 91% of the duplicates are within
±20% of the average. The overall correlation is close to unity with scatter distributed evenly on either side, interpreted as
geological heterogeneity, and there is no systematic bias. The average of the original samples is 1.86% Cg, and the duplicates is 1.86%
Cg, with a relative difference of -0.23%.
| | 8-17 | |
|
Westwater Resources, Inc. | Coosa Graphite Project
S-K 1300 Report |
December 11, 2023
SLR Project No.: 138.20527.00002 |
Figure 8-13 presents the results of
the analyses for the 39 pairs of field (trench channel) duplicates from the 2014 trenching program included in the Resource Estimate.
This shows that 87% of the duplicates are within ±20% of the average. This is slightly lower than the core samples and is a function
of greater sample variability in trench channels. The overall correlation is close to unity with scatter distributed evenly on either
side, interpreted as geological heterogeneity, and there is no systematic bias. The average of the original samples is 2.26% Cg, and
the duplicates is 2.31% Cg, with a relative difference of 2.26%.
| Figure 8-11: | Scatter Plot of Field Core
Duplicates 2012 |
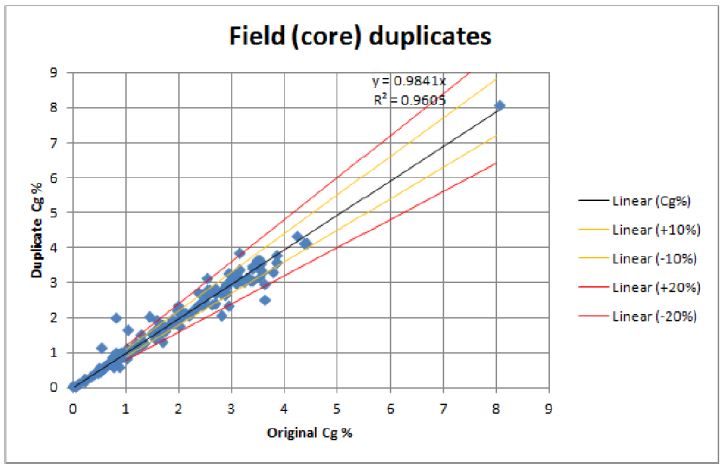
Source: Westwater, 2022
| | 8-18 | |
|
Westwater Resources, Inc. | Coosa Graphite Project
S-K 1300 Report |
December 11, 2023
SLR Project No.: 138.20527.00002 |
| Figure 8-12: | Plot of Field Core Duplicate
Mean versus Relative Difference 2012 |
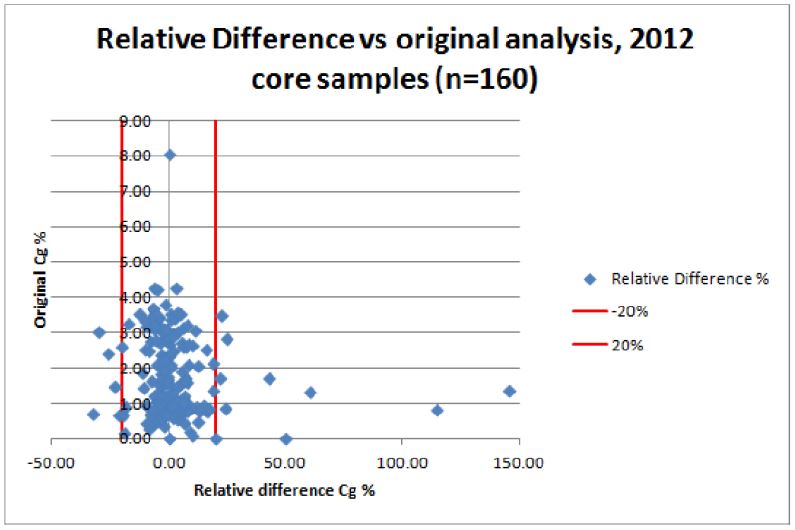
Source: Westwater, 2022
| | 8-19 | |
|
Westwater Resources, Inc. | Coosa Graphite Project
S-K 1300 Report |
December 11, 2023
SLR Project No.: 138.20527.00002 |
| Figure 8-13: | Scatter Plot of Field Core
Duplicates 2014 Trenching Program |

Source: Westwater, 2022
| 8.3.5.2 | AGC
2015 Drill Program |
A total of 61 pairs of field duplicates
were analyzed out of a total of 1,404 drill samples (4.3%) from the 2015 drill program. The results are shown in a scatter plot in Figure
8-14 and in a plot of relative difference versus original analysis in Figure 8-15. This shows that 95% of the duplicates are within ±20%
of the original, with three outliers. The overall correlation is close to unity with scatter distributed evenly on either side, interpreted
as geological heterogeneity, and again there is no systematic bias. The average of the original samples is 2.57% Cg, and the duplicates
is 2.61% Cg, with a relative difference of 1.5%.
SLR concludes that the duplicate core
samples show geological variability but there is no systematic bias, and the relative difference of the average grade of all originals
and duplicates is very low, i.e., the average values are almost identical.
| | 8-20 | |
|
Westwater Resources, Inc. | Coosa Graphite Project
S-K 1300 Report |
December 11, 2023
SLR Project No.: 138.20527.00002 |
| Figure 8-14: | Scatter Plot of Field Core
Duplicates 2015 |

Source: SLR, 2022
| | 8-21 | |
|
Westwater Resources, Inc. | Coosa Graphite Project
S-K 1300 Report |
December 11, 2023
SLR Project No.: 138.20527.00002 |
| Figure 8-15: | Plot of Field Core Duplicate
Mean versus Relative Difference 2015 |

Source: SLR, 2022
| 8.3.5.3 | Westwater
2021-2022 Drill Program |
A total of 114 pairs of field duplicates
were analyzed out of a total of 1,144 drill samples (10.0%) from the 2021-2022 drill program. The results are shown in a scatter plot
in Figure 8-16 and in a plot of relative difference versus original analysis in Figure 8-17. These show that 90% of the duplicates are
within ±20% of the original, with 11 outliers. The overall correlation is close to unity with scatter distributed evenly on either
side, interpreted as geological heterogeneity, and again there is no systematic bias. The average of the original samples is 2.94% Cg,
and the duplicates is 2.96% Cg, with a relative difference of 0.90%.
| | 8-22 | |
|
Westwater Resources, Inc. | Coosa Graphite Project
S-K 1300 Report |
December 11, 2023
SLR Project No.: 138.20527.00002 |
It is concluded that the duplicate core
samples show geological variability but there is no systematic bias, and the relative difference of the average grade of all originals
and duplicates is very low, i.e., the average values are almost identical.
| Figure 8-16: | Scatter Plot of Field Core
Duplicates 2021 |

Source: SLR, 2022
| | 8-23 | |
|
Westwater Resources, Inc. | Coosa Graphite Project
S-K 1300 Report |
December 11, 2023
SLR Project No.: 138.20527.00002 |
| Figure 8-17: | Plot of Field Core Duplicate
Mean versus Relative Difference 2021 |

Source: SLR, 2022
| 8.3.6 | Secondary
Laboratory Check |
AGC carried out replicate analyses of
a complete drill hole, AGC-03C, early in the drill program, and of 11.4% of samples from all drill holes after drilling had been completed.
| | 8-24 | |
|
Westwater Resources, Inc. | Coosa Graphite Project
S-K 1300 Report |
December 11, 2023
SLR Project No.: 138.20527.00002 |
AGC reanalyzed all samples from hole
AGC-03C at a second laboratory in the early stages of the drill program. The preparation was carried out by a local laboratory which
split the sample pulp into two, hence these are replicate analyses (same pulp). One pulp was sent to the prime laboratory, ALS Minerals,
and the second sent to the second laboratory, Actlabs. A scatter plot of the two sets of analyses is shown in Figure 8-18 and shows a
good correlation, with some scatter about the mean above 1% Cg. The average grade of the original analyses is 1.03% Cg versus the 1.01%
for the replicate analyses, a difference of 0.02% Cg, and a relative difference of 1.9%.
| Figure 8-18: | Scatter Plot of Replicate Analyses
of Hole AGC-03C |

Source: Westwater, 2022
AGC sent 438 sample pulps from the whole
drill program to Actlabs for replicate analyses. Samples were selected by taking every tenth sample. This represents 11.3% of the total
of 3,856 unknown drill samples. One replicate sample was a marble blank which had originally given an unreliable analysis and so it was
eliminated, leaving 437 samples to plot. A scatter plot of the original and replicate analyses is shown in Figure 8-19 and shows a close
correlation between the two laboratories, with some scatter in the 1% to 2% range, and a possible slight high bias at Actlabs above 2.0%
Cg. The average grade of the original analyses is 1.85% Cg and the average grade of the replicate analyses is 1.86%, with a relative
difference of -0.8%.
| | 8-25 | |
|
Westwater Resources, Inc. | Coosa Graphite Project
S-K 1300 Report |
December 11, 2023
SLR Project No.: 138.20527.00002 |
A plot of the mean versus relative difference
is shown in Figure 8-20. This plot shows that the majority of the samples (95.0%) have less than ±20% relative difference, i.e.,
the reproducibility is very good. Samples with a high relative difference along the x-axis are a data artifact close to or below the
LLD: Actlabs has a LLD of 0.05% Cg, with eight samples below this which were converted to half of the LLD to plot, whereas ALS has a
lower LLD of 0.01% with two samples below the LLD. The plot also shows a slight trend for the original ALS analyses to be higher and
with more scatter than the replicates for samples below 1.5% Cg, whereas the Actlabs analyses are slightly higher than the originals
for samples above 3% Cg. These slight systematic differences are interpreted to be inter-laboratory differences which may be due to differences
such as analytical procedure, reagents used, and instrument calibration. The small differences are not considered to be significant and
no adjustments to the original data are recommended. Overall, the data shows very good reproducibility.
| Figure 8-19: | Scatter Plot of Replicate Analyses
of Cg for Whole Drill Program |

Source: Westwater, 2022
| | 8-26 | |
|
Westwater Resources, Inc. | Coosa Graphite Project
S-K 1300 Report |
December 11, 2023
SLR Project No.: 138.20527.00002 |
| Figure 8-20: | Plot of Mean vs. Relative Difference
of % Cg for Replicate Samples |

Source: Westwater, 2022
| 8.3.6.2 | Westwater
2021–2022 |
During the 2021-2022 drilling programs,
Westwater sent 221 sample pulps from the whole drill program to SGS for replicate analyses. This represents 16.9% of the total of 1,305
drill samples. A scatter plot of the original and replicate analyses in Figure 8-21 shows a close correlation between the two laboratories,
with some scatter in the 1% to 2% range, and a possible slight high bias at SGS above 2.0% Cg. The average grade of the original analyses
is 2.48% Cg and the average grade of the replicate analyses is 2.59%.
A plot of the mean versus relative difference
is shown in Figure 8-22. This plot shows that most of the samples (97.0%) have less than ±20% relative difference, i.e., the reproducibility
is very good. The plot also shows the original ALS analyses to be lower and with similar scatter to the replicates for samples above
2.0% Cg. These slight systematic differences are interpreted to be inter-laboratory differences which may be due to differences such
as analytical procedure, reagents used, and instrument calibration, and should be revisited with future drilling. The differences are
not considered to be significant and no adjustments to the original data are recommended. Overall, the data shows good reproducibility
and will have negligible impact on the Mineral Resource estimate.
| | 8-27 | |
|
Westwater Resources, Inc. | Coosa Graphite Project
S-K 1300 Report |
December 11, 2023
SLR Project No.: 138.20527.00002 |
| Figure 8-21: | 2021 External Duplicate Sample
Results for U3O8% (SGS vs. Actlabs) |

Source: SLR, 2022
| | 8-28 | |
|
Westwater Resources, Inc. | Coosa Graphite Project
S-K 1300 Report |
December 11, 2023
SLR Project No.: 138.20527.00002 |
| Figure 8-22: | Mean vs. Relative Difference
(SGS vs. Actlabs) |

Source: SLR, 2022
Core and samples are stored in a secure
warehouse owned by Westwater in Kellyton, Alabama 35 miles to the east of the project that also has facilities for the field office,
core logging, core cutting and core sampling. Core is stored in waxed card boxes on wooden pallets by hole number and wrapped with shrink
wrap. Sonic core is stored in long plastic boxes. Pallets are moved by forklift truck.
| | 8-29 | |
|
Westwater Resources, Inc. | Coosa Graphite Project
S-K 1300 Report |
December 11, 2023
SLR Project No.: 138.20527.00002 |
Core is collected from the drill rig
by Westwater geologist and brought to the warehouse by an Westwater truck, where it is logged, photographed and sampled. Diamond core
is cut lengthwise by diamond saw in the warehouse, and one-half core is put in a plastic or cloth bag with a consecutive sample number
tag, sample number in indelible marker, and sealed with a cable tie. The remaining half-core is returned to the core box and stored in
the warehouse for reference. The sample number is marked in the core box by a sample number tag. Sonic core is cut lengthwise with a
knife and sampled, numbered and stored in the same way as diamond core.
Samples are put in wooden crates on
a pallet for shipping, each holding approximately 1,000 lb (454 kg). The sample crates are covered but not sealed. They are transported
by a UPS courier truck to the Actlabs laboratory in Elko, Nevada, or to the Activation Laboratories Ltd. (Actlabs) laboratory in Ancaster,
Ontario, for sample preparation and analysis. The coarse sample rejects and pulps are back-shipped in the same crates by UPS to the warehouse
in Sylacauga for storage.
In the SLR QP’s opinion, the QA/QC
program as designed and implemented by Westwater and its predecessor AGC meet current industry standard practice and the assay results
within the database are suitable for use in a Mineral Resource estimate.
In the SLR QP’s opinion, the sample
preparation, analysis, and security procedures at Coosa Graphite are adequate for use in the estimation of Mineral Resources.
| | 8-30 | |
|
Westwater Resources, Inc. | Coosa Graphite Project
S-K 1300 Report |
December 11, 2023
SLR Project No.: 138.20527.00002 |
Data verification is the process of
confirming that data has been generated with proper procedures, is transcribed accurately from its original source into the Project database,
and is suitable for use in Mineral Resource estimation.
The SLR QP, visited the Project on April 23,
2022, accompanied by David Greenan (Consulting Geologist) of Westwater. During the site visit, the SLR QP was given an overview of the
ongoing exploration drilling activities and a surface Project tour. The SLR QP also reviewed core handling, logging, sampling, and storage
procedures.
As part of the data verification procedure,
drill data was spot checked and audited by SLR for completeness and validity using standard database validation tests using tools provided
within the Leapfrog Geo and Vulcan software programs and MS Excel to check for potential issues including:
| · | Sample
length and overlap issues |
| · | Maximum
and minimum lengths and assay grades |
| · | Overlapping
and/or duplicate entries |
| · | Gaps
in assays/unsampled intervals |
| · | AGC
previously contracted Perry Remote Sensing, LLC (PRS) to purchase a precision digital elevation
model (DEM) data for 56.5 mi2 (91 km2) of the Project area. The DEM
data was used to make a triangulation surface in Vulcan which was used to register drill
hole collars to this surface. |
In addition, SLR reviewed the QA/QC
methods and results, verified assay certificates against the database assay table, and reviewed drill core. No limitations were placed
on SLR’s data verification process. The review of the QA/QC program and results is presented in Section 8, Sample Preparation,
Analyses and Security. No independent samples were taken as part of this TRS.
No significant database issues were
identified and the SLR QP is of the opinion that the database verification procedures for Coosa comply with industry standards and are
adequate for the purposes of Mineral Resource estimation.
| | 9-1 | |
|
Westwater Resources, Inc. | Coosa Graphite Project
S-K 1300 Report |
December 11, 2023
SLR Project No.: 138.20527.00002 |
| 10.0 | Mineral
Processing and Metallurgical Testing |
Bench-scale metallurgical test work
programs on samples from the Coosa deposit commenced at the independent SGS Minerals laboratories in Lakefield, Ontario, Canada (SGS
Lakefield) in April 2013 and culminated in a full flowsheet development program in August 2015. This work focused on the grindability
and flotation responses of the various samples. A summary of results from the various test programs is provided chronologically in the
following sections and is largely based on the 2015 Preliminary Economic Assessment by AGP Mining Consultants Inc. (AGP, 2015).
| 10.2 | 2013
Metallurgical Test Work |
Three different samples weighing approximately
20 kg each were received at the SGS Lakefield site in April 2013. The three samples were obtained from the surface and drill core
covering a depth from 0 to 270 ft. The sample AGC-H045 0-34 was from the oxidized zone and the other samples were from the reduced zone
(Table 10-1).
| 10.2.1 | Sample
Preparation and Head Characterization |
Each sample was stage crushed to -6
mesh, homogenized, and subsampled for chemical analysis. The balance of the material was rotary split into two kilogram test charges.
A summary of the head assay results is presented in Table 10-1. The graphitic carbon ranged between 2.92% Cg and 3.71% Cg. The total
organic carbon (TOC) content was below the detection limit of 0.05% TOC for the two composites from a greater depth and 0.17% TOC for
the AGC-H045 0-34 composite, which was collected from the surface of the deposit. This composite looked different in that it showed typical
signs of a weathered and oxidized ore. The carbonate carbon concentrations were generally low with up to 2.90% CO3. The sulfur
concentrations were 1.75% S to 2.09% S in the two composites from the lower sections of the deposit. The low grade of 0.04% S in the
composite from the surface of the deposit confirms the weathered occurrence of the sample. The overall ratio of sulfide to carbonate
concentration suggests that a desulphurization stage will likely be required to generate non-acid-generating tailings. The inductively
coupled plasma optical emission spectrometry (ICP-OES) results reveal low concentrations of deleterious elements and no potential metal
by-products.
Table
10-1: Head Assays for 2013 Coosa Deposit Metallurgical Samples
| Sample ID |
Ct % |
Cg % |
TOC
(LECO)% |
CO3% |
S % |
| AGC-011C-190-220 |
3.43 |
3.53 |
<0.05 |
1.55 |
2.09 |
| AGC-H045 0-34 |
3.74 |
3.71 |
0.17 |
0.65 |
0.04 |
| AGC-G04C 240-270 |
2.95 |
2.92 |
<0.05 |
2.90 |
1.75 |
| | 10-1 | |
|
Westwater Resources, Inc. | Coosa Graphite Project
S-K 1300 Report |
December 11, 2023
SLR Project No.: 138.20527.00002 |
| 10.2.2 | Cleaner
Flotation Testing |
A single batch cleaner flotation test
was carried out on each sample. The test conditions were determined by the metallurgist based on observations made during the tests.
The overall flowsheet was kept almost the same in all tests and is depicted in Figure 10-1. In only one test, AGC-H045 0-34, the primary
grind and the rougher stage were bypassed as any remaining graphite flakes after flash flotation were very fine and locked with quartz,
thus requiring more intensive grinding conditions. Consequently, a short primary grind would not have achieved the necessary mineral
liberation.
Figure
10-1: Open Circuit Flowsheet for April 2013 Coosa Deposit Samples

Source: AGP, 2015
The open circuit metallurgical performance
of the three tests is presented in Figure 10-2 in the form of total carbon grade versus total carbon recovery. The two samples from greater
depth (AGC-011C 190-220 and AGC-G-04C 240-270) outperformed the shallow sample (AGC- H045 0-34) in terms of carbon recovery. The two
deeper samples achieved open circuit carbon recoveries of 93.5% and 97.7% compared to only 80.2% for the shallow sample. However, the
shallow sample produced the highest concentrate grade of 91.1% total carbon compared to 80.8% and 88.3% total carbon for the deeper samples.
It is postulated that the liberation properties were improved for the shallow sample due to weathering.
It should be noted that these tests
were carried out as scoping level tests only, with the primary objective of evaluating the amenability of the Coosa mineralization to
standard graphite processing technology.
| | 10-2 | |
|
Westwater Resources, Inc. | Coosa Graphite Project
S-K 1300 Report |
December 11, 2023
SLR Project No.: 138.20527.00002 |
A secondary objective of this work was
to develop an understanding of the flake size distribution in a flotation concentrate. The mass recovery into different size fractions
of the flotation concentrate is depicted in Figure 10-3. The results suggest that the flake size distribution of the shallow sample was
significantly finer compared to the other two samples.
Figure
10-2: Total Carbon Grade Versus Total Carbon Recovery - 2013 Coosa Deposit Samples

Source: AGP, 2015
| | 10-3 | |
|
Westwater Resources, Inc. | Coosa Graphite Project
S-K 1300 Report |
December 11, 2023
SLR Project No.: 138.20527.00002 |
Figure
10-3: Mass Recovery into Different Flake Sizes - 2013 Coosa Deposit Samples

Source: AGP, 2015
| 10.3 | 2014
Metallurgical Test Work |
A second scoping level metallurgical
test program was completed at SGS Lakefield on four samples originating from the Coosa deposit. The primary objective of the test program
was to evaluate the metallurgical response of the four graphite samples to support the identification of the most promising mineral zone
for flowsheet development purposes.
| 10.3.1 | Sample
Preparation and Head Characterisation |
Four samples, weighing between 1.2 kg
and 3.7 kg each, were received at SGS Lakefield in April 2014. Each sample was stage-crushed to -6 mesh and split into two kilogram
and one kilogram test charges. A representative head sample of the four samples was submitted for chemical analysis and the pertinent
results are presented in Table 10-2. The head grades of the four samples ranged between 1.79% Cg and 4.42% Cg.
| | 10-4 | |
|
Westwater Resources, Inc. | Coosa Graphite Project
S-K 1300 Report |
December 11, 2023
SLR Project No.: 138.20527.00002 |
Table
10-2: Carbon Speciation and Sulphur Analysis of Coosa Deposit Samples
| Sample ID |
Ct % |
Cg % |
TOC % |
CO2 % |
S % |
| C5-155 A-k |
1.86 |
1.79 |
0.12 |
< 0.05 |
0.02 |
| AGC-10c 70-80 |
4.67 |
4.42 |
0.46 |
1.28 |
2.10 |
| Hole E-09 85-90, Hole 10330-335, Sample 132962 |
3.30 |
3.21 |
0.34 |
0.26 |
2.25 |
| J030-30 |
3.05 |
2.87 |
0.47 |
2.75 |
0.02 |
| 10.3.2 | Batch
Cleaner Flotation |
In order to preserve the graphite flakes,
a two-stage grinding approach was chosen for the flotation. One batch cleaner flotation test was carried out on each of the four samples.
The conditions of the tests such as flotation times, grinding and polishing times, and reagent dosages were established during the tests
by evaluating the intermediate concentrate and tailings products in a binocular microscope. Due to the significant amount of liberated
entrained gangue minerals for the C5-155-A-K sample, this test included a pre-cleaner prior to polishing and three stages of cleaning
of the polishing mill discharge. The remaining three tests subjected the combined flash and rougher concentrate to polishing grinding
followed by four stages of cleaning.
The carbon grade versus carbon recovery
curves of the four tests are presented in Figure 10-4. While the top three samples, AGC-10c, Hole E-09, and J030-30, produced somewhat
comparable grade-recovery curves, sample C5-155-A-K yielded the lowest carbon recovery of 51.8% into the graphite concentrate. While
this number is expected to increase in closed circuit operation, the difference in metallurgical response compared to the other samples
is notable. The top three samples produced concentrates grading between 83.7% Ct and 90.0% Ct. While the AGC-10c 70-80 sample yielded
the highest head grade of 4.42% Cg, it produced the lowest 4th cleaner concentrate grade of 83.7% Ct.
The carbon grade and mass recoveries
into the different size fractions in the final concentrates are presented in Figure 10-5 and Figure 10-6, respectively.
The sample consisting of Hole E-09 85-90,
Hole 10 330-335, and 132962 and the J03 0-30 sample were the best-performing samples when considering both the flake size distribution
and concentrate grades in the various size fractions. The flake size distribution of the C5-155-A-K sample was fine at 80% passing 106
microns (150 mesh). Only 1.6% of the concentrate mass reported to the plus 80 mesh products compared to 12.3% to 28.4% for the other
three samples.
The C5-155 A-K and J03 0-30 samples
were characterized by a very low sulfur grade of 0.02% S, which almost certainly will render the tailings streams of these three samples
non-acid generating. However, this would have to be verified with environmental tests such as acid base accounting (ABA) or net acid
generation (NAG) tests. The J03 0-20 sample also contained carbonates that would neutralize any small quantities of acid that may develop.
| | 10-5 | |
|
Westwater Resources, Inc. | Coosa Graphite Project
S-K 1300 Report |
December 11, 2023
SLR Project No.: 138.20527.00002 |
Figure
10-4: Carbon Grade Versus Carbon Recovery Curves

Source: AGP, 2015
| | 10-6 | |
|
Westwater Resources, Inc. | Coosa Graphite Project
S-K 1300 Report |
December 11, 2023
SLR Project No.: 138.20527.00002 |
Figure
10-5: Carbon Grades of Concentrate Size Fractions

Source: AGP, 2015
| | 10-7 | |
|
Westwater Resources, Inc. | Coosa Graphite Project
S-K 1300 Report |
December 11, 2023
SLR Project No.: 138.20527.00002 |
Figure
10-6: Mass Recovery into Concentrate Size Fractions

Source: AGP, 2015
The following recommendations were made
for the next phase of metallurgical testing focusing on the most encouraging zone(s) within the samples tested to date:
| · | Basic
comminution testing; |
| · | Flowsheet
development program to achieve a flowsheet that maximizes concentrate grade and carbon recovery,
while minimizing the degradation of flakes, and |
| · | Preliminary
environmental testing to identify any major deleterious elements that may be present in the
feed material and to quantify the acid-generating potential of the Coosa mineralization. |
| 10.4 | 2014-2015
Metallurgical Test Work |
The subsequent metallurgical program
was completed at SGS Lakefield from April 2014 to July 2015 and comprised scoping level testing on twelve samples, including
basic comminution testing on two samples and cleaner flotation testing on ten samples.
| | 10-8 | |
|
Westwater Resources, Inc. | Coosa Graphite Project
S-K 1300 Report |
December 11, 2023
SLR Project No.: 138.20527.00002 |
| 10.4.1 | Sample
Preparation and Head Characterization |
Ten samples, including two samples from
depths 0 to 8 ft and 300 ft to 325 ft and eight trench samples, were stage-crushed to -6 mesh and rotary split into two kilogram test
charges. Each sample was processed separately and no blending of different samples was performed. The results of the head analysis of
the ten samples are presented in Table 10-3 and Table 10-4. Only total carbon and graphitic carbon analysis was carried out for the eight
trench samples. The grades of the ten samples ranged between 2.55% Cg for the TR05 sample and 4.42% graphitic carbon for the AGC-12A
(0-8’) sample.
Table
10-3: Carbon Speciation and Sulphur Analysis of Two Coosa Deposit Samples
| Sample ID |
Ct % |
Cg % |
TOC % |
CO3 % |
S % |
| AGC-12A (0-8') |
4.48 |
4.42 |
0.18 |
< 0.05 |
0.04 |
| AGC-09C (300-325) |
3.35 |
3.35 |
0.05 |
< 0.05 |
1.92 |
Table
10-4: Total Carbon and Graphitic Carbon Grades for Eight Trench Samples
| Sample ID |
Ct % |
Cg % |
| TR07B |
3.11 |
3.12 |
| TR08 |
3.50 |
3.34 |
| TR01A |
3.17 |
3.17 |
| TR19 |
3.03 |
2.95 |
| TR05 |
2.55 |
2.55 |
| TR03A |
3.16 |
3.05 |
| TR14D |
3.85 |
3.71 |
| TR12 |
3.21 |
3.09 |
| 10.4.2 | Comminution
Testing |
One sample originating from between
0 and 8 ft below surface and another sample from 100 ft to 150 ft below surface were subjected to a Bond ball mill grindability test
to develop a preliminary understanding of the hardness of the Coosa deposit. The results of the two tests are presented in Table 13-5.
Table
10-5: Bond Ball Mill Work Index Results - AGC-12B (0-8) and AGC-10C (100-150) Samples
| Sample |
Bond Ball Mill Work Index |
| BWi Metric (kWh/t) |
BWi Imperial (kWh/t) |
| AGC-12B (0-8) |
5.3 |
4.8 |
| AGC-10C (100-150) |
15.0 |
13.6 |
| | 10-9 | |
|
Westwater Resources, Inc. | Coosa Graphite Project
S-K 1300 Report |
December 11, 2023
SLR Project No.: 138.20527.00002 |
The near surface sample AGC-12B (0-8)
yielded a very low Bond ball mill work index (BWI) of 5.3 kWh/t. The sample originating from 100 ft to 150 ft below surface produced
a substantially higher BWI of 15.0 kWh/t, which is comparable with many base metal ores.
| 10.4.3 | Cleaner
Flotation Tests on AGC-12A and AGC-09CSampIes |
The AGC-09C sample from a depth between
300 ft and 350 ft and the near surface sample AGC-12A from a depth between 0 and 8 ft were the first samples to be subjected to more
than a single scoping level cleaner flotation test. Five tests were completed with the two samples to evaluate the impact of polishing
time on the cleaner performance and combined concentrate product quality.
The grinding time in the polishing mill
treating the pre-cleaner concentrate was varied between eight minutes and 25 minutes. All other flotation conditions were kept the same.
The total carbon grade versus recovery curves for the five tests are provided in Figure 10-7.
The low rougher carbon recovery of the
AGC-09C sample is believed to be linked to the fact that this material was much harder compared to all other samples tested to date and
the grind time of three minutes proved insufficient to achieve a satisfactory liberation prior to rougher flotation. The cleaner stage-recovery
for the AGC-09C sample was very high in all three tests, suggesting that the graphite originating from deeper levels within the deposit
displays superior flotation kinetics.
Figure
10-7: Total Carbon Grade versus Recovery Curves - AGC-09C and AGC-12A Samples

Source: AGP, 2015
| | 10-10 | |
|
Westwater Resources, Inc. | Coosa Graphite Project
S-K 1300 Report |
December 11, 2023
SLR Project No.: 138.20527.00002 |
The mass recoveries into the different
size fractions in the final concentrates and the corresponding carbon grades are presented in Figure 10-8 and Figure 10-9, respectively.
The impact of polishing time on the
flake size distribution is evidenced in Figure 10-8. As the polishing time is increased, the mass recovery into the coarser flake size
category is reduced. The increase from 15 to 25 minutes was most pronounced. Both samples displayed a similar response to the changes
in polishing times.
As the polishing time increased, the
concentrate grades improved for all size fractions with the exception of the -48/+65 mesh product for the AGC-12A sample. With longer
polishing times, the probability of removing impurities attached to the graphite flakes increases. These results were expected and are
consistent with other graphite deposits.
Figure
10-8: Mass Recovery into Size Fractions - AGC-09C and AGC-12A Samples

Source: AGP, 2015
| | 10-11 | |
|
Westwater Resources, Inc. | Coosa Graphite Project
S-K 1300 Report |
December 11, 2023
SLR Project No.: 138.20527.00002 |
Figure
10-9: Carbon Grades of Concentrate Size Fractions - AGC-09C and AGC-12A Samples
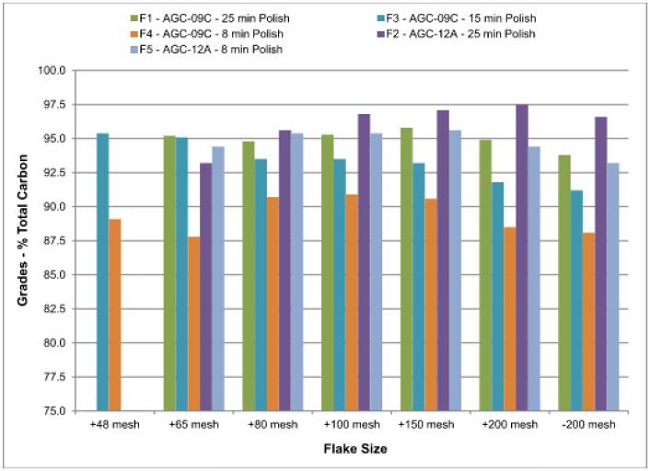
Source: AGP, 2015
| 10.4.4 | Cleaner
Flotation Tests on Eight Trench Samples |
Eight trench samples were subjected
to batch cleaner tests using the same conditions to facilitate a direct comparison of the metallurgical response of the eight samples.
A grind time for the flash tailings of three minutes, a pre-cleaner, and a polishing time of 15 minutes were chosen for these tests based
on the experience from the previous tests conducted on Coosa samples.
The total carbon grade recovery curves
for the eight tests are presented in Figure 10-10. The combined flash and rougher carbon recovery ranged between 87.8% for the TR-01A
sample and 98.1% for the TR14D sample. The rougher P80 ranged between 195 microns for the TR05 sample and 313 microns for
the TR03A sample and did not appear to have an immediate impact on the flash and rougher carbon recovery.
The pre-cleaner losses were much higher
in all eight tests compared to previous cleaner tests and ranged between 5.8% for the TR14D sample and 15.2% for the TR08 sample. It
was concluded that this was not a function of the samples, but rather the pre-cleaner flotation conditions. It is postulated that these
elevated pre-cleaner tailings losses can be reduced substantially with higher reagent dosages and longer flotation times.
| | 10-12 | |
|
Westwater Resources, Inc. | Coosa Graphite Project
S-K 1300 Report |
December 11, 2023
SLR Project No.: 138.20527.00002 |
Figure
10-10: Total Carbon Grade versus Recovery Curves - Trench Samples

Source: AGP, 2015
The mass recoveries into the different
size fractions in the final concentrates and the corresponding carbon grades are presented in Figure 10-11 and Figure 10-12. The flake
size distribution varied noticeably for the eight samples. The mass recovery into the plus 80 mesh size fractions ranged between 9.2%
for the TR08 sample and 33.9% for the TR19 sample.
With regard to concentrate grades, the
TR03A sample produced the best results with a combined concentrate grade of 94.1% total carbon using the reconciled size fraction analysis
results. The TR01, TR14D, and TR19 samples yielded the lowest combined concentrate grades between 83.2% and 86.8% total carbon in the
size fraction analysis.
| | 10-13 | |
|
Westwater Resources, Inc. | Coosa Graphite Project
S-K 1300 Report |
December 11, 2023
SLR Project No.: 138.20527.00002 |
Figure
10-11: Mass Recovery into Size Fractions - Trench Samples

Source: AGP, 2015
| | 10-14 | |
|
Westwater Resources, Inc. | Coosa Graphite Project
S-K 1300 Report |
December 11, 2023
SLR Project No.: 138.20527.00002 |
Figure
10-12: Carbon Grades of Concentrate Size Fractions - Trench Samples

Source: AGP, 2015
| 10.5 | 2015
Metallurgical Test Work |
A full flowsheet development program
was initiated by AGC at SGS Lakefield in August 2015 and the program was completed within one month.
| 10.5.1 | Sample
Preparation and Head Characterization |
Six samples from the Coosa mineralization
were shipped to SGS Lakefield in August 2015. The six samples were collected from three sections of the deposit named Coosa, Roscoe
Ridge, and Holy Schist zones, two samples per section.
Each sample was stage crushed to -6
mesh and homogenized before subsamples were extracted for chemical analysis and a Master composite. The Master composite was generated
by extracting 10 kg from each of the individual samples. The six samples and one composite were split into test charges for flotation
testing.
A summary of chemical analysis results
is presented in Table 10-6. The head grades ranged between 2.73% Cg in the Coosa Transition sample and 3.85% Cg in the Roscoe Ridge #2
sample. The concentration of sulfur was generally low at 0.04% or less except for the Coosa Transition sample at 1.46% S, which caused
the elevated value in the Master composite.
| | 10-15 | |
|
Westwater Resources, Inc. | Coosa Graphite Project
S-K 1300 Report |
December 11, 2023
SLR Project No.: 138.20527.00002 |
Table
10-6: Carbon Speciation and Sulphur Analysis of Flowsheet Development Samples and Composite
| Comp ID |
Assays, % |
| Ct |
Cg |
TOC |
CO3 |
S |
| Master Comp Aug 15 |
3.32 |
3.24 |
< 0.05 |
1.00 |
0.23 |
| Roscoe Ridge #1 |
3.22 |
3.09 |
< 0.05 |
0.20 |
0.04 |
| Roscoe Ridge #2 |
3.85 |
3.85 |
< 0.05 |
1.35 |
0.02 |
| Coosa Oxide |
3.27 |
3.12 |
< 0.05 |
1.05 |
0.01 |
| Coosa Transition |
2.81 |
2.73 |
< 0.05 |
2.65 |
1.46 |
| Holy Schist #1 |
3.35 |
3.22 |
< 0.05 |
0.10 |
0.03 |
| Holy Schist #2 |
3.32 |
3.27 |
< 0.05 |
0.30 |
0.02 |
| 10.5.2 | Rougher
Flotation Testing |
A total of three rougher kinetics tests
were carried out to establish the grind size requirements to achieve a satisfactory graphite recovery. Each test consisted of a flash
flotation stage treating the -6 mesh test charges followed by grinding of the flash flotation tailings and performing rougher flotation
on the ground mill product. The grind times were varied between 1.5 minutes in test F1 and five minutes in test F3. The results of the
three tests are summarized in Figure 10-13 , which shows the relationship between the total carbon recovery from the combined flash and
rougher concentrates, and the particle size distribution of the rougher tailings. Test F1 with a rougher tailings P80 of 328
microns yielded a very high total carbon recovery of 99.1%, thus suggesting that a grind size of P80 = 325 microns should
be targeted.
| | 10-16 | |
|
Westwater Resources, Inc. | Coosa Graphite Project
S-K 1300 Report |
December 11, 2023
SLR Project No.: 138.20527.00002 |
Figure
10-13: Total Carbon Recovery as a Function of Grind Size
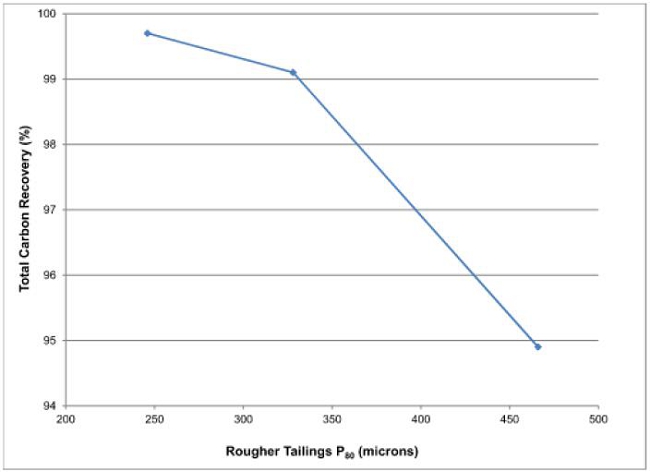
Source: AGP, 2015
| 10.5.3 | Cleaner
Flotation Testing |
A total of ten open circuit cleaner
tests were carried out on the Master composite to develop the full cleaning circuit flowsheet.
The first four cleaner tests evaluated
the impact of primary polishing of the combined flash and rougher concentrate using ceramic media. Since some samples in the scoping
level test programs produced a significant amount of entrained gangue minerals in the combined flash and rougher concentrate, a pre-cleaner
flotation stage was incorporated prior to the polishing mill. The polishing times were varied between 10 minutes in test F5 and 28 minutes
in test F7.
The total carbon recovery did not appear
to be affected by the polishing times and ranged between 94.7% for a polishing time of 22 minutes and 95.9% for a polishing time of 28
minutes. Although test F4 with polishing time of 15 minutes yielded a recovery into the final concentrate of only 89.4%, the source of
the elevated losses was the flash and rougher stage rather than the cleaning circuit. The graphitic carbon losses into the rougher tailings
of this test were 7.1% compared to only 2.1% to 2.7% in the other three tests. The reason for the elevated carbon losses is not understood
as the flash and rougher conditions were identical in all four tests.
| | 10-17 | |
|
Westwater Resources, Inc. | Coosa Graphite Project
S-K 1300 Report |
December 11, 2023
SLR Project No.: 138.20527.00002 |
In order to evaluate the impact of the
different polishing times on the cleaner performance, the 3rd cleaner concentrates of the four tests were subjected to a size fraction
analysis. The mass recovery into the various size fractions and corresponding total carbon grades are depicted in Figure 10-14 and Figure
10-15, respectively. As expected, the flake size distribution gradually became finer as the polishing time was increased. The test with
the shortest polishing time was a slight outlier with regard to mass recovery into the size fractions, but fell in line with regard to
total carbon grades of the various size fractions.
The total carbon grades of the size
fractions improved with longer polishing times. However, all size fractions, with the exception of the +48 mesh size fraction of the
test using the longest polishing time of 28 minutes, failed to reach the minimum grade target of 95.0% total carbon. These results reveal
the necessity of a secondary cleaning circuit to achieve acceptable concentrate grades. These secondary cleaning circuits are generally
required for graphite ores with the exception of very few deposits. Since the impact of the polishing time on the flake size distribution
was relatively small and the improvement of concentrate grades in the finer size fractions was pronounced, a decision was made to proceed
with a primary polishing time of 30 minutes in the remaining cleaner tests.
Figure
10-14: Mass Recovery into Size Fractions - Cleaner Tests F4 to F7
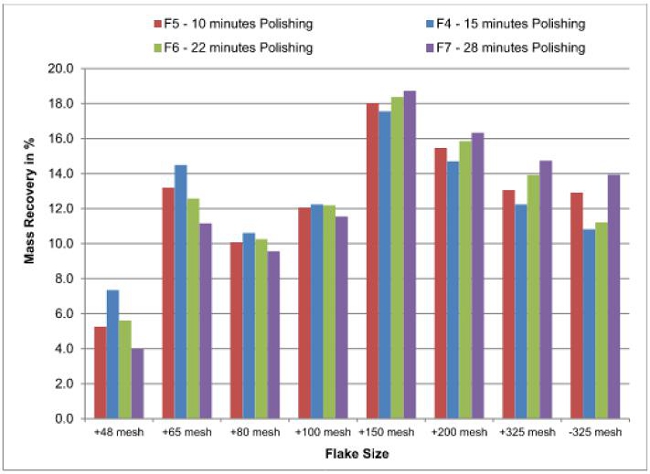
Source: AGP, 2015
| | 10-18 | |
|
Westwater Resources, Inc. | Coosa Graphite Project
S-K 1300 Report |
December 11, 2023
SLR Project No.: 138.20527.00002 |
Figure
10-15: Total Carbon Grades of Size Fractions - Cleaner Tests F4 to F7

Source: AGP, 2015
While the flake sizes larger than 100
mesh (150 microns) yielded grades of 92.6% total carbon in the test with the longest polishing time of 28 minutes, the finer size fractions
fell significantly short of the minimum grade target of 95% total carbon. Hence, a decision was made to classify the intermediate concentrate
at 100 mesh and process the screen oversize and undersize in separate cleaning circuits. This approach is commonly taken for graphite
projects if liberation properties are a function of the flake size. The screen oversize was subjected to conventional polishing grinding
with ceramic media, while the screen undersize was also treated with alternative grinding technologies with different liberation mechanisms.
Four batch cleaner flotation tests were
conducted to evaluate the best configuration of the secondary cleaning circuit. In addition to the conventional polishing with ceramic
media, the minus 100 mesh material was processed in a pebble mill with 6 mm steel media and an attrition scrubber with 2 mm ceramic media.
The two concentrates of each test were
submitted for a size fraction analysis. The mass recovery into the various size fractions and corresponding total carbon grades are depicted
in Figure 10-16 and Figure 10-17, respectively. The mass recovery into the plus 100 mesh size fractions only changed marginally as the
polishing time was increased from 10 minutes in test F8 to 25 minutes in test F11. Since the differences in mass recovery into the four
size fractions were small and did not reveal a trend, it is concluded that they are mainly test-to-test variances and that the polishing
time did not have an impact on the mass recovery into the coarser size fractions. The average grade improvement as a result of the secondary
cleaning circuit for the plus 100 mesh material was 1.5% from 93.9% total carbon to 95.4% total carbon.
| | 10-19 | |
|
Westwater Resources, Inc. | Coosa Graphite Project
S-K 1300 Report |
December 11, 2023
SLR Project No.: 138.20527.00002 |
The concentrate grades of the plus 100
mesh size fractions trended to lower grades as the polishing time was increased. While this differs with expectations, it is postulated
that some of the impurities that were initially liberated from the flakes were activated by graphite smearing during the longer polishing
times. Hence, a short polishing grind of 10 minutes was established for the secondary cleaning circuit processing the plus 100 mesh intermediate
concentrate.
With regard to the cleaning circuit
for the minus 100 mesh product, only the test using the attrition scrubber achieved the minimum acceptable concentrate grade. In this
test, the minus 100 mesh product was upgraded by 10.5% from 86.2% Ct to 96.7% Ct. The other three tests employing ceramic media in a
polishing mill and steel media in a pin mill produced concentrate grades ranging between 92.5% and 93.4% total carbon. Despite the significantly
higher concentrate grade obtained in the test with the attrition scrubber, the flake size distribution was the coarsest for this test
with a P80 of the combined minus 100 mesh concentrate of 109 microns compared to 103 to 105 microns for the other three tests.
Although differences in size distribution were relatively small, they are evidenced in Figure 10-17. Consequently, the attrition scrubber
was chosen as the grinding technology for the secondary cleaning circuit.
Figure
10-16: Mass Recovery into Size Fractions - Cleaner Tests F8 to F11

Source: AGP, 2015
| | 10-20 | |
|
Westwater Resources, Inc. | Coosa Graphite Project
S-K 1300 Report |
December 11, 2023
SLR Project No.: 138.20527.00002 |
Figure
10-17: Total Carbon Grades of Size Fractions - Cleaner Tests F8 to F11

Source: AGP, 2015
The last two cleaner tests employed
the optimized conditions based on the results of the cleaner tests F4 to F11. The difference between the two tests was the elimination
of the pre- cleaner in test F12 and the inclusion in test F12A. The average combined flash and rougher concentrate grade of the two tests
was 26.3% Ct at 12.2% mass recovery. The pre-cleaner stage in test F12A increased the intermediate concentrate grade to 39.9% Ct and
reduced the mass recovery to 7.8%. The carbon losses to the pre-cleaner tailings were 0.7% (0.6% to 1.0% in all eight batch cleaner tests
with pre-cleaner stage) and these losses typically occur as very small graphite particles locked with gangue minerals. A visual inspection
of the pre-cleaner tails did not identify any liberated and larger graphite flakes.
The combined concentrate grade using
the average values between direct and reconstituted grades using the size fraction analysis results yielded 97.3% total carbon in both
tests. Test F12 without the pre-cleaner stage produced a slightly higher carbon recovery of 94.2% compared to 91.9% in the test with
pre-cleaning. However, the majority of these higher losses were linked to the minus 100 mesh cleaning circuit rather than the pre-cleaning
stage, which only contributed with 0.7% to the increased losses.
Based on these results, a decision was
made to include the pre-cleaner flotation stage in the proposed flowsheet as earlier scoping level tests included samples displaying
a gangue entrainment problem that could be mitigated with the incorporation of a pre-cleaner flotation stage. While gangue entrainment
was not identified as a major concern for the flowsheet development composite, including the pre-cleaner stage provides a more robust
flowsheet. Further, the mass recovery into the primary polishing mill was reduced significantly by 37%, thus resulting in capital and
operating cost savings.
| | 10-21 | |
|
Westwater Resources, Inc. | Coosa Graphite Project
S-K 1300 Report |
December 11, 2023
SLR Project No.: 138.20527.00002 |
The flowsheet development program culminated
in the flowsheet that is depicted in Figure 10-18.
Figure
10-18: Proposed Coosa Deposit Flowsheet with Pre-cleaning

Source: AGP, 2015
| | 10-22 | |
|
Westwater Resources, Inc. | Coosa Graphite Project
S-K 1300 Report |
December 11, 2023
SLR Project No.: 138.20527.00002 |
| 10.7 | Performance
and Recovery Estimates |
The proposed flowsheet for the processing
plant consists of a conventional two stage milling circuit at P80 of 1,000 microns in the flash flotation stage and 325 microns
in the graphite rougher circuit. It is projected that Coosa mineralization will produce a flotation concentrate grading 95% Ct at 92%
recovery. This projection is based primarily on the test results of the August 2015 flowsheet development program as previous programs
were preliminary in nature.
The average grade of the last six cleaner
tests in the August 2015 program was 96.0% Ct with an open circuit carbon recovery of 93.3%. However, given the fact that these
results were obtained using a master composite consisting of a limited number of small samples from different areas within the Coosa
deposit, Westwater has elected to use more conservative projections for the IA. Further, locked cycle tests were not completed to simulate
the closed circuit performance.
The projected flake size distribution
is shown in Figure 10-19 and is based on the average values of the last batch cleaner tests of the flowsheet development program using
the optimized flotation conditions.
Figure
10-19: Projected Flake Size Distribution

Source: AGP, 2015
| | 10-23 | |
Westwater Resources, Inc. | Coosa
Graphite Project
S-K 1300 Report |
December 11,
2023
SLR Project No.:
138.20527.00002 |
| 10.8 | Qualified
Person’s Opinion |
It is the QP’s opinion that the
metallurgical testing performed in support of this Initial Assessment of the Coosa Graphite Project is sufficient to provide preliminary
design criteria for this level of study. More detailed sampling and metallurgical studies will be undertaken during subsequent stages
of Project development.
| | 10-24 | |
Westwater Resources, Inc. | Coosa
Graphite Project
S-K 1300 Report |
December 11,
2023
SLR Project No.:
138.20527.00002 |
| 11.0 | Mineral
Resource Estimates |
Mineral Resources have been classified
in accordance with the definitions for Mineral Resources in S-K 1300. Mineral Resources estimated by SLR used all drill results available
as of March 17, 2022. Graphitic carbon (Cg) material is present in two types of schist of an uncertain age ranging from Precambrian
to Paleozoic, a quartz-graphite schist that generally has grades greater than 1% Cg and a quartz-biotite-graphite-schist that has grades
generally less than 1% Cg and are often associated with disseminated pyrrhotite and minor pyrite along with the green vanadium-bearing
muscovite and roscoelite mineralization.
The Mineral Resource estimate was completed
using a conventional block modeling approach. The general workflow performed by SLR included the construction of a geological or stratigraphic
model representing the Higgins Ferry Group Graphitic Schist sequence in Seequent’s Leapfrog Geo (Leapfrog Geo) from mapping, drill
hole logging, and sampling data, which was used to define discrete domains and surfaces representing the upper contact of each unit.
The geologic model was then used to constrain resource estimation. The resource estimate used regularized block models, the inverse distance
squared (ID2) methodology, and length-weighted, 10 ft, uncapped composites to estimate the Cg and V in a three-search pass
approach, using hard boundaries between subunits, ellipsoidal search ranges, and search ellipse orientation informed by geology. Average
density values were assigned by lithological unit.
Estimates were validated using standard
industry techniques including statistical comparisons with composite samples and parallel nearest neighbor (NN) estimates, swath plots,
and visual reviews in cross-section and plan. A visual review comparing blocks to drill holes was completed after the block modeling
work was performed to ensure general lithologic and analytical conformance and was peer reviewed prior to finalization.
Table 11-1 summarizes Cg Mineral Resources
at a 1.98% Cg cut-off grade envisaging an open pit mining scenario. At the effective date of November 30, 2022, Indicated Mineral
Resources total 26.0 Mst at an average grade of 2.89% Cg for a total of 754,000 st Cg. Inferred Mineral Resources total 97.0 Mst at an
average grade of 3.08% Cg for a total of 3.0 Mst Cg. There has been no additional drilling since November 30, 2022 and the Mineral
Resource estimate remains current.
| Table 11-1: |
Summary of Carbon Graphite Mineral Resources – Effective November 30, 2022 |
| Classification |
Tonnage
(Mst) |
Grade Cg
(%) |
Contained Cg
(Mlb) |
Contained Cg
(000 st) |
Recovery
(%) |
| Indicated |
26 |
2.89 |
1,509 |
754 |
87.4 |
| Inferred |
97 |
3.08 |
5,996 |
2,998 |
87.4 |
Notes:
| 1. | The
S-K 1300 definitions were followed for Mineral Resources. |
| | | |
| 2. | Mineral
Resources are constrained within a Whittle pit shell using a cut-off grade of 1.98% Cg. |
| | | |
| 3. | Mineral
Resources are estimated using a long-term graphite price of US$1,100/st. |
| | | |
| 4. | Bulk
density ranges from 1.68 t/m3 to 3.03 t/m3 (0.05 st/ft3
to 0.09 st/ft3). |
| | | |
| 5. | Mining
dilution equals 5.0%. |
| | 11-1 | |
Westwater Resources, Inc. | Coosa
Graphite Project
S-K 1300 Report |
December 11,
2023
SLR Project No.:
138.20527.00002 |
| 6. | Mineral
Resources that are not Mineral Reserves do not have demonstrated economic viability. |
| | | |
| 7. | Numbers
may not add due to rounding. |
| | | |
| 8. | Mineral
Resources are 100% attributable to Westwater. |
To ensure that all Mineral Resource
statements satisfy the “reasonable prospects for economic extraction” (RPEE) requirement, factors significant to technical
feasibility and potential economic viability were considered. Mineral Resources were defined and constrained within an open pit shell
that was prepared by SLR and based on a US$1,100/st graphite value.
The SLR QP is of the opinion that with
consideration of the recommendations summarized in Sections 1 and 23 of this TRS, any issues relating to all relevant technical and economic
factors likely to influence the prospect of economic extraction can be resolved with further work. There are no other known legal, social,
or other factors that would affect the development of the Mineral Resources.
While the estimate of Mineral Resources
is based on the QP's judgment that there are reasonable prospects for eventual economic extraction, no assurance can be given that Mineral
Resources will eventually convert to Mineral Reserves.
Westwater maintains a property wide
drill hole database in a series of MS Excel spreadsheets. The Coosa resource database, dated March 17, 2022, includes drill hole
collar locations (including dip and azimuth), assay, alteration, geochemical, and lithology data from 236 drill holes totaling 45,715
ft (13,934 m) of drilling completed from 2012 through spring of 2022. The database contains information from diamond drilling (DD), sonic
drilling, and trenches. Of the 236 drill holes completed, 205 drill holes totaling 39,434 ft (12,019 m) were used in the resource estimation.
The remaining 31 holes totaling 6,281 ft (1,914 m) are exploration holes drilled in the HS-North area (13) or are isolated single holes
(18) outside the Coosa block model boundaries and were excluded from the resource estimation. A summary of the drill hole database used
for resource estimation is provided in Table 11-2.
| Table 11-2: |
Resource Drill Hole Database |
| Attribute |
Number of Records |
Total Length (ft) |
| DD |
181 |
33,117 |
| Sonic |
24 |
1,303 |
| Trench |
31 |
11,295 |
| Survey |
722 |
|
| Lithology |
7,136 |
|
| Geotechnical |
3,683 |
|
| Density |
396 |
|
| Assay Cg |
8,772 |
|
| Assay V |
1,070 |
|
Geological logs for holes and trenches
were used to aid interpretation of mineralized domains. The drill hole database includes both vertical and inclined holes ranging from
45o to 70° to the southeast, approximately perpendicular to the general mineralization and lithological trends.
| | 11-2 | |
Westwater Resources, Inc. | Coosa
Graphite Project
S-K 1300 Report |
December 11,
2023
SLR Project No.:
138.20527.00002 |
Drilling holes completed
by AGC generally were downhole surveyed with a single shot Reflex EZ Shot tool. Angled fence holes were surveyed at a midway depth of
250 ft (76.2 m) and again at the end of the hole (approximately 500 ft/152.4 m) while the vertical grid holes were only surveyed at the
end. Westwater did not conduct any downhole surveys due to the shallow depth of drilling (generally less than 100 ft (30.5 m)). The SLR
QP considers that the drill hole paths have been defined with sufficient accuracy for Mineral Resource estimation.
| 11.3 | Geological
Interpretation |
SLR geologists constructed geologic
models for the Project in Leapfrog Geo software using topographic surfaces and drill hole lithology logs and cross sections supplied
by Westwater. The four main mineralized geologic units modelled include QGS, INT, QMBGS, and QBGS. The SLR QP reviewed the sectional
interpretations in section and on plan and is of the opinion that the cross sections reasonably honor the lithologic data.
In addition, the SLR QP also constructed
geological models for the oxidized, transitional, and reduced (unweathered) zones. The geologic and weathering models at Coosa Graphite
are illustrated in Figure 11-1 and Figure 11-2. Westwater geologists completed 23 cross sections on generally 200 ft (61 m) spacing oriented
northwest-southeast across the Property. A relogging of previous drill core along with newly acquired core resulted in the identification
of 20 thrust fault planes controlling lithologic boundaries. The relogging also updated the identification of amphibolite and pegmatite
material showing interbedded lower grade mineralization within the QGS. The cross sections were digitized into Leapfrog Geo to aid in
the resource estimation.
| | 11-3 | |
Westwater Resources, Inc. | Coosa
Graphite Project
S-K 1300 Report |
December 11,
2023
SLR Project No.:
138.20527.00002 |
| Figure 11-1: |
Plan View of Coosa Geologic Model |

| | 11-4 | |
Westwater Resources, Inc. | Coosa
Graphite Project
S-K 1300 Report |
December 11,
2023
SLR Project No.:
138.20527.00002 |
| Figure 11-2: |
Plan View of Coosa Weathering Model |

| | 11-5 | |
Westwater Resources, Inc. | Coosa
Graphite Project
S-K 1300 Report |
December 11,
2023
SLR Project No.:
138.20527.00002 |
The geologic model was used to code
the drill hole database and to identify samples within the mineralized zones. These samples were extracted from the database on a group-by-group
basis, subjected to statistical analyses for their respective domains, and then analyzed by means of histograms and probability plots.
A total of 9,198 graphitic carbon and 1,594 vanadium samples were contained within the mineralized wireframes. Statistics are summarized
in Table 11-3 and the graphite grade histogram is illustrated in Figure 11-3.
| Table 11-3: |
Descriptive Statistics of Resource Assay Grades and Lengths |
| Variable |
Lithology |
Count |
Length
(ft) |
Mean
(%) |
Min
(%) |
Max
(%) |
SD
(%) |
CV |
Variance |
Graphitic Carbon
(Cg) |
AMPHIBOLITE |
7 |
261 |
0.423 |
0.210 |
1.220 |
0.248 |
0.586 |
0.061 |
| |
QAL |
104 |
601 |
1.558 |
0.000 |
5.490 |
1.228 |
0.788 |
1.509 |
| |
INT |
1,022 |
4,867 |
1.926 |
0.000 |
6.120 |
1.053 |
0.547 |
1.109 |
| |
QGS |
4,702 |
22,726 |
2.576 |
0.000 |
9.450 |
1.166 |
0.453 |
1.359 |
| |
QMBGS |
1,556 |
7,407 |
1.045 |
0.000 |
5.140 |
0.678 |
0.649 |
0.460 |
| |
QBGS |
198 |
958 |
0.308 |
0.001 |
2.000 |
0.429 |
1.393 |
0.184 |
| Total Cg |
|
9,198 |
44,657 |
2.111 |
0.000 |
9.450 |
1.237 |
0.586 |
1.531 |
| Vanadium (V) |
AMPHIBOLITE |
1 |
5 |
0.1 |
0.078 |
0.078 |
|
|
|
| |
QAL |
74 |
370 |
0.082 |
0.012 |
0.234 |
0.056 |
0.682 |
0.003 |
| |
INT |
38 |
176 |
0.069 |
0.016 |
0.211 |
0.051 |
0.741 |
0.003 |
| |
QGS |
1,409 |
6,870 |
0.093 |
0.000 |
0.425 |
0.072 |
0.766 |
0.005 |
| |
QMBGS |
65 |
310 |
0.037 |
0.006 |
0.134 |
0.024 |
0.648 |
0.001 |
| |
QBGS |
4 |
17 |
0.063 |
0.031 |
0.083 |
0.028 |
0.444 |
0.001 |
| Total V |
|
1,594 |
7,753 |
0.090 |
0.000 |
0.425 |
0.070 |
0.778 |
0.005 |
| | 11-6 | |
Westwater Resources, Inc. | Coosa
Graphite Project
S-K 1300 Report |
December 11,
2023
SLR Project No.:
138.20527.00002 |
| Figure 11-3: |
Grade % Cg Histogram by Lithology |

Where the assay distribution is skewed
positively or approaches log-normal, erratic high grade assay values can have a disproportionate effect on the average grade of a deposit.
One method of treating these outliers to reduce their influence on the average grade is to cut or cap them at a specific grade level.
The SLR QP employed a number of statistical
analytical methods to determine an appropriate capping value, including preparation of frequency histograms, probability plots, decile
analyses, and capping curves. Using these methodologies, SLR examined selected capping values for the mineralized zones for the Project
and found that the assay grade distributions are reasonably uniform throughout the deposit. As a result, no capping was required for
estimating a Mineral Resource.
| | 11-7 | |
Westwater Resources, Inc. | Coosa
Graphite Project
S-K 1300 Report |
December 11,
2023
SLR Project No.:
138.20527.00002 |
Composites were created from the uncapped,
raw assay values using the downhole compositing function in the Leapfrog Geo modelling software package. The composite lengths used during
interpolation were chosen considering the predominant sampling length, the minimum mining width, style of mineralization, and continuity
of grade. Sample lengths ranged from 1.0 ft to 70.0 ft (0.31 m to 21.4 m) within the wireframe models, with 97% of the samples taken
at 5.0 ft (1.52 m) intervals (Figure 11-4). Given this distribution, and considering the width of the mineralization, SLR chose to composite
to 10.0 ft (3.1 m) lengths.
| | 11-8 | |
Westwater Resources, Inc. | Coosa
Graphite Project
S-K 1300 Report |
December 11,
2023
SLR Project No.:
138.20527.00002 |
| Figure 11-4: |
Assay Length Histogram |

Assays within the lithology domains
were composited starting at the first lithology boundary from the collar and resetting at each new lithology boundary. Residual composites
were maintained in the dataset. The composite statistics by lithology are summarized in Table 11-4.
| | 11-9 | |
Westwater Resources, Inc. | Coosa
Graphite Project
S-K 1300 Report |
December 11,
2023
SLR Project No.:
138.20527.00002 |
| Table 11-4: |
Descriptive Statistics of Composite Assay Grades and Lengths |
| Variable |
Lithology |
Count |
Length
(ft) |
Mean
(%) |
Min
(%) |
Max
(%) |
SD
(%) |
CV |
Variance |
Graphitic Carbon
(Cg) |
AMPHIBOLITE |
31 |
261 |
0.423 |
0.210 |
1.220 |
0.222 |
0.526 |
0.049 |
| |
QAL |
113 |
601 |
1.558 |
0.000 |
5.490 |
1.188 |
0.762 |
1.412 |
| |
QGS |
5,005 |
22,740 |
2.576 |
0.000 |
7.180 |
1.069 |
0.415 |
1.142 |
| |
INT |
1,066 |
4,867 |
1.926 |
0.000 |
4.808 |
0.955 |
0.496 |
0.912 |
| |
QMBGS |
1,639 |
7,410 |
1.045 |
0.000 |
3.790 |
0.618 |
0.591 |
0.382 |
| |
QBGS |
238 |
958 |
0.308 |
0.001 |
1.800 |
0.391 |
1.269 |
0.153 |
| Total Cg |
|
8,092 |
36,836 |
2.091 |
0.000 |
7.180 |
1.185 |
0.567 |
1.405 |
| Vanadium (V) |
AMPHIBOLITE |
1 |
5 |
0.078 |
0.078 |
0.078 |
|
|
|
| |
QAL |
74 |
370 |
0.082 |
0.012 |
0.218 |
0.055 |
0.669 |
0.003 |
| |
QGS |
1,501 |
7,182 |
0.094 |
0.002 |
0.335 |
0.069 |
0.735 |
0.005 |
| |
INT |
38 |
176 |
0.069 |
0.024 |
0.178 |
0.048 |
0.694 |
0.002 |
| |
QMBGS |
69 |
325 |
0.037 |
0.010 |
0.134 |
0.021 |
0.567 |
0.000 |
| |
QBGS |
5 |
17 |
0.063 |
0.057 |
0.073 |
0.009 |
0.136 |
0.000 |
| Total V |
|
1,688 |
8,075 |
0.090 |
0.002 |
0.335 |
0.067 |
0.748 |
0.005 |
SLR generated downhole and directional
variograms using the Cg composite values located within the QGS mineralized domain within the Main Grid area. The variograms were used
to support search ellipsoid anisotropy, linear trends observed in the data, and Mineral Resource classification decisions. The downhole
variograms suggest a relative low nugget effect of approximately 0.13%. Long range directional variograms were focused in the primary
plane of mineralization, which generally strikes N30oE and is dipping 25o to the southeast.
Most of the variance occurs within the
first 200 ft (61 m) and is not represented by many sample pairs with the current drill hole spacing.
| | 11-10 | |
Westwater Resources, Inc. | Coosa
Graphite Project
S-K 1300 Report |
December 11,
2023
SLR Project No.:
138.20527.00002 |
| Figure 11-5: |
Variograms for QGS Main Grid |

A total of 396 bulk density measurements
were available within the resource density sample database. Density reported as a tonnage factor, ft3/st, were not modified
by capping. Block density values were assigned based on rock type and redox boundary categories (Table 8-1).
| | 11-11 | |
Westwater Resources, Inc. | Coosa
Graphite Project
S-K 1300 Report |
December 11,
2023
SLR Project No.:
138.20527.00002 |
A regularized whole block approach was
used whereby the block was assigned to the domain where its centroid was located. The block model was constructed using Leapfrog Edge
version 2022.1 software oriented with an azimuth of 30o, dip of 0.0°, and a plunge of 0.0° to align with the overall
strike of the mineralization with a parent cell size of 40 ft by 40 ft (12.2 m by 12.2 m) in the X (along strike) and Y (across strike)
directions and 20 ft (6.1 m) in the Z (vertical or bench height) direction, honoring modeled geological surfaces.
The model fully enclosed the modeled
lithologic wireframes, with the model origin (lower-left corner at lowest elevation) at State Plane 1927 - Alabama East FIPS 0101 (US
feet) coordinates 321,000 E, 876,000 N, and 200 fasl (61 masl). A summary of the block model extents is provided in Table 11-5.
| Table 11-5: |
Block Model Definition |
| |
X |
Y |
Z |
| Base Point |
321,000 |
876,000 |
800 |
| Block Size (m) |
40 |
40 |
20 |
| Number of Blocks |
205 |
193 |
30 |
| Boundary Size (m) |
8,200 |
7,720 |
600 |
| Rotation (°) |
30 |
|
|
| 11.9 | Search
Strategy and Grade Interpolation Parameters |
The key element variables, C_graph and
V_final, were interpolated using the ID2 methodology. Estimation of grades was controlled by mineralized geologic zones and
target area boundaries. Hard boundaries were used to limit the use of composites between different mineralization domains for both graphite
and vanadium interpolation.
The interpolation strategy involved
setting up search parameters in three nested estimation runs. Most search ellipse dimensions were 100 ft x 100 ft x 25 ft (30.5 x 30.5
m x 7.6 m) for a 4:4:1 anisotropic ratio in the first pass, 250 ft x 250 ft x 25 ft (76.2 m x 76.2 m x 7.6 m) for a 10:10:1 anisotropic
ratio in the second, and 500 ft x 500 ft x 25 ft (152.4 m x 152.4 m x 7.6 m) for a 20:20:1 anisotropic ratio for the third pass. Interpolation
parameters for the Project Mineral Resource domains are listed in Table 11-6.
| Table 11-6: |
Interpolation Parameters |
| Parameter |
Pass 1 |
Pass 2 |
Pass 3 |
| Search Ranges: X, Y, Z (ft) |
100, 100,25 |
250, 250, 25 |
500, 500, 25 |
| Min number composites |
2 |
4 |
8 |
| Max number composites |
6 |
10 |
12 |
| Max composites per hole |
2 |
2 |
2 |
| Orientation of the search |
Variable |
Variable |
Variable |
| | 11-12 | |
Westwater Resources, Inc. | Coosa
Graphite Project
S-K 1300 Report |
December 11,
2023
SLR Project No.:
138.20527.00002 |
| 11.10 | Cut-off
Grade and Whittle Parameters |
Metal prices used for reserves are based
on consensus, long term forecasts from banks, financial institutions, and other sources. For resources, metal prices used are slightly
higher than those for reserves.
The Coosa Mineral Resource was constrained
to a Whittle optimized pit shell to demonstrate RPEE. The block model was exported from Leapfrog Edge into Vulcan by SLR engineers and
then imported into Whittle. Input parameters for the Whittle pit optimization are provided in Table 11-7 and were based on available
graphite project costs ($1,190/t at +80 mesh, 94% to 95% C) provided by Westwater based on the August 2022 Benchmark Mineral Intelligence
Graphite Price Assessment. Applying these factors resulted in a COG of 1.98% Cg.
| Table 11-7: |
Resource Pit Parameters |
| Parameter |
Unit |
Value |
| Graphite Price |
$/st |
1,100 |
| Graphite Sales, Insurance, Legal and Social |
|
0.00 |
| Royalties |
|
0.00 |
| Total Selling Cost |
|
0.00 |
| |
|
|
| Processing Graphite Recovery |
% |
87.4% |
| Payable Graphite |
% |
100% |
| |
|
|
| Mining Dilution |
% |
1.05 |
| Mining Cost |
$/st |
7.00 |
| Processing Cost |
$/st |
8.9 |
| Rehandling Cost |
$/st |
0.00 |
| Operational Support (G&A) |
$/st |
2.26 |
| Total |
$/st |
18.60 |
| Graphite Cut-off Grade |
% |
1.98% |
Definitions for resource categories
used in this TRS are those defined by SEC in S-K 1300. Mineral Resources are classified into Measured, Indicated, and Inferred categories.
A Mineral Resource is defined as a concentration
or occurrence of material of economic interest in or on the Earth’s crust in such form, grade or quality, and quantity that there
are reasonable prospects for economic extraction. A mineral resource is a reasonable estimate of mineralization, considering relevant
factors such as cut-off grade, likely mining dimensions, location, or continuity, that with the assumed and justifiable technical and
economic conditions, is likely to, in whole or in part, become economically extractable. It is not merely an inventory of all mineralization
drilled or sampled.
Based on this definition of Mineral
Resources, the Mineral Resources estimated in this TRS have been classified according to the definitions below based on geology, grade
continuity, and drill hole spacing.
| | 11-13 | |
Westwater Resources, Inc. | Coosa
Graphite Project
S-K 1300 Report |
December 11,
2023
SLR Project No.:
138.20527.00002 |
Measured Mineral Resource is
that part of a mineral resource for which quantity and grade or quality are estimated on the basis of conclusive geological evidence
and sampling. The level of geological certainty associated with a measured mineral resource is sufficient to allow a qualified person
to apply modifying factors, as defined in this section, in sufficient detail to support detailed mine planning and final evaluation of
the economic viability of the deposit. Because a measured mineral resource has a higher level of confidence than the level of confidence
of either an indicated mineral resource or an inferred mineral resource, a measured mineral resource may be converted to a proven mineral
reserve or to a probable mineral reserve.
Indicated Mineral Resource is
that part of a mineral resource for which quantity and grade or quality are estimated on the basis of adequate geological evidence and
sampling. The level of geological certainty associated with an indicated mineral resource is sufficient to allow a qualified person to
apply modifying factors in sufficient detail to support mine planning and evaluation of the economic viability of the deposit. Because
an indicated mineral resource has a lower level of confidence than the level of confidence of a measured mineral resource, an indicated
mineral resource may only be converted to a probable mineral reserve.
Inferred Mineral Resource is
that part of a mineral resource for which quantity and grade or quality are estimated on the basis of limited geological evidence and
sampling. The level of geological uncertainty associated with an inferred mineral resource is too high to apply relevant technical and
economic factors likely to influence the prospects of economic extraction in a manner useful for evaluation of economic viability. Because
an inferred mineral resource has the lowest level of geological confidence of all mineral resources, which prevents the application of
the modifying factors in a manner useful for evaluation of economic viability, an inferred mineral resource may not be considered when
assessing the economic viability of a mining project and may not be converted to a mineral reserve.
The SLR QP has considered the following
factors that can affect the uncertainty associated with each classification of Mineral Resources: reliability of sampling data, confidence
in interpretation and modelling of geological and estimation domains, and confidence in block grade estimates. The SLR QP offers the
following conclusions related to each of these factors:
| · | Reliability
of sampling data: |
| o | Drilling,
sampling, sample preparation, and assay procedures follow industry standards. |
| o | Data
verification and validation work confirm drill hole sample databases are reliable. |
| o | No
significant biases were observed in the QA/QC analysis results. |
| · | Confidence
in interpretation and modeling of geological and estimation domains: |
| o | Mineralization
domains are interpreted manually in cross-sections and refined in longitudinal sections by
an experienced resource geologist. |
| o | There
is good agreement between the drill holes and mineralization wireframe shapes. |
| o | The
mineralization wireframe shapes are well defined by sample data in areas classified as Indicated. |
| · | Confidence
in block grade estimates: |
| | 11-14 | |
Westwater Resources, Inc. | Coosa
Graphite Project
S-K 1300 Report |
December 11,
2023
SLR Project No.:
138.20527.00002 |
| o | Indicated
block grades correlate well, spatially and statistically, with composite data, both locally
and globally. |
Blocks were classified as Indicated
or Inferred based on drill hole spacing, confidence in the geological interpretation, and apparent continuity of mineralization. All
blocks supported by drill hole spacings up to 200 ft were classified as Indicated. All remaining blocks were assigned an Inferred category.
SLR recommends drilling additional holes down dip and reviewing the classification criteria as more data become available.
| 11.12 | Block
Model Validation |
Blocks were validated using industry
standard techniques including:
| · | Swath
plots (Figure 11-6 to Figure 11-8). |
| · | Visual
inspection of assays and composites versus block grades (Figure 11-9). |
| · | Statistical
comparison (Table 11-8). |
SLR found grade continuity to be reasonable
and confirmed that the block grades were reasonably consistent with local drill hole composite grades.
The block model grades and nearest neighbor
(NN) grades were compared by swath plots, examples of which are shown in Figure 11-6 to Figure 11-8. The swath plots show that there
is good spatial correlation between the NN grades and block model grades, with both being slightly lower than the composite grade, indicating
the block model results may be slightly conservative and underestimating the resource. SLR is of the opinion that this correlation could
improve with additional deeper drilling across the property.
| | 11-15 | |
Westwater Resources, Inc. | Coosa
Graphite Project
S-K 1300 Report |
December 11,
2023
SLR Project No.:
138.20527.00002 |
| Figure 11-6: |
QGS Swath Plot in X Direction |

| | 11-16 | |
Westwater Resources, Inc. | Coosa
Graphite Project
S-K 1300 Report |
December 11,
2023
SLR Project No.:
138.20527.00002 |
| Figure 11-7: |
QGS Swath Plot in Y Direction |

| | 11-17 | |
Westwater Resources, Inc. | Coosa
Graphite Project
S-K 1300 Report |
December 11,
2023
SLR Project No.:
138.20527.00002 |
| Figure 11-8: |
QGS Swath Plot in Z Direction |

Block grades were visually compared
with drill hole composites on cross-sections, longitudinal sections, and plan views. The block grades and composite grades correlate
very well visually, as presented in Figure 11-9.
| | 11-18 | |
Westwater Resources, Inc. | Coosa
Graphite Project
S-K 1300 Report |
December 11,
2023
SLR Project No.:
138.20527.00002 |
| Figure 11-9: |
Cross Section Showing Block Grades and Composite Grades |

| | 11-19 | |
Westwater Resources, Inc. | Coosa
Graphite Project
S-K 1300 Report |
December 11,
2023
SLR Project No.:
138.20527.00002 |
| 11.12.3 | Statistical
Comparison |
Statistics of the block grades are compared
with statistics of composite grades in Table 11-8 for all blocks and composites within the Coosa Project.
| Table 11-8: |
Comparison of Block and Composite Graphite and Vanadium Grades |
| Graphitic Carbon (Cg) |
|
Vanadium (V) |
| Lithology |
QAL |
QGS |
INT |
QMBGS |
QBGS |
|
Lithology |
QAL |
QGS |
INT |
QMBGS |
QBGS |
| Composites |
|
Composites |
| Count |
113 |
4,897 |
1,066 |
1,639 |
238 |
|
Count |
74 |
1,498 |
38 |
69 |
5 |
| Mean (%) |
1.558 |
2.578 |
1.926 |
1.045 |
0.308 |
|
Mean (%) |
0.082 |
0.094 |
0.069 |
0.037 |
0.063 |
| Min (%) |
0.000 |
0.000 |
0.000 |
0.000 |
0.001 |
|
Min (%) |
0.012 |
0.002 |
0.024 |
0.010 |
0.057 |
| Max (%) |
5.490 |
7.180 |
4.808 |
3.790 |
1.800 |
|
Max (%) |
0.218 |
0.335 |
0.178 |
0.134 |
0.073 |
| SD (%) |
1.188 |
1.074 |
0.955 |
0.618 |
0.391 |
|
SD (%) |
0.055 |
0.069 |
0.048 |
0.021 |
0.009 |
| CV |
0.762 |
0.416 |
0.496 |
0.591 |
1.269 |
|
CV |
0.669 |
0.734 |
0.694 |
0.567 |
0.136 |
| Block Model |
|
Block Model |
| Block Count |
1,145 |
82,782 |
12,484 |
32,231 |
2,745 |
|
Block Count |
1,980 |
119,522 |
18,929 |
60,074 |
32,157 |
| Mean (%) |
1.897 |
2.536 |
1.701 |
1.009 |
0.618 |
|
Mean (%) |
0.046 |
0.040 |
0.003 |
0.002 |
0.000 |
| Min (%) |
0.000 |
0.000 |
0.000 |
0.000 |
0.013 |
|
Min (%) |
0.000 |
0.000 |
0.000 |
0.000 |
0.000 |
| Max (%) |
7.057 |
7.057 |
4.704 |
6.419 |
3.533 |
|
Max (%) |
0.330 |
0.335 |
0.221 |
0.276 |
0.112 |
| SD |
1.149 |
0.870 |
0.694 |
0.489 |
0.527 |
|
SD |
0.066 |
0.058 |
0.013 |
0.012 |
0.003 |
| CV |
0.606 |
0.343 |
0.408 |
0.485 |
0.853 |
|
CV |
1.429 |
1.461 |
4.317 |
5.243 |
20.872 |
| 11.13 | Grade-Tonnage
Sensitivity |
Table 11-9 shows the block model sensitivity
to cut-off grade. Figure 11-10 shows the grade-tonnage curve.
| Table 11-9: |
Carbon Graphite Block Model Sensitivity to Cut-Off Grade (% Cg) |
Cut-Off Grade
(% Cg) |
Tonnage
(st) |
Grade Cg
(%) |
Contained Cg
(lb) |
Contained Cg
(st) |
| 1.00 |
181,040,740 |
2.73 |
9,887,228,559 |
4,943,614 |
| 1.10 |
179,011,390 |
2.75 |
9,844,661,240 |
4,922,331 |
| 1.20 |
177,184,923 |
2.77 |
9,802,686,996 |
4,901,343 |
| 1.30 |
174,766,080 |
2.79 |
9,742,289,491 |
4,871,145 |
| 1.40 |
172,658,435 |
2.80 |
9,685,384,716 |
4,842,692 |
| 1.50 |
169,888,299 |
2.83 |
9,604,968,559 |
4,802,484 |
| 1.60 |
167,098,614 |
2.85 |
9,518,454,093 |
4,759,227 |
| | 11-20 | |
Westwater Resources, Inc. | Coosa
Graphite Project
S-K 1300 Report |
December 11,
2023
SLR Project No.:
138.20527.00002 |
Cut-Off Grade
(% Cg) |
Tonnage
(st) |
Grade Cg
(%) |
Contained Cg
(lb) |
Contained Cg
(st) |
| 1.70 |
164,023,176 |
2.87 |
9,416,836,127 |
4,708,418 |
| 1.80 |
159,608,731 |
2.90 |
9,262,205,074 |
4,631,103 |
| 1.90 |
154,596,672 |
2.94 |
9,076,474,380 |
4,538,237 |
| 2.00 |
149,883,668 |
2.97 |
8,892,469,383 |
4,446,235 |
| 2.10 |
144,491,158 |
3.00 |
8,671,330,679 |
4,335,665 |
| 2.20 |
137,809,309 |
3.04 |
8,383,956,244 |
4,191,978 |
| Figure 11-10: |
Grade Tonnage Curve for Coosa Graphite |

| | 11-21 | |
Westwater Resources, Inc. | Coosa
Graphite Project
S-K 1300 Report |
December 11,
2023
SLR Project No.:
138.20527.00002 |
| 11.14 | Mineral
Resource Reporting |
A summary of the Coosa Graphite Carbon
Graphite Mineral Resources is presented in Table 11-10.
The SLR QP is of the opinion that, with
consideration of the recommendations summarized in Section 1 and Section 23, any issues relating to all relevant technical
and economic factors likely to influence the prospect of economic extraction can be resolved with further work.
The SLR QP is not aware of any environmental,
permitting, legal, title, taxation, socio-economic, marketing, political, or other relevant factors that could materially affect the
Mineral Resource estimate.
| Table 11-10: |
Summary of Carbon Graphite Mineral Resources – Effective November 30, 2022 |
| Classification |
Redox Boundary |
Tonnage
(Mst) |
Grade Cg
(%) |
Contained Cg
(Mlb) |
Contained Cg
(000 st) |
Recovery
(%) |
| Indicated |
Oxide |
9 |
2.96 |
555 |
278 |
|
| Transition |
2 |
2.81 |
88 |
44 |
|
| Reduced |
15 |
2.85 |
866 |
433 |
|
| Total Indicated |
|
26 |
2.89 |
1,509 |
754 |
87.4 |
| Inferred |
Oxide |
15 |
3.07 |
951 |
475 |
|
| Transition |
4 |
3.13 |
254 |
127 |
|
| Reduced |
78 |
3.08 |
4,792 |
2,396 |
|
| Total Inferred |
|
97 |
3.08 |
5,996 |
2,998 |
87.4 |
Notes:
| 1. | The
S-K 1300 definitions were followed for Mineral Resources. |
| 2. | Mineral
Resources are constrained within a Whittle pit shell using a cut-off grade of 1.98% Cg. |
| 3. | Mineral
Resources are estimated using a long-term graphite price of US$1,100/st. |
| 4. | Bulk
density ranges from 1.68 t/m3 to 3.03 t/m3 (0.05 st/ft3
to 0.09 st/ft3). |
| 5. | Mining
dilution equals 5.0%. |
| 6. | Mineral
Resources that are not Mineral Reserves do not have demonstrated economic viability. |
| 7. | Numbers
may not add due to rounding. |
| 8. | Mineral
Resources are 100% attributable to Westwater. |
| | 11-22 | |
Westwater Resources, Inc. | Coosa
Graphite Project
S-K 1300 Report |
December 11,
2023
SLR Project No.:
138.20527.00002 |
| 12.0 | Mineral
Reserve Estimates |
There are no current Mineral Reserves
at the Project.
| | 12-1 | |
Westwater Resources, Inc. | Coosa
Graphite Project
S-K 1300 Report |
December 11,
2023
SLR Project No.:
138.20527.00002 |
The Coosa Project is proposed to be
operated as a conventional open pit mine with 20 ft bench heights, using drilling and blasting for rock breakage, and excavator and trucks
for material handling.
Production from the mines is planned
to be fed to the nearby processing plant with a nominal capacity of 3.33 Mstpa (approximately 3.0 Mtpa).
| 13.1 | Mine
Design, Mining Method |
The Coosa Project is divided into five
phases. The mineralized material inventory of the Coosa deposit is derived from both Indicated and Inferred Mineral Resources, above
a cut-off grade of 2.1365% Cg, contained between the current surveyed topographic surface and the generated Pit Shells.
A high-level production schedule was
developed by SLR for the Coosa deposit based on an open pit mining method. Mining is planned to be undertaken using conventional truck
and loader equipment.
The mine plan for the open pit project
has been developed with a potential maximum production of approximately 3.3 Mstpa of potential mill feed. Project production will range
between 3.1 Mstpa and 4.9 Mstpa (ore+waste) over a 22 year mine life.
| 13.2 | Geomechanics,
Ground Support |
No detailed hydrogeological or geotechnical
studies have been conducted to date. For open pit optimization purposes, an overall slope angle (OSA) of 45º has been used.
| 13.3 | Dilution
and Extraction |
The Coosa Project block model used is
a regularized block model of 40 ft * 40 ft * 20 ft constructed using Leapfrog Edge and imported into Vulcan version 2022.2 software oriented
with a bearing of 120o, dip of 0.0°, and a plunge of 0.0°. An additional 5% dilution was added during the optimization
process and a 100% mining recovery was applied.
A marginal cut-off grade of 2.1365%
Cg was calculated based on a US$806/st graphite concentrate price (Table 13-1). The marginal cut-off grade excludes mining costs, and
by-product credits for vanadium sales.
The base graphite price is $1,007/st
($1,110/tonne). With the pit shell selection described in Section 13.5, a revenue factor of 0.8 is chosen, resulting in a graphite
price of $806/st as used in the cut-off calculations in Table 13-1.
| | 13-1 | |
Westwater Resources, Inc. | Coosa
Graphite Project
S-K 1300 Report |
December 11,
2023
SLR Project No.:
138.20527.00002 |
| Table 13-1: |
Economic and Technical Parameters Used in Pit Optimization |
| Parameter |
Unit |
Value |
| Graphite Price |
$/st |
806 |
| |
|
|
| Total Selling Cost |
|
0 |
| |
|
|
| Processing Graphite Recovery |
% |
92.0% |
| Payable Graphite |
% |
100% |
| Mining Dilution |
% |
1.05 |
| |
|
|
| Processing Cost |
$/st |
12.63 |
| Rehandling Cost |
$/st |
0 |
| Operational Support (G&A) |
$/st |
2.45 |
| Total |
$/st |
15.08 |
| |
|
|
| Graphite Cut-off Grade |
% |
2.1365% |
| |
|
|
| Average Mining Cost |
$/st |
4.69 |
| |
|
|
| Overall Slope Angle (OSA) |
degrees |
45 |
Pit optimization was conducted in Whittle
software utilizing the Pseudoflow algorithm to generate a pit shell based on the mineral resource block model and a set of input economic
and technical parameters summarized in Table 13-1. The pit shell generated serves as a guidance for the pit design, which includes design
of mineable benches, with berms and ramps incorporated into the design. The pit shell generated utilizing the input parameters is shown
in Figure 13-1 along with a pit-by-pit graph in Figure 13-2.
Whittle uses the Pseudoflow algorithm
to define the blocks that can be mined at a profit and creates an economic shell (LG shell) based on the following information:
| · | Overall
slope angles by geotechnical zone; |
| · | Metallurgical
recoveries by mineralization and rock type; |
| · | Geologic
grade model with gold and silver grades, density, lithology, and mineral types; |
| · | Process
and mining costs; |
| · | Incremental
vertical bench mining costs; |
| | 13-2 | |
Westwater Resources, Inc. | Coosa
Graphite Project
S-K 1300 Report |
December 11,
2023
SLR Project No.:
138.20527.00002 |
| · | Downstream
costs, such as gold refining, royalties, freight, and marketing; |
| · | Sustaining
capital for future equipment replacement or refurbishment; |
| · | Mining
dilution and recovery. |
The primary objective of the pit optimization
process is to identify the Net Present Value (NPV) from a project by defining the limits of mining and the extraction sequence. An iterative
methodology of pit design and pit optimization incorporates and applies critical economic measures and physical constraints that affect
the ultimate economics of the project.
The pit-by-pit graph in Figure 13-2
generates the best, worst, and specified case discounted values, based on the economic inputs, and allows to make informed strategic
decisions for the Project.
| · | Best
Case: In this scenario, the pit shells are mined one after another from the innermost to
the outermost shells. This scenario is rarely possible to achieve, given the mining width
constraints of the equipment. However, it serves to outline the upper limit to the achievable
NPV. |
| · | Worst
Case: In this case, the pit shells are mined bench by bench starting at the top. This case
is feasible, and also sets the lower limit to the achievable NPV. |
| · | Specified
Case: In this scenario, a mid path is chosen between the best and worst cases, given the
mining equipment and sequence, and generates a higher NPV than the worst case. |
Considering the size of the five pit
phases, shown in Figure 13-1, with pit phases 2 to 5 being small and pit depths varying from 60 m to 112 m in each of the phases,
there is limited opportunity for dividing them further into smaller mineable cutbacks, thereby leading to the choice of the worst case
scenario.
Pit 23 at a revenue factor of 0.80 in
Figure 13-2 captures the maximum discounted cash flow achieved by the worst case mining scenario. This Pit 23 was chosen to generate
the conceptual production schedule discussed in Section 13.6. Choosing a revenue factor of 0.80 essentially means that the base
case graphite price has been scaled down, resulting in a smaller pit shell, which means that lower mineralization tonnages at higher
grades are mined, leading to an improved NPV.
Once the Project progresses to a PFS
study, further investigation of the specified case scenario is required for the generation of an updated production schedule.
Cost estimates for mining and processing
were sourced from Infomine 2021 Edition based on estimates used for similar sized projects and a two-product floatation process. These
unit rates were escalated to March 2023 costs based on the Mining Cost Service (MCS) indexes provided by Infomine April 2023
edition.
Inputs for metallurgical recovery and
general administration costs were provided by the client and escalated to March 2023 values for use in the optimization process
and economic analysis.
| | 13-3 | |
Westwater Resources, Inc. | Coosa
Graphite Project
S-K 1300 Report |
December 11,
2023
SLR Project No.:
138.20527.00002 |
| Figure 13-1: |
Whittle Optimization – Pit Shell Phases Layout |

| | 13-4 | |
Westwater Resources, Inc. | Coosa
Graphite Project
S-K 1300 Report |
December 11,
2023
SLR Project No.:
138.20527.00002 |
| Figure 13-2: |
Coosa Project Pit-by-Pit Graph |

Notes:
| 1. | The
conceptual mine plan is based on the highlighted Pit Shell 23 in the above figure. |
| 2. | The
Pit Shell 23 is evaluated in Vulcan software and scheduled using Xpac software. |
| 3. | The
numbers attributed to Pit 23 in above graph vary from the numbers reported in the Life of
Mine Plan below. |
| | 13-5 | |
Westwater Resources, Inc. | Coosa
Graphite Project
S-K 1300 Report |
December 11,
2023
SLR Project No.:
138.20527.00002 |
Pit 23 chosen above in the cleaned-up
pit phases in Figure 13-2 results in a mineralized material inventory for the Coosa Project of 72.7 Mst at a grade of 3.21% Cg.
The conceptual production schedule for
the Coosa Project shows completion of open pit mining by the end of year 22 from the start of production. The production schedule is
presented in Table 13-2.
The conceptual production schedule is
based on the engineering and economic analysis described in this TRS. Changes in the following factors and assumptions may affect the
conceptual schedule:
| · | Interpretations
of mineralization geometry and continuity of mineralization zones. |
| · | Geotechnical
assumptions. |
| · | Ability
of the mining operation to meet the annual production rate. |
| · | Operating
cost assumptions. |
| · | Mining
and processing plant recoveries. |
| · | Land
ownership for the disturbance area. |
| · | Ability
to meet and maintain permitting and environmental license conditions. |
| · | The
ability to maintain the social license to operate. |
| | 13-6 | |
Westwater Resources, Inc. | Coosa
Graphite Project
S-K 1300 Report |
December 11,
2023
SLR Project No.:
138.20527.00002 |
| Table 13-2: |
Coosa Project Conceptual Production Schedule |
Years 1 to 11
| Parameter |
Unit |
Total |
Yr-1 |
Yr-2 |
Yr-3 |
Yr-4 |
Yr-5 |
Yr-6 |
Yr-7 |
Yr-8 |
Yr-9 |
Yr-10 |
Yr-11 |
| Total Ore -CG |
000 st |
72,665 |
3,333 |
3,333 |
3,333 |
3,333 |
3,333 |
3,333 |
3,333 |
3,333 |
3,333 |
3,333 |
3,333 |
| Graphite Grade |
% |
3.21 |
3.33 |
3.35 |
3.33 |
3.36 |
3.29 |
3.21 |
3.17 |
3.09 |
3.09 |
3.10 |
3.04 |
| Contained Graphite |
000 st |
2,333 |
111 |
112 |
111 |
112 |
110 |
107 |
106 |
103 |
103 |
103 |
101 |
| Recovered Graphite |
000 st |
2,146 |
102 |
103 |
102 |
103 |
101 |
98 |
97 |
95 |
95 |
95 |
93 |
| Waste Rock |
000 st |
14,901 |
1,067 |
735 |
667 |
417 |
396 |
854 |
1,438 |
1,267 |
967 |
158 |
867 |
| Total Mined |
000 st |
87,566 |
4,400 |
4,069 |
4,000 |
3,750 |
3,730 |
4,187 |
4,772 |
4,600 |
4,300 |
3,491 |
4,200 |
| Stripping Ratio |
W:O |
0.21 |
0.32 |
0.22 |
0.20 |
0.12 |
0.12 |
0.26 |
0.43 |
0.38 |
0.29 |
0.05 |
0.26 |
Years 12 to 22
| Parameter |
Unit |
Total |
Yr-12 |
Yr-13 |
Yr-14 |
Yr-15 |
Yr-16 |
Yr-17 |
Yr-18 |
Yr-19 |
Yr-20 |
Yr-21 |
Yr-22 |
| Total Ore -CG |
000 st |
72,665 |
3,333 |
3,333 |
3,333 |
3,333 |
3,333 |
3,333 |
3,333 |
3,333 |
3,333 |
3,333 |
2,665 |
| Graphite Grade |
% |
3.21 |
3.14 |
3.09 |
3.21 |
3.27 |
3.25 |
3.22 |
3.20 |
3.23 |
3.27 |
3.23 |
3.18 |
| Contained Graphite |
000 st |
2,333 |
105 |
103 |
107 |
109 |
108 |
107 |
107 |
108 |
109 |
108 |
85 |
| Recovered Graphite |
000 st |
2,146 |
96 |
95 |
99 |
100 |
100 |
99 |
98 |
99 |
100 |
99 |
78 |
| Waste Rock |
000 st |
14,901 |
261 |
704 |
1,583 |
782 |
611 |
456 |
350 |
306 |
379 |
169 |
469 |
| Total Mined |
000 st |
87,566 |
3,594 |
4,038 |
4,917 |
4,115 |
3,945 |
3,789 |
3,684 |
3,639 |
3,712 |
3,502 |
3,133 |
| Stripping Ratio |
W:O |
0.21 |
0.08 |
0.21 |
0.48 |
0.23 |
0.18 |
0.14 |
0.11 |
0.09 |
0.11 |
0.05 |
0.18 |
| | 13-7 | |
Westwater Resources, Inc. | Coosa
Graphite Project
S-K 1300 Report |
December 11,
2023
SLR Project No.:
138.20527.00002 |
The proposed primary mine equipment
fleet consists of an all-diesel powered fleet of hydraulic shovel, front-end loader, blasthole drills, and rigid frame haul trucks. Table
13-3 summarizes the primary mine equipment fleet planned to be used in the operations.
| Table 13-3: |
Coosa Project – Primary Mine Equipment Planned |
| Primary Mine Equipment |
Capacity |
Count |
| Production Blasthole Drill |
Up to 200 mm dia. hole |
2 |
| Hydraulic Shovel |
4 yd³ to 4.5 yd³ bucket |
1 |
| Front-End Loader |
4 yd³ to 4.5 yd³ bucket |
1 |
| Rear Dump Trucks |
Payload : 50 st to 60 st |
5 |
| Dozers |
63 kW |
3 |
| Grader |
115 kW |
1 |
| | 13-8 | |
Westwater Resources, Inc. | Coosa
Graphite Project
S-K 1300 Report |
December 11,
2023
SLR Project No.:
138.20527.00002 |
| 14.0 | Processing
and Recovery Methods |
The proposed method of graphite recovery
from the Coosa deposit consists of conventional crushing and milling, followed by rougher and cleaner froth flotation. This section describes
the flowsheet, design criteria, and process description to produce 99,207 stpa (90,000 tonnes per year) of flotation concentrate product
grading 95% Cg. Note that the process plant capital cost presented in Section 18 includes this throughput.
From the test work conducted, a flowsheet
was developed consisting of two-stage crushing, rod and ball mill grinding, froth flotation, concentrate dewatering, and tailings thickening.
A schematic of the proposed flowsheet is presented in Figure 14-1.
Based on the available data, a set of
preliminary plant design criteria was developed which provides all the specific unit operation process details required for equipment
sizing and selection. A summary of some of the key criteria is presented in Table 14-1.
| | 14-1 | |
Westwater Resources, Inc. | Coosa
Graphite Project
S-K 1300 Report |
December 11,
2023
SLR Project No.:
138.20527.00002 |
| Figure 14-1: |
Flowsheet for the Coosa Processing Plant |

Source. AGP, 2015.
| | 14-2 | |
Westwater Resources, Inc. | Coosa
Graphite Project
S-K 1300 Report |
December 11,
2023
SLR Project No.:
138.20527.00002 |
| Table 14-1: |
Summary of Process Design Criteria |
| Parameter |
Design Data |
| Graphite Head Grade |
3.2% |
| Plant Throughput |
3,201 Mstpa (2,904 million tonnes per year) |
| Plant Throughput |
8,771 stpd (7,957 tonnes per day) |
| Concentrate Production (95% Cg) |
99,207 stpd (90,000 tonnes per day) |
| Crushing Circuit Availability |
86.0% |
| Grind/Float Circuit Availability |
92.0% |
| Rod Mill Feed Size, F80 |
14 mm |
| Rod Mill Transfer Size, T100 |
1.68 mm |
| Ball Mill Grind size, P80 |
450 mm |
| Rougher Flotation Time |
8 min |
| Mass Recovery to Rougher Concentrate |
6.0 % |
| Pre-Cleaner Flotation Time |
8 min |
| 1st Cleaner Column Flux |
2 t/hr/m2 |
| 1't Cleaner Mass Recovery |
70% |
| 1't Cleaner Concentrate +177mm |
45% |
| Mass Recovery to Final Flotation Concentrate |
3.1% |
| Cg Recovery to Final Flotation Concentrate |
92.0% |
| Cg Grade of Final Flotation Concentrate |
95.0% |
| Tailings Moisture Content |
18.0 % |
| Process Plant Fresh Water Consumption |
7.0 ft3/t |
| Process Plant Power Consumption |
23.2 kWh/t |
| 14.4 | Process
Description - Concentrator |
This section describes the parameters
used to design a graphite concentrator for the Coosa Project. The fundamental design criteria for the processes described below have
been developed from the metallurgical testing program.
The Coosa concentrator plant was designed
for a nominal 3.201 Mstpa, or 8,771 stpd, of run of mine (ROM) feed.
Mine haul trucks will tip into a surge
bin feeding a primary jaw crusher designed for 86% availability. The primary crushed mill feed will be conveyed to a 5/8 in. (15 mm)
sizing screen, with the oversize reporting to the secondary crusher and the undersize fed forward to the rod mill circuit.
| | 14-3 | |
Westwater Resources, Inc. | Coosa
Graphite Project
S-K 1300 Report |
December 11,
2023
SLR Project No.:
138.20527.00002 |
A
150 ton fine feed bin will provide surge capacity for the grinding circuit, to ensure a constant feed rate to the rod mill. The rod mill
will operate in closed circuit with a 10 mesh scalping screen. Undersize from the screen will be fed to a flash flotation cell, with
the flash cell tailing pulp gravitating to the ball mill classification screen. The screen separates at a P80 of 450 μm,
with the oversize reporting to the mill and the undersize going to the rougher flotation feed box.
The rougher flotation stage will consist
of a bank of six conventional (“trough”) cells in series. Each cell will have independent airflow control. The rougher concentrate
is combined with the flash concentrate and pumped to a pre-cleaner flotation circuit consisting of a bank of five trough cells in series.
The pre-cleaner concentrate will be
dewatered using a vibrating screen with 230 mesh openings, with the screen oversize reporting to the first of two polishing scrubbers.
The scrubber discharge is combined with the screen undersize (solution) to serve as feed to the first cleaner column flotation cell.
Two stages of conventional scavenger flotation cells are used to recover Cg from the first cleaner tail, returning Cg concentrate to
the 1st cleaner column feed and 1st polishing scrubber feed screen, respectively.
First
cleaner flotation concentrate will be screened at 80 mesh (177 μm)
by the 2nd polishing scrubber feed screen, with the oversize reporting to the 2nd polishing scrubber ahead of 2nd column flotation
cells. The screen undersize will be thickened prior to attrition scrubbing and column flotation in a 3rd set of column flotation
cells. Final cleaner concentrate from both the 2nd and 3rd flotation column circuits are combined, thickened and
filtered in filter presses comprising the final concentrate product.
The slurry from the rougher and pre-cleaner
circuits will be pumped to the filtration facility near the tailings management facility. At the filtration plant, the slurry will be
thickened, filtered, and transported to the tailings management facility.
Reagents will be stored, mixed, and
distributed from a central reagents area. Frother, collector, and lime will be pumped from the reagents area to the flotation section
using peristaltic reagent pumps to accurately dose the process.
The information gathered from ongoing
pilot work suggests that ROM material from the Coosa deposit will be extremely friable and will contain large quantities of fine material.
However, for the purposes of this preliminary study, Westwater has elected to include a more conservative design that includes a jaw
crusher for oversized material.
Ore will be delivered to the primary
tip by 20 ton haul trucks at a frequency averaging 20 to 25 trucks per hour. Feed is discharged directly into a rail-lined, 30 ton surge
bin.
A vibrating grizzly feeder at the bottom
of the surge bin discharges +60 mm oversize into the primary crusher feed chute. Grizzly undersize drops onto the classification screen
feed conveyor. The primary crusher consists of a jaw crusher with a closed side setting of 50 mm, and can accept a top size of 400 mm.
Crushed feed discharges onto a sacrificial conveyor, which in turn discharges onto the classification screen feed conveyor. The screen
feed conveyor is equipped with an overhead magnet for removing tramp metal ahead of the secondary crusher.
A vibrating inclined screen is used
to classify the primary crushed feed and close the circuit around the secondary crusher. The screen deck consists of ¾ in. (19
mm) slots with the screen undersize chute feeding the fine feed bin conveyor. The fine feed bin conveyor is equipped with a weight-o-meter
for recording crushing circuit production. Oversize from the classification screen is fed by a lined chute into the secondary crusher.
| | 14-4 | |
Westwater Resources, Inc. | Coosa
Graphite Project
S-K 1300 Report |
December 11,
2023
SLR Project No.:
138.20527.00002 |
The secondary crusher consists of a
standard roll crusher with a closed side setting of 15 mm. Crushed product discharges via a chute onto the recycle conveyor which returns
the material to the classification screen feed conveyor.
The crushing circuit is expected to
run at 86% availability, seven days per week. A dust collection system is included in the classification screen and secondary crushing
area.
The milling circuit and all subsequent
areas of the plant operate at 92% availability on a 24/7 schedule. Crushed run of mine material is stored in a 150 ton fine feed bin.
An overflow chute at the top of the bin allows overflow to a stockpile with an additional six hours of capacity. The stockpile material
can be reclaimed to the fine feed bin conveyor by front end loader, as needed.
A vibrating pan feeder draws material
from the bottom of the fine feed bin onto the mill feed conveyor. The conveyor is equipped with a weight-o-meter to measure mass flow
and allow for control of the mill feed rate.
The primary grinding mill consists of
a long overflow discharge rod mill with a 1,400 kW drive. The discharge end of the mill is fitted with a trommel screen with 10 mm openings.
Oversize tramp material, woodchips, etc. drop through a chute into a drum or skip. The material passing through the trommel is collected
in a chute and fed to the screen pump feed box.
The mill discharge is diluted with process
water and is then pumped to a vibrating, inclined classification screen with 10# (1.68 mm) openings. The screen oversize is returned
to the rod mill feed chute, whereas the undersize is pumped forward to the flash flotation step.
Flash flotation consists of eight trough
flotation cells in series. Concentrate from the flash circuit combines with the rougher concentrate as feed to the pre-cleaner circuit.
Flash tails are fed by gravity to the discharge pump box in the ball mill circuit.
The secondary grinding stage consists
of an overflow discharge ball mill with a 1,100 kW drive. The discharge end of the mill is fitted with a trommel screen with 6 mm openings.
Oversize tramp material, woodchips, etc. drop through a chute into a drum or skip. The material passing through the trommel is collected
in a chute and fed to the screen pump feed box.
Ball
mill discharge and flash tailings are pumped to an inclined classification screen with 595μm
(30#) openings. The oversize gravitates to the feed chute of the ball mill, whereas the undersize is pumped to the feed box in the rougher
flotation circuit.
Spillage contained in the grinding area
is pumped to the mill discharge sump for re- treatment. Ball mill grinding media is delivered to the plant in bulk and is stored in the
ball mill ball bunker. The ball bunker is serviced by a crawl and electric hoist arrangement allowing balls to be lifted into a kibble
using the ball loading magnet and tipped into the mill via a ball loading chute.
| 14.4.4 | Rougher
and Pre-Cleaner Flotation |
Ball mill classification screen underflow
is pumped to the feed box of a bank of six rougher flotation cells with a combined residence time of just over ten minutes. Flotation
air to each cell is supplied by flotation blowers via a low pressure manifold and is manually controlled. Pulp level is maintained by
modulating dart valves.
| | 14-5 | |
Westwater Resources, Inc. | Coosa
Graphite Project
S-K 1300 Report |
December 11,
2023
SLR Project No.:
138.20527.00002 |
Rougher concentrate is collected in
a common launder and flows by gravity to the rougher concentrate froth pump, which pumps to the pre-cleaner feed box. The pre-cleaner
float bank consists of five flotation cells with twelve minutes of residence time. The concentrate collected from the pre-cleaner float
is collected in a common launder and flows by gravity to the same froth pump as the flash concentrate to be pumped to the cleaner circuit.
Rougher and pre-cleaner tailings are the final tailings from the flotation circuit and report to the tailings pump feed box and are then
pumped to the tailings dewatering circuit.
Spillage in the rougher section is collected
in a common sump and pumped back into the first rougher cell using a submersible spillage pump.
Feed
to the cleaner flotation circuit, in the form of pre-cleaner concentrate, is fed to a vibrating dewatering screen with 230 mesh (63 μm)
panels. Dewatered solids from screen deck fed to polishing scrubber #1, a tire-mounted drum scrubber with a 15 kW drive. The scrubber
discharge combines with dewatering screen underflow to serve as feed to the first of three cleaner flotation columns. Each column is
3 ft in diameter by 20 ft high with PLC level control and froth washing.
Concentrate
from the first cleaner column is pumped to an 80-mesh (177 μm)
sizing screen. The screen oversize gravitates to a second polishing scrubber in the +80-mesh cleaning circuit. Tailings from the first
cleaner column go to a conventional scavenging circuit consisting of four DR18 trough cells in series. The concentrate from the first
two scavenging cells is returned to the column feed, whereas the concentrate from the last two cells reports to the dewatering screen.
The +80 mesh cleaning circuit has the
same flowsheet as the first cleaner circuit, except there is no dewatering screen. All of the classification screen oversize is fed to
the second polishing scrubber ahead of the +80 mesh cleaning column. The +80 mesh cleaner column concentrate is pumped to the concentrate
thickener, while the column tails report to the scavenger circuit, with concentrates returned to the column feed and scrubber feed.
The -80 mesh cleaning circuit has the
same flowsheet as the first cleaner circuit, except that there is a thickener in place of the dewatering screen. Thickener underflow
is fed to an attrition scrubber ahead of the -80 mesh cleaning column. The -80 mesh cleaner column concentrate is combined with the +80
mesh concentrate and pumped to the concentrate thickener, while the column tails report to the scavenger circuit, with scavenger concentrates
returned to the thickener feed and scrubber feed.
Cleaner scavenger tailings are pumped
to the rougher circuit, or the tailings thickener. The cleaner area spillage is collected in bermed areas and directed into the cleaner
area spillage pump, which pumps back to the first cleaner feed box.
| 14.4.6 | Concentrate
Dewatering |
Final graphite concentrate is pumped
to the concentrate thickener sampling box and sampler before entering the concentrate thickener for dewatering. The thickener is equipped
with rake lift, bed level detection, and bed mass monitoring. Thickener overflow gravitates to the spray water tank for recycling, while
the thickener underflow is withdrawn from the cone by a centrifugal underflow pump and pumped forward to the concentrate storage tank,
or recycled to the thickener feed if of insufficient density.
| | 14-6 | |
Westwater Resources, Inc. | Coosa
Graphite Project
S-K 1300 Report |
December 11,
2023
SLR Project No.:
138.20527.00002 |
The concentrate is pumped from the mechanically
agitated storage tank to a horizontal pressure filter for dewatering. Filtrate from the press is recycled back to the concentrate thickener
feed launder.
Concentrate filter cake is discharged
from the press via two cake discharge chutes onto the cake transfer belt which transfers the cake to the concentrate storage shed where
it is stored prior to purification. Concentrate dewatering area spillage is recovered by pumping back to the concentrate thickener.
| 14.4.7 | Tailings
Dewatering |
The combined rougher/pre-cleaner tailings
pumped from the flotation area discharge into a sampling launder on top of a high-rate thickener. The thickener is equipped with a rake
lift, bed level detection, and bed mass monitoring. Thickener overflow gravitates to the process water tank, while the thickener underflow
is withdrawn from the cone by a centrifugal underflow pump and pumped forward to the tailings filter.
The tailings filter consists of a continuously
operated vacuum belt filter that produces a tailings product at 18% moisture. Filtrate is returned to the feed launder of the tailings
thickener. The filter cake discharges from the press via a chute onto the tailings conveyor which transfers the tailings to a storage
pile within a three-sided concrete walled shed. A front-end loader is used to load a 30 ton dump truck to transport the tailings to the
FTSF area.
Process water is stored in a 200 m3
tank and is distributed to the plant by a process water pump. Plant hosing/flushing water is provided by the hose-down water supply
pumps.
The process water tank is also used
to feed the diesel powered fire water pump from a separate (lower) offtake, thus guaranteeing availability.
Clean water is piped into the plant
from wells and stored in the plant's clean water tank. From the storage tank, water is pumped around the plant for use as reagent mixing
water, slurry pump gland seal water, and as required for mill lubrication system cooling.
Plant and instrument air is provided
by two compressors. Air quality is maintained by a filter. Instrument air is dried using a refrigeration drier. An air receiver is provided
for compressed and instrument air lines, to allow for surges in demand.
Low-pressure air is supplied to the
flotation plant by two separate blowers. The blowers are fixed speed, with manifold pressure controlled by a modulating valve on an exhaust
line.
Electrical power for the site will be
supplied by electrical grid power brought to the site. Access to the Alabama Power transmission line is possible with a 3.75 mile line
connecting to the west of the Project. At full capacity, the plant will have a connected load of 12.7 MW with an operating load of 11.6
MW. The plant operating power requirement will be 23.2 kWh/t ore. The mill will be serviced with a main substation and electrical power
distributed by a combination of cable ducts and aerial lines.
| | 14-7 | |
Westwater Resources, Inc. | Coosa
Graphite Project
S-K 1300 Report |
December 11,
2023
SLR Project No.:
138.20527.00002 |
Approximately 460,000 gal/d of fresh
water will be required to satisfy water demand for the process plant. This will come from water collection in the settling pond below
the FTSF as well as from a series of water wells.
| 14.4.9.1 | pH
Modifier — Calcium Hydroxide |
Lime (calcium hydroxide) is delivered
to the plant in one ton bulk bags and loaded into the lime hopper. Dry lime is metered from the hopper into the agitated mixing tank
by a screw feeder and mixing plate. Mixed lime slurry at 10% solids is pumped into an agitated dosing tank. A circulation pump supplies
lime to the flotation circuit via a ring main.
| 14.4.9.2 | Collector
— Fuel Oil |
Diesel fuel is delivered to the plant
storage tank in bulk. Peristaltic hose pumps meter the reagent directly from the storage tank to several additional points throughout
the plant.
Liquid Methyl Isobutyl Carbinol (MIBC)
is delivered to the site in 1 m3 totes. As delivered (100% strength) MIBC is pumped directly to the dosing points by
dedicated peristaltic pumps.
| 14.4.9.4 | Flocculant
— Magnafloc 10 |
Flocculant powder is delivered to the
site in one ton bags and stored in the reagent storage area. Bags are lifted by the reagent area crane and added to the flocculant powder
hopper. The powder is withdrawn by the flocculant screw feeder and blown through a venturi to a wetting head located on top of the mechanically
agitated mixing tank.
From the mixing tank, mixed flocculant
can be fed forward to the storage tanks or recycled back into the mixing tank to aid mixing. From the storage tank, the flocculant is
pumped directly to the tailings and concentrate thickeners.
Reagent spillage is pumped to the tailings
thickener, or stored in totes for disposal.
| 14.4.10 | Operating
Personnel |
The process plant will be operating
24 hours per day, 7 days per week with a total plant operating availability of 92%. The plant will be operated on 12 hour shifts divided
into four crews by a total of 26 operating personnel, and 25 salaried personnel for a total of 48 personnel.
| | 14-8 | |
Westwater Resources, Inc. | Coosa
Graphite Project
S-K 1300 Report |
December 11,
2023
SLR Project No.:
138.20527.00002 |
The Project infrastructure consists
of the following:
| · | Process
plant, mobile equipment, and maintenance shops |
| · | Office/administration
area |
| · | Co-mingled
waste rock and Filtered Tailings Storage Facility (FTSF) |
This infrastructure is required to support
the final facility generating approximately 99,000 stpa concentrate.
Office and dry facilities will be portable
offices located near the mill. The general arrangement schematic is presented in Figure 15-1.
The site access road is approximately
3.4 miles from Coosa County Road 29. It will be upgraded to allow truck traffic to carry the flake concentrate from the mine to the purification
plant. This road will be maintained as a gravel road with the proper ditches and culverts for surface drainage.
Electrical power for the site will be
supplied by electrical grid power brought to the site. Access to the Alabama Power transmission line is possible with a 3.75 mile line
connecting to the west of the Project. The power line would follow existing roads to facilitate easy installation and periodic checks.
At full capacity, the plant will have
a connected load of 12.7 MW with an operating load of 11.6 MW. The plant operating power requirement will be 23.2 kWh/t ore. The mill
will be serviced with a main substation and electrical power distributed by a combination of cable ducts and aerial lines.
Approximately 460,000 gal/d of fresh
water will be required to satisfy water demand for the process plant. This will come from water collection in the settling pond below
the FTSF as well as from a series of water wells.
There will be no camp for mine operations
as it is expected that employees will be sourced from nearby communities.
| | 15-1 | |
Westwater Resources, Inc. | Coosa
Graphite Project
S-K 1300 Report |
December 11,
2023
SLR Project No.:
138.20527.00002 |
| Figure 15-1: |
Infrastructure Layout General Schematic |

| | 15-2 | |
Westwater Resources, Inc. | Coosa
Graphite Project
S-K 1300 Report |
December 11,
2023
SLR Project No.:
138.20527.00002 |
The Project will consist of a series
of open pit mines, with crushing facilities, a processing plant, and an FTSF. Slurried tailings will be pumped from the plant to a filter
plant near the FTSF. After filtration, the filtered tailings will either be trucked or conveyed to the FTSF and compacted in place. The
FTSF will be a comingled facility in which filtered tailings will be comingled with waste rock.
Constraints in locating the FTSF include
the following:
| · | Coosa
Wildlife Management Area to the south of the processing plant site area; |
| · | Mine
pits and future mining areas to the west and north of the processing plant site area; |
| · | Westwater’s
preference to avoid or minimize catchment area upstream of the facility and simplify water
management for operation and closure. |
SLR identified a site that could be
sized to contain the ultimate FTSF design capacity, which is located in a drainage area approximately two miles to the east of the processing
plant site. A conceptual FTSF layout was developed that assumed that the geotechnical and hydrogeological conditions were suitable to
support the FTSF, and was comprised of the following:
| · | Storage
for approximately 73 Mst (66 million tonnes) of filtered tailings and 15 Mst (13.5 million
tonnes) of waste material, for a total capacity of 88 Mst (79.5 million tonnes); |
| · | An
average annual milling rate of 3.3 Mstpa (3 million tonnes per year), resulting in a project
life of approximately 21 years; |
| · | An
overall four horizontal to one vertical (4H:1V) tailings slope; |
| · | Tailings
containment from a High Density Polyethylene (HDPE) geomembrane, over a total area of approximately
400 acres; |
| · | Construction
of the FTSF will be completed in five stages, typically in four-year increments, to reduce
initial capital. |
A typical cross section of the FTSF
is shown in Figure 15-2 along Section Line A-A’.
| | 15-3 | |
Westwater Resources, Inc. | Coosa
Graphite Project
S-K 1300 Report |
December 11,
2023
SLR Project No.:
138.20527.00002 |
| Figure 15-2: |
Filtered Tailings Storage Facility Cross Section |

Note. See Figure 15-1 for section location.
Using the basis and assumptions presented
in this TRS, SLR calculated a total conceptual capital cost of US$178.5 million, which includes US$94.9 million for the FTSF construction,
US$20.0 million for closure, US$40.7 million for contingency, and US$23.3 million in indirect costs. This cost estimate corresponds to
a Class 5 cost estimate classification per American Association of Costing Engineers (AACE).
The scoping FTSF layout was based on
very limited site-specific data, and assumptions were made regarding foundation conditions, borrow material characterization, tailings
and mine waste properties, and geochemistry characterization. As the Project advances, site-specific design criteria and field programs
should be developed, data collected, and analysis performed that can be incorporated into the design and reduce the uncertainties associated
with the Project.
| | 15-4 | |
Westwater Resources, Inc. | Coosa
Graphite Project
S-K 1300 Report |
December 11,
2023
SLR Project No.:
138.20527.00002 |
This section was taken from Benchmark
Mineral Intelligence Ltd. (BMI, 2023).
As there is currently nominal supply
of natural flake graphite in North America (8,000 tonnes in 2022) and a relatively small market with bi-lateral contracts making pricing
opaque, the North American pricing model is derived on a collective reasonable judgement of the locations-based premium factors that
include but are not limited to:
The collective North America premia
(government support, ESG, and localized supply chain marketability, etc.,) are forecast to begin at a low level due to the qualification
and scaling required, and grow gradually towards the end of the decade as the wider battery supply chain becomes more established.
Shipping costs are forecast to remain
more elevated in the long run from the pre-pandemic levels – current futures quotes for 2024 and 2025 are approximately 10% and
20% higher than the forecast 2023 full year average price.
Figure 16-1 shows the long term pricing
BMI forecast for natural flake graphite (North America Cost, Insurance, and Freight (CIF), 94-95% C, Real USD basis). For this TRS,
the QP has used a constant basket price of US$1,100 per tonne (US$998 per ton) delivered to Westwater’s Kellyton, AL plant for
the economic analysis as it represents a conservative approach to pricing trends.
| | 16-1 | |
|
Westwater Resources, Inc. | Coosa Graphite Project
S-K 1300 Report |
December 11, 2023
SLR Project No.: 138.20527.00002 |
Figure
16-1: Long Term Natural Flake Pricing Forecast

Source: BMI, 2023
No contracts have been awarded to date
as this Project is still at an advanced exploration stage.
| | 16-2 | |
| Westwater Resources, Inc. | Coosa Graphite Project S-K 1300 Report | December 11, 2023 SLR Project No.: 138.20527.00002 |
| 17.0 | Environmental
Studies, Permitting, and Plans, Negotiations, or Agreements with Local Individuals or Groups |
The Project is located on 2,667 acres
located in Coosa County, Alabama, approximately eight miles west of Rockford, Alabama. The Project area is forested with unpaved roads
throughout and the current land use is silviculture and recreational hunting. The southern border of the Project area is shared with
the Coosa Wildlife Management Area (WMA), and the Coosa WMA Shooting Range is located approximately one mile east.
The Project area is located within the
Mobile Bay watershed and the Coosa River water basin and includes multiple small tributaries to the Coosa River and Weogufka Creek.
| 17.2 | Environmental
Studies |
Baseline environmental studies will
be required to support mine planning and permitting efforts. These studies include, but are not limited to:
| · | Jurisdictional
delineations of Waters of the United States (WOTUS) and wetlands |
| · | Archaeological
and cultural survey |
| · | Biological
surveys related to T&E species and critical habitat |
| · | Geochemistry
and groundwater quality |
| 17.3 | Environmental
Permits |
The United States Army Corps of Engineers
(USACOE) will be required, as part of issuing a 404 permit, to comply with the National Environmental Policy Act (NEPA), which may include
preparing/issuing either an Environmental Impact Statement (EIS) or an environmental assessment (EA).In addition to federal permitting,
a Surface Mining of Non-fuel Minerals Permit and Plan of Reclamation will also be required, issued by the Alabama Department of Labor.
Other permits will also likely be required related to water management, generation of hazardous waste, storage of fuel, etc. A short
list of potentially required permits are provided in Table 17-1.
| | 17-1 | |
| Westwater Resources, Inc. | Coosa Graphite Project S-K 1300 Report | December 11, 2023 SLR Project No.: 138.20527.00002 |
Table
17-1: Required or Potentially Required Environmental Permits
| Agency |
Permit* |
Comment |
Unted
States Army Corps of
Engineers (USACOE) |
404
Individual Permit |
TSF,
Pits, Ingress and Egress |
| USACOE |
Plan
of Operations (PoO) –
Record of Decision (ROD) |
All
Mining Operations |
Alabama
Department of
Environmental Management (ADEM) |
National
Pollutant Discharge
Elimination System (NPDES) |
Water
Treatment/Individual
Outfall of Process Solution |
| ADEM |
Multi-Sector
General Permit
(MSGP) – Stormwater |
All
contact water discharge
locations |
| ADEM |
Air
Quality Permit |
Fugitive
Dust and Emissions |
| Alabama
Department of Labor |
Surface
Mining of Non-fuel
Minerals Permit and Plan of
Reclamation |
All
Mining Operations |
Bureau
of Alcohol, Tobacco,
Firearms and Explosives |
Explosives
Permit |
Blasting |
United
States Environmental
Protection Agency (EPA) |
Hazardous
Waste Generator |
All
Mining Operations |
Note: * Permits listed are for the mining
operations and exclude short-term construction permits
A comprehensive closure plan and Reclamation
Cost Estimate (RCE) will be required for the Surface Mining of Non-fuel Minerals Permit and Plan of Reclamation issued by the Alabama
Department of Labor for the state mine permit and for the PoO and NEPA. Bonding will be required for both the state and USACOE, which
is typically one bond held by the state in accordance with a memorandum of understanding between the agencies. The post-closure land
use is yet to be determined; however, reclamation will include slope stabilization and revegetation to result in a self-sustaining ecosystem
based on pre-miming conditions. Post-closure land use may include beneficial use such as recreation, industry and wildlife habitat.
| 17.5 | Conclusions
and Recommendations |
The primary permits for the Project
will include permits issued by the USACOE and by the Alabama Department of Labor. Baseline studies will be required to support these
and other permitting efforts. Baseline activities are currently in the planning stages for the Project which will provide direction for
further definition of the Project and environmental permits required for construction, operation, and closure. Stakeholder engagement,
including regulatory agencies, tribal entities and the community will also be required to support the permitting efforts. Westwater has
begun engagement with state regulators at a high level. Potential obstacles for the Project are as follows:
| 1 | Presence
of T&E species and critical habitat, |
| 2 | USACOE
404 permitting and mitigation, |
| 3 | The
Project being adjacent to the Coosa WMA, and |
| 4 | State
regulatory statute limitations for a chemical processing operation like the Project and lack
of state regulatory experience permitting a chemical processing operation. |
| | 17-2 | |
| Westwater Resources, Inc. | Coosa Graphite Project S-K 1300 Report | December 11, 2023 SLR Project No.: 138.20527.00002 |
| 18.0 | Capital
and Operating Costs |
The capital and operating cost estimates
for the Project are based on factored costs from other operations, the SLR QP’s judgment, and analogy. The change in the cost basis
for this TRS, due to the proposed increase in Cg production rates and the requirement for cost escalation, makes the accuracy, in the
SLR QP’s opinion, an American Association of Cost Engineers (AACE) International Class 5 cost estimate with an accuracy range
of -20% to -50% to +30% to +100%.
Table 18-1 summarizes the life of mine
(LOM) capital cost estimate for the 95,000 stpa to 105,000 stpa (86,000 to 95,000 tonnes per year) concentrate production schedule.
Table
18-1: Base Case LOM Capital Cost Estimate Summary
| Area |
(US$000) |
| Mining |
13,231 |
| Processing |
89,230 |
| Infrastructure |
17,180 |
| Tailings
Facility |
31,919 |
| Total
Development Capital |
151,559 |
| Mining |
22,284 |
| Processing/
Infrastructure |
6,786 |
| Tailings
Facility |
112,636 |
| Total
Sustaining Capital |
141,706 |
| Mine/Plant
Closure/Reclamation |
8,736 |
| FTSF
Closure/Reclamation |
33,975 |
| Total
Closure/Reclamation |
42,711 |
| Grand
Total |
335,977 |
Exclusions from the capital cost estimate
include, but are not limited to, the following:
| · | Project
financing and interest charges |
| · | Escalation
during construction |
| 18.1.1 | Development
Capital |
The 2015 initial capital cost estimate
of $1.9 million for mining supported a production rate of 4,600 stpa of Cg concentrate. In this TRS, the production rate has been increased
to 95,000 stpa to 105,000 stpa (86,000 to 95,000 tonnes per year). To scale the 2015 capital cost estimate of $1.9 million to reflect
the currently envisioned larger scale operation, the SLR QP used the 0.6 capital cost rule as follows:
| | 18-1 | |
| Westwater Resources, Inc. | Coosa Graphite Project S-K 1300 Report | December 11, 2023 SLR Project No.: 138.20527.00002 |
Thus, the scaled 2015 capital cost estimate
of $9.2 million for the larger 95,000 stpa to 105,000 stpa (86,000 to 95,000 tonnes per year) operation.

The SLR QP subsequently escalated the
adjusted 2015 capital cost estimate of $9.3 million to a Q2 2023 US dollar basis using subscription-based Mineral Cost Service (MCS)
cost indexes dated July 2023. The escalation effect on capital costs from 2015 to Q2 2023 is estimated to be 43%, or $13.2 million,
over the scaled 2015 capital costs at the 95,000 stpa to 105,000 stpa (86,000 to 95,000 tonnes per year) production schedule.
The scaling and escalation modifications
completed to achieve the $13.2 million mining capital cost are reflected in Table 18-2.
Table
18-2: Mining Initial Capital Cost Estimate
| Area |
Units |
2015
Estimate |
Scaled
2015
Estimate |
2015
Index |
March
2023
Index |
Factor |
Q2
2023
Estimate |
| Cg
Production Target |
ktpa |
4.6 |
90.0 |
|
|
|
90.0 |
| Mining |
US$(000) |
1,900 |
9,281 |
92.1 |
131.3 |
1.426 |
13,231 |
| %
Variance |
|
|
388% |
|
|
|
43% |
SLR developed a factored scoping study
estimate and Basis of Estimate for this report. The estimate was compiled in the form of a Class 5 Capital Cost estimate in line
with AACE recommended practice 47R-11 Cost Estimate Classification System as Applied in the Mining and Mineral Processing Industries.
The estimate pricing for equipment was
based on the Zenith quotation from September 2023 provided included in Appendix 1. To establish the indicative capital cost, a capacity
factor or equipment factor estimating approach including allowances for some components of the Project was utilized to form the estimate.
The cost estimate was prepared using a project cost Work Breakdown Structure (WBS) to define the process areas and associated indirect
costs. The WBS for this estimate was directly related and linked to the areas noted in the Zenith quotation. A table showing the translation
of the Zenith equipment costs to SLR’s fully loaded estimate is included in Appendix 1.
The factored methodology was based on
the application of ratios against the mechanical equipment supply cost to determine both the direct costs for labor and material as well
as generally expected and associated indirect costs. An appropriate level of contingency was included.
The estimated discipline cost was further
detailed to establish the supply cost of bulk materials and the associated installation cost for each discipline.
Unit rates, based on benchmark data
from other regions and from the estimating team experience with similar projects, were then used to back calculate and estimate the associated
bulk quantities. A ratio was applied to the equipment list to account for equipment purchased in the United States versus Chinese quoted
equipment.
| | 18-2 | |
| Westwater Resources, Inc. | Coosa Graphite Project S-K 1300 Report | December 11, 2023 SLR Project No.: 138.20527.00002 |
Indirect costs associated with the Project
were applied as factors of direct costs and included aspects such as construction indirects, Engineering, Procurement, and Construction
Management (EPCM), Freight, Owner’s Cost, first fills, third party vendor support, etc. The total development capital estimate
for the 95,000 stpa to 105,000 stpa (86,000 to 95,000 tonnes per year) concentrator is shown in Table 18-3.
Table
18-3: Process Plant Initial Capital Cost Estimate
| Area |
Sub-area |
Sum
of Total |
| Processing
Plant |
Crushing |
6,681 |
| |
Dewatering
Concentrate |
2,000 |
| |
Dewatering
Tailings |
9,552 |
| |
Flotation |
8,022 |
| |
Grinding |
18,560 |
| |
Adjustment
for Non-Chinese Cost |
2,884 |
| Processing
Plant Total |
|
47,699 |
| Construction
Indirects Total |
|
715 |
| Project
Indirects |
Camp &
Catering |
- |
| |
Construction
Power |
1,431 |
| |
EPCM |
8,109 |
| |
Freight |
4,672 |
| |
Temp
Construction Facilities |
715 |
| |
Transport |
- |
| |
Vendor
Support & Commissioning |
2,385 |
| |
Spares &
First Fills |
566 |
| Project
Indirects Total |
|
17,878 |
| Owner's
Cost Total |
|
7,393 |
| Provisions
Total |
|
15,544 |
| Grand
Total |
|
89,230 |
Infrastructure capital costs were modified
the same way as was the mining capital, namely scaling the 2015 cost estimate from 4,600 stpa to 95,000-105,000 stpa using the 0.6 capital
cost rule and escalating from 2015 to Q2 2023 cost basis.
The scaling and escalation modifications
completed to obtain the $17.2 million infrastructure capital cost are reflected in Table 18-4.
| | 18-3 | |
| Westwater Resources, Inc. | Coosa Graphite Project S-K 1300 Report | December 11, 2023 SLR Project No.: 138.20527.00002 |
Table
18-4: Infrastructure Initial Capital Cost Estimate
| Area |
Units |
2015
Estimate |
Scaled
2015
Estimate |
2015
Index |
Q2
2023
Index |
Factor |
Q2
2023
Estimate |
| Cg
Production Target |
ktpa |
4.6 |
90.0 |
|
|
|
90.0 |
| Infrastructure |
US$
(000) |
2,900 |
11,645 |
89.0 |
131.3 |
1.475 |
17,180 |
| %
Variance |
|
|
388% |
|
|
|
43% |
This cost estimate for the FTSF corresponds
to a AACE Class 5 cost estimate classification per the scope described in Section 15.5. The capital estimate of $31.9 million
for the initial starter dam is shown in Table 18-5.
Table
18-5: FTSF Initial Capital Cost Estimate
| Item |
US$000 |
| Stage |
1 |
| Year |
-1 |
| Site
Preparation |
|
| Mobilization
and demobilization |
1,479 |
| Clearing
and grubbing |
484 |
| Topsoil
stockpiling |
1,277 |
| Stormwater
management |
649 |
| |
|
| Earthworks |
|
| Unsuitable
material over-excavation |
1,702 |
| Embankment |
284 |
| Regrading
(Cut and Fill balance) |
1,41 |
| Liner
Bedding Material |
1,773 |
| Anchor
Trench |
126 |
| Diversion
Channels |
840 |
| |
|
| Geosynthetics |
|
| 80
Mil Textured HDPE Primary Liner - supply and install |
3,830 |
| |
|
| | 18-4 | |
| Westwater Resources, Inc. | Coosa Graphite Project S-K 1300 Report | December 11, 2023 SLR Project No.: 138.20527.00002 |
| Item |
US$000 |
| |
|
| Overliner
and Drainage Layer |
|
| Overliner
and Drainage Layer |
6,241 |
| |
|
| Downstream
Collection Pond |
|
| Downstream
Collection Pond |
|
| |
1,000 |
| Instrumentation |
|
| Survey
Monitors and Wells |
32 |
| |
|
| Subtotal
Construction Direct Costs |
21,135 |
| Weighted
Contingency |
6,557 |
| Contractor
Indirect Costs |
2,114 |
| Owner
Indirect Costs |
2,114 |
| Total
Construction Costs |
31,919 |
A periodic allowance of $7.4 million
for mine fleet replacements every six years was used totaling $22.3 million over the LOM.
| 18.1.2.1 | Process
Plant/Infrastructure |
An annual allowance of $424,000 starting
in year 6 of the LOM was derived from factoring 0.25% of the processing plant initial capital cost and approximately 1% of infrastructure
initial capital cost totaling $6.8 million over the LOM.
As well as estimating the capital cost
of the initial starter dam for the FTSF, SLR also estimated the sustaining capital requirements and timing to keep the proposed FTSF
capable of receiving material from the plant during the LOM. These estimates are presented in Table 18-6 totaling $112.6 million over
the LOM.
| | 18-5 | |
| Westwater Resources, Inc. | Coosa Graphite Project S-K 1300 Report | December 11, 2023 SLR Project No.: 138.20527.00002 |
Table
18-6: FTSF Sustaining Capital Cost Estimate
| Item |
LOM
Total |
Cost
by Stage (US$000) |
| 2 |
3 |
4 |
5 |
| Year
3 |
Year
7 |
Year
11 |
Year
15 |
| Construction
Direct Costs |
73,749 |
13,996 |
14,485 |
16,777 |
28,491 |
| Weighted
Contingency |
24,137 |
4,576 |
4,749 |
5,505 |
9,307 |
| Contractor
Indirect Costs |
7,375 |
1,400 |
1,448 |
1,678 |
2,849 |
| Owner
Indirect Costs |
7,375 |
1,400 |
1,448 |
1,678 |
2,849 |
| Total
Construction Costs |
112,636 |
21,372 |
22,131 |
25,637 |
43,496 |
| 18.1.3 | Final
Closure and Reclamation |
For final closure and reclamation of
the proposed mine area and processing plant, SLR used an allowance of $0.10/st mined over the LOM. The unit rate is based on benchmark
data from western U.S. projects and SLR’s experience with similar projects. Based on a total of 87.6 Mst mined during the LOM,
the total closure/reclamation cost is estimated at $8.7 million.
As part of the capital estimate exercise
for development and sustaining capital for the FTSF, a closure cost estimate of $34 million was calculated as shown in Table 18-7.
Table
18-7: FTSF Closure/Reclamation Cost Estimate
| Item |
US$000 |
| Closure |
|
| Subsoil |
10,855 |
| Soil
Cover |
8,141 |
| Revegetation |
989 |
| Subtotal
Closure Costs |
19,985 |
| Contingency |
9,993 |
| Contractor
Indirect Costs |
1,999 |
| Owner
Indirect Costs |
1,999 |
| Total
Closure Costs |
33,975 |
Working capital adjustments were estimated
using 30 days outstanding for accounts receivable (A/R), accounts payable (A/P), and consumables inventories. The Project will have a
$6.3 million upfront requirement in Year 1 of production, which will be recovered by the end of LOM.
The operating cost estimates in this
TRS were derived from MCS cost guides, a subscription-based cost database, that total $15.41/st mill feed ($16.99/tonne mill feed) as
follows:
| · | Mining:
$5.21/st mill feed, $4.33/st mined; ($5.75/tonne mill feed, $4.77/tonne mined) |
| | 18-6 | |
| Westwater Resources, Inc. | Coosa Graphite Project S-K 1300 Report | December 11, 2023 SLR Project No.: 138.20527.00002 |
| · | Processing:
$8.80/st mill feed; ($9.70/tonne mill feed) |
| · | G&A:
$1.40/st mill feed; ($1.54/tonne mill feed) |
| · | Total:
$15.41/st mill feed ($16.99/tonne mill feed) |
A unit rate of $4.33/st mined or $5.21/st
mill feed ($4.77/tonne mined or $5.51/tonne mill feed) was used to estimate mining costs and averages $17.3 million per year over the
LOM. This unit rate was sourced from the MCS guide for 10,000 tonne per day mine operation with 1:1 stripping ratio with the following
breakdown as shown in Table 18-8.
| Table 18-8: |
Mine Operating Cost Estimate Summary |
| Area |
%
of Total |
US$/st
mined |
| Supplies |
12% |
0.52 |
| Hourly
Labor |
38% |
1.65 |
| Equipment
Operation |
27% |
1.17 |
| Salaried
Labor |
14% |
0.61 |
| Miscellaneous |
9% |
0.39 |
| Total |
100% |
4.33 |
A unit rate of $8.80/st ($9.70/tonne)
milled was used to estimate processing costs which includes pumping to the FTSF and averages $29.3 million per year over the LOM. This
unit rate was sourced from the MCS guide for 10,000 tonne per day flotation mill (two products) with the following breakdown as shown
in Table 18-9.
Table
18-9: Process Operating Cost Estimate Summary
| Area |
%
of Total |
US$/st
mill feed |
| Equipment
Operation |
19% |
1.67 |
| Supplies |
41% |
3.61 |
| Labor |
21% |
1.85 |
| Administration |
10% |
0.88 |
| Sundry |
9% |
0.79 |
| Total |
100% |
8.80 |
| | 18-7 | |
| Westwater Resources, Inc. | Coosa Graphite Project S-K 1300 Report | December 11, 2023 SLR Project No.: 138.20527.00002 |
| 18.2.3 | General
and Administrative |
G&A was calculated using an industry
rule of thumb of 10% of direct site operating costs (mining + processing) that resulted in $1.40/st mill feed ($1.54/tonne mill
feed) or $4.7 million per year over the LOM.
Estimated headcounts were derived from
MCS guidelines for a 11,000 stpd mining operation (10,000 tonne a day) and are presented in Table 18-10.
Table
18-10: Project Headcount Estimate
| Area |
Hourly |
Salary |
Total |
| Mining
(including Admin) |
59 |
23 |
82 |
| Processing
|
23 |
25 |
48 |
| Total
Headcount |
82 |
48 |
130 |
| | 18-8 | |
| Westwater Resources, Inc. | Coosa Graphite Project S-K 1300 Report | December 11, 2023 SLR Project No.: 138.20527.00002 |
The economic analysis contained in this
Initial Assessment summarized in this TRS is preliminary in nature and is based, in part, on Inferred Mineral Resources that are considered
too speculative geologically to have modifying factors applied to them that would enable them to be categorized as Mineral Reserves.
There is no certainty that economic forecasts on which this Initial Assessment is based will be realized.
| 19.1 | Base
Case (Indicated and Inferred Mineral Resources) |
The Project base case cash flow is based
on Indicated and Inferred Mineral Resources (the latter being 89% of the total).
An after-tax Cash Flow Projection has
been generated from the LOM production schedule and capital and operating cost estimates and is summarized in Table 19-1. A summary of
the key criteria is provided below.
| · | Mineralized
Material Inventory used for LOM planning: 72.7 Mst at 3.21% Cg with 2.33 Mst of contained
Cg (65.9 million tonnes at 3.21% Cg with 2.11 million tonnes contained Cg), 100% attributable
to Westwater. |
| · | An
average of 9,100 st (8,200 tonnes) mill feed per day mining from open pit for 4 Mst (3 million
tonnes) per year. |
| · | Mill
recovery averaging 92%. |
| · | 95%
C concentrate grade at 100% payable. |
| · | Average
annual Cg concentrate sales: 103,000 stpa (93,000 tonnes per year) |
| · | Graphite
price (CIF Kellyton Plant): US$998/st ($1,100/tonne). |
| · | Transport
to Kellyton Plant (CIF): $10.69/st ($11.90/tonne) derived from 70 mile round trip at $0.17/ton
-mile |
| · | Pre-production
period: 24 months |
| · | LOM
production plan as summarized in Table 13-2. |
| · | Mine
life capital totals $293 million, including $142 million of sustaining capital. |
| · | Final
end of mine reclamation and closure costs: $43 million |
| · | Average
operating cost over the mine life is $15.41/st milled ($16.99/tonne milled). |
| 19.1.1.3 | Taxation
and Royalties |
| · | Royalties:
Merchant 0.5% NSR up to a maximum of $150,000; Lessor 2% NSR. |
| · | Coosa
County Severance Tax: $5/st concentrate ($5.51/tonne) |
| | 19-1 | |
| Westwater Resources, Inc. | Coosa Graphite Project S-K 1300 Report | December 11, 2023 SLR Project No.: 138.20527.00002 |
| · | 10
year Modified Accelerated Cost Recovery System (MACRS) depreciation method was used with
total allowance of $286.3 million taken during the LOM |
| · | Percentage
depletion method (14% for graphite) was used with total allowance of $305.4 million taken
during the LOM |
| · | Loss
Carry Forwards - Income tax losses may be carried forward indefinitely but may not be used
for prior tax years |
| · | Federal
tax rate of 21%, Alabama state income tax rate of 6.5% |
Table 19-1 presents a summary of the
Project Base Case economics at an Cg price of $998/st ($1,110/tonne). The full annual cash flow model is presented in Appendix 2 of this
TRS. On a pre-tax basis, the undiscounted cash flow totals $714.1 million over the mine life. The pre-tax net present value (NPV) at
an 8% discount rate is $229.2 million and pre-tax Internal Rate of Return (IRR) is 26.7%. On an after-tax basis for the base case, the
undiscounted cash flow totals $608.2 million over the mine life. The after-tax NPV at an 8% discount rate is $190.2 million and the after-tax
IRR is 24.2%.
| | 19-2 | |
| Westwater Resources, Inc. | Coosa Graphite Project S-K 1300 Report | December 11, 2023 SLR Project No.: 138.20527.00002 |
Table
19-1: After-Tax Base Case Cash Flow Summary
| Item |
Unit |
Value |
| Cg
Price |
$/st |
998 |
| Cg
Concentrate Sales |
Mst |
2.26 |
| Total
Gross Revenue |
US$
M |
2,254 |
| Mining
Costs |
US$
M |
(379) |
| Processing
Costs |
US$
M |
(639) |
| G&A
Costs |
US$
M |
(102) |
| Product
Transport to Kellyton Plant Cost |
US$
M |
(28) |
| Production
Taxes/Royalties |
US$
M |
(56) |
| Total
Operating Costs |
US$
M |
(1,204) |
| Operating
Margin |
US$
M |
1,050 |
| Operating
Margin |
US$
M |
48% |
| Corporate
Income Tax |
US$
M |
(139) |
| Operating
Cash Flow |
US$
M |
911 |
| Development
Capital |
US$
M |
(152) |
| Sustaining
Capital |
US$
M |
(142) |
| Final
Closure/Reclamation |
US$
M |
(43) |
| Total
Capital |
US$
M |
(336) |
| |
|
|
| Pre-tax
Free Cash Flow |
US$
M |
714.1 |
| Pre-tax
NPV @ 8% |
US$
M |
229.2 |
| Pre-tax
IRR |
% |
26.7 |
| |
|
|
| After-tax
Free Cash Flow |
US$
M |
608.2 |
| After-tax
NPV @ 8% |
US$
M |
190.2 |
| After-tax
IRR |
% |
24.2 |
| | 19-3 | |
| Westwater Resources, Inc. | Coosa Graphite Project S-K 1300 Report | December 11, 2023 SLR Project No.: 138.20527.00002 |
| 19.1.3 | Sensitivity
Analysis |
Project risks can be identified in both
economic and non-economic terms. Key economic risks were examined by running cash flow sensitivities:
Pre-tax IRR sensitivity over the base
case has been calculated for -20% to +20% variations. The sensitivities are shown in Table 19-2 and Figure 19-1 and Figure 19-2. The
Project is most sensitive to head grade, graphite price, and recovery, and only slightly less sensitive to operating cost and capital
cost. The sensitivities to metallurgical recovery, head grade, and metal price are nearly identical.
Table
19-2: After-Tax Sensitivity Analyses
| Variance |
Head
Grade
(% Cg) |
NPV
at 8%
(US$ millions) |
IRR |
| 80% |
2.57% |
48 |
12.9% |
| 90% |
2.89% |
119 |
18.9% |
| 100% |
3.21% |
190 |
24.2% |
| 110% |
3.53% |
261 |
29.1% |
| 120% |
3.85% |
332 |
33.8% |
| Variance |
Recovery
(%) |
NPV
at 8%
(US$ millions) |
IRR |
| 90% |
82.8% |
119 |
18.9% |
| 95% |
87.4% |
155 |
21.6% |
| 100% |
92.0% |
190 |
24.2% |
| 105% |
96.6% |
226 |
26.7% |
| 108% |
99.4% |
247 |
28.2% |
| Variance |
Metal
Prices
(US$/st Cg Concentrate) |
NPV
at 8%
(US$ millions) |
IRR |
| 80% |
$798
|
46 |
12.6% |
| 90% |
$898
|
118 |
18.8% |
| 100% |
$998
|
190 |
24.2% |
| 110% |
$1,097
|
262 |
29.2% |
| 120% |
$1,197
|
335 |
34.0% |
| | 19-4 | |
| Westwater Resources, Inc. | Coosa Graphite Project S-K 1300 Report | December 11, 2023 SLR Project No.: 138.20527.00002 |
| Variance |
Operating
Costs
(US$/st) |
NPV
at 8%
(US$ millions) |
IRR |
| 90% |
14.40 |
226 |
26.7% |
| 95% |
15.18 |
208 |
25.5% |
| 100% |
15.96 |
190 |
24.2% |
| 115% |
18.29 |
136 |
20.2% |
| 130% |
20.63 |
83 |
15.9% |
| Variance |
Capital
Costs
(US$ M) |
NPV
at 8%
(US$ M) |
IRR |
| 90% |
302 |
209 |
27.3% |
| 95% |
286 |
219 |
29.1% |
| 100% |
336 |
190 |
24.2% |
| 115% |
386 |
161 |
20.4% |
| 130% |
437 |
132 |
17.3% |
| |
|
|
|
Figure
19-1: After-Tax NPV Sensitivity Analysis

| | 19-5 | |
| Westwater Resources, Inc. | Coosa Graphite Project S-K 1300 Report | December 11, 2023 SLR Project No.: 138.20527.00002 |
Figure
19-2: After-Tax IRR Sensitivity Analysis
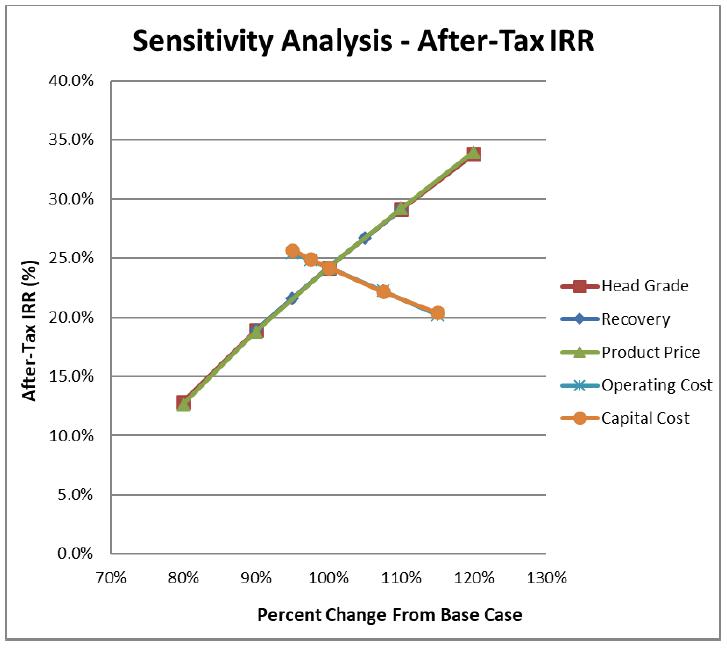
| 19.2 | Alternate
Case (Indicated Mineral Resources Only) |
Only 7 million tons or 11% of the 72.7
million tons in the base case production schedule are Indicated Mineral Resources. The QP has determined that a stand alone alternative
case with only Indicated resource tonnage is not economic using the assumptions and inputs outlined in the base case.
| | 19-6 | |
| Westwater Resources, Inc. | Coosa Graphite Project S-K 1300 Report | December 11, 2023 SLR Project No.: 138.20527.00002 |
This section is not applicable.
| | 20- 1 | |
| Westwater Resources, Inc. | Coosa Graphite Project S-K 1300 Report | December 11, 2023 SLR Project No.: 138.20527.00002 |
| 21.0 | Other
Relevant Data and Information |
No additional information or explanation
is necessary to make this TRS understandable and not misleading.
In late November 2018, Westwater
announced the discovery of significant concentrations of vanadium-bearing micas at several locations, hosted in the graphitic schists
at Coosa. Westwater subsequently commenced the first phase of a four-phase exploration program designed to determine the extent, character,
and quality of the vanadium mineralization at Coosa. As announced by the Company on February 19, 2019, the first phase demonstrated
widespread positive values for vanadium that extended beyond the Coosa graphite deposit.
| | 21-1 | |
| Westwater Resources, Inc. | Coosa Graphite Project S-K 1300 Report | December 11, 2023 SLR Project No.: 138.20527.00002 |
| 22.0 |
Interpretation and Conclusions |
SLR offers the following interpretations
and conclusions on the Project:
| 22.1 | Geology
and Mineral Resources |
| · | Graphite
generally occurs as a result of metamorphism (regional or contact) of organic matter in sediments.
Flake graphite is assumed to be derived from fine-grained sediments rich in organic matter. |
| · | Graphite
ores mined historically were almost entirely from the weathered zone (60 ft to 100 ft), partly
because weathering is deep in this area and partly because the weathered rock could be gently
crushed without blasting. |
| · | The
sample preparation, analysis, and security procedures at Coosa are adequate for use in the
estimation of Mineral Resources. |
| · | The
QA/QC programs as designed and implemented by Westwater and its predecessor AGC meet current
industry standard practice and the assay results within the database are suitable for use
in a Mineral Resource estimate. |
| · | No
significant database issues were identified and the SLR QP is of the opinion that the database
verification procedures for the Project comply with industry standards and are adequate for
the purposes of Mineral Resource estimation. |
| · | Relogging
of previously drilled holes in conjunction with new drilling information allowed for more
accurate interpretation and separation of lithologic units and improved understanding of
the geologic environment resulting in: |
| o | Improved
geologic model correlation to the 2014 Airborne Magnetic survey. |
| o | Identifying
widespread and strong vanadium (roscoelite) mineralization in very close association with
flake graphite mineralization. |
| · | The
Company has carried out an extensive geochemical sampling program to determine the presence
and intensity of vanadium mineralization at the Project. Vanadium potential tonnage and grade
are currently estimated to be 21.0 Mst to 67.0 Mst and 0.19% V2O5 to
0.13% V2O5, respectively. SLR notes that the potential quantity and
grade are conceptual in nature, there has been insufficient exploration to define a Mineral
Resource, and it is uncertain if further exploration will result in the target being delineated
as a Mineral Resource. |
| · | There
are no current Mineral Reserves at the Project. |
| · | Open
pit shovel and truck mining method is proposed for operations. |
| · | A
marginal cut-off grade of 2.1365% Cg is calculated based on a US$806/st graphite concentrate
price that results from applying a revenue factor of 0.8 to the Whittle pit shell parameters. |
| · | The
open pit optimization final pit selection is representative of a scenario that maximizes
NPV. |
| | 22-1 | |
| Westwater Resources, Inc. | Coosa Graphite Project S-K 1300 Report | December 11, 2023 SLR Project No.: 138.20527.00002 |
| ○ | Selecting
a revenue factor of 0.80 essentially means that the base case graphite price has been scaled
down, resulting in a smaller pit shell, which means that lower mineralization tonnages at
higher grades are mined, leading to an improved NPV. |
| · | Total
mineralized material inventory for the Coosa Project is 72.7 Mst at a grade of 3.21% Cg. |
| · | A
conceptual production schedule based on optimized pit shells is developed with an annual
ore production of 3.33 Mst over a 22 year period with a waste to ore (W:O) stripping ratio
of 0.21:1. |
| · | Mining
costs and equipment are based on Infomine 2021 Edition for similar capacity surface mines,
and escalated based on the MCS indexes provided by Infomine April 2023 edition. |
| 22.3 | Mineral
Processing and Metallurgical Testing |
| · | The
Coosa graphite concentrator facilities are designed to process a nominal 3.201 Mstpa, or
8,771 stpd of ROM Cg ore to produce an average of 99,207 stpa (90,000 tonnes per year) of
flotation concentrate product grading 95% Cg. The projected recovery of Cg to concentrate
is 92% into a concentrate mass of 3.1% of the feed tonnage. |
| · | The
proposed processing plant flowsheet consists of conventional crushing, rod milling and ball
milling, flash flotation, conventional rougher flotation, and two stages of polishing grinding,
cleaner column and conventional scavenger flotation circuits. The critical stages to achieve
the required high concentrate grades and coarse flake sizes are the multistage polishing
and cleaning flotation operations. |
| 22.4 | Environmental
Studies, Permitting, and Plans, Negotiations, or Agreements with Local Individuals or Groups |
| · | The
primary permits anticipated for the Project are a PoO and associated ROD issued by the USACOE
and the Surface Mining of Non-fuel Minerals Permit and Plan of Reclamation issued by the
Alabama Department of Labor. Baseline studies will be required to support these and other
permitting efforts. |
| · | Stakeholder
engagement, including regulatory agencies, tribal entities, and the community will also be
required to support the permitting efforts. |
| | 22-2 | |
| Westwater Resources, Inc. | Coosa Graphite Project S-K 1300 Report | December 11, 2023 SLR Project No.: 138.20527.00002 |
Westwater is considering a program to
advance the Project, which includes an initial budget estimate of approximately US$1,600,000, as presented in Table 23-1. SLR concurs
with this program. The program consists of two consecutive phases: (1) updating Mineral Resources following completion of the proposed
delineation drilling programs, and (2) carrying out engineering studies to advance the Project to a PFS level. The PFS will cover
the following activities:
| · | metallurgical
test work, pilot plant, product testing |
| · | preliminary
environmental testing to identify any major deleterious elements and quantify the acid-generating
potential of the Coosa mineralization. |
| · | geotechnical
and hydrogeological studies |
| · | tailings
management facility design, material characterization and site geotechnical |
| · | environmental
management studies and data collection |
| · | capital
and operating cost estimation |
| · | infrastructure
evaluation and costing |
| · | project
management and administration |
| 1 | Complete
six-phase infill/delineation drilling activities in the NX, Fixico Mine, SW, Main Grid, Main
Grid/Fixico Mine and HS South areas of the Project to convert Inferred oxide resources to
the Indicated Mineral Resources category. This work is expected to require approximately
115 drill holes and 1,700 assays. The phased drilling programs are independent of each other
and can be conducted simultaneously or on an individual basis. The estimated cost to complete
the program is $936,000. |
| 2 | Drill
additional holes down dip and review the classification criteria as more data become available. |
| 23.2 | Advancement
of Coosa Graphite Mineral Resources |
| 1 | Complete
a PFS of the Project and update the S-K 1300 TRS accordingly after completion of the exploration
drilling program. |
| 2 | Revisit
and update mining and processing costs and recalculate cut-off grade. |
| 3 | Revisit
and update the Whittle pit with new cost parameters. |
| | 23-1 | |
| Westwater Resources, Inc. | Coosa Graphite Project S-K 1300 Report | December 11, 2023 SLR Project No.: 138.20527.00002 |
Table
23-1: 2024 Proposed Drilling Budget
| Category |
Item |
Number
of Drill
Holes/Assay |
Total
Feet
Drilled |
Unit
Cost
(US$/ft) |
Budget
(US$) |
| Delineation
Drilling |
Phase
1 - NX Area |
25 |
1,600 |
100 |
160,000 |
| |
Phase
2 - Fixico Mine Area |
35 |
2,300 |
100 |
230,000 |
| |
Phase
3 - SWX Area |
15 |
1,200 |
100 |
120,000 |
| |
Phase
4 - Main Grid Area |
15 |
1,200 |
100 |
120,000 |
| |
Phase
5 - Main Grid/Fixico Mine Area |
15 |
1,300 |
100 |
130,000 |
| |
Phase
6 - HS South Area |
10 |
700 |
100 |
70,000 |
| Laboratory
Assay |
ActLabs
(primary - 5ft interval) |
1,600 |
|
50 |
80,000 |
| |
SGS
Labs (secondary - 25% primary) |
400 |
|
65 |
26,000 |
| Total
Delineation Drilling |
|
|
|
|
936,000 |
| Advance
Project |
PFS |
|
|
|
600,000 |
| Grand
Total |
|
|
|
|
1,536,000 |
| 23.3 | Environmental
Studies, Permitting, and Plans, Negotiations, or Agreements with Local Individuals or Groups |
| 1. | Complete
baseline studies required for the permitting of the Project. |
| 2. | Engage
stakeholders including federal, state and local regulatory agencies as well as non-regulatory
stakeholders such as adjacent property owners, tribal entities and local communities. |
| | 23-2 | |
| Westwater Resources, Inc. | Coosa Graphite Project S-K 1300 Report | December 11, 2023 SLR Project No.: 138.20527.00002 |
AACE
International, 2012. Cost Estimate Classification System – As Applied in the Mining and Mineral Processing Industries, AACE International
Recommended Practice No. 47R-11, 17 p.
AGP Mining
Consultants Inc., 2015, Alabama Graphite Corp. Coosa Graphite Project, Alabama, USA. Preliminary Economic Assessment, Effective and Issue
Date November 27, 2015, 267 p.
Benchmark
Mineral Intelligence Limited, 2023, Westwater Basket Pricing Scenarios – North America.
Brown,
J.S., 1925, Graphite Deposits of Ashland, Alabama. Economic geology, Vol. 20, pp. 208-248.
Cameron,
E. N., and Weiss, P. L., 1960, Strategic Graphite Survey. US Geological Survey Bulletin No. 1082E.
Clemmer,
J. B., Smith, R. W., Clemmons, B. H., and Stacy, R. H., 1941, Flotation of Weathered Alabama Graphite Schists for Crucible Flake. Alabama
Geological Survey, Bulletin No. 49, 101 p.
Dubé,
J., 2014, Technical Report: Heliborne Magnetic, Spectrometric and TDEM Survey, Coosa Project, Coosa and Chilton Counties, Alabama, 2014.
Report by Dubé & Desaulniers Geoscience, Ottawa, Ontario for Alabama Graphite Corp., April 2014, 97 p.
Durgin,
D., 2013, Updated Technical Report, Coosa Graphite Project, Coosa County, Alabama, USA. NI 43-101 Technical Report for Alabama Graphite
Corp., February 25, 2013, 54 p.
Landres
Management Consultants, 2021, Preliminary Title Review dated May 2021 and prepared by Deborah L. S. Goetz for Sections 3, 4, 5,
7, 8 and 9, Township 22 N, range 17 E.
Greenan,
D., 2022, Coosa project geologic observations to date, NX, Main Grid, SW Extension, Fixico, and HS areas, internal memorandum, April 20,
2022, 10 p.
Hatcher,
R.D., Jr., 2010, The Appalachian orogen: A brief summary. In: Tollo, R.P., Bartholomew, M.J., Hibbard, J.P., and Karabinos, P.M.,
eds. From Rodinia to Pangea: The Lithotectonic Record of the Appalachian Region. Geological Society of America Memoir 206, pp. 1-19.
Jones,
W. B., 1929, Summary Report on Graphite in Alabama. Alabama Geological Survey, Circular No. 9.
Landis,
C. A., 1971. Graphitization of dispersed carbonaceous material in metamorphic rocks. Contributions to Mineralogy and Petrology, Vol.
30, pp. 34-45.
Goetz,
D. L. S., 2021, Preliminary Title Review, Alabama Graphite, Coosa County, Alabama prepared for Westwater Resources, Inc. (WWR),
Landres Management Consultants, May 23, 2021, 291p.
Mining
Cost Service, 2021, Cost Models, InfoMine USA, Inc. Flotation – Two Products, p. CM 149.
Mining
Cost Service, 2021, Cost Models, InfoMine USA, Inc. Surface Mine, p. CM 13.
| | 24-1 | |
| Westwater Resources, Inc. | Coosa Graphite Project S-K 1300 Report | December 11, 2023 SLR Project No.: 138.20527.00002 |
Mitchell, D. J., 1993. Industrial
Minerals Laboratory Manual: Flake Graphite. British Geological Survey Technical Report No. WG/92/30, 35 p.
Osborne,
W.E., Szabo, E.W., Copeland, C.W., Jr., and Neathery, T.L., 1992, Geologic Map of Alabama, Geological Society of Alabama, Special
Map 232, 1:1,000,000, web image
Pallister,
H. D., and Thoenen, J. R., 1948. Flake Graphite and Vanadium Investigations in Clay, Coosa and Chilton Counties, Alabama. US Bureau of
Mines, Report of Investigations No. 4366, 84 p.
Raymond,
D. E., Osborne, W. E., Copeland, C. W., and Neathery, T. L., 1988, Alabama Stratigraphy. Geological Survey of Alabama, Circular No. 140,
97 p.
US Securities
and Exchange Commission, 2018: Regulation S-K, Subpart 229.1300, Item 1300 Disclosure by Registrants Engaged in Mining Operations
and Item 601 (b)(96) Technical Report Summary.
| | 24-2 | |
| Westwater Resources, Inc. | Coosa Graphite Project S-K 1300 Report | December 11, 2023 SLR Project No.: 138.20527.00002 |
| 25.0 | Reliance
on Information Provided by the Registrant |
This TRS has been prepared by SLR for
Westwater. The information, conclusions, opinions, and estimates contained herein are based on:
| · | Information
available to SLR at the time of preparation of this TRS. |
| · | Assumptions,
conditions, and qualifications as set forth in this TRS. |
| · | Data,
reports, and other information supplied by Westwater and other third party sources. |
For the purpose of this TRS, SLR has
relied on ownership information provided by Westwater in a legal opinion by Landres Management Consultants dated May 23, 2021, entitled
Preliminary Title Review, Alabama Graphite, Coosa County, Alabama (Goetz, 2021). SLR has relied on this information in Section 3
and SLR has not researched property title or mineral rights for the Coosa Project as we consider it reasonable to rely on Westwater’s
legal counsel who is responsible for maintaining this information.
The Qualified Persons have taken all
appropriate steps, in their professional opinion, to ensure that the above information from Westwater is sound.
Except as provided by applicable laws,
any use of this TRS by any third party is at that party’s sole risk.
| | 25-1 | |
| Westwater Resources, Inc. | Coosa Graphite Project S-K 1300 Report | December 11, 2023 SLR Project No.: 138.20527.00002 |
| 26.0 | Date
and Signature Page |
This report titled “Technical
Report Summary on the Coosa Project, Coosa County, Alabama, USA” with an effective date of September 30, 2023 was prepared
and signed by:
|
Signed SLR International
Corporation
|
| |
|
Dated at Lakewood, CO
December 11, 2023 |
SLR
International Corporation |
| | 26-1 | |
| Westwater Resources, Inc. | Coosa Graphite Project S-K 1300 Report | December 11, 2023 SLR Project No.: 138.20527.00002 |
| 27.1 | Zenith
Quotation for 500 tph Graphite Line |
| | 27-1 | |
| Westwater Resources, Inc. | Coosa Graphite Project S-K 1300 Report | December 11, 2023 SLR Project No.: 138.20527.00002 |
| 28.1 | SLR
Cash Flow Summary Tables |
| | 28-1 | |
| Westwater Resources, Inc. | Coosa Graphite Project S-K 1300 Report | December 11, 2023 SLR Project No.: 138.20527.00002 |
Table 2828-1: Coosa
IA Base Case Cash Flow Summary – US Customary Units
Replace with PDF in N:Toronto_RPAActive
Projects3859 - Westwater Resources Inc - Coosa DepositFinal ReportFinal PDF Figures
| | 28-2 | |
| Westwater Resources, Inc. | Coosa Graphite Project S-K 1300 Report | December 11, 2023 SLR Project No.: 138.20527.00002 |
Table 28-2: Coosa
IA Base Case Cash Flow Summary – Metric Units
Replace with PDF in N:Toronto_RPAActive
Projects3859 - Westwater Resources Inc - Coosa Deposit Final ReportFinal PDF Figures
| | 28-3 | |
| Westwater Resources, Inc. | Coosa Graphite Project S-K 1300 Report | December 11, 2023 SLR Project No.: 138.20527.00002 |

Exhibit 99.1

Westwater Announces Availability
of an Initial Assessment with Economic Analysis for the Coosa Graphite Deposit
Estimated Pre-tax NPV of $229 Million and Pre-tax
IRR of 26.7%
Coosa is the Largest, Most Advanced Graphite
Deposit in the Contiguous U.S.
Centennial, CO – December 13, 2023:
Westwater Resources, Inc. (“Westwater” or the “Company”) (NYSE American: WWR), an energy technology and battery-grade
natural graphite development company, today announced the availability of an Initial Assessment, with an economic analysis (“IA”),
for the Company’s Coosa Graphite Deposit located in Coosa County, Alabama (the “Coosa Deposit”).
Frank Bakker, President and Chief Executive
Officer of Westwater, stated “The Coosa Deposit is an important asset, not only to Westwater, but we believe a critical asset
to the future domestic graphite supply chain. We believe that our Coosa Deposit is the largest and most advanced natural graphite
deposit in the lower 48 states. With estimated pre-tax NPV of $229 million, estimated pre-tax internal rate of return of 26.7%, and
estimated free cash flow of $714 million, the Coosa Deposit continues to be an attractive asset for Westwater and its
stockholders.”
“The IA was based on drilling results from
less than 10% of the Coosa Deposit acreage and did not consider any potential benefit from vanadium previously discovered, resulting in
an estimated pre-tax NPV that is 6x greater than the market cap of Westwater as of December 12, 2023,” concluded Mr. Bakker. “We believe
there is the potential for additional value creation at the Coosa Deposit through expansion to supply Westwater’s graphite concentrate
needs for many years as well as the broader North American graphite industry that is under development. Westwater has begun a process
to seek strategic investments to explore, develop, and unlock the potential additional value at the Coosa Deposit,” stated Mr. Bakker.
The IA was completed as a Technical Report Summary
(“TRS”), disclosing Mineral Resources, including an economic analysis, for the Coosa Deposit, in accordance with SK-1300.
The TRS was completed on behalf of Westwater by SLR International Corporation (“SLR”) with an effective date of December 11,
2023, and filed by Westwater on Form 8-K with the Securities and Exchange Commission (“SEC”) on December 13, 2023.
SLR qualifies as a Qualified Person as defined under Item 1302 of Regulation S-K.
Background:
| · | As a U.S. domestic and domiciled
company, Westwater reports all mineral resources in accordance with Item 1300 of Regulation S-K (“S-K 1300”); |
| · | S-K 1300 was adopted by the
SEC to modernize mineral property disclosure requirements for mining registrants and to align U.S. disclosure requirements more closely
for mineral properties with current industry and global regulatory standards. |
About the Coosa Deposit
The Coosa Deposit is located at the southern end
of the Appalachian Mountain range in the western part of Coosa County, Alabama. The deposit area is approximately 50 miles south-southeast
of the city of Birmingham and 23 miles south-southwest of the town of Sylacauga. Westwater holds the mineral rights to approximately 41,965
acres under a long-term lease. The Coosa Deposit is located in the flake graphite belt of central Alabama, also known as the Alabama Graphite
Belt, in parts of townships T. 21 N., T. 22 N., T. 23 N., and T. 24 N. and ranges R. 16 E., R. 17 E., R. 18 E., and R. 19 E.
This TRS was prepared to add an economic analysis
update to the previously completed TRS by SLR, with an effective date of November 30, 2022 (the “2022 TRS”). The Mineral
Resource estimate reported in the 2022 TRS remains unchanged. The Mineral Resource estimate in the 2022 TRS is based on 205 drill holes
totaling 39,434 ft. Based on a 1.98% graphitic carbon (Cg) cut-off grade Indicated Mineral Resources total 26.0 million short tons (Mst)
at an average grade of 2.89% Cg for a total of 754,000 short tons (st) Cg. Inferred Mineral Resources are estimated as 97.0 Mst at an
average grade of 3.08% Cg for a total of 3.0 Mst Cg.
Mineral Resources
The TRS and IA were prepared in accordance with
the regulations set forth in S-K 1300 with the objective of disclosing the Mineral Resources at the Coosa Deposit, with an economic
analysis. Based on the density of drilling, continuity of geology and mineralization, testing, and data verification, the Mineral Resource
estimates meet the criteria for Indicated or Inferred Mineral Resources as summarized in the TRS and IA.
Estimated Mineral Resources, as initially reporting
in the 2022 TRS, are summarized in the following table for Indicated and Inferred Mineral Resources, respectively, at a 1.98% Cg cut-off
grade. Mineral Resources were estimated separately for each mineralized horizon. Mineral Resources are not Mineral Reserves
and do not have demonstrated economic viability. However, considerations of reasonable prospects for economic extraction were applied
to the Mineral Resource calculations within the TRS.
| Classification |
Redox
Boundary |
Tonnage
(Mst) |
Grade Cg
(%) |
Contained Cg
(Mlb) |
Contained Cg
(000 st) |
Recovery
(%) |
| Total Indicated |
|
26 |
2.89 |
1,509 |
754 |
87.4 |
| Total Inferred |
|
97 |
3.08 |
5,996 |
2,998 |
87.4 |
Notes:
| 1. | The S-K 1300 definitions were followed for Mineral Resources. |
| 2. | Mineral Resources are constrained within a Whittle pit shell using a cut-off grade of 1.98% Cg. |
| 3. | Mineral Resources are estimated using a long-term graphite price of US$1,100/st. |
| 4. | Bulk density ranges from 1.68 t/m3 to 3.03 t/m3 (0.05 st/ft3 to 0.09 st/ft3). |
| 5. | Mining dilution equals 5.0%. |
| 6. | Mineral Resources are not Mineral Reserves and do not have demonstrated economic viability. |
| 7. | Numbers may not sum due to rounding. |
| 8. | Mineral Resources are 100% attributable to Westwater. |
Preliminary Economic Analysis – Base
Case
The estimated base case economics in the IA is
based on Indicated (11%) and Inferred (89%) Mineral Resources. The following table presents a summary of results for the estimated base
case.
| Item |
Unit |
Value |
| Cg Price |
$/st |
998 |
| Cg Concentrate Sales |
Mst |
2.26 |
| Total Gross Revenue |
US$ M |
2,254 |
| Total Operating Costs |
US$ M |
(1,204) |
| Operating Margin |
US$ M |
1,050 |
| Development Capital |
US$ M |
(152) |
| Sustaining Capital |
US$ M |
(142) |
| Final Closure/Reclamation |
US$ M |
(43) |
| Total Capital |
US$ M |
(336) |
| |
|
|
| Pre-tax Free Cash Flow |
US$ M |
714.1 |
| Pre-tax NPV @ 8% discount rate |
US$ M |
229.2 |
| Pre-tax IRR |
% |
26.7 |
| After-tax Free Cash Flow |
US$ M |
608.2 |
| After-tax NPV @ 8% |
US$ M |
190.2 |
| After-tax IRR |
% |
24.2 |
The above estimated base case economics in the IA was based on the
following key assumptions:
Revenue
| · | Mineralized Material Inventory used for life of mine (LOM)
planning: 72.7 Mst at 3.21% Cg with 2.33 Mst of contained Cg (65.9 million tonnes at 3.21% Cg with 2.11 million tonnes contained Cg),
100% attributable to Westwater |
| · | An average of 9,100 st (8,200 tonnes) mill feed per day
mining from open pit for 4 Mst (3 million tonnes) per year |
| · | Mill recovery averaging 92%. |
| · | 95% C concentrate grade at 100% payable |
| · | Average annual Cg concentrate sales: 103,000 stpa (93,000
tonnes per year) |
| · | Graphite price (CIF Kellyton Plant): US$998/st ($1,100/tonne) |
| · | Transport to Kellyton Plant (CIF): $10.69/st ($11.90/tonne) |
Costs
| · | Pre-production period: 24 months |
| · | Life of mine production plan as summarized in the TRS |
| · | Mine life capital totals $293 million, including $142 million
of sustaining capital |
| · | Final end of mine reclamation and closure costs: $43 million |
| · | Average operating cost over the mine life is $15.41/st milled
($16.99/tonne milled) |
Taxation and Royalties
| · | Royalties: Merchant 0.5% NSR up to a maximum of $150,000;
Lessor 2% NSR |
| · | Coosa County Severance Tax: $5/st concentrate ($5.51/tonne) |
| · | 10 year Modified Accelerated Cost Recovery System (MACRS)
depreciation method was used with total allowance of $286.3 million taken during the LOM |
| · | Percentage depletion method (14% for graphite) was used
with total allowance of $305.4 million taken during the LOM |
| · | Loss Carry Forwards - Income tax losses may be carried forward
indefinitely but may not be used for prior tax years |
| · | Federal tax rate of 21%, Alabama state income tax rate of
6.5% |
Readers are cautioned that the IA is preliminary in nature. It
includes Inferred Mineral Resources that are considered too speculative geologically to have modifying factors applied that would enable
to be categorized as Mineral Reserves. There is no certainty that the economic analysis in the IA will be realized. The technical information
in this news release has been reviewed by SLR, a Qualified Person as defined under Item 1302 of Regulation S-K.
About Westwater Resources, Inc.
Westwater
Resources, Inc. (NYSE American: WWR), an energy technology and battery-grade natural graphite development company, is focused on
developing battery-grade natural graphite. Westwater’s primary project is the Kellyton Graphite Plant that is under construction
in east-central Alabama. In addition, Westwater’s Coosa Graphite Deposit is the most advanced natural flake graphite deposit in
the contiguous United States and located across 41,965 acres (~17,000 hectares) in Coosa County, Alabama. www.westwaterresources.net.
Cautionary Statement Regarding Forward-Looking
Statements
This news release contains
forward-looking statements within the meaning of the Private Securities Litigation Reform Act of 1995. Forward-looking statements are
subject to risks, uncertainties and assumptions and are identified by words such as “believes,” “estimated,” “continues,”
“potential,” “prospects,” and other similar words. Forward looking statements in this release include, among other
things: the conclusions made in the IA for the Coosa Deposit; the quantity and grade of resources included in resource estimates;
the accuracy and achievability of projections included in the IA; the Company’s ability to carry on exploration and development
activities; and the price of graphite. Westwater has completed an IA to define the graphite resource, including economic analysis,
at its Coosa Deposit in accordance with applicable SEC regulations, including S-K 1300. Pursuant to S-K 1300, mineral resources are not
mineral reserves and do not have demonstrated economic viability. The Company’s mineral resource estimates, including estimates
of the graphite resource, are based on many factors, including assumptions regarding extraction rates and duration of mining operations,
and the quality of in-place resources. Accordingly, there is no certainty that all or any part of the economic analysis or graphite mineral
resource identified by Westwater’s IA will be converted into one or more economically extractable mineral reserves. Westwater cautions
that there are a number of important factors that could cause actual results to differ materially from the forward-looking information
that has been provided. Investors are cautioned not to put undue reliance on this forward-looking information, which is not a guarantee
of future performance and is subject to a number of uncertainties and other factors, many of which are outside the control of Westwater;
accordingly, there can be no assurance that such suggested results will be realized. Additional risks facing Westwater‘s future
prospects are discussed in the Westwater Resources, Inc. Annual Report on Form 10-K for the year ended December 31, 2022,
and subsequent securities filings.
Contacts
Westwater Resources, Inc.
Email: Info@WestwaterResources.net
Investor
Relations
Email: Investorrelations@westwaterresources.net
####
v3.23.3
Cover
|
Dec. 11, 2023 |
| Cover [Abstract] |
|
| Document Type |
8-K
|
| Amendment Flag |
false
|
| Document Period End Date |
Dec. 11, 2023
|
| Entity File Number |
001-33404
|
| Entity Registrant Name |
WESTWATER RESOURCES, INC.
|
| Entity Central Index Key |
0000839470
|
| Entity Tax Identification Number |
75-2212772
|
| Entity Incorporation, State or Country Code |
DE
|
| Entity Address, Address Line One |
6950 S. Potomac Street
|
| Entity Address, Address Line Two |
Suite 300
|
| Entity Address, City or Town |
Centennial
|
| Entity Address, State or Province |
CO
|
| Entity Address, Postal Zip Code |
80112
|
| City Area Code |
303
|
| Local Phone Number |
531-0516
|
| Written Communications |
false
|
| Soliciting Material |
false
|
| Pre-commencement Tender Offer |
false
|
| Pre-commencement Issuer Tender Offer |
false
|
| Title of 12(b) Security |
Common Stock, $0.001 par value
|
| Trading Symbol |
WWR
|
| Security Exchange Name |
NYSEAMER
|
| Entity Emerging Growth Company |
false
|
| X |
- DefinitionBoolean flag that is true when the XBRL content amends previously-filed or accepted submission.
| Name: |
dei_AmendmentFlag |
| Namespace Prefix: |
dei_ |
| Data Type: |
xbrli:booleanItemType |
| Balance Type: |
na |
| Period Type: |
duration |
|
| X |
- DefinitionFor the EDGAR submission types of Form 8-K: the date of the report, the date of the earliest event reported; for the EDGAR submission types of Form N-1A: the filing date; for all other submission types: the end of the reporting or transition period. The format of the date is YYYY-MM-DD.
| Name: |
dei_DocumentPeriodEndDate |
| Namespace Prefix: |
dei_ |
| Data Type: |
xbrli:dateItemType |
| Balance Type: |
na |
| Period Type: |
duration |
|
| X |
- DefinitionThe type of document being provided (such as 10-K, 10-Q, 485BPOS, etc). The document type is limited to the same value as the supporting SEC submission type, or the word 'Other'.
| Name: |
dei_DocumentType |
| Namespace Prefix: |
dei_ |
| Data Type: |
dei:submissionTypeItemType |
| Balance Type: |
na |
| Period Type: |
duration |
|
| X |
- DefinitionAddress Line 1 such as Attn, Building Name, Street Name
| Name: |
dei_EntityAddressAddressLine1 |
| Namespace Prefix: |
dei_ |
| Data Type: |
xbrli:normalizedStringItemType |
| Balance Type: |
na |
| Period Type: |
duration |
|
| X |
- DefinitionAddress Line 2 such as Street or Suite number
| Name: |
dei_EntityAddressAddressLine2 |
| Namespace Prefix: |
dei_ |
| Data Type: |
xbrli:normalizedStringItemType |
| Balance Type: |
na |
| Period Type: |
duration |
|
| X |
- Definition
+ References
+ Details
| Name: |
dei_EntityAddressCityOrTown |
| Namespace Prefix: |
dei_ |
| Data Type: |
xbrli:normalizedStringItemType |
| Balance Type: |
na |
| Period Type: |
duration |
|
| X |
- DefinitionCode for the postal or zip code
| Name: |
dei_EntityAddressPostalZipCode |
| Namespace Prefix: |
dei_ |
| Data Type: |
xbrli:normalizedStringItemType |
| Balance Type: |
na |
| Period Type: |
duration |
|
| X |
- DefinitionName of the state or province.
| Name: |
dei_EntityAddressStateOrProvince |
| Namespace Prefix: |
dei_ |
| Data Type: |
dei:stateOrProvinceItemType |
| Balance Type: |
na |
| Period Type: |
duration |
|
| X |
- DefinitionA unique 10-digit SEC-issued value to identify entities that have filed disclosures with the SEC. It is commonly abbreviated as CIK. Reference 1: http://www.xbrl.org/2003/role/presentationRef
-Publisher SEC
-Name Exchange Act
-Number 240
-Section 12
-Subsection b-2
| Name: |
dei_EntityCentralIndexKey |
| Namespace Prefix: |
dei_ |
| Data Type: |
dei:centralIndexKeyItemType |
| Balance Type: |
na |
| Period Type: |
duration |
|
| X |
- DefinitionIndicate if registrant meets the emerging growth company criteria. Reference 1: http://www.xbrl.org/2003/role/presentationRef
-Publisher SEC
-Name Exchange Act
-Number 240
-Section 12
-Subsection b-2
| Name: |
dei_EntityEmergingGrowthCompany |
| Namespace Prefix: |
dei_ |
| Data Type: |
xbrli:booleanItemType |
| Balance Type: |
na |
| Period Type: |
duration |
|
| X |
- DefinitionCommission file number. The field allows up to 17 characters. The prefix may contain 1-3 digits, the sequence number may contain 1-8 digits, the optional suffix may contain 1-4 characters, and the fields are separated with a hyphen.
| Name: |
dei_EntityFileNumber |
| Namespace Prefix: |
dei_ |
| Data Type: |
dei:fileNumberItemType |
| Balance Type: |
na |
| Period Type: |
duration |
|
| X |
- DefinitionTwo-character EDGAR code representing the state or country of incorporation.
| Name: |
dei_EntityIncorporationStateCountryCode |
| Namespace Prefix: |
dei_ |
| Data Type: |
dei:edgarStateCountryItemType |
| Balance Type: |
na |
| Period Type: |
duration |
|
| X |
- DefinitionThe exact name of the entity filing the report as specified in its charter, which is required by forms filed with the SEC. Reference 1: http://www.xbrl.org/2003/role/presentationRef
-Publisher SEC
-Name Exchange Act
-Number 240
-Section 12
-Subsection b-2
| Name: |
dei_EntityRegistrantName |
| Namespace Prefix: |
dei_ |
| Data Type: |
xbrli:normalizedStringItemType |
| Balance Type: |
na |
| Period Type: |
duration |
|
| X |
- DefinitionThe Tax Identification Number (TIN), also known as an Employer Identification Number (EIN), is a unique 9-digit value assigned by the IRS. Reference 1: http://www.xbrl.org/2003/role/presentationRef
-Publisher SEC
-Name Exchange Act
-Number 240
-Section 12
-Subsection b-2
| Name: |
dei_EntityTaxIdentificationNumber |
| Namespace Prefix: |
dei_ |
| Data Type: |
dei:employerIdItemType |
| Balance Type: |
na |
| Period Type: |
duration |
|
| X |
- DefinitionLocal phone number for entity.
| Name: |
dei_LocalPhoneNumber |
| Namespace Prefix: |
dei_ |
| Data Type: |
xbrli:normalizedStringItemType |
| Balance Type: |
na |
| Period Type: |
duration |
|
| X |
- DefinitionBoolean flag that is true when the Form 8-K filing is intended to satisfy the filing obligation of the registrant as pre-commencement communications pursuant to Rule 13e-4(c) under the Exchange Act. Reference 1: http://www.xbrl.org/2003/role/presentationRef
-Publisher SEC
-Name Exchange Act
-Number 240
-Section 13e
-Subsection 4c
| Name: |
dei_PreCommencementIssuerTenderOffer |
| Namespace Prefix: |
dei_ |
| Data Type: |
xbrli:booleanItemType |
| Balance Type: |
na |
| Period Type: |
duration |
|
| X |
- DefinitionBoolean flag that is true when the Form 8-K filing is intended to satisfy the filing obligation of the registrant as pre-commencement communications pursuant to Rule 14d-2(b) under the Exchange Act. Reference 1: http://www.xbrl.org/2003/role/presentationRef
-Publisher SEC
-Name Exchange Act
-Number 240
-Section 14d
-Subsection 2b
| Name: |
dei_PreCommencementTenderOffer |
| Namespace Prefix: |
dei_ |
| Data Type: |
xbrli:booleanItemType |
| Balance Type: |
na |
| Period Type: |
duration |
|
| X |
- DefinitionTitle of a 12(b) registered security. Reference 1: http://www.xbrl.org/2003/role/presentationRef
-Publisher SEC
-Name Exchange Act
-Number 240
-Section 12
-Subsection b
| Name: |
dei_Security12bTitle |
| Namespace Prefix: |
dei_ |
| Data Type: |
dei:securityTitleItemType |
| Balance Type: |
na |
| Period Type: |
duration |
|
| X |
- DefinitionName of the Exchange on which a security is registered. Reference 1: http://www.xbrl.org/2003/role/presentationRef
-Publisher SEC
-Name Exchange Act
-Number 240
-Section 12
-Subsection d1-1
| Name: |
dei_SecurityExchangeName |
| Namespace Prefix: |
dei_ |
| Data Type: |
dei:edgarExchangeCodeItemType |
| Balance Type: |
na |
| Period Type: |
duration |
|
| X |
- DefinitionBoolean flag that is true when the Form 8-K filing is intended to satisfy the filing obligation of the registrant as soliciting material pursuant to Rule 14a-12 under the Exchange Act. Reference 1: http://www.xbrl.org/2003/role/presentationRef
-Publisher SEC
-Name Exchange Act
-Section 14a
-Number 240
-Subsection 12
| Name: |
dei_SolicitingMaterial |
| Namespace Prefix: |
dei_ |
| Data Type: |
xbrli:booleanItemType |
| Balance Type: |
na |
| Period Type: |
duration |
|
| X |
- DefinitionTrading symbol of an instrument as listed on an exchange.
| Name: |
dei_TradingSymbol |
| Namespace Prefix: |
dei_ |
| Data Type: |
dei:tradingSymbolItemType |
| Balance Type: |
na |
| Period Type: |
duration |
|
| X |
- DefinitionBoolean flag that is true when the Form 8-K filing is intended to satisfy the filing obligation of the registrant as written communications pursuant to Rule 425 under the Securities Act. Reference 1: http://www.xbrl.org/2003/role/presentationRef
-Publisher SEC
-Name Securities Act
-Number 230
-Section 425
| Name: |
dei_WrittenCommunications |
| Namespace Prefix: |
dei_ |
| Data Type: |
xbrli:booleanItemType |
| Balance Type: |
na |
| Period Type: |
duration |
|
Westwater Resources (AMEX:WWR)
Historical Stock Chart
From Mar 2024 to Apr 2024

Westwater Resources (AMEX:WWR)
Historical Stock Chart
From Apr 2023 to Apr 2024
