UNITED STATES
SECURITIES AND EXCHANGE COMMISSION
Washington, D.C. 20549
Form 6-K
REPORT OF FOREIGN PRIVATE ISSUER PURSUANT TO RULE 13a-16 OR 15d-16 UNDER THE SECURITIES EXCHANGE ACT OF 1934
For the month of November 2023
Commission File Number: 001-14642
ING Groep N.V.
(Translation of registrant's name into English)
Bijlmerdreef 106
1102 CT Amsterdam
The Netherlands
(Address of principal executive office)
Indicate by check mark whether the registrant files or will file annual reports under cover of Form 20-F or Form 40-F.
Form 20-F [ X ] Form 40-F [ ]
On November 2, 2023, the Registrant issued a press release, a copy of which is attached hereto as Exhibit 99.1 and is incorporated herein by reference.
(c) Exhibit 99.1. Press release dated November 2, 2023
SIGNATURES
Pursuant to the requirements of the Securities Exchange Act of 1934, the registrant has duly caused this report to be signed on its behalf by the undersigned, thereunto duly authorized.
| | | ING Groep N.V. |
| | | (Registrant) |
| | | |
| | | |
| Date: November 2, 2023 | | /s/ Raymond Vermeulen |
| | | Raymond Vermeulen |
| | | Head of External Communications & Media Relations |
| | | |
Exhibit 99.1

ING posts 3Q2023 net result of €1,982 million, driven by strong income in both Retail and Wholesale Banking Profit before tax increases significantly year - on - year to €2,866 million; CET1 ratio rises to 15.2% • Strong performance in both Retail and Wholesale Banking and 4 - quarter rolling RoE improves to 13.8% • Increase of 181,000 primary customers in the third quarter, with growth in almost all markets • Strong interest income combined with higher fee income • Operating expenses remain under control and risk costs are low, reflecting strong asset quality • Announcement of €2.5 billion share buyback programme as we continue to align our capital to our target level CEO statement “ING recorded another strong set of results in the third quarter of 2023, with net result more than doubling on the prior year", said Steven van Rijswijk, CEO of ING. “Notwithstanding the cooling economy and amid polarising geopolitical developments, which impacted business and consumer confidence, both our Retail and Wholesale Banking businesses posted strong results. Their interest income benefited from the positive rate environment and fee income also increased, especially in Retail Banking, driven by daily banking and investment products. “I’m proud that we gained another 181,000 primary customers to reach a total of 15.1 million. This growth occurred across almost all of our 10 retail markets, especially in Germany, Australia and Türkiye, further supporting our future value creation. Customers value our services, as shown in our net promoter scores, where we maintained our number one position in five of our 10 Retail Banking markets. A superior customer experience is a pillar of our ‘making the difference’ strategy. An example is digital onboarding. In many markets we now onboard most of our new retail customers fully digitally: 75% in the Netherlands, 72% in Australia and 63% in Germany – percentages that are all growing. “The cycle of recent central bank rate hikes, which helped the recovery of our profitability after a prolonged period of negative rates, appears to have paused. We are conscious of the public discussions on saving rates and, depending on developments in the competitive landscape, our liability margins may reduce somewhat from current levels. Overall income will be supported by our strong and diversified businesses, especially when loan demand recovers. “Wholesale Banking showed solid income growth as continued rates increases resulted in improved margins for Payments & Cash Management, and Financial Markets benefited from strong trading results. We focused on further optimising our capital usage and margins while decreasing risk weights, prioritising own origination of high - quality loans. “Expenses remained under control with year - on - year cost growth (excluding incidentals) below 5%. Risk costs were again low – a testament to the quality of our loan book and our prudent credit risk management. We remain vigilant, given global economic growth is slowing down. “In October, we published our Climate Report, setting out our progress on the path to net zero, including how we engage with clients. We also explain our work to assess climate risks and how we take action to mitigate them. One of the key challenges we face is balancing the world’s need for urgent action with helping drive economic progress and supporting the transition. We are proud of how we are using our financing to help our clients in this, but we can’t do it alone. Next to detailed transition plans for the nine most carbon - intensive sectors in our loan portfolio, the report includes specific calls to action on governments and regulators to guide the transition more firmly. “We continue to take steps to converge our capital ratios to our target level of around 12 . 5 % , today announcing another share buyback programme . We do this from a position of strength, convinced that operating at the right level of capital is in the best interest of all stakeholders and allows us to support the economy and our more than 38 million customers in over 40 countries . “These are uncertain times and it is hard to predict the impact of geopolitical conflicts . However, I’m confident that we are well positioned to withstand adverse challenges and continue to make a difference . I would like to thank everyone who contributed to our performance during the third quarter . ” Press release ING Corporate Communications Amsterdam, 2 November 2023 Investor enquiries E: investor.relations@ing.com Press enquiries T: +31 (0)20 576 5000 E: media.relations@ing.com Analyst call 2 November 2023 at 9:00 am CET +31 20 708 5074 (NL), PIN code: 8734585# +44 330 551 0202 (UK), PIN code: 8734585# (Registration required via invitation) Live audio webcast at www.ing.com Media call 2 November 2023 at 11:00 am CET +31 20 708 5073 (NL) +44 330 551 0200 (UK) (Quote ING Media Call 3Q2023 when prompted by the operator) Live audio webcast at www.ing.com
Primary customers 15.1 mln +181,000 in 3Q2023 Mobile - only customers 62% of total active customers vs 57% in 3Q2022 Net result €1,982 mln +103% vs 3Q2022 Fee income €909 mln +4% vs 3Q2022 CET1 ratio 15.2% +0.3% vs 2Q2023 Return on equity (4 - qtr rolling avg) 13.8% +7.0% vs 3Q2022 Customer experience NPS score: Ranked #1 in 5 of 10 Retail markets Primary customers: +181,000 in 3Q2023 Offering a customer experience that is personal, easy, relevant and instant is one of our strategic priorities. In this quarter, our primary customer base grew by 181,000 to 15.1 million. This, along with our leading NPS rankings, shows that customers appreciate our products and services. ING constantly invests in online security and the fight against fraud. Customers in Belgium, for example, can now directly report potentially fraudulent transactions or concerns they might have, via app and web. Belgium is the first country to implement this within ING. ING in Türkiye revised its fraud detection framework to improve effectiveness, resulting in early improved detection. An important part of keeping ING safe and secure is knowing our customers. During onboarding, prospective customers need to provide ING with a lot of information, including the source of their funds and assets. We endeavour to make this process as seamless as possible. In Poland, a new feature in the mobile app – the KYC tracker – allows retail customers to easily track the status of their onboarding and directly address any requirements. Italy is one of the first ING Wholesale Banking (WB) countries providing clients uniform and harmonised monthly statements about banking fees charged to their account. All the countries in ING’s WB network are being migrated to the global billing platform that enables this new service. Sustainability Volume mobilised: €73.9 bln in 9M2023 vs €64.5 bln in 9M2022 ING Press Release 3Q2023 2 Sustainability deals supported by ING: 507 in 9M2023 vs 306 in 9M2022 We aim to put sustainability at the heart of what we do. Society is transitioning to a low - carbon economy. So are our clients, and so is ING. We finance a lot of sustainable activities, but we still finance more that’s not. In our Climate Report, we share our progress on the path to net zero, including how we engage with clients. We’re developing an online tool to collect and assess the transition plans and sustainability performance of (eventually) our largest WB clients. This will enhance our climate - related decision - making processes and improve how we engage with existing and prospective clients. We're also expanding our Terra approach to include additional carbon - intensive sectors and more parts of existing sectors. For example, we now cover our global commercial real estate portfolio. We cover the mid and downstream part of the oil & gas value chain and are working to expand into trade & commodity finance. We're also working to expand Terra to cover the aluminium portfolio and part of Business Banking. It’s our aim to have sustainable alternatives for our main Retail products in all markets by 2025. Our sustainability propositions within our mortgages offering, include loans to stimulate home renovations and a sustainability discount for energy - efficient homes. Our market share of mortgage production for A - label (or higher) homes in the Netherlands has increased from 13.5% in the third quarter of 2022 to 18.7% in the third quarter of this year. In Romania we successfully added new purposes to our sustainable personal loans, like solar panels. ING in Germany added sustainability filters for investments in its app, showing customers sustainability data for shares and investment funds available. Customers can use these filters to help identify investments that fit their sustainability preferences. They are already among the top four most - used filters in the app. We continued to invest in renewable energy. An example is our leading role in the financing of the first offshore wind farm in Poland, consisting of 76 wind turbines, which will, once completed, supply clean energy to over 1.5 million households. We also acted as green loan structuring agent for Swift Current’s Double Black Diamond Solar Project in Illinois, which is expected to reduce regional CO2 emissions by an estimated one million tons per year. This is expected to be the second largest solar project in the US. Business Highlights
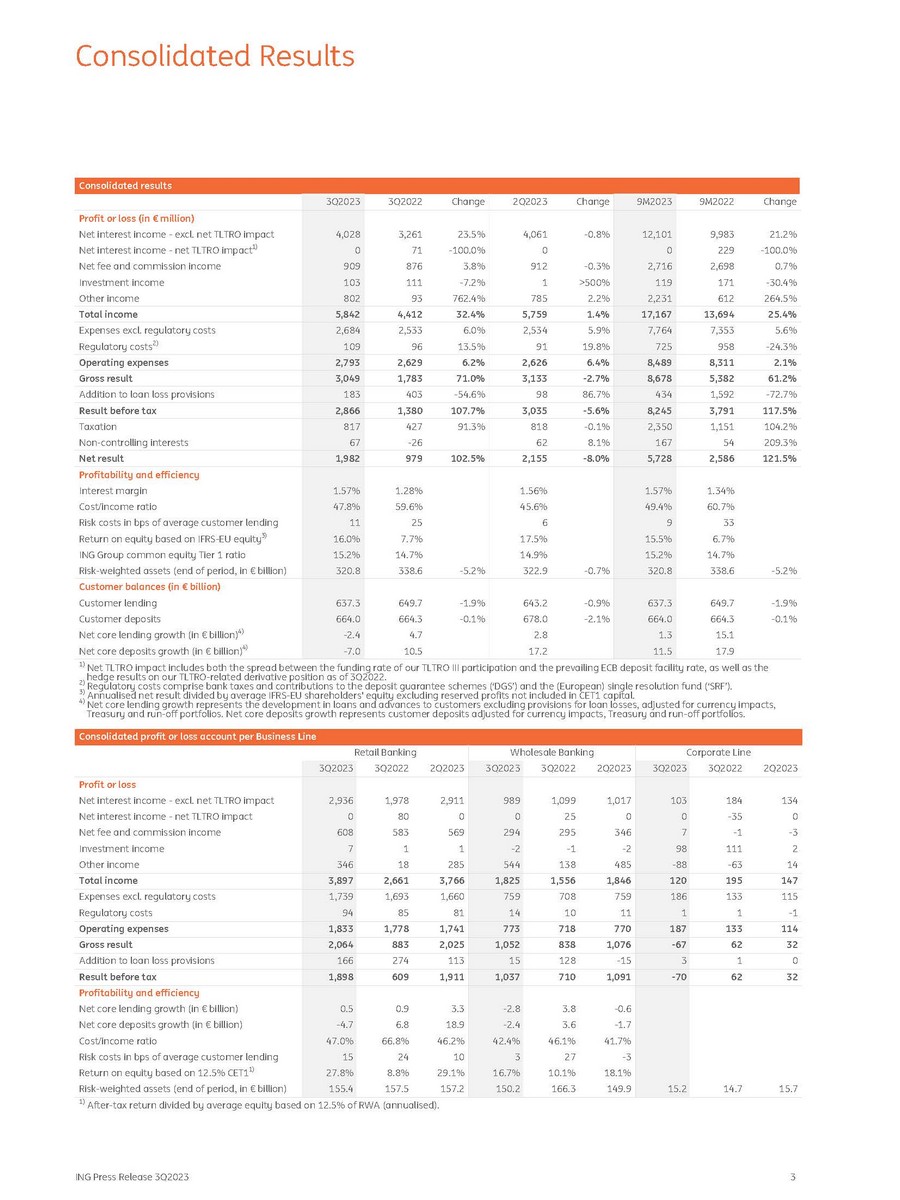
Consolidated results Change 9M2022 9M2023 Change 2Q2023 Change 3Q2022 3Q2023 Profit or loss (in € million) 21.2% 9,983 12,101 - 0.8% 4,061 23.5% 3,261 4,028 Net interest income - excl. net TLTRO impact - 100.0% 229 0 0 - 100.0% 71 0 Net interest income - net TLTRO impact 1) 0.7% 2,698 2,716 - 0.3% 912 3.8% 876 909 Net fee and commission income - 30.4% 171 119 >500% 1 - 7.2% 111 103 Investment income 264.5% 612 2,231 2.2% 785 762.4% 93 802 Other income 25.4% 13,694 17,167 1.4% 5,759 32.4% 4,412 5,842 Total income 5.6% 7,353 7,764 5.9% 2,534 6.0% 2,533 2,684 Expenses excl. regulatory costs - 24.3% 958 725 19.8% 91 13.5% 96 109 Regulatory costs 2) 2.1% 8,311 8,489 6.4% 2,626 6.2% 2,629 2,793 Operating expenses 61.2% 5,382 8,678 - 2.7% 3,133 71.0% 1,783 3,049 Gross result - 72.7% 1,592 434 86.7% 98 - 54.6% 403 183 Addition to loan loss provisions 117.5% 3,791 8,245 - 5.6% 3,035 107.7% 1,380 2,866 Result before tax 104.2% 1,151 2,350 - 0.1% 818 91.3% 427 817 Taxation 209.3% 54 167 8.1% 62 - 26 67 Non - controlling interests 121.5% 2,586 5,728 - 8.0% 2,155 102.5% 979 1,982 Net result Profitability and efficiency 1.34% 1.57% 1.56% 1.28% 1.57% Interest margin 60.7% 49.4% 45.6% 59.6% 47.8% Cost/income ratio 33 9 6 25 11 Risk costs in bps of average customer lending 6.7% 15.5% 17.5% 7.7% 16.0% Return on equity based on IFRS - EU equity 3) 14.7% 15.2% 14.9% 14.7% 15.2% ING Group common equity Tier 1 ratio - 5.2% 338.6 320.8 - 0.7% 322.9 - 5.2% 338.6 320.8 Risk - weighted assets (end of period, in € billion) Customer balances (in € billion) - 1.9% 649.7 637.3 - 0.9% 643.2 - 1.9% 649.7 637.3 Customer lending - 0.1% 664.3 664.0 - 2.1% 678.0 - 0.1% 664.3 664.0 Customer deposits 15.1 1.3 2.8 4.7 - 2.4 Net core lending growth (in € billion) 4) 17.9 11.5 17.2 10.5 - 7.0 Net core deposits growth (in € billion) 4) hedge results on our TLTRO - related derivative position as of 3Q2022. 1) Net TLTRO impact includes both the spread between the funding rate of our TLTRO III participation and the prevailing ECB deposit facility rate, as well as the 2) Regulatory costs comprise bank taxes and contributions to the deposit guarantee schemes (‘DGS’) and the (European) single resolution fund (‘SRF’). 3) Annualised net result divided by average IFRS - EU shareholders' equity excluding reserved profits not included in CET1 capital. 4) Net core lending growth represents the development in loans and advances to customers excluding provisions for loan losses, adjusted for currency impacts, Treasury and run - off portfolios. Net core deposits growth represents customer deposits adjusted for currency impacts, Treasury and run - off portfolios. Consolidated profit or loss account per Business Line Corporate Line Wholesale Banking Retail Banking 2Q2023 3Q2022 3Q2023 2Q2023 3Q2022 3Q2023 2Q2023 3Q2022 3Q2023 Profit or loss 134 184 103 1,017 1,099 989 2,911 1,978 2,936 Net interest income - excl. net TLTRO impact 0 - 35 0 0 25 0 0 80 0 Net interest income - net TLTRO impact - 3 - 1 7 346 295 294 569 583 608 Net fee and commission income 2 111 98 - 2 - 1 - 2 1 1 7 Investment income 14 - 63 - 88 485 138 544 285 18 346 Other income 147 195 120 1,846 1,556 1,825 3,766 2,661 3,897 Total income 115 133 186 759 708 759 1,660 1,693 1,739 Expenses excl. regulatory costs - 1 1 1 11 10 14 81 85 94 Regulatory costs 114 133 187 770 718 773 1,741 1,778 1,833 Operating expenses 32 62 - 67 1,076 838 1,052 2,025 883 2,064 Gross result 0 1 3 - 15 128 15 113 274 166 Addition to loan loss provisions 32 62 - 70 1,091 710 1,037 1,911 609 1,898 Result before tax Profitability and efficiency - 0.6 3.8 - 2.8 3.3 0.9 0.5 Net core lending growth (in € billion) - 1.7 3.6 - 2.4 18.9 6.8 - 4.7 Net core deposits growth (in € billion) 41.7% 46.1% 42.4% 46.2% 66.8% 47.0% Cost/income ratio - 3 27 3 10 24 15 Risk costs in bps of average customer lending 18.1% 10.1% 16.7% 29.1% 8.8% 27.8% Return on equity based on 12.5% CET1 1) 15.7 14.7 15.2 149.9 166.3 150.2 157.2 157.5 155.4 Risk - weighted assets (end of period, in € billion) ING Press Release 3Q2023 3 1) After - tax return divided by average equity based on 12.5% of RWA (annualised). Consolidated Results

Total income Total income in 3Q2023 was again very strong at €5,842 million, an increase of 32.4% year - on - year and slightly above the prior quarter. This was mainly driven by Retail Banking, reflecting the current interest rate environment, coupled with the continued strong performance of Wholesale Banking. Year - on - year, net interest income was strongly supported by a sharp recovery of interest margins on liabilities. This was reflected in higher income in Retail Banking, as well as from the cash management activities in Wholesale Banking. Net interest income from mortgages, after adjusting for the € - 343 million impact from the Polish moratorium in 3Q2022, also increased. In Financial Markets, rising interest rates led to higher funding costs, resulting in a reduction in net interest income, while other income (related to the opposite position) rose significantly. Treasury continued to benefit from favourable market opportunities through money market and FX transactions. In the third quarter of 2023 these activities had a € - 249 million impact on net interest income (versus € - 225 million in 2Q2023 and € - 102 million in 3Q2022), which was again more than offset in other income (€+273 million). Sequentially, net interest income in Retail Banking continued to increase, albeit at a slower pace because margins on liabilities stabilised after an acceleration of core savings rate increases in several of our markets. Net interest income from mortgages declined slightly as asset repricing continued to trail market interest rate increases in some of our geographies. Net interest income from other retail lending rose modestly. Wholesale Banking recorded a slight decline in net interest income (primarily due to Treasury), while interest income from lending increased. Net interest income (in € million) and net interest margin (in %) The net interest margin was 1.57% in 3Q2023, an improvement of 1 basis point compared with 2Q2023. Year - on - year, when excluding the impacts of the Polish mortgage moratorium and TLTRO in the prior year, the net interest margin increased by 18 basis points. ING Press Release 3Q2023 4 In Retail Banking, net core lending growth – which excludes FX impacts and movements in Treasury lending as well as in the run - off portfolios – was €0.5 billion. This was driven by €2.2 billion of growth in residential mortgages, primarily in the Netherlands, Belgium and Germany. Other retail lending declined by €1.8 billion. In Wholesale Banking, core lending declined by €2.8 billion, reflecting subdued demand and our focus on further optimising our capital usage. After an exceptional increase in deposits in the previous quarter (particularly in Germany), net core deposits growth – which excludes FX impacts and movements in Treasury deposits – was € - 7.0 billion in 3Q2023, of which € - 4.7 billion was in Retail Banking and € - 2.4 billion in Wholesale Banking. In Retail Banking, this was mainly due to a shift from deposits to assets under management and seasonal impact (as customers spend more during the summer holiday period). In Belgium, outflows were also attributable to customers buying retail bonds issued by the Belgian government in September. In the non - eurozone countries where ING operates, deposits continued to increase, particularly in Poland and Australia. Total net fee and commission income rose 3.8% year - on - year, mainly driven by growth in Retail Banking. Fees from investment products increased, particularly in Belgium, due to a net inflow in assets under management. Daily banking fees in Retail Banking also increased, reflecting higher fees for payment packages and new service fees. In Wholesale Banking, higher fees in Lending were offset by a decline in fees from daily banking; this was partly due to lower volumes. Compared with 2Q2023, total fee income was almost stable. Strong growth was recorded in Retail Banking, particularly in daily banking, which included seasonally higher travel - related fee income and lower commissions paid to independent agents in Belgium. Fee income for Wholesale Banking declined sequentially, mainly due to subdued demand in Lending and seasonally lower deal flow in Global Capital Markets and Corporate Finance. Investment income in 3Q2023 mainly consisted of a €98 million annual dividend from our stake in the Bank of Beijing compared with a dividend of €111 million a year ago. Other income increased significantly compared with 3Q2022, which had included a hedge accounting impact of € - 288 million and €100 million income from the transfer of our investment business in France to Boursorama. Excluding these two exceptional items, the growth in other income was mainly driven by Treasury (partly offset in net interest income) and higher trading results in Financial Markets. Sequentially, other income increased slightly as higher other income from Treasury more than compensated a larger IAS 29 impact (reflecting a higher inflation in Türkiye). Operating expenses Total operating expenses were € 2 , 793 million, including € 109 million of regulatory costs and € 122 million of incidental cost items . Expenses excluding regulatory costs and incidental items were €2,562 million and rose 4.7% year - on - year. This was primarily attributable to the impact of high inflation on staff expenses, reflected in CLA increases and indexation, and a small increase in FTEs. These factors were partly offset by savings from exiting the French and Philippine retail markets, as well as by positive FX impacts. Consolidated Results

Operating expenses (in € million) Quarter - on - quarter, expenses excluding regulatory costs and incidental items increased 1.3%. This was mainly due to higher staff and IT expenses. Regulatory costs were €109 million and rose year - on - year, mainly because 3Q2022 had included a lower contribution to the deposit guarantee scheme in Germany. Incidental expense items in 3Q2023 amounted to €122 million, reflecting €46 million of restructuring and related costs for Retail Belgium, €26 million of hyperinflation accounting impacts on expenses in Türkiye (due to the accounting requirements of IAS 29) and €51 million that we have provisioned in Corporate Line. This compares with €85 million of incidental items in 3Q2022 and €6 million in 2Q2023. Addition to loan loss provisions Net additions to loan loss provisions amounted to €183 million. This is equivalent to 11 basis points of average customer lending and well below the through - the - cycle average. Stage 3 risk costs were €238 million. This reflected Stage 3 individual risk costs for a number of smaller individual clients in Wholesale Banking and collective Stage 3 risk costs in the consumer lending and business lending portfolio of Retail Banking (spread across various locations). Total Stage 1 and 2 risk costs (including modifications) were € - 54 million. This included a €60 million net release of Stage 2 provisions for our Russia - related portfolio (mainly due to a further reduction of our exposure), a net reduction in management overlays and the impact of a number of smaller individual clients moving to Stage 3. Addition to loan loss provisions (in € million) Risk costs for Retail Banking were €166 million, mainly reflecting net additions in Belgium, Germany and Poland. Wholesale Banking recorded €15 million of risk costs, which included a €44 million release for our Russia - related portfolio (consisting of a €60 million release in Stage 2 and a €16 million addition in Stage 3). The Corporate Line recorded €3 million of risk costs, reflecting hyperinflation accounting impacts on risk costs in Türkiye (due to the accounting requirements of IAS 29). Net result ING’s net result in 3Q2023 was €1,982 million compared with €979 million in 3Q2022 and €2,155 million in the prior quarter. The effective tax rate in 3Q2023 was 28.5% compared with 30.9% in 3Q2022 and 26.9% in 2Q2023 (the latter quarter included a tax refund in Spain and lower non - deductible expenses in Türkiye and the Netherlands). In 3Q2023, ING’s return on average IFRS - EU equity was 16.0%. On a four - quarter rolling basis, the return on equity further increased to 13.8% from 11.7% in the previous four - quarter rolling period, reflecting continued strong performance. Return on equity ING Group (in %) ING’s return on equity is calculated using IFRS - EU shareholders' equity after excluding 'reserved profit not included in CET1 capital', which amounted to €1,709 million at the end of 3Q2023. This reflects 50% of the resilient net profit in the first nine months of 2023, which has been reserved for distribution in line with our policy, minus the 2023 interim dividend that was paid in August. ING Press Release 3Q2023 5 Resilient net profit is defined as net profit adjusted for significant items that are not linked to the normal course of business. In line with this definition, and consistent with previous quarters, the impact of hyperinflation accounting has been excluded. Therefore, resilient net profit was €121 million higher than net profit in 3Q2023. Consolidated Results
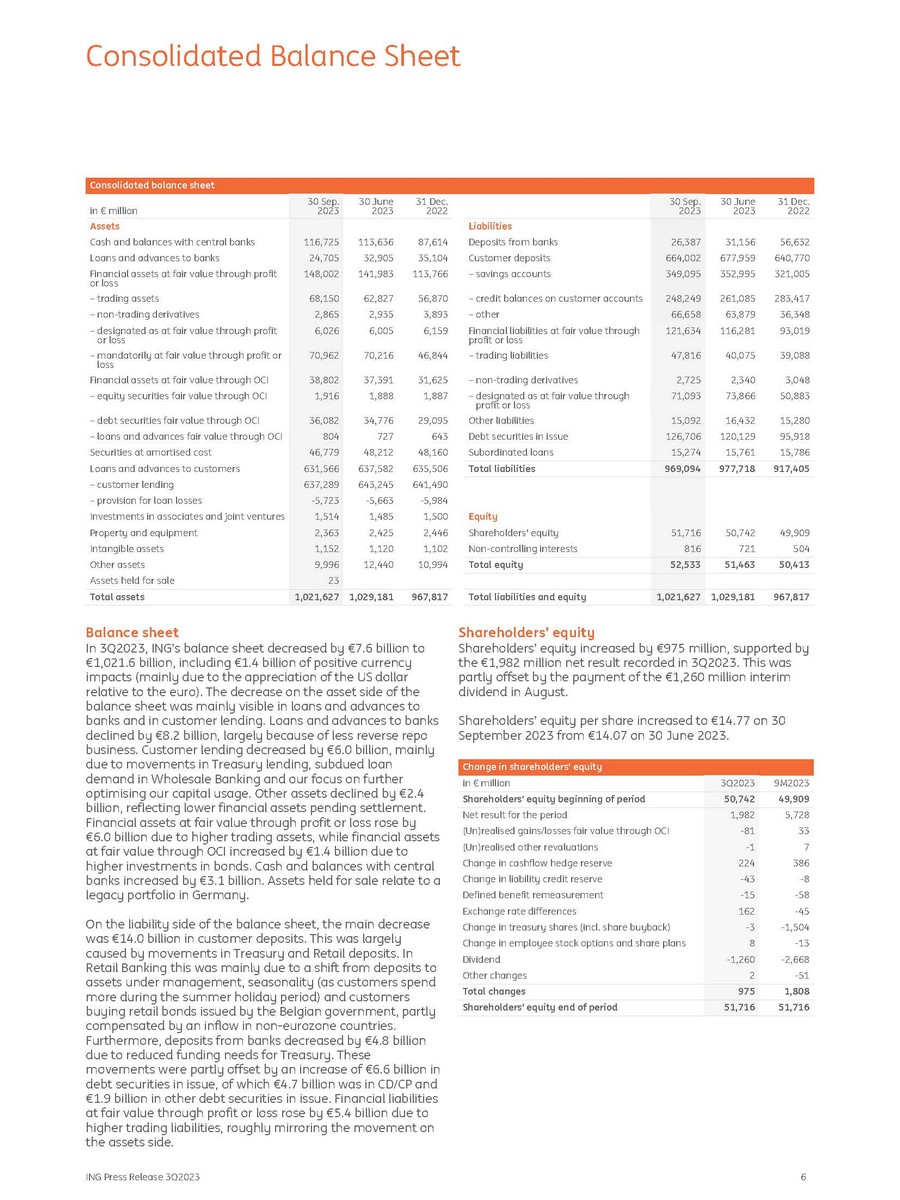
Consolidated balance sheet 31 Dec. 2022 30 June 2023 30 Sep. 2023 in € million Assets 87,614 113,636 116,725 Cash and balances with central banks 35,104 32,905 24,705 Loans and advances to banks 113,766 141,983 148,002 Financial assets at fair value through profit or loss 56,870 62,827 68,150 – trading assets 3,893 2,935 2,865 – non - trading derivatives 6,159 6,005 6,026 – designated as at fair value through profit or loss 46,844 70,216 70,962 – mandatorily at fair value through profit or loss 31,625 37,391 38,802 Financial assets at fair value through OCI 1,887 1,888 1,916 – equity securities fair value through OCI 29,095 34,776 36,082 – debt securities fair value through OCI 643 727 804 – loans and advances fair value through OCI 48,160 48,212 46,779 Securities at amortised cost 635,506 637,582 631,566 Loans and advances to customers 641,490 643,245 637,289 – customer lending - 5,984 - 5,663 - 5,723 – provision for loan losses 1,500 1,485 1,514 Investments in associates and joint ventures 2,446 2,425 2,363 Property and equipment 1,102 1,120 1,152 Intangible assets 10,994 12,440 9,996 Other assets 23 Assets held for sale 967,817 1,029,181 1,021,627 Total assets 31 Dec. 2022 30 June 2023 30 Sep. 2023 Liabilities 56,632 31,156 26,387 Deposits from banks 640,770 677,959 664,002 Customer deposits 321,005 352,995 349,095 – savings accounts 283,417 261,085 248,249 – credit balances on customer accounts 36,348 63,879 66,658 – other 93,019 116,281 121,634 Financial liabilities at fair value through profit or loss 39,088 40,075 47,816 – trading liabilities 3,048 2,340 2,725 – non - trading derivatives 50,883 73,866 71,093 – designated as at fair value through profit or loss 15,280 16,432 15,092 Other liabilities 95,918 120,129 126,706 Debt securities in issue 15,786 15,761 15,274 Subordinated loans 917,405 977,718 969,094 Total liabilities Equity 49,909 50,742 51,716 Shareholders' equity 504 721 816 Non - controlling interests 50,413 51,463 52,533 Total equity 967,817 1,029,181 1,021,627 Total liabilities and equity Balance sheet In 3Q2023, ING’s balance sheet decreased by €7.6 billion to €1,021.6 billion, including €1.4 billion of positive currency impacts (mainly due to the appreciation of the US dollar relative to the euro). The decrease on the asset side of the balance sheet was mainly visible in loans and advances to banks and in customer lending. Loans and advances to banks declined by €8.2 billion, largely because of less reverse repo business. Customer lending decreased by €6.0 billion, mainly due to movements in Treasury lending, subdued loan demand in Wholesale Banking and our focus on further optimising our capital usage. Other assets declined by €2.4 billion, reflecting lower financial assets pending settlement. Financial assets at fair value through profit or loss rose by €6.0 billion due to higher trading assets, while financial assets at fair value through OCI increased by €1.4 billion due to higher investments in bonds. Cash and balances with central banks increased by €3.1 billion. Assets held for sale relate to a legacy portfolio in Germany. On the liability side of the balance sheet, the main decrease was €14.0 billion in customer deposits. This was largely caused by movements in Treasury and Retail deposits. In Retail Banking this was mainly due to a shift from deposits to assets under management, seasonality (as customers spend more during the summer holiday period) and customers buying retail bonds issued by the Belgian government, partly compensated by an inflow in non - eurozone countries. Furthermore, deposits from banks decreased by €4.8 billion due to reduced funding needs for Treasury. These movements were partly offset by an increase of €6.6 billion in debt securities in issue, of which €4.7 billion was in CD/CP and €1.9 billion in other debt securities in issue. Financial liabilities at fair value through profit or loss rose by €5.4 billion due to higher trading liabilities, roughly mirroring the movement on the assets side. Shareholders’ equity Shareholders’ equity increased by €975 million, supported by the €1,982 million net result recorded in 3Q2023. This was partly offset by the payment of the €1,260 million interim dividend in August. Shareholders’ equity per share increased to €14.77 on 30 September 2023 from €14.07 on 30 June 2023. Change in shareholders’ equity ING Press Release 3Q2023 6 9M2023 3Q2023 in € million 49,909 50,742 Shareholders' equity beginning of period 5,728 1,982 Net result for the period 33 - 81 (Un)realised gains/losses fair value through OCI 7 - 1 (Un)realised other revaluations 386 224 Change in cashflow hedge reserve - 8 - 43 Change in liability credit reserve - 58 - 15 Defined benefit remeasurement - 45 162 Exchange rate differences - 1,504 - 3 Change in treasury shares (incl. share buyback) - 13 8 Change in employee stock options and share plans - 2,668 - 1,260 Dividend - 51 2 Other changes 1,808 975 Total changes 51,716 51,716 Shareholders' equity end of period Consolidated Balance Sheet
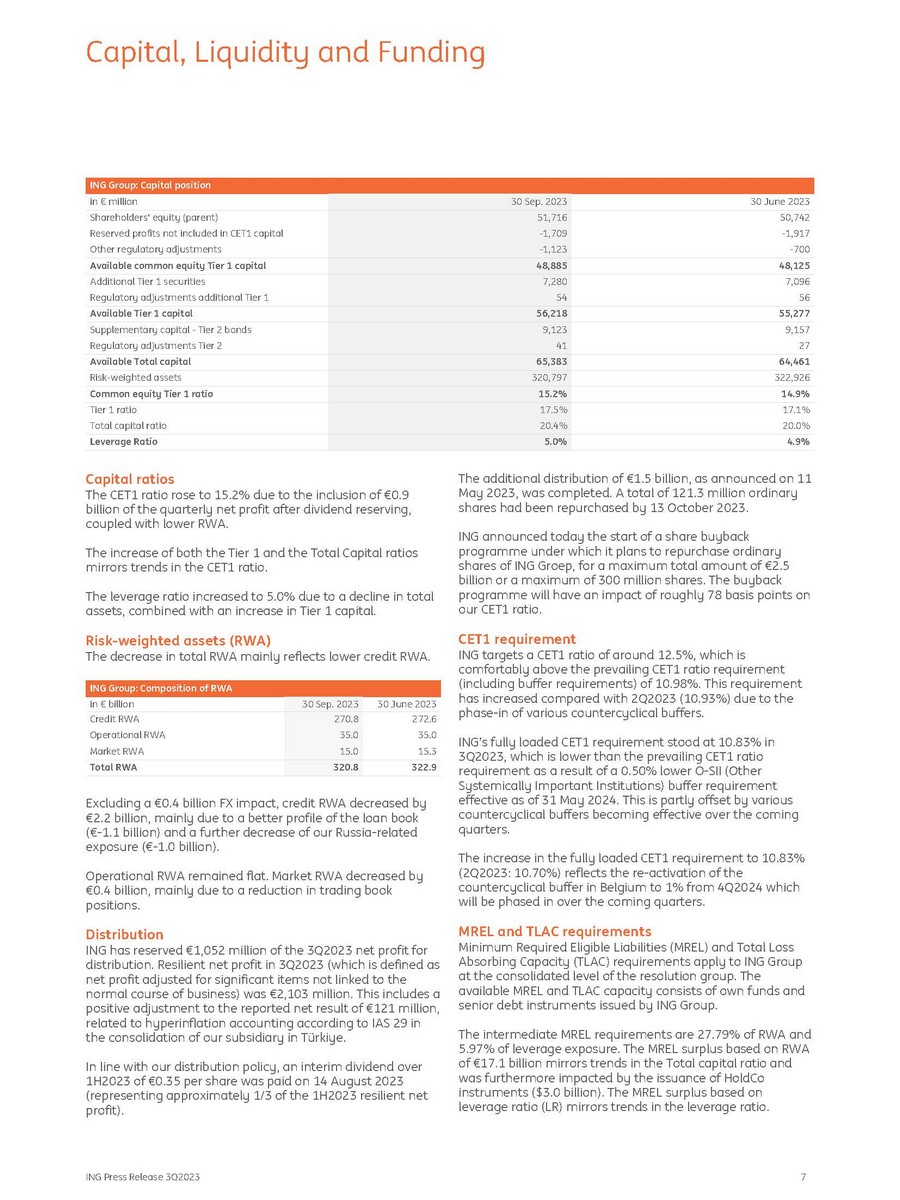
ING Group: Capital position 30 June 2023 30 Sep. 2023 in € million 50,742 - 1,917 - 700 51,716 - 1,709 - 1,123 Shareholders' equity (parent) Reserved profits not included in CET1 capital Other regulatory adjustments 48,125 48,885 Available common equity Tier 1 capital 7,096 56 7,280 54 Additional Tier 1 securities Regulatory adjustments additional Tier 1 55,277 56,218 Available Tier 1 capital 9,157 9,123 Supplementary capital - Tier 2 bonds 27 41 Regulatory adjustments Tier 2 64,461 65,383 Available Total capital 322,926 320,797 Risk - weighted assets 14.9% 15.2% Common equity Tier 1 ratio 17.1% 17.5% Tier 1 ratio 20.0% 20.4% Total capital ratio 4.9% 5.0% Leverage Ratio Capital ratios The CET 1 ratio rose to 15 . 2 % due to the inclusion of € 0 . 9 billion of the quarterly net profit after dividend reserving, coupled with lower RWA . The increase of both the Tier 1 and the Total Capital ratios mirrors trends in the CET1 ratio. The leverage ratio increased to 5.0% due to a decline in total assets, combined with an increase in Tier 1 capital. Risk - weighted assets (RWA) The decrease in total RWA mainly reflects lower credit RWA. ING Group: Composition of RWA ING Press Release 3Q2023 7 30 June 2023 30 Sep. 2023 in € billion 272.6 270.8 Credit RWA 35.0 35.0 Operational RWA 15.3 15.0 Market RWA 322.9 320.8 Total RWA Excluding a € 0 . 4 billion FX impact, credit RWA decreased by € 2 . 2 billion, mainly due to a better profile of the loan book (€ - 1 . 1 billion) and a further decrease of our Russia - related exposure (€ - 1 . 0 billion) . Operational RWA remained flat. Market RWA decreased by €0.4 billion, mainly due to a reduction in trading book positions. Distribution ING has reserved €1,052 million of the 3Q2023 net profit for distribution. Resilient net profit in 3Q2023 (which is defined as net profit adjusted for significant items not linked to the normal course of business) was €2,103 million. This includes a positive adjustment to the reported net result of €121 million, related to hyperinflation accounting according to IAS 29 in the consolidation of our subsidiary in Türkiye. In line with our distribution policy, an interim dividend over 1H2023 of €0.35 per share was paid on 14 August 2023 (representing approximately 1/3 of the 1H2023 resilient net profit). The additional distribution of €1.5 billion, as announced on 11 May 2023, was completed. A total of 121.3 million ordinary shares had been repurchased by 13 October 2023. ING announced today the start of a share buyback programme under which it plans to repurchase ordinary shares of ING Groep, for a maximum total amount of €2.5 billion or a maximum of 300 million shares. The buyback programme will have an impact of roughly 78 basis points on our CET1 ratio. CET1 requirement ING targets a CET1 ratio of around 12.5%, which is comfortably above the prevailing CET1 ratio requirement (including buffer requirements) of 10.98%. This requirement has increased compared with 2Q2023 (10.93%) due to the phase - in of various countercyclical buffers. ING’s fully loaded CET1 requirement stood at 10.83% in 3Q2023, which is lower than the prevailing CET1 ratio requirement as a result of a 0.50% lower O - SII (Other Systemically Important Institutions) buffer requirement effective as of 31 May 2024. This is partly offset by various countercyclical buffers becoming effective over the coming quarters. The increase in the fully loaded CET1 requirement to 10.83% (2Q2023: 10.70%) reflects the re - activation of the countercyclical buffer in Belgium to 1% from 4Q2024 which will be phased in over the coming quarters. MREL and TLAC requirements Minimum Required Eligible Liabilities (MREL) and Total Loss Absorbing Capacity (TLAC) requirements apply to ING Group at the consolidated level of the resolution group. The available MREL and TLAC capacity consists of own funds and senior debt instruments issued by ING Group. The intermediate MREL requirements are 27.79% of RWA and 5.97% of leverage exposure. The MREL surplus based on RWA of €17.1 billion mirrors trends in the Total capital ratio and was furthermore impacted by the issuance of HoldCo instruments ($3.0 billion). The MREL surplus based on leverage ratio (LR) mirrors trends in the leverage ratio. Capital, Liquidity and Funding
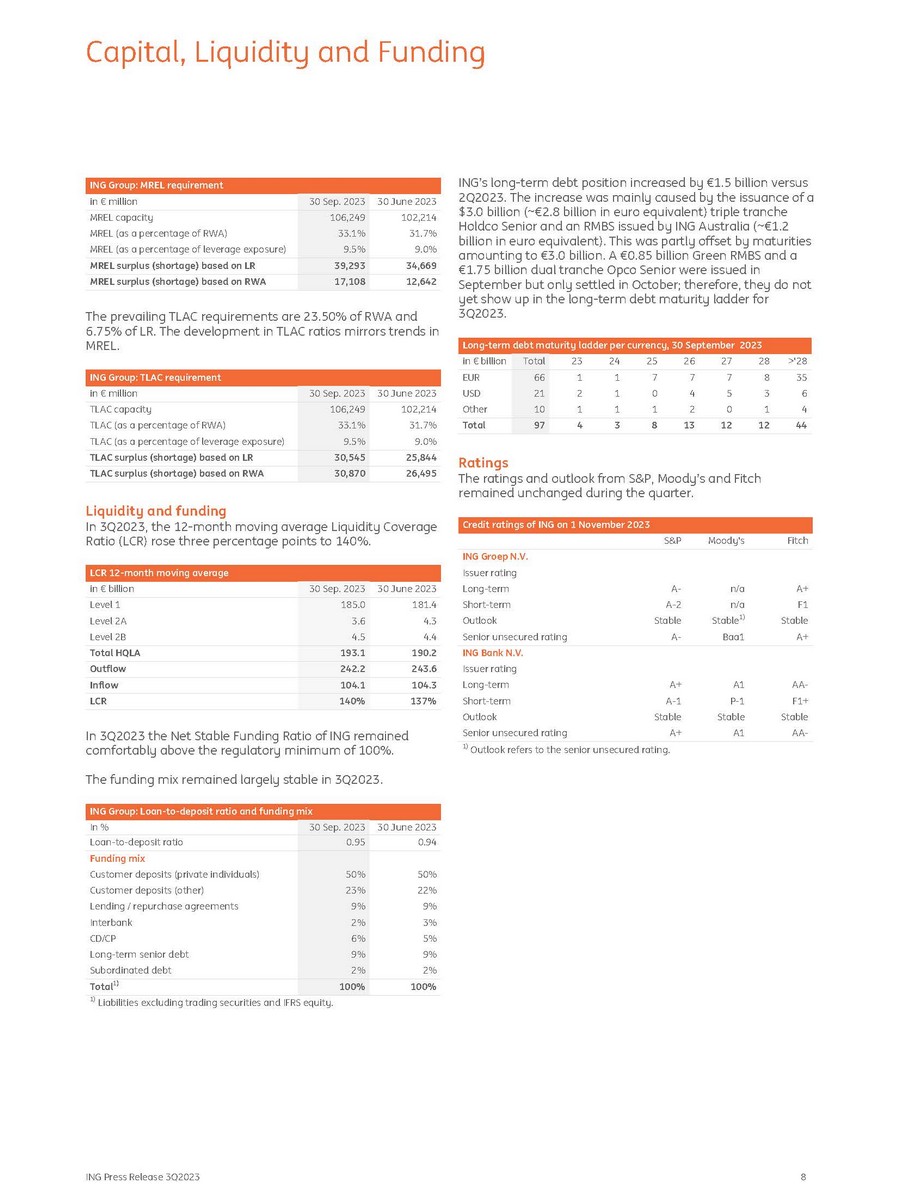
ING Group: MREL requirement 30 June 2023 30 Sep. 2023 in € million 102,214 106,249 MREL capacity 31.7% 33.1% MREL (as a percentage of RWA) 9.0% 9.5% MREL (as a percentage of leverage exposure) 34,669 39,293 MREL surplus (shortage) based on LR 12,642 17,108 MREL surplus (shortage) based on RWA The prevailing TLAC requirements are 23.50% of RWA and 6.75% of LR. The development in TLAC ratios mirrors trends in MREL. ING Group: TLAC requirement 30 June 2023 30 Sep. 2023 in € million 102,214 106,249 TLAC capacity 31.7% 33.1% TLAC (as a percentage of RWA) 9.0% 9.5% TLAC (as a percentage of leverage exposure) 25,844 30,545 TLAC surplus (shortage) based on LR 26,495 30,870 TLAC surplus (shortage) based on RWA 30 June 2023 30 Sep. 2023 in € billion 181.4 185.0 Level 1 4.3 3.6 Level 2A 4.4 4.5 Level 2B 190.2 193.1 Total HQLA 243.6 242.2 Outflow 104.3 104.1 Inflow 137% 140% LCR Liquidity and funding Credit ratings of ING on 1 November 2023 In 3Q2023, the 12 - month moving average Liquidity Coverage Fitch Moody's S&P Ratio (LCR) rose three percentage points to 140%. ING Groep N.V. Issuer rating LCR 12 - month moving average A+ n/a A - Long - term F1 Stable n/a Stable 1) A - 2 Stable Short - term Outlook A+ Baa1 A - Senior unsecured rating ING Bank N.V. Issuer rating AA - A1 A+ Long - term F1+ P - 1 A - 1 Short - term Stable Stable Stable Outlook In 3Q2023 the Net Stable Funding Ratio of ING remained comfortably above the regulatory minimum of 100%. The funding mix remained largely stable in 3Q2023. ING Group: Loan - to - deposit ratio and funding mix 30 June 2023 30 Sep. 2023 In % 0.94 0.95 Loan - to - deposit ratio Funding mix 50% 50% Customer deposits (private individuals) 22% 23% Customer deposits (other) 9% 9% Lending / repurchase agreements 3% 2% Interbank 5% 6% CD/CP 9% 9% Long - term senior debt 2% 2% Subordinated debt 100% 100% Total 1) 1) Liabilities excluding trading securities and IFRS equity. ING’s long - term debt position increased by €1.5 billion versus 2Q2023. The increase was mainly caused by the issuance of a $3.0 billion (~€2.8 billion in euro equivalent) triple tranche Holdco Senior and an RMBS issued by ING Australia (~€1.2 billion in euro equivalent). This was partly offset by maturities amounting to €3.0 billion. A €0.85 billion Green RMBS and a €1.75 billion dual tranche Opco Senior were issued in September but only settled in October; therefore, they do not yet show up in the long - term debt maturity ladder for 3Q2023. Long - term debt maturity ladder per currency, 30 September 2023 >'28 28 27 26 25 24 23 Total in € billion 35 8 7 7 7 1 1 66 EUR 6 3 5 4 0 1 2 21 USD 4 1 0 2 1 1 1 10 Other 44 12 12 13 8 3 4 97 Total Ratings The ratings and outlook from S&P, Moody’s and Fitch remained unchanged during the quarter. Senior unsecured rating A+ 1) Outlook refers to the senior unsecured rating. A1 AA - Capital, Liquidity and Funding ING Press Release 3Q2023 8
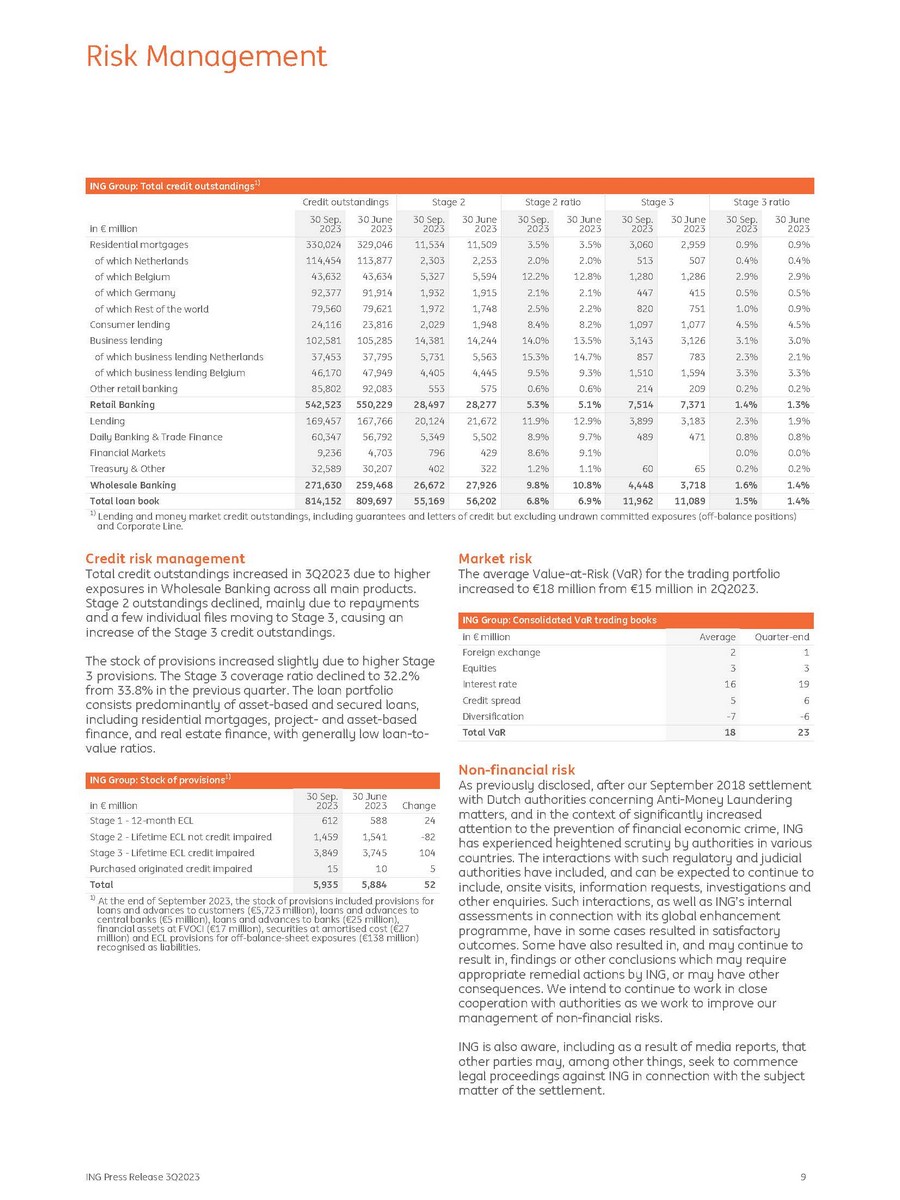
ING Group: Total credit outstandings 1) Stage 3 ratio Stage 3 Stage 2 ratio Stage 2 Credit outstandings 30 Sep. 30 June 2023 2023 in € million 30 June 2023 30 Sep. 2023 30 June 2023 30 Sep. 2023 30 June 2023 30 Sep. 2023 30 June 2023 30 Sep. 2023 0.9% 0.9% 2,959 3,060 3.5% 3.5% 11,509 11,534 329,046 330,024 Residential mortgages 0.4% 0.4% 507 513 2.0% 2.0% 2,253 2,303 113,877 114,454 of which Netherlands 2.9% 2.9% 1,286 1,280 12.8% 12.2% 5,594 5,327 43,634 43,632 of which Belgium 0.5% 0.5% 415 447 2.1% 2.1% 1,915 1,932 91,914 92,377 of which Germany 0.9% 1.0% 751 820 2.2% 2.5% 1,748 1,972 79,621 79,560 of which Rest of the world 4.5% 4.5% 1,077 1,097 8.2% 8.4% 1,948 2,029 23,816 24,116 Consumer lending 3.0% 3.1% 3,126 3,143 13.5% 14.0% 14,244 14,381 105,285 102,581 Business lending 2.1% 2.3% 783 857 14.7% 15.3% 5,563 5,731 37,795 37,453 of which business lending Netherlands 3.3% 3.3% 1,594 1,510 9.3% 9.5% 4,445 4,405 47,949 46,170 of which business lending Belgium 0.2% 0.2% 209 214 0.6% 0.6% 575 553 92,083 85,802 Other retail banking 1.3% 1.4% 7,371 7,514 5.1% 5.3% 28,277 28,497 550,229 542,523 Retail Banking 1.9% 2.3% 3,183 3,899 12.9% 11.9% 21,672 20,124 167,766 169,457 Lending 0.8% 0.8% 471 489 9.7% 8.9% 5,502 5,349 56,792 60,347 Daily Banking & Trade Finance 0.0% 0.0% 9.1% 8.6% 429 796 4,703 9,236 Financial Markets 0.2% 0.2% 65 60 1.1% 1.2% 322 402 30,207 32,589 Treasury & Other 1.4% 1.6% 3,718 4,448 10.8% 9.8% 27,926 26,672 259,468 271,630 Wholesale Banking 1.4% 1.5% 11,089 11,962 6.9% 6.8% 56,202 55,169 809,697 814,152 Total loan book ING Press Release 3Q2023 9 1) Lending and money market credit outstandings, including guarantees and letters of credit but excluding undrawn committed exposures (off - balance positions) and Corporate Line. Credit risk management Total credit outstandings increased in 3Q2023 due to higher exposures in Wholesale Banking across all main products. Stage 2 outstandings declined, mainly due to repayments and a few individual files moving to Stage 3, causing an increase of the Stage 3 credit outstandings. The stock of provisions increased slightly due to higher Stage 3 provisions. The Stage 3 coverage ratio declined to 32.2% from 33.8% in the previous quarter. The loan portfolio consists predominantly of asset - based and secured loans, including residential mortgages, project - and asset - based finance, and real estate finance, with generally low loan - to - value ratios. ING Group: Stock of provisions 1) Change 30 June 2023 30 Sep. 2023 in € million 24 588 612 Stage 1 - 12 - month ECL - 82 1,541 1,459 Stage 2 - Lifetime ECL not credit impaired 104 3,745 3,849 Stage 3 - Lifetime ECL credit impaired 5 10 15 Purchased originated credit impaired 52 5,884 5,935 Total 1) At the end of September 2023, the stock of provisions included provisions for loans and advances to customers (€5,723 million), loans and advances to central banks (€5 million), loans and advances to banks (€25 million), financial assets at FVOCI (€17 million), securities at amortised cost (€27 million) and ECL provisions for off - balance - sheet exposures (€138 million) recognised as liabilities. Market risk The average Value - at - Risk (VaR) for the trading portfolio increased to €18 million from €15 million in 2Q2023. ING Group: Consolidated VaR trading books Quarter - end Average in € million 1 2 Foreign exchange 3 3 Equities 19 16 Interest rate 6 5 Credit spread - 6 - 7 Diversification 23 18 Total VaR Non - financial risk As previously disclosed, after our September 2018 settlement with Dutch authorities concerning Anti - Money Laundering matters, and in the context of significantly increased attention to the prevention of financial economic crime, ING has experienced heightened scrutiny by authorities in various countries. The interactions with such regulatory and judicial authorities have included, and can be expected to continue to include, onsite visits, information requests, investigations and other enquiries. Such interactions, as well as ING’s internal assessments in connection with its global enhancement programme, have in some cases resulted in satisfactory outcomes. Some have also resulted in, and may continue to result in, findings or other conclusions which may require appropriate remedial actions by ING, or may have other consequences. We intend to continue to work in close cooperation with authorities as we work to improve our management of non - financial risks. ING is also aware, including as a result of media reports, that other parties may, among other things, seek to commence legal proceedings against ING in connection with the subject matter of the settlement. Risk Management
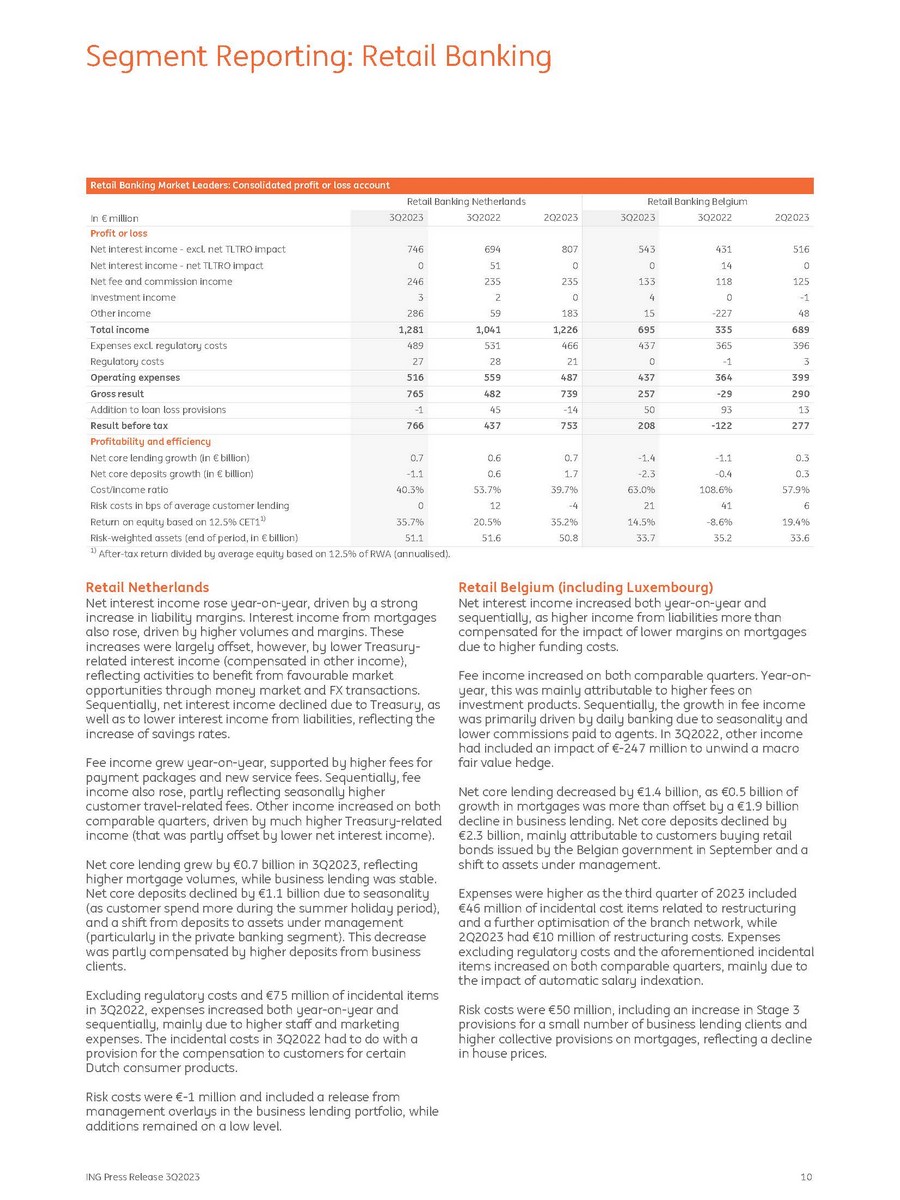
Retail Banking Market Leaders: Consolidated profit or loss account Banking Belgium Retail Retail Banking Netherlands 2Q2023 3Q2022 3Q2023 2Q2023 3Q2022 3Q2023 In € million Profit or loss 516 431 543 807 694 746 Net interest income - excl. net TLTRO impact 0 14 0 0 51 0 Net interest income - net TLTRO impact 125 118 133 235 235 246 Net fee and commission income - 1 0 4 0 2 3 Investment income 48 - 227 15 183 59 286 Other income 689 335 695 1,226 1,041 1,281 Total income 396 365 437 466 531 489 Expenses excl. regulatory costs 3 - 1 0 21 28 27 Regulatory costs 399 364 437 487 559 516 Operating expenses 290 - 29 257 739 482 765 Gross result 13 93 50 - 14 45 - 1 Addition to loan loss provisions 277 - 122 208 753 437 766 Result before tax Profitability and efficiency 0.3 - 1.1 - 1.4 0.7 0.6 0.7 Net core lending growth (in € billion) 0.3 - 0.4 - 2.3 1.7 0.6 - 1.1 Net core deposits growth (in € billion) 57.9% 108.6% 63.0% 39.7% 53.7% 40.3% Cost/income ratio 6 41 21 - 4 12 0 Risk costs in bps of average customer lending 19.4% - 8.6% 14.5% 35.2% 20.5% 35.7% Return on equity based on 12.5% CET1 1) 33.6 35.2 33.7 50.8 51.6 51.1 Risk - weighted assets (end of period, in € billion) ING Press Release 3Q2023 10 1) After - tax return divided by average equity based on 12.5% of RWA (annualised). Retail Netherlands Net interest income rose year - on - year, driven by a strong increase in liability margins. Interest income from mortgages also rose, driven by higher volumes and margins. These increases were largely offset, however, by lower Treasury - related interest income (compensated in other income), reflecting activities to benefit from favourable market opportunities through money market and FX transactions. Sequentially, net interest income declined due to Treasury, as well as to lower interest income from liabilities, reflecting the increase of savings rates. Fee income grew year - on - year, supported by higher fees for payment packages and new service fees. Sequentially, fee income also rose, partly reflecting seasonally higher customer travel - related fees. Other income increased on both comparable quarters, driven by much higher Treasury - related income (that was partly offset by lower net interest income). Net core lending grew by €0.7 billion in 3Q2023, reflecting higher mortgage volumes, while business lending was stable. Net core deposits declined by €1.1 billion due to seasonality (as customer spend more during the summer holiday period), and a shift from deposits to assets under management (particularly in the private banking segment). This decrease was partly compensated by higher deposits from business clients. Excluding regulatory costs and €75 million of incidental items in 3Q2022, expenses increased both year - on - year and sequentially, mainly due to higher staff and marketing expenses. The incidental costs in 3Q2022 had to do with a provision for the compensation to customers for certain Dutch consumer products. Risk costs were € - 1 million and included a release from management overlays in the business lending portfolio, while additions remained on a low level. Retail Belgium (including Luxembourg) Net interest income increased both year - on - year and sequentially, as higher income from liabilities more than compensated for the impact of lower margins on mortgages due to higher funding costs. Fee income increased on both comparable quarters. Year - on - year, this was mainly attributable to higher fees on investment products. Sequentially, the growth in fee income was primarily driven by daily banking due to seasonality and lower commissions paid to agents. In 3Q2022, other income had included an impact of € - 247 million to unwind a macro fair value hedge. Net core lending decreased by € 1 . 4 billion, as € 0 . 5 billion of growth in mortgages was more than offset by a € 1 . 9 billion decline in business lending . Net core deposits declined by €2.3 billion, mainly attributable to customers buying retail bonds issued by the Belgian government in September and a shift to assets under management. Expenses were higher as the third quarter of 2023 included €46 million of incidental cost items related to restructuring and a further optimisation of the branch network, while 2Q2023 had €10 million of restructuring costs. Expenses excluding regulatory costs and the aforementioned incidental items increased on both comparable quarters, mainly due to the impact of automatic salary indexation. Risk costs were €50 million, including an increase in Stage 3 provisions for a small number of business lending clients and higher collective provisions on mortgages, reflecting a decline in house prices. Segment Reporting: Retail Banking
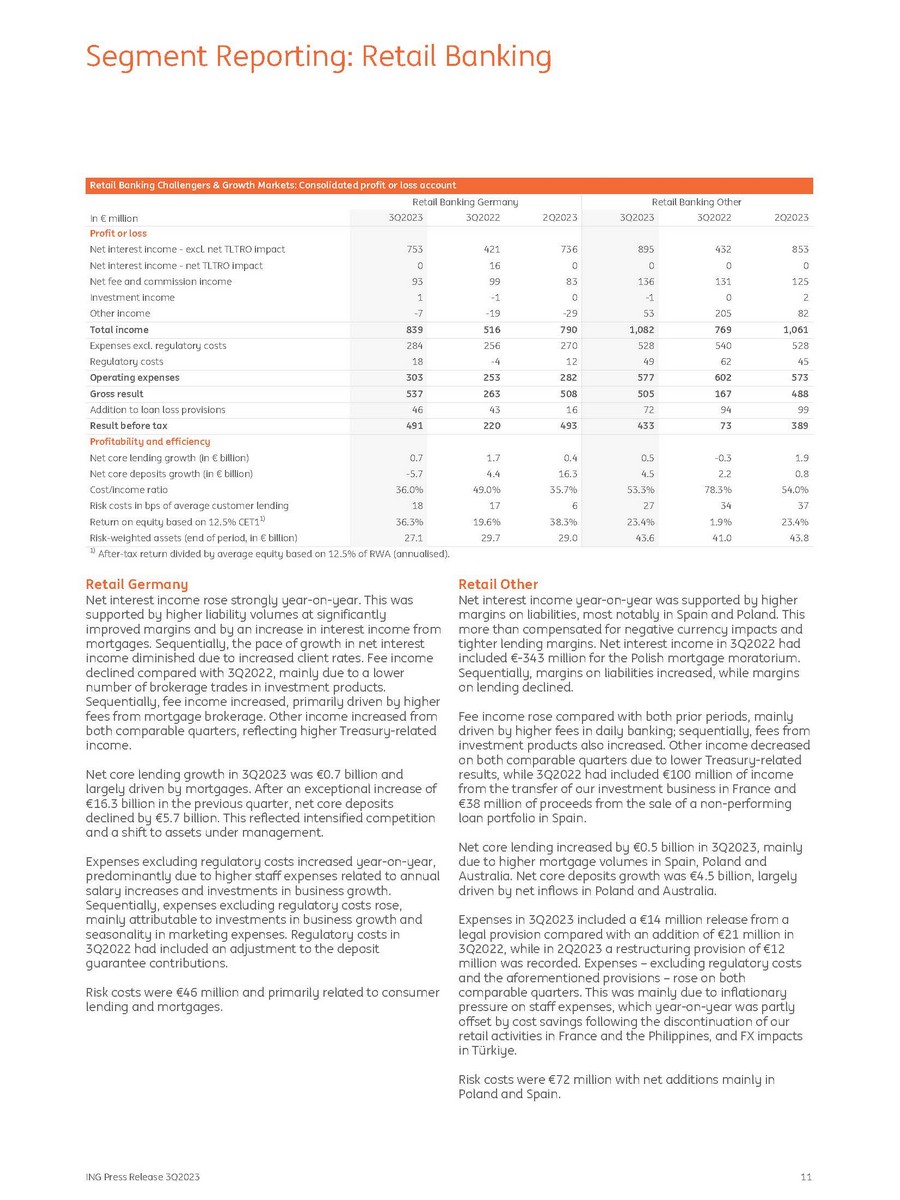
Retail Banking Other Retail Banking Challengers & Growth Markets: Consolidated profit or loss account Retail Banking Germany 2Q2023 3Q2022 3Q2023 2Q2023 3Q2022 3Q2023 In € million Profit or loss 853 432 895 736 421 753 Net interest income - excl. net TLTRO impact 0 0 0 0 16 0 Net interest income - net TLTRO impact 125 131 136 83 99 93 Net fee and commission income 2 0 - 1 0 - 1 1 Investment income 82 205 53 - 29 - 19 - 7 Other income 1,061 769 1,082 790 516 839 Total income 528 540 528 270 256 284 Expenses excl. regulatory costs 45 62 49 12 - 4 18 Regulatory costs 573 602 577 282 253 303 Operating expenses 488 167 505 508 263 537 Gross result 99 94 72 16 43 46 Addition to loan loss provisions 389 73 433 493 220 491 Result before tax Profitability and efficiency 1.9 - 0.3 0.5 0.4 1.7 0.7 Net core lending growth (in € billion) 0.8 2.2 4.5 16.3 4.4 - 5.7 Net core deposits growth (in € billion) 54.0% 78.3% 53.3% 35.7% 49.0% 36.0% Cost/income ratio 37 34 27 6 17 18 Risk costs in bps of average customer lending 23.4% 1.9% 23.4% 38.3% 19.6% 36.3% Return on equity based on 12.5% CET1 1) 43.8 41.0 43.6 29.0 29.7 27.1 Risk - weighted assets (end of period, in € billion) ING Press Release 3Q2023 11 1) After - tax return divided by average equity based on 12.5% of RWA (annualised). Retail Germany Net interest income rose strongly year - on - year. This was supported by higher liability volumes at significantly improved margins and by an increase in interest income from mortgages. Sequentially, the pace of growth in net interest income diminished due to increased client rates. Fee income declined compared with 3Q2022, mainly due to a lower number of brokerage trades in investment products. Sequentially, fee income increased, primarily driven by higher fees from mortgage brokerage. Other income increased from both comparable quarters, reflecting higher Treasury - related income. Net core lending growth in 3Q2023 was €0.7 billion and largely driven by mortgages. After an exceptional increase of €16.3 billion in the previous quarter, net core deposits declined by €5.7 billion. This reflected intensified competition and a shift to assets under management. Expenses excluding regulatory costs increased year - on - year, predominantly due to higher staff expenses related to annual salary increases and investments in business growth. Sequentially, expenses excluding regulatory costs rose, mainly attributable to investments in business growth and seasonality in marketing expenses. Regulatory costs in 3Q2022 had included an adjustment to the deposit guarantee contributions. Risk costs were €46 million and primarily related to consumer lending and mortgages. Retail Other Net interest income year - on - year was supported by higher margins on liabilities, most notably in Spain and Poland. This more than compensated for negative currency impacts and tighter lending margins. Net interest income in 3Q2022 had included € - 343 million for the Polish mortgage moratorium. Sequentially, margins on liabilities increased, while margins on lending declined. Fee income rose compared with both prior periods, mainly driven by higher fees in daily banking; sequentially, fees from investment products also increased. Other income decreased on both comparable quarters due to lower Treasury - related results, while 3Q2022 had included €100 million of income from the transfer of our investment business in France and €38 million of proceeds from the sale of a non - performing loan portfolio in Spain. Net core lending increased by €0.5 billion in 3Q2023, mainly due to higher mortgage volumes in Spain, Poland and Australia. Net core deposits growth was €4.5 billion, largely driven by net inflows in Poland and Australia. Expenses in 3Q2023 included a €14 million release from a legal provision compared with an addition of €21 million in 3Q2022, while in 2Q2023 a restructuring provision of €12 million was recorded. Expenses – excluding regulatory costs and the aforementioned provisions – rose on both comparable quarters. This was mainly due to inflationary pressure on staff expenses, which year - on - year was partly offset by cost savings following the discontinuation of our retail activities in France and the Philippines, and FX impacts in Türkiye. Risk costs were €72 million with net additions mainly in Poland and Spain. Segment Reporting: Retail Banking

2Q2023 3Q2022 3Q2023 In € million Profit or loss 809 819 804 Lending 561 437 527 Daily Banking & Trade Finance 359 282 375 Financial Markets 117 19 119 Treasury & Other 1,846 1,556 1,825 Total income 759 708 759 Expenses excl. regulatory costs 11 10 14 Regulatory costs 770 718 773 Operating expenses 1,076 838 1,052 Gross result - 15 128 15 Addition to loan loss provisions 1,091 710 1,037 Result before tax Profitability and efficiency - 0.6 3.8 - 2.8 Net core lending growth (in € billion) - 1.7 3.6 - 2.4 Net core deposits growth (in € billion) 41.7% 46.1% 42.4% Cost/income ratio 482 374 487 Income over average risk - weighted assets (in bps) 1) - 3 27 3 Risk costs in bps of average customer lending 18.1% 10.1% 16.7% Return on equity based on 12.5% CET1 2) 149.9 166.3 150.2 Risk - weighted assets (end of period, in € billion) ING Press Release 3Q2023 12 Wholesale Banking: Consolidated profit or loss account Total Wholesale Banking 1) Total income divided by average RWA (annualised). 2) After - tax return divided by average equity based on 12.5% of RWA (annualised). Wholesale Banking recorded another strong quarter with a result before tax of €1,037 million, up 46% on 3Q2022. Combined with disciplined capital management, this led to a return on equity of 16.7% and an improvement in income over average risk - weighted assets. Expense development was flat compared with the previous quarter, while the growth in expenses year - on - year reflects the impact of collective labour agreements and inflationary pressure, as well as investments to support business growth. Risk costs were again low as additions for a few individual clients were largely offset by a € 44 million release for our Russia - related portfolio . Net core lending growth was € - 2.8 billion, reflecting subdued demand, our focus on further optimising our capital usage and a continued reduction of our Russia - related exposure. Lending income held up well. Net interest income increased on both comparable periods, supported by higher average asset volumes. Fee income rose year - on - year as 3Q2023 included one large deal, but could not match the level from 2Q2023 when a number of sizeable deals was recorded. Other income declined as 3Q2022 had included a €20 million positive fair value adjustment. Income from Daily Banking & Trade Finance increased strongly year - on - year, driven by higher Payments & Cash Management (PCM) income, which benefited from higher interest rates. This was partly offset by lower income from Trade & Commodity Finance due to lower commodity prices and volumes. Sequentially, the lower income mainly reflected slightly lower volumes for both PCM and Working Capital Solutions. This contributed to a net core deposits growth of € - 2.4 billion for the quarter. Income from Financial Markets increased significantly year - on - year, as ongoing volatility driven by interest rate hikes led to positive valuation adjustments and higher trading results. The third quarter of 2023 also included a €61 million gain from the release of reserves. Compared with 2Q2023, total income was supported by this reserve release and by solid trading results as markets stabilised quarter - on - quarter. This was partly offset by seasonally lower Global Capital Markets income. Third - quarter 2023 income from Treasury & Other rose strongly year - on - year, mainly because of a change in the impacts of revaluations and hedge ineffectiveness in Treasury, coupled with positive fair value adjustments in Corporate Investments. In addition, 3Q2022 had included a € - 41 million hedge accounting impact in Belgium that was partly offset by a €25 million TLTRO III benefit. Sequentially, income rose slightly, mainly due to the positive fair value adjustments in Corporate Investments. This more than compensated for lower Corporate Finance fees. Segment Reporting: Wholesale Banking

Corporate Line: Consolidated profit or loss account 29 impact 1) IAS Corporate Line excl. IAS 29 impact Line Corporate Total 2Q2023 3Q2022 3Q2023 2Q2023 3Q2022 3Q2023 2Q2023 3Q2022 3Q2023 In € million Profit or loss 2 11 15 131 173 88 134 184 103 Net interest income - excl. net TLTRO impact 0 0 0 0 - 35 0 0 - 35 0 Net interest income - net TLTRO impact 0 1 3 - 3 - 2 4 - 3 - 1 7 Net fee and commission income 0 0 0 2 111 98 2 111 98 Investment income - 9 - 43 - 106 23 - 21 18 14 - 63 - 88 Other income - 6 - 31 - 88 153 226 208 147 195 120 Total income 6 10 26 109 122 160 115 133 186 Expenses excl. regulatory costs 0 0 0 - 1 1 1 - 1 1 1 Regulatory costs 6 10 26 108 123 161 114 133 187 Operating expenses - 12 - 41 - 114 45 103 47 32 62 - 67 Gross result 0 1 3 0 0 0 0 1 3 Addition to loan loss provisions - 13 - 42 - 117 45 103 47 32 62 - 70 Result before tax of which: 0 0 0 42 - 11 35 42 - 11 35 Income on capital surplus 0 0 0 113 189 102 113 189 102 Foreign currency ratio hedging 0 0 0 - 8 - 55 - 22 - 8 - 55 - 22 Other Group Treasury 0 0 0 147 123 115 147 123 115 Group Treasury 0 0 0 22 114 120 22 114 120 Asian stakes - 13 - 42 - 117 - 124 - 134 - 188 - 136 - 175 - 305 Other Corporate Line - 13 - 42 - 117 45 103 47 32 62 - 70 Result before tax 1 11 4 Taxation - 14 - 53 - 121 Net result ING Press Release 3Q2023 13 1) Hyperinflation accounting (IAS 29) has become applicable for ING’s subsidiary in Türkiye since 2Q2022 with retrospective application from 1 January 2022. Total income in 3Q2023 included an € - 88 million IAS 29 impact, reflecting the application of hyperinflation accounting in the consolidation of our subsidiary in Türkiye. The impact on income was higher than in both comparable quarters, reflecting a higher level of inflation in Türkiye. Excluding this IAS 29 impact, total income decreased by €18 million year - on - year. This was mostly due to lower results from foreign currency ratio hedging (reflecting lower interest differentials, as EUR interest rates increased more than the interest rates of other currencies), partly offset by higher capital charges received from ING entities. Compared with 2Q2023, total income excluding IAS 29 impacts increased by €55 million, mainly reflecting the annual dividend from our stake in the Bank of Beijing recorded in 3Q2023 (€98 million). The third quarter of 2023 included €76 million of incidental cost items, consisting of €26 million of hyperinflation accounting impacts on expenses in Türkiye (versus €10 million in 3Q2022 and €6 million in 2Q2023) and €51 million that we have provisioned. Expenses excluding incidental items decreased by €12 million year - on - year. This was mainly due to one - off restructuring and insurance expenses that had been recorded in 3Q2022. Sequentially, excluding incidental items, expenses were relatively stable. Segment Reporting: Corporate Line

Share information 2Q2023 1Q2023 4Q2022 3Q2022 3Q2023 3,619.5 3,619.5 3,726.5 3,767.3 12.5 1.0 107.4 41.7 3,607.0 3,618.5 3,619.1 3,725.6 3,615.2 3,619.1 3,683.7 3,728.5 3,619.5 116.9 3,502.6 3,557.9 Shares (in millions, end of period) Total number of shares - Treasury shares - Shares outstanding Average number of shares 12.34 10.93 11.39 8.86 12.34 13.49 11.66 9.94 10.81 10.38 8.80 8.50 12.55 13.45 12.22 Share price (in euros) End of period High Low 0.60 0.44 0.30 0.26 14.07 14.28 13.79 13.77 0.35 - 0.39 - 7.7 8.3 11.6 9.5 0.88 0.77 0.83 0.64 0.56 14.77 - 6.6 0.85 Net result per share (in euros) Shareholders' equity per share (end of period in euros) Dividend per share (in euros) Price/earnings ratio 1) Price/book ratio 1) Four - quarter rolling average. Financial calendar Publication results 4Q2023 Publication 2023 ING Group Annual Report 2023 Annual General Meeting Ex - date for final dividend 2023 (Euronext Amsterdam) 1) Thursday 1 February 2024 Thursday 7 March 2024 Monday 22 April 2024 Wednesday 24 April 2024 Record date for final dividend 2023 entitlement (Euronext Amsterdam) 1) Thursday 25 April 2024 Record date for final dividend 2023 entitlement 1) Thursday 25 April 2024 (NYSE) Publication results 1Q2024 Payment date for final dividend 2023 (Euronext 1) Thursday 2 May 2024 Friday 3 May 2024 Amsterdam) Payment date for final dividend 2023 (NYSE) 1) Friday 10 May 2024 1) Only if any dividend is paid All dates are provisional. ING profile ING is a global financial institution with a strong European base, offering banking services through its operating company ING Bank. The purpose of ING Bank is: empowering people to stay a step ahead in life and in business. ING Bank’s more than 60,000 employees offer retail and wholesale banking services to customers in over 40 countries. ING Group shares are listed on the exchanges of Amsterdam (INGA NA, INGA.AS), Brussels and on the New York Stock Exchange (ADRs: ING US, ING.N). Sustainability is an integral part of ING’s strategy, evidenced by ING’s leading position in sector benchmarks. ING's Environmental, Social and Governance (ESG) rating by MSCI was reconfirmed 'AA' in July 2023 for the fourth year. As of August 2022, Sustainalytics considers ING’s management of ESG material risk to be ‘strong’, and in June 2022 ING received an ESG rating of 'strong' from S&P Global Ratings. ING Group shares are also included in major sustainability and ESG index products of leading providers Euronext, STOXX, Morningstar and FTSE Russell. Further information All publications related to ING’s 3Q2023 results can be found at www.ing.com/3q2023, including a video with CEO Steven van Rijswijk. The 'ING ON AIR’ video is also available on YouTube. ING Press Release 3Q2023 14 Additional financial information is available at www.ing.com/ir: • ING Group Results presentation • ING Group Credit Update presentation • ING Group Historical Trend Data For further information on ING, please visit www.ing.com. Frequent news updates can be found in the Newsroom or via the @ING_news X feed. Photos and videos of ING operations, buildings and its executives are available for download at Flickr.

ING Press Release 3Q2023 15 Important legal information Elements of this press release contain or may contain information about ING Groep N.V. and/ or ING Bank N.V. within the meaning of Article 7(1) to (4) of EU Regulation No 596/2014. ING Group’s annual accounts are prepared in accordance with International Financial Reporting Standards as adopted by the European Union (‘IFRS - EU’). In preparing the financial information in this document, except as described otherwise, the same accounting principles are applied as in the 2022 ING Group consolidated annual accounts. All figures in this document are unaudited. Small differences are possible in the tables due to rounding. Certain of the statements contained herein are not historical facts, including, without limitation, certain statements made of future expectations and other forward - looking statements that are based on management’s current views and assumptions and involve known and unknown risks and uncertainties that could cause actual results, performance or events to differ materially from those expressed or implied in such statements. Actual results, performance or events may differ materially from those in such statements due to a number of factors, including, without limitation: (1) changes in general economic conditions and customer behaviour, in particular economic conditions in ING’s core markets, including changes affecting currency exchange rates and the regional and global economic impact of the invasion of Russia into Ukraine and related international response measures (2) ongoing and residual effects of the Covid - 19 pandemic and related response measures on economic conditions in countries in which ING operates (3) changes affecting interest rate levels (4) any default of a major market participant and related market disruption (5) changes in performance of financial markets, including in Europe and developing markets (6) fiscal uncertainty in Europe and the United States (7) discontinuation of or changes in ‘benchmark’ indices (8) inflation and deflation in our principal markets (9) changes in conditions in the credit and capital markets generally, including changes in borrower and counterparty creditworthiness (10) failures of banks falling under the scope of state compensation schemes (11) non - compliance with or changes in laws and regulations, including those concerning financial services, financial economic crimes and tax laws, and the interpretation and application thereof (12) geopolitical risks, political instabilities and policies and actions of governmental and regulatory authorities, including in connection with the invasion of Russia into Ukraine and the related international response measures (13) legal and regulatory risks in certain countries with less developed legal and regulatory frameworks (14) prudential supervision and regulations, including in relation to stress tests and regulatory restrictions on dividends and distributions (also among members of the group) (15) ING’s ability to meet minimum capital and other prudential regulatory requirements (16) changes in regulation of US commodities and derivatives businesses of ING and its customers (17) application of bank recovery and resolution regimes, including write down and conversion powers in relation to our securities (18) outcome of current and future litigation, enforcement proceedings, investigations or other regulatory actions, including claims by customers or stakeholders who feel misled or treated unfairly, and other conduct issues (19) changes in tax laws and regulations and risks of non - compliance or investigation in connection with tax laws, including FATCA (20) operational and IT risks, such as system disruptions or failures, breaches of security, cyber - attacks, human error, changes in operational practices or inadequate controls including in respect of third parties with which we do business (21) risks and challenges related to cybercrime including the effects of cyberattacks and changes in legislation and regulation related to cybersecurity and data privacy (22) changes in general competitive factors, including ability to increase or maintain market share (23) inability to protect our intellectual property and infringement claims by third parties (24) inability of counterparties to meet financial obligations or ability to enforce rights against such counterparties (25) changes in credit ratings (26) business, operational, regulatory, reputation, transition and other risks and challenges in connection with climate change and ESG - related matters, including data gathering and reporting (27) inability to attract and retain key personnel (28) future liabilities under defined benefit retirement plans (29) failure to manage business risks, including in connection with use of models, use of derivatives, or maintaining appropriate policies and guidelines (30) changes in capital and credit markets, including interbank funding, as well as customer deposits, which provide the liquidity and capital required to fund our operations, and (31) the other risks and uncertainties detailed in the most recent annual report of ING Groep N.V. (including the Risk Factors contained therein) and ING’s more recent disclosures, including press releases, which are available on www.ING.com. This document may contain ESG - related material that has been prepared by ING on the basis of publicly available information, internally developed data and other third - party sources believed to be reliable. ING has not sought to independently verify information obtained from public and third - party sources and makes no representations or warranties as to accuracy, completeness, reasonableness or reliability of such information. This document may contain inactive textual addresses to internet websites operated by us and third parties. Reference to such websites is made for information purposes only, and information found at such websites is not incorporated by reference into this document. ING does not make any representation or warranty with respect to the accuracy or completeness of, or take any responsibility for, any information found at any websites operated by third parties. ING specifically disclaims any liability with respect to any information found at websites operated by third parties. ING cannot guarantee that websites operated by third parties remain available following the publication of this document, or that any information found at such websites will not change following the filing of this document. Many of those factors are beyond ING’s control. Any forward looking statements made by or on behalf of ING speak only as of the date they are made, and ING assumes no obligation to publicly update or revise any forward - looking statements, whether as a result of new information or for any other reason. This document does not constitute an offer to sell, or a solicitation of an offer to purchase, any securities in the United States or any other jurisdiction.
ING Groep NV (NYSE:ING)
Historical Stock Chart
From Mar 2024 to Apr 2024

ING Groep NV (NYSE:ING)
Historical Stock Chart
From Apr 2023 to Apr 2024
