The price may increase to the resistance level of $23 and if it does not hold, it may incline to $24 and $25 levels. When the bears interrupt the bulls, price may decrease towards the support level of $22, $21 and $19.
XAGUSD Market
Key Levels:
Resistance levels: $23, $24, $25
Support levels: $22, $21, $19
XAGUSD Long-term trend: Bullish
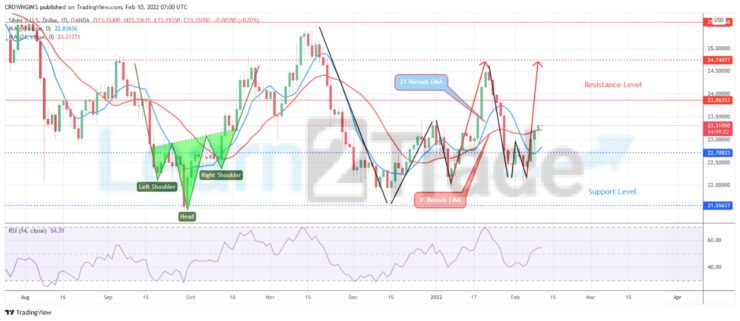
On the daily chart, XAGUSD (Silver) is bullish. There is a formation of double bottom chart pattern at $22 support level. This is a bullish chart pattern which indicate that bulls are increasing their momentum in the Uniswap market. The price is increasing towards the resistance level of $23 at the moment. That means the buyers are in control of the Silver market, further increase envisaged.

There is an increase in bullish momentum as the Silver price is trading above the 9 periods EMA and the 21 periods EMA. The relative strength index period 14 is above 50 levels with the signal lines pointing up displaying bullish direction. The price may increase to the resistance level of $23 and if it does not hold, it may incline to $24 and $25 levels. When the bears interrupt the bulls, price may decrease towards the support level of $22, $21 and $19.
XAGUSD Medium-term Trend: Bullish
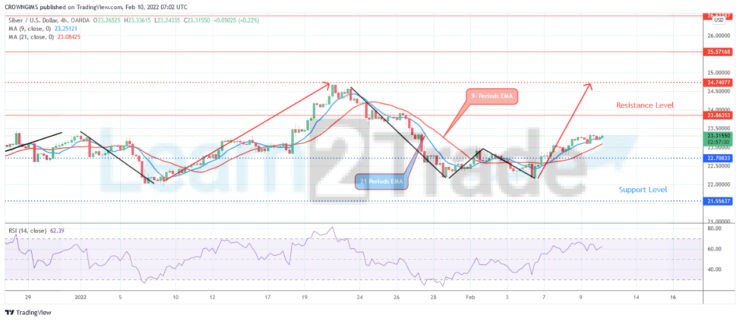
XAGUSD is bullish on the daily chart. The price was bearish last week as the price action was under the formation of “W” chart pattern. The bulls have gained more momentum and the price is increasing accordingly. The price is heading towards the resistance level of $23 at the moment.

The Silver price is trading above the 9 periods EMA and 21 periods EMA. The relative strength index period 14 is above 60 levels with the signal lines pointing up to indicate buy signal.
Source: https://learn2.trade


