Key Highlights
ETH/USD holds above $1,200 support
Ether declines as it targets the $925 low
Ethereum (ETH) Current Statistics
The current price: $1,203.92
Market Capitalization: $147,398,241,426
Trading Volume: $7,386,835,520
Key Resistance Zones: $2,500, $3,300, $4,000
Key Support Zones: $2,000, $1,500, $1,000
Ethereum (ETH) Price Analysis November 18, 2022
Ethereum (ETH) price is declining, but only a little, to the level of the current support. Following the price drop on November 9, the selling pressure decreased. After an upward correction on November 10, the largest altcoin has been restricted to a narrow range. Ether’s price has been fluctuating between levels of $1,070 and $1,350 at the moment.
After the forceful rejection at the $1,350 resistance zone, Ether has been steadily declining. The Coin price falls but stays over $1,200 support. The altcoin will surge above the moving average lines on the plus side if Ether recovers above the existing support. The bullish momentum will then continue to build until it reaches a high of $1,600. On the other hand, if selling pressure picks up again, sellers will drive the coin down below its previous low of $1,071. However, if the bears break the critical support level at $1,071, Ether will fall but the downtrend will be reversed.
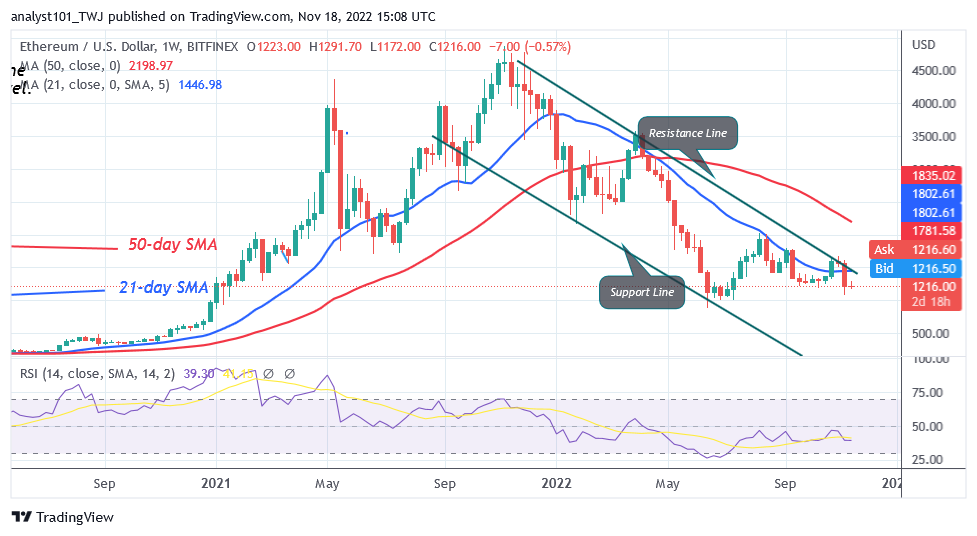
ETH/USD – Weekly Chart
Ethereum Technical Indicators Reading
Ethereum is at level 39 on the Relative Strength Index for period 14. Ether is in a downward trend as it approaches the oversold territory. The price bars are below the lines of Ether’s moving average, suggesting a probable further decline. Ethereum is trading above the 25-point daily stochastic mark. The altcoin is trying to move upward, but the market price has remained unchanged.
Conclusion
Ethereum has been steadily losing value, although this loss has stopped at the $1,200 support level. The price indication predicts that Ether will probably continue to fall below the existing support. Ether experienced an upward correction during the November 9 decline, and a candle body tested the 78.6% Fibonacci retracement level. The correction predicts that Ether will fall but then turn around at $925.23, the level of the 1.272 Fibonacci extension.
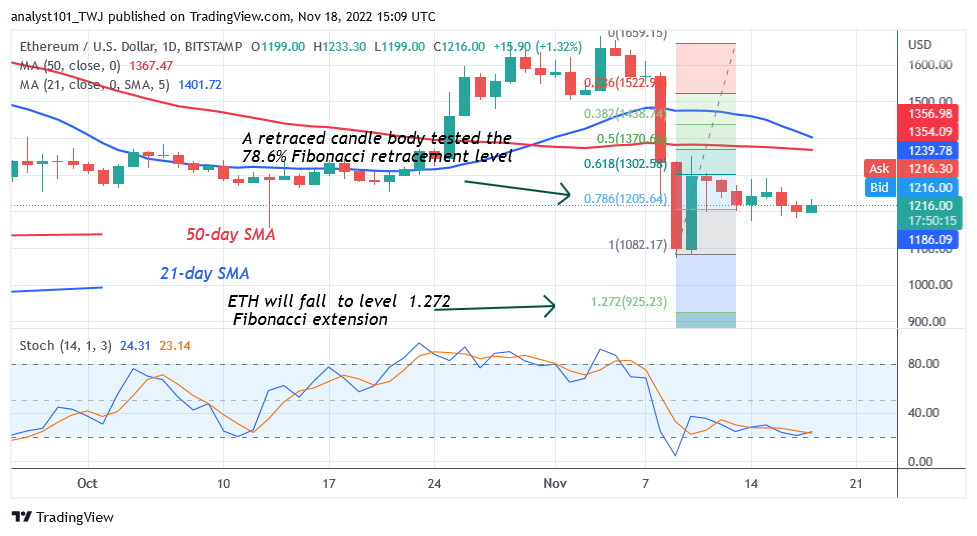
ETH/USD – Daily Chart
Learn from market wizards: Books to take your trading to the next level