Thermo Fisher Scientific Sees Largest Percent Decrease Since October 2011 -- Data Talk Update
October 08 2019 - 4:59PM
Dow Jones News
Thermo Fisher Scientific Inc. (TMO) closed at $271.93, down
$17.23 or 5.96%
-- Lowest close since Aug. 26, 2019, when it closed at
$270.92
-- Largest percent decrease since Oct. 26, 2011, when it fell
9.15%
-- Earlier Tuesday, Barron's wrote that lifescience-tools
companies took a hit after the medical-testing company Qiagen cut
its quarterly growth estimate and said its CEO would step down
-- Down two consecutive days; down 6.97% over this period
-- Worst two day stretch since the two days ending April 17,
2019, when it fell 7.22%
-- Down 6.64% month-to-date
-- Up 21.51% year-to-date; on pace for best year since 2017,
when it rose 34.57%
-- Down 10.97% from its all-time closing high of $305.43 on July
3, 2019
-- Up 13.32% from 52 weeks ago (Oct. 9, 2018), when it closed at
$239.97
-- Down 10.97% from its 52 week closing high of $305.43 on July
3, 2019
-- Up 30.44% from its 52 week closing low of $208.47 on Dec. 24,
2018
-- Traded as low as $270.33; lowest intraday level since Aug.
26, 2019, when it hit $268.89
-- Down 6.51% at today's intraday low; largest intraday percent
decrease since Aug. 24, 2015, when it fell as much as 7.8%
-- Today's preliminary volume is 3.9 million shares; highest
since June 28, 2019 when 5.2 million shares were traded
-- Fourth worst performer in the S&P 500 today
Source: Dow Jones Market Data, FactSet
(END) Dow Jones Newswires
October 08, 2019 16:44 ET (20:44 GMT)
Copyright (c) 2019 Dow Jones & Company, Inc.
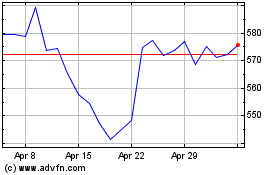
Thermo Fisher Scientific (NYSE:TMO)
Historical Stock Chart
From Mar 2024 to Apr 2024

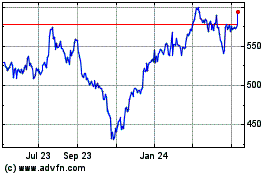
Thermo Fisher Scientific (NYSE:TMO)
Historical Stock Chart
From Apr 2023 to Apr 2024
