BB&T Corporation’s (BBT) first quarter 2011
earnings came in at 32 cents per share, surpassing the Zacks
Consensus Estimate by a penny as well as improving from the
prior-year quarter’s earnings of 27 cents.
BB&T’s results reflected higher net interest margin and
lower non-interest expenses. The quarter witnessed improved credit
quality, enhanced capital ratios and lower provision expenses.
However, a decline in the top line slightly dampened the
results.
The GAAP net income available to common shareholders for the
first quarter was $225 million, up 19.7% from $188 million reported
in the comparable period last year.
BB&T reported first quarter revenue of $2.0 billion, down
7.1% from the year-ago quarter, driven by lower interest income and
fee revenue. Total revenue also missed the Zacks Consensus Estimate
of $2.2 billion.
The efforts to diversify from a concentration in real estate
lending continues to progress well, with BB&T reporting an
increase in average commercial and industrial loans, while
decreasing its construction and other real estate loan
balances.
Quarter in Detail
Tax-equivalent net interest income (NII) slipped 1.9% from the
prior-year quarter to $1.3 billion in the reported quarter. The
fall mainly resulted from a drop in average earnings assets, which
was partly mitigated by higher net interest margin (NIM).
However, NIM in the first quarter stood at 4.01%, up 13 basis
points from 3.88% reported in the prior-year quarter. Higher yields
on loans acquired in the Colonial acquisition and lower deposit
costs accounted for this expansion.
Non-interest income also followed the same path as NII declined
15.4% year over year to $714 million in the quarter. The decline
was primarily caused by $74 million of losses and write-downs on
commercial loans held for sale and $63 million related to FDIC loss
share asset.
Non-interest expense at BB&T descended 2.3% year over year
to $1.37 billion. The decrease was mainly led by a drop in
foreclosed property costs, amortization of intangibles as well as
merger-related and restructuring charges. However, these were
partially offset by higher personnel expense, occupancy and
equipment expense, regulatory charges, and loan processing
expenses.
Credit Quality
BB&T’s credit quality continued to show a sequential
improvement. BB&T's strategic efforts to improve the overall
credit outlook were encouraging, with the company selling off
approximately $500 million in problem assets during the reported
quarter.
As of March 31, 2011, total nonperforming assets (NPAs) declined
2.7% sequentially and stood at $3.9 billion. This marks the fourth
consecutive quarterly decline in NPAs. NPAs as a percentage of
total assets came in at 2.69%, down from 2.73% as of December 31,
2010 and 2.79% as of March 31, 2010.
Provision for credit losses was $340 million, down 47.1%
sequentially and 40.9% year over year.
Net charge-offs (NCOs) were 1.56% of average loans and leases,
down from 2.02% in the prior quarter and 1.84% in the year-ago
quarter. NCOs dropped in all loan portfolios, with the bulk of the
drop in the commercial portfolio.
Overall, with improved nonperforming assets level and loan
delinquencies, the quality of the loan portfolios is improving, and
we find the upbeat outlook on future credit losses encouraging.
Profitability and Capital Ratios
Profitability metrics improved during the quarter. Return on
average assets stood at 0.60%, against 0.54% reported in the prior
quarter and 0.48% reported in the prior-year quarter. Meanwhile,
return on average equity was reported at 5.48%, versus 4.88% in the
prior quarter and 4.59% in the prior-year quarter.
Book value per share was $23.86, up from $23.67 in the prior
quarter and $23.80 reported in the year-ago quarter.
At March 31, 2011, the Tier 1 risk-based capital ratio and Tier
1 common equity to risk-weighted assets ratio were 12.1% and 9.3%
respectively, up from 11.8% and 9.1% as of December 31, 2010.
BB&T’s risk-based capital ratios remained significantly above
the regulatory standards of well-capitalized banks.
Competitors’ Performance
Quite like BB&T, State Street Corporation’s
(STT) first quarter 2011 operating earnings of 88 cents per share
were also ahead of the Zacks Consensus Estimate of 85 cents.
Results in the quarter were aided primarily by growth in operating
revenues and higher net interest margin, which were offset partly
by higher operating expenses.
However, another peer, The Bank of New York Mellon
Corporation (BK) reported first quarter earnings from
continuing operations of 50 cents per share, which came in 7 cents
below the Zacks Consensus Estimate. Though increased fee revenue
wiped out provision for credit losses and rapidly growing capital
were also among the positives, lower net interest revenue and
higher non-interest expenses were the downsides.
Our Take
The growth story at BB&T is impressive following its organic
expansion as well as acquisitions. Efforts to reduce its credit
risk and diversifying its loan portfolio also look promising.
However, the company still has significant exposure to problem
assets. Moreover, considering the current challenges related to the
housing market, we believe that substantial development remains
elusive on this front. In addition, we would like to see a
significant top-line improvement before becoming extremely positive
on the stock.
BB&T currently retains a Zacks # 3 Rank, which translates
into a short-term ‘Hold’ rating. Furthermore, considering the
fundamentals, we are maintaining our long-term “Neutral”
recommendation on the shares.
BB&T CORP (BBT): Free Stock Analysis Report
BANK OF NY MELL (BK): Free Stock Analysis Report
STATE ST CORP (STT): Free Stock Analysis Report
Zacks Investment Research
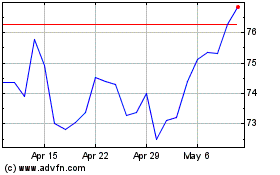
State Street (NYSE:STT)
Historical Stock Chart
From Jun 2024 to Jul 2024

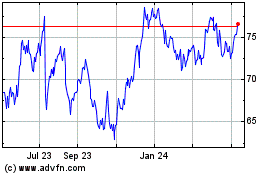
State Street (NYSE:STT)
Historical Stock Chart
From Jul 2023 to Jul 2024
