Chemicals are generally used to make a wide variety of consumer
goods and are also used in agriculture, manufacturing,
construction, and service industries. The chemical industry itself
consumes 26% of its own output. Major industrial customers include
rubber and plastic products, textiles, apparel, petroleum refining,
pulp and paper, and primary metals.
The chemical industry has shown rapid growth for more than fifty
years. The fastest-growing areas have involved the manufacture of
synthetic organic polymers used as plastics, fibers and elastomers.
Globally, the chemical industry is mainly concentrated in three
areas of the world: Western Europe, North America and Japan. The
European community is the largest producer, followed by the U.S.
and Japan.
Chemicals are a nearly $3 trillion global business, and the
European Union (EU) and U.S. chemical companies are the world's
largest producers.
The US chemical industry produces 19% of the world’s chemicals
output, amounting to $689 billion. The industry directly employs
over 800,000 people nationwide. A total of nearly 5.5 million
additional jobs are supported by the purchasing activity of the
chemical industry and by the subsequent expenditure-induced
activity. In addition, the US chemical industry is responsible for
10% of US merchandise exports, totaling $145 billion annually, as
well as 11% of all US patents.
Outlook
The recession had hit the chemical industry hard. As a result of
lack of demand, chemical companies shelved their growth plans. With
plants idled or running at historically low rates, the companies
looked for avenues to streamline operations and increase
productivity. Accordingly, they resorted to restructurings, plant
closures and layoffs. Cost-cutting initiatives at industry majors,
like,
The Dow Chemical Company (DOW) and
EI DuPont de Nemours & Co (DD) helped them
save billions of dollars.
With the economic turnaround, the global chemical industry is
recovering from the recession-hit lows. Domestically, chemical
production volumes increased across all regions of the country in
2010, reversing the steep declines experienced in 2008 and 2009.
The largest gains occurred in the Gulf Coast and Ohio Valley
regions, boosted by export demand for basic chemicals and plastics.
Output is expected to grow moderately in all regions in 2011 and
continue to improve through 2012.
The growth outlook for the U.S. economy remains favorable, despite
the anemic pace in the first quarter. Current expectations are for
a real GDP growth rate in excess of 3% for 2011.
End-markets for chemical products are showing strong growth. This
growth has been reflected in the earnings releases of most chemical
companies for first quarter 2011.
Eastman Chemical
Company (EMN), for example, reported a 28% increase in
sales revenues, primarily due to improved customer demand in
packaging, transportation and other markets and the positive impact
of growth initiatives.
Combined with the restructuring and cost saving programs that many
chemical companies implemented last year, output growth is driving
high earnings across the sector, to the extent that many companies
are confident of out-performing full year forecasts.
Based on the strong first quarter results, Eastman Chemical Company
expects second quarter 2011 earnings per share to be slightly
higher than first quarter 2011 and full year 2011 earnings per
share to be slightly higher than $9.
Celanese Corp. (CE) revenue also grew 14% year
over year to $1.6 billion in first quarter 2011 driven by higher
volumes across all business segments. Encouraged by the first
quarter strength, the company raised its outlook for full-year
2011.
The company now expects 2011 operating EBITDA to be at least $200
million higher than 2010’s $1,122 million and adjusted earnings per
share to be at least $0.85 higher than 2010’s $3.37, based on a tax
rate and diluted share count of 17% and 158.7 million shares,
respectively.
The Dow Chemical Company (DOW) revenue grew 20%
year over year to $14.7 billion by volume (8%) and pricing (12%)
gains across all business segments and geographical regions,
particularly North America and Europe.
Growth in export markets has been driven by several factors. These
include favorable energy costs (natural gas) due to the abundance
of newly found shale natural gas; and demand from emerging markets,
where recovery and expansion have been the strongest. As per the
American Chemistry Council (ACC), U.S. exports would grow by 9.7%
in 2011, outpacing the expected 7.8% growth in imports.
Further, the cost-containment measures implemented by chemical
companies, such as plant shutdowns, aggressive cost cutting and
production improvements, should continue to bolster industry-wide
margins. The resultant large cash flows could then be leveraged for
growth opportunities.
Dow Chemical, Celanese and Eastman Chemical have long-term strong
Buy recommendations, while DuPont has a long term Buy
recommendation.
End-Market Scenario
In the U.S. there are 170 major chemical companies, operating
internationally with more than 2,800 facilities outside the U.S.
and 1,700 foreign subsidiaries or affiliates operating.
In Europe, especially Germany, the chemical, plastics and rubber
sectors are among the largest industries. Together they generate
about 3.2 million jobs in more than 60,000 companies.
According to the ACC, the Chemical Production Regional Index (CPRI)
rose 0.5% in March 2011, following a revised 0.8% gain in February
2011, as chemical production increased in all regions, with the
largest gains in the Northeast, Mid-Atlantic, Southeast, and West
Coast regions.
U.S manufacturing sector output was up 0.7% in March, following a
0.6% gain during February. Output grew in many key end-use markets
for chemistry products, including construction supplies, motor
vehicles, electrical equipment, furniture, paper and plastic and
rubber products.
The U.S. home building sector is a major consumer market for the
chemicals industry accounting for about 10% of chemical demand.
Nationwide housing starts declined 4.3% to a seasonally adjusted
annual rate of 529,000 units in December 2010, according to the
U.S. Commerce Department. While this was the slowest pace of starts
activity since October 2009, further downside risks from current
levels are limited. Nevertheless, the continued softness in the
U.S. housing industry makes this the weakest end-market for the
Chemicals industry.
Trends in Raw Material Markets
The chemical industry is a large consumer of oil, naphtha and
natural gas, which are widely used as energy and feedstock
inputs.
Oil prices trended upward throughout 2009, and in April 2011, crude
oil prices averaged around $111 per barrel, though they have since
come down to the under-$100 level. With current economic conditions
improving worldwide, global demand for oil is rising, leading to
higher prices. Naphtha prices are also expected to remain elevated
relative to last year’s levels, though they have given ground
lately as well along with crude oil prices.
Over the past five years, the U.S. natural gas markets have seen a
dynamic shift due to the emergence of a new source of energy shale
gas which exists in large quantities with sources close to many big
energy-intensive cities. The abundant availability of shale gas is
not only desirable on environmental considerations, given its lower
carbon footprint relative to coal or oil. But it is also cost
effective, essentially removing a key source of disadvantage for
U.S. based chemicals producers.
OPPORTUNITIES
As per the ACC, favorable dollar exchange rates, growth in emerging
markets and abundant shale gas will drive US chemical exports up
and China will overtake the US as the largest market for
chemical.
The chemical companies are looking at mergers and acquisitions as
an option to grow in the current economic environment. The
companies are focused on exploring growth opportunities in emerging
markets with strong performance in the fast-growing regions of
Asia-Pacific and Latin America, particularly China and Brazil. The
United States expects growth to continue, albeit at a slower rate
than last year. Business conditions are improving, with corporate
profits and investments rising and industrial production showing
solid gains compared with the year before.
One of the largest operators in this space,
DuPont
(DD), recently entered into a definitive agreement to acquire
Denmark’s Danisco for $5.8 billion in cash and the assumption of
$500 million of Danisco’s net debt. This marks the company’s
largest acquisition since its $7.7 billion buy of Pioneer Hi-Bred
International in 1999. The deal will enable DuPont to expand the
company’s offerings in more specialized areas like biofuels and
food enzymes.
DuPont is focused on capturing $1 billion in working capital
productivity gains during the 2011−2013 timeframe. The company is
also on track to achieve a cumulative $600 million in benefits from
fixed cost productivity and restructuring actions in 2011. It is
executing strategies for further development and growth of new
products, particularly for agriculture, photo-voltaics, alternative
energy and materials.
Dow is delivering cost synergies from the Rohm & Haas
acquisition and is targeting synergy capture of $2 billion by the
end of 2012.
WEAKNESSES
The global nature of the industry puts competitive issues into
sharp focus. U.S. producers have responded to competitive pressures
by streamlining operations, relocating manufacturing facilities to
low-cost regions closer to end-markets, and being overall more
nimble and flexible in responding to market opportunities. And it
is not always easy to pull this off.
The recent surge in commodity prices, though subsiding in the last
few days, is adding to the feedstock costs for many of these
producers. Their ability to pass these costs on to end consumers is
not always easy given competitive pressures. As a result, margins
for a number of producers will be under pressure in the coming
quarters.
Additionally, given the industry’s sensitivity to the global
economy, a diminution of growth outlook will be a materially
negative development. The recent turmoil in Europe and its impact
on global growth remain sources of near-term uncertainty.
German chemical company BASF announced plans to lay off at least
2,000 workers as it reported a 68% decrease in its first-quarter
2011 net profit compared with the same period a year ago. The
company said it expects earnings before interest and taxes (EBIT)
to decrease even further as its sales suffer amid weakening
demand.
Calgon Carbon Corporation (CCC), a leader in the
activated carbon sector, faces weak demand for carbon products. The
company had weak volumes in 2010 and, though activated carbon sales
recovered to some extent in the last reported quarter, we are
skeptical about its sustainability. We expect sales volumes in the
segment to remain challenging as the end-markets have yet to
recover fully.
There are other possible hurdles that chemical makers may have to
face such as pending rule changes within US regulatory agencies.
The U.S. EPA has proposed a sweeping new rule that could impose
stricter hazardous air pollutant emissions limitation and other
requirement on operators of new and existing boilers and process
heaters.
According to EPA’s calculations, compliance with these rules would
cost boiler owners $12.2 billion to implement and annualized cost
of $4.1 billion after accounting for savings and also result in
mill closures.
The largest corporate producers worldwide with plants in numerous
countries include BASF, Bayer,
Braskem S.A. (BAK),
Celanese Corp., Degussa, The Dow Chemical Co., EI DuPont de Nemours
& Co., Eastman Chemical Company, ExxonMobil, INEOS,
Mitsubishi UFJ Financial Group, Inc. (MTU),
PPG Industries Inc. (PPG), SABIC and Shell, along
with thousands of smaller firms.
BRASKEM SA (BAK): Free Stock Analysis Report
CALGON CARBON (CCC): Free Stock Analysis Report
CELANESE CP-A (CE): Free Stock Analysis Report
DU PONT (EI) DE (DD): Free Stock Analysis Report
DOW CHEMICAL (DOW): Free Stock Analysis Report
EASTMAN CHEM CO (EMN): Free Stock Analysis Report
MITSUBISHI-UFJ (MTU): Free Stock Analysis Report
PPG INDS INC (PPG): Free Stock Analysis Report
Zacks Investment Research
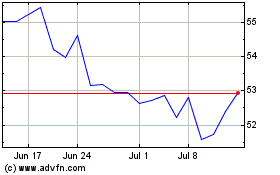
Dow (NYSE:DOW)
Historical Stock Chart
From May 2024 to Jun 2024

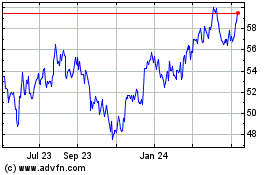
Dow (NYSE:DOW)
Historical Stock Chart
From Jun 2023 to Jun 2024
