Sherwin-Williams Beats Estimates - Analyst Blog
October 25 2011 - 7:38AM
Zacks
Sherwin-Williams Co. (SHW) reported net
earnings of $1.71 per share in the third quarter of 2011, beating
the Zacks Consensus Estimate by a cent.
Net sales for the quarter increased 14.4% year over year to
$2.48 billion driven by acquisitions and selling price increases
and strong organic sales growth by the Global Finishes Group. Sales
were also boosted by favorable currency translation rate changes.
Sherwin-Williams’ third-quarter sales exceeded the Zacks Revenue
Estimate of $2.42 billion.
Cost of goods sold increased 20.5% to $1.45 billion in the
quarter and expressed as a percentage of revenues, it increased to
58.2%. Gross profit surged 6.9% to $103.8 million.
Selling, general and administrative expenses were $760.2
million, an increase of 8.0% over $703.7 million in the prior-year
quarter.
Performance by Segment
The Paint Stores Group posted net sales of $1.42 billion, up
10.2% from the year-ago period. The improvement was largely
attributable to selling price increases and expanding domestic
architectural paint sales volume across most segments. Segment
profit increased 5.2% year over year to $236.9 million and as a
percentage of net sales it decreased in the quarter to 16.7% from
17.5% last year.
Net sales of the Consumer Group inched up 3.3% from the same
period last year to $351.6 million, primarily resulting from
selling price increases, partially offset by the elimination of a
portion of a paint program with a large retail customer. Segment
profit decreased 31.3% to $41.0 million year over year mainly due
to increasing raw material costs, partially offset by selling price
increases and reductions in selling, general, and administrative
expenses.
Net sales of the Global Finishes Group soared 31.2% to $714.4
million in the quarter as a result of acquisitions, higher paint
sales volume, selling price increases and favorable currency
translation rate changes. The segment’s profit was $43.5 million,
up 36.4% from $40 million recorded during the corresponding quarter
of 2010. The progress was derived from increased paint sales volume
and favorable foreign currency translation rate changes.
Share Repurchase
Sherwin-Williams acquired 2.64 million shares of its common
stock through open market purchases in the quarter. The company had
remaining authorization to purchase 1.51 million shares as of
September 30, 2011. On October 19, 2011 the board of directors
authorized the Company to purchase an additional 20 million shares
of the company's stock for treasury purposes.
Outlook
For the fourth quarter of 2011, management anticipates
consolidated net sales to increase 6% to 10% year over year.
Diluted net income per common share for the fourth quarter is
expected to be in the range of $(0.05) to $0.15 per share,
including the one-time charge of $0.72 per share relating to the
IRS settlement, compared with $0.67 per share in 2010.
For the full-year 2011, management expects consolidated net
sales to increase above 2010 levels by a low teen percentage. With
annual sales at that level, the company reaffirmed its full-year
guidance for diluted net income per common share for 2011 at $4.65
to $4.85 per share before the IRS settlement and in the range of
$3.93 to $4.13 per share after the settlement, compared with $4.21
per share earned in 2010.
Based in Cleveland, Ohio, Sherwin-Williams is a developer,
manufacturer, distributor and seller of paints, coatings,
industrial and marine products, original equipment manufacturer
product finishes and related items, and automotive finishes and
refinish products in North and South America, Europe, and Asia. The
company’s key competitors include PPG Industries
Inc. (PPG), The Valspar Corporation (VAL)
and Air Products and Chemicals Inc. (APD).
AIR PRODS & CHE (APD): Free Stock Analysis Report
PPG INDS INC (PPG): Free Stock Analysis Report
SHERWIN WILLIAM (SHW): Free Stock Analysis Report
VALSPAR CORP (VAL): Free Stock Analysis Report
Zacks Investment Research
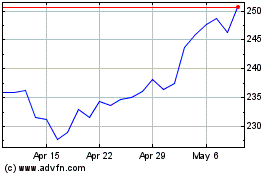
Air Products and Chemicals (NYSE:APD)
Historical Stock Chart
From Jun 2024 to Jul 2024

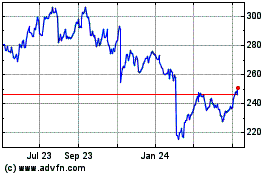
Air Products and Chemicals (NYSE:APD)
Historical Stock Chart
From Jul 2023 to Jul 2024
