Lam Research Corporation's (NASDAQ: LRCX) highlights for the
September 2011 quarter were:
         Lam Research Corporation
   Financial Highlights for the Quarter
         Ended September 25, 2011
 (in thousands, except per share data and
               percentages)

                     U.S. GAAP   Non-GAAP
                     ---------  ---------

Revenue:             $ 680,436  $ 680,436

Operating Margin:         14.6%      14.9%

Net Income:          $  71,838  $  78,265

Diluted EPS:         $    0.58  $    0.63
Lam Research Corporation today announced financial results for
the quarter ended September 25, 2011. Revenue for the period was
$680.4 million, gross margin was $283.9 million (41.7%), and net
income was $71.8 million, or $0.58 per diluted share, compared to
revenue of $752.0 million, gross margin of $338.5 million (45.0%),
and net income of $125.9 million, or $1.01 per diluted share, for
the June 2011 quarter. Shipments for the September 2011 quarter
were $580 million compared to $793 million during the June 2011
quarter.
In addition to U.S. Generally Accepted Accounting Principles
(GAAP) results, this commentary contains non-GAAP financial
measures. The Company's non-GAAP results for both the September
2011 and June 2011 quarters exclude certain costs for restructuring
and impairments and the amortization of convertible note discount.
Additionally, the Company's non-GAAP results for the June 2011
quarter exclude tax expense associated with legal entity
restructuring. Management uses non-GAAP operating income, operating
expenses, operating margin, net income, and net income per diluted
share to evaluate the Company's operating and financial results.
The Company believes the presentation of non-GAAP results is useful
to investors for analyzing business trends and comparing
performance to prior periods, along with enhancing the investors'
ability to view the Company's results from management's
perspective. Tables presenting reconciliations of non-GAAP results
to U.S. GAAP results are included at the end of this press release
and on the Company's web site at
http://investor.lamresearch.com.
Non-GAAP net income was $78.3 million, or $0.63 per diluted
share, in the September 2011 quarter compared to non-GAAP net
income of $142.3 million, or $1.14 per diluted share, for the June
2011 quarter. Gross margin for the September 2011 quarter was
$283.9 million, or 41.7%, compared to gross margin of $338.5
million, or 45.0%, for the June 2011 quarter. The sequential
decrease in gross margin was primarily due to less favorable
product mix and reflects the impact of lower factory utilization as
a result of the decline in business volumes. Non-GAAP operating
expenses for the September 2011 quarter were $182.8 million
compared with the June 2011 quarter of $179.5 million resulting
from our continued increase in research and development
activities.
The geographic distribution of shipments and revenue during the
September 2011 quarter is shown in the following table:
      Region        Shipments      Revenue
----------------- ------------  ------------
North America               22%           19%
Europe                      10%           11%
Japan                       16%           18%
Korea                       27%           25%
Taiwan                      10%           13%
Asia Pacific                15%           14%
Cash and cash equivalents, short-term investments and restricted
cash and investments balances were $2.2 billion at the end of the
September 2011 quarter, compared to $2.3 billion at the end of the
June 2011 quarter. The decrease in cash and cash equivalents,
short-term investments and restricted cash and investments balances
during the quarter was due to activity related to our stock
repurchase program partially offset by cash flows from operating
activities. Cash flows from operating activities were approximately
$86.9 million or 13% of revenue during the September 2011 quarter.
Deferred revenue and deferred profit balances at the end of the
September 2011 quarter were $179.5 million and $112.5 million,
respectively. Lam's deferred revenue balance does not include
shipments to Japanese customers, to whom title does not transfer
until customer acceptance. Shipments to Japanese customers are
classified as inventory at cost until the time of acceptance. The
anticipated future revenue from shipments to Japanese customers was
approximately $43.4 million as of September 25, 2011.
"As expected, our September quarter results reflect the impact
of ongoing macroeconomic uncertainty on wafer fab equipment
spending," said Steve Newberry, Lam's chief executive officer and
vice chairman. "While customers are currently delaying near-term
expansion plans, they continue to make investments in leading edge
technologies that enhance their competitiveness. We expect that
when advanced technology device demand increases, capacity
expansion will resume. Lam traditionally excels in this
environment, and we remain focused on making the critical strategic
investments that extend our technical leadership, strengthen
customer trust and drive our long-term growth," Newberry
concluded.
Caution Regarding Forward-Looking Statements
Statements made in this press release that are not statements of
historical fact are forward-looking statements and are subject to
the safe harbor provisions of the Private Securities Litigation
Reform Act of 1995. Such forward-looking statements relate, but are
not limited, to the anticipated revenue from shipments to Japanese
customers, our future commitment to our current strategic
priorities, future wafer fab spending, customer investment
decisions, and our ability to sustain technical leadership,
strengthen our customer relationships and drive long term growth.
Some factors that may affect these forward-looking statements
include: business conditions in the consumer electronics industry,
the semiconductor industry and the overall economy; the strength of
the financial performance of our existing and prospective
customers; the introduction of new and innovative technologies; the
occurrence and pace of technology transitions and conversions; the
actions of our competitors, consumers, semiconductor companies and
key suppliers and subcontractors; and the success of research and
development and sales and marketing programs. These forward-looking
statements are based on current expectations and are subject to
uncertainties and changes in condition, significance, value and
effect as well as other risks detailed in documents filed by us
with the Securities and Exchange Commission, including specifically
our report on Form 10-K for the year ended June 26, 2011. These
uncertainties and changes could cause actual results to vary from
expectations. The Company undertakes no obligation to update the
information or statements made in this press release.
Lam Research Corporation is a major provider of wafer
fabrication equipment and services to the world's semiconductor
industry. Lam's common stock trades on The NASDAQ Global Select
Market SM under the symbol LRCX. Lam is a NASDAQ-100® company. For
more information, visit www.lamresearch.com.
Consolidated Financial Tables Follow
                          LAM RESEARCH CORPORATION
              CONDENSED CONSOLIDATED STATEMENTS OF OPERATIONS
           (in thousands, except per share data and percentages)
                                (unaudited)

                                             Three Months Ended
                                -------------------------------------------
                                September 25,     June 26,    September 26,
                                     2011           2011           2010
                                -------------  -------------  -------------
Revenue                         $     680,436  $     752,018  $     805,874

Cost of goods sold                    396,553        413,564        428,548
                                -------------  -------------  -------------
  Gross margin                        283,883        338,454        377,326
  Gross margin as a percent of
   revenue                               41.7%          45.0%          46.8%
Research and development              102,559         99,583         86,353
Selling, general and
 administrative                        80,200         79,938         72,142
Restructuring and impairments           1,725         16,742         (5,163)
                                -------------  -------------  -------------
  Total operating expenses            184,484        196,263        153,332
                                -------------  -------------  -------------
  Operating income                     99,399        142,191        223,994
  Operating margin as a percent
   of revenue                            14.6%          18.9%          27.8%
Other expense, net                    (12,073)        (5,131)          (979)
                                -------------  -------------  -------------
  Income before income taxes           87,326        137,060        223,015
Income tax expense                     15,488         11,132         29,291
                                -------------  -------------  -------------
  Net income                    $      71,838  $     125,928  $     193,724
                                =============  =============  =============
Net income per share:
  Basic net income per share    $        0.58  $        1.02  $        1.57
                                =============  =============  =============
  Diluted net income per share  $        0.58  $        1.01  $        1.55
                                =============  =============  =============
Number of shares used in per
 share calculations:
  Basic                               123,130        123,863        123,665
                                =============  =============  =============
  Diluted                             124,049        125,086        125,202
                                =============  =============  =============
                          LAM RESEARCH CORPORATION
                    CONDENSED CONSOLIDATED BALANCE SHEETS
                               (in thousands)

                                                 September 25,    June 26,
                                                      2011          2011
                                                 ------------- -------------
                                                  (unaudited)       (1)
ASSETS
Cash and cash equivalents                        $   1,339,318 $   1,492,132
Short-term investments                                 713,087       630,115
Accounts receivable, net                               523,240       590,568
Inventories                                            396,301       396,607
Deferred income taxes                                   78,330        78,435
Other current assets                                    84,353        88,935
                                                 ------------- -------------
  Total current assets                               3,134,629     3,276,792
Property and equipment, net                            266,411       270,458
Restricted cash and investments                        165,239       165,256
Deferred income taxes                                    4,718         3,892
Goodwill and intangible assets                         212,087       216,616
Other assets                                           117,870       124,380
                                                 ------------- -------------
  Total assets                                   $   3,900,954 $   4,057,394
                                                 ============= =============

LIABILITIES AND STOCKHOLDERS' EQUITY

Current liabilities                              $     594,594 $     684,286
                                                 ------------- -------------

Long-term debt, convertible notes, and capital
 leases                                          $     743,252 $     738,488
Income taxes payable                                   116,509       113,582
Other long-term liabilities                             56,717        51,193
Stockholders' equity                                 2,389,882     2,469,845
                                                 ------------- -------------
  Total liabilities and stockholders' equity     $   3,900,954 $   4,057,394
                                                 ============= =============

(1) Derived from audited financial statements
                          LAM RESEARCH CORPORATION
              CONDENSED CONSOLIDATED STATEMENTS OF CASH FLOWS
                               (in thousands)
                                (unaudited)

                                             Three Months Ended
                                -------------------------------------------
                                September 25,     June, 26    September 26,
                                     2011           2011           2010
                                -------------  -------------  -------------
CASH FLOWS FROM OPERATING
 ACTIVITIES:
Net income                      $      71,838  $     125,928  $     193,724
Adjustments to reconcile net
 income to net cash provided by
 (used for) operating
 activities:
  Depreciation and amortization        21,360         19,972         17,948
  Deferred income taxes                     -         (6,166)          (783)
  Restructuring and impairment
   charges, net                         1,725         16,742         (5,163)
  Equity-based compensation
   expense                             17,744         14,788         13,009
  Income tax benefit on equity-
   based compensation plans               659          9,283          5,083
  Excess tax benefit on equity-
   based compensation plans            (1,951)        (8,184)        (3,939)
  Amortization of convertible
   note discount                        6,593          3,554              -
  Impairment of investment              1,724              -              -
  Other, net                            1,423            477         (1,964)
  Changes in operating assets
   and liabilities:                   (34,215)        21,714         37,829
                                -------------  -------------  -------------
    Net cash provided by
     operating activities              86,900        198,108        255,744
                                -------------  -------------  -------------

CASH FLOWS FROM INVESTING
 ACTIVITIES:
Capital expenditures and
 intangible assets                    (15,732)       (34,571)       (19,130)
Net sales/maturities
 (purchases) of available-for-
 sale securities                      (85,259)      (316,789)       (24,506)
Transfer of restricted cash and
 investments                               17             (8)           (10)
                                -------------  -------------  -------------
    Net cash used for investing
     activities                      (100,974)      (351,368)       (43,646)
                                -------------  -------------  -------------

CASH FLOWS FROM FINANCING
 ACTIVITIES:
Principal payments on long-term
 debt and capital lease
 obligations                           (1,564)           (81)        (3,333)
Net proceeds from issuance of
 long-term debt & convertible
 notes                                      -        882,831              -
Proceeds from sale of warrants              -        133,830              -
Purchase of convertible note
 hedge                                      -       (181,125)             -
Excess tax benefit on equity-
 based compensation plans               1,951          8,184          3,939
Net cash received in settlement
 (paid in advance for) stock
 repurchase contracts                 (75,000)       (99,589)             -
Treasury stock purchases              (72,053)       (53,753)      (144,795)
Reissuances of treasury stock
 related to employee stock
 purchase plan                          8,858          7,518          7,155
Proceeds from issuance of
 common stock                             164          2,179            835
                                -------------  -------------  -------------
    Net cash provided by (used
     for) financing activities       (137,644)       699,994       (136,199)
                                -------------  -------------  -------------
Effect of exchange rate changes
 on cash                               (1,096)         2,688          6,615
Net increase (decrease) in cash
 and cash equivalents                (152,814)       549,422         82,514
Cash and cash equivalents at
 beginning of period                1,492,132        942,710        545,767
                                -------------  -------------  -------------
Cash and cash equivalents at
 end of period                  $   1,339,318  $   1,492,132  $     628,281
                                =============  =============  =============
       Reconciliation of U.S. GAAP Net Income to Non-GAAP Net Income
                   (in thousands, except per share data)
                                (unaudited)

                                                Three Months   Three Months
                                                   Ended          Ended
                                               -------------  -------------
                                               September 25,     June 26,
                                                    2011           2011
                                               -------------  -------------
U.S. GAAP net income                           $      71,838  $     125,928
Pre-tax non-GAAP items:
  Restructuring and impairments - operating
   expenses                                            1,725         16,742
  Amortization of convertible note discount -
   other income (expense), net                         6,593          3,554
  Impairment of investment - other
   income(expense), net                                1,724              -
Net tax benefit on non-GAAP items                     (3,615)        (8,224)
Tax expense associated with legal entity
 restructuring                                             -          4,289
                                               -------------  -------------
Non-GAAP net income                            $      78,265  $     142,289
                                               =============  =============
Non-GAAP net income per diluted share          $        0.63  $        1.14
                                               =============  =============
Number of shares used for diluted per share
 calculation                                         124,049        125,086
Reconciliation of U.S. GAAP Operating Expenses and Operating Income to Non-
                GAAP Operating Expenses and Operating Income
                     (in thousands, except percentages)
                                (unaudited)

                                                Three Months   Three Months
                                                   Ended          Ended
                                               -------------  -------------
                                               September 25,     June 26,
                                                    2011           2011
                                               -------------  -------------
U.S. GAAP gross margin                         $     283,883  $     338,454

U.S. GAAP operating expenses                   $     184,484  $     196,263
Pre-tax non-GAAP items:
  Restructuring and impairments - operating
   expenses                                           (1,725)       (16,742)
                                               -------------  -------------
Non-GAAP operating expenses                    $     182,759  $     179,521
                                               =============  =============
Non-GAAP operating income                      $     101,124  $     158,933
                                               =============  =============
Non-GAAP operating margin as a percent of
 revenue                                                14.9%          21.1%
Lam Research Corporation Contact: Shanye Hudson Director,
Investor Relations phone: 510-572-4589 e-mail: Email Contact
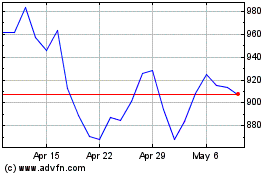
Lam Research (NASDAQ:LRCX)
Historical Stock Chart
From Jun 2024 to Jul 2024

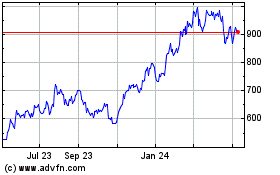
Lam Research (NASDAQ:LRCX)
Historical Stock Chart
From Jul 2023 to Jul 2024
