Halliburton Beats Profit Forecasts -- WSJ
October 23 2018 - 3:02AM
Dow Jones News
By Micah Maidenberg
This article is being republished as part of our daily
reproduction of WSJ.com articles that also appeared in the U.S.
print edition of The Wall Street Journal (October 23, 2018).
Halliburton Co. was able to lift revenue and profit during the
third quarter past expectations, but the oil-field services company
said demand for some of its key operations came in weaker than
anticipated.
Houston-based Halliburton said infrastructure constraints in
North America and what it termed as customer "budget exhaustion"
resulted in less demand for its completion services, which make
wells ready for use.
The company is active in the Permian Basin of Texas and New
Mexico, which has been the center of the U.S. shale boom. Drillers
are pumping so much oil and gas in the region that pipeline
infrastructure there has been overwhelmed, leading to
bottlenecks.
Halliburton's completion-and-production segment is its biggest,
providing oil and gas producers with the tools, services and
chemicals they need. The segment booked sales of $4.17 billion in
the third quarter, up 15% from the year-earlier quarter. But
revenue from the unit was flat versus the second quarter. For North
America, Halliburton said sales increased 18% from a year earlier,
to $3.74 billion, but sales for the region declined slightly
compared with the second quarter.
Chief executive Jeff Miller said Halliburton believes the demand
issues in North American are temporary. A range of demand catalysts
-- including higher commodity prices and expanding capacity -- are
in place, he added.
Overall, sales rose 13% to $6.17 billion for the quarter,
beating than the $6.11 billion analysts expected, according to
FactSet.
Halliburton reported profit of $435 million, or 50 cents a
share, in the third quarter, up 19% compared with the same period
last year. Analysts surveyed by FactSet predicted profit of 49
cents a share.
Write to Micah Maidenberg at micah.maidenberg@wsj.com
(END) Dow Jones Newswires
October 23, 2018 02:47 ET (06:47 GMT)
Copyright (c) 2018 Dow Jones & Company, Inc.
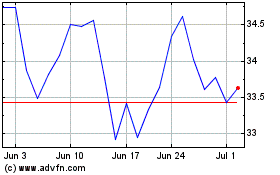
Halliburton (NYSE:HAL)
Historical Stock Chart
From Mar 2024 to Apr 2024

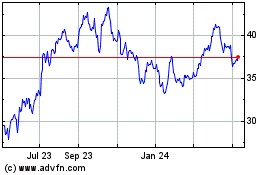
Halliburton (NYSE:HAL)
Historical Stock Chart
From Apr 2023 to Apr 2024
