Interim Results
January 25 2001 - 2:00AM
UK Regulatory
RNS Number:7960X
Mulberry Group PLC
25 January 2001


INTERIM RESULTS FOR THE SIX MONTHS TO 30 SEPTEMBER 2000

HIGHLIGHTS


- Underlying sales up #700,000.  Gross profit margins
rise to 53.5%. (1999: 49.4%)

- UK retail sales up 9% like for like, driven by 20%
increase in handbags and luxury accessories.

- Group borrowings under #1 million following completion
of investment by Challice.

- New York flagship opening on course for Spring 2002.

- Young British designer Scott Henshall appointed.   His
first full collection to be shown to the trade in
February.

- Christmas like for like sales up 12%.


Roger Saul commented

"We are achieving strong sales growth in the UK and
abroad with our luxury accessories business. We are
investing heavily in design and marketing resources and I
believe that this, together with our new partnership with
Christina Ong, is building a strong platform for future
growth."

Contacts:

WMC Communications
James Chandler           020 7591 3999

Teather & Greenwood Limited
Mark Taylor                   020 7426 9000

CHAIRMAN AND CHIEF EXECUTIVE'S REVIEW

I  am  pleased to report that the trading performance  of
the  Group has continued to make steady progress  in  the
six months to 30 September 2000.  Like for like sales  in
our  full price UK retail outlets increased by 9% overall
and   20%  for  accessories.  Wholesale  orders  for  the
autumn/winter 2000 season showed an increase  of  34%  in
ready  to  wear  and 8% for accessories compared  to  the
previous year.

The underlying trading losses for the period were reduced
by  #550,000  compared  to the previous  year  which  had
benefited by approximately #500,000 from the one-off sale
of  stock  to  Kravet, as a result of  the  agreement  to
license the home furnishings business.

On  11 September 2000, we completed the inward investment
of #7.6 million by Challice Limited and have subsequently
reduced  the  Group's borrowing to less than #1  million,
giving  us  substantial facilities to  finance  the  next
stage of our growth.

STRATEGY

The  key  to our improved financial performance has  been
the  focus on accessories. In particular we have invested
in the design function and focussed on sales in the UK to
strengthen the profitable base of the Group.

We  are putting increased investment behind the ready  to
wear  design  team.  We have appointed the young  British
designer,  Scott  Henshall,  to  take  over  the   design
direction of womens ready to wear.   The new autumn range
will be shown to the trade in February.

We  have engaged leading design consultants, Four IV,  to
work with us on a complete review of the brand as well as
the next generation of retail presentation.

These investments in the future will result in additional
overhead  expenditure in the second half.  I am confident
that  they  will lay the right foundations for  the  next
stage of our growth and our return to profitability.


FINANCIAL REVIEW

Sales were #10.6 million (1999:#12.1 million) producing a
reduced  loss  of  #0.65  million  (1999:#0.70  million).
Underlying  sales increased by #0.7 million  and  trading
losses  reduced by #0.55 million after adjusting for  the
sales  transferred to the home licensee and their one-off
purchase of stock in September 1999.

Gross  profit  increased from 49.4% to  53.5%  reflecting
both  the  benefit  of  improved sourcing  and  a  higher
proportion  of  sales being made through our  own  retail
outlets.  Overheads were reduced by #0.4 million  in  the
period  compared  to  the  prior  year  as  a  result  of
continuing  tight  cost  control  and  the  reduced  home
division costs resulting from the license agreement.  The
balance  sheet, which is substantially stronger  reflects
the benefit of the Challice investment.


UNITED STATES OF AMERICA

A  key objective of the transaction with Challice Limited
was to enable Mulberry to develop the US market.  We have
commenced  work on the detailed planning of this  project
and  anticipate opening a flagship store in New  York  in
spring  2002. The timing of these plans will be  affected
by the ability to find the appropriate properties as well
as  the  careful consideration of the product to be  sold
and the positioning of the brand.


CURRENT TRADING AND OUTLOOK

Like  for like sales in our full price UK retail  outlets
for  the  quarter to 30 December 2000 increased  by  10%,
despite  the impact of the disruption caused by the  rail
crisis  and for the month of December increased  by  12%.
The   spring/summer  2001  wholesale  order  books   show
significant increases over last year for both accessories
and ready to wear.  Our major franchise shop partners and
wholesale customers in the UK and Europe have had a  good
autumn  season  with the Mulberry brand.  We  expect  the
sales  growth  experienced in the  first  six  months  to
continue in the second half.

Roger Saul
Chairman & Chief Executive
25 January 2001

CONSOLIDATED PROFIT AND LOSS ACCOUNT


                               Unaudite  Unaudite   Audited
                                    d 6       d 6        12
                                 months    months    months
                                     to        to        to
                                30.9.00   30.9.99   31.3.00
                                  #'000     #'000     #'000

TURNOVER                         10,577    12,149    26,390
Cost of sales                   (4,923)   (6,143)  (12,945)
                               --------  --------  --------
                                      -         -         -
GROSS PROFIT                      5,654     6,006    13,445
Other operating expenses        (5,981)   (6,374)  (13,492)
(net)
                               --------  --------  --------
                                      -         -         -
OPERATING LOSS                    (327)     (368)      (47)
Group share of profit of
associated company                    -         -        16
Interest payable and similar
charges                           (319)     (330)     (635)
                               --------  --------  --------
                                      -         -         -

Loss on ordinary activities
before taxation                   (646)     (698)     (666)

Tax on loss on ordinary
activities (note 2)                   -         -      (14)
                               --------  --------  --------
                                      -         -         -
LOSS FOR THE PERIOD               (646)     (698)     (680)
Dividends                             -         -         -
                               --------  --------  --------
                                      -         -         -

RETAINED PROFIT/(ACCUMULATED      (646)     (698)     (680)
LOSS)
                               ========  ========  ========
                                      =         =         =

Loss per share                  (2.86p)   (3.32p)   (3.24p)

Dividend per share                  Nil       Nil       Nil
                                  pence     pence     pence


CONSOLIDATED BALANCE SHEET

                            Unaudited  Unaudited    Audited
                              30.9.00    30.9.99    31.3.00
                                #'000      #'000      #'000

FIXED ASSETS                    5,311      5,803      5,522

CURRENT ASSETS
Stocks                          7,020      6,178      6,278
Debtors                         4,718      5,661      3,628
Cash                                7          7        212
                            ---------  ---------  ---------
                               11,745     11,846     10,118

CREDITORS: Amounts falling
due within one year           (5,878)   (12,029)   (11,679)
                            ---------  ---------  ---------
NET CURRENT ASSETS              5,867      (183)    (1,561)
                            ---------  ---------  ---------
TOTAL ASSETS LESS CURRENT
LIABILITIES                    11,178      5,620      3,961

CREDITORS: Amounts falling
due after one year            (1,057)    (1,934)       (88)
PROVISIONS FOR LIABILITIES
AND CHARGES                         -          -          -
                            ---------  ---------  ---------
NET ASSETS                     10,121      3,686      3,873
                            =========  =========  =========

CAPITAL AND RESERVES
Called up share capital         2,458      1,049      1,299
Reserves                        7,663      2,637      2,574
                            ---------  ---------  ---------
                               10,121      3,686      3,873
                            =========  =========  =========


CASH FLOW STATEMENT

                            Unaudited  Unaudited    Audited
                             6 months   6 months  12 months
                                   to         to         to
                              30.9.00    30.9.99    31.3.00
                                #'000      #'000      #'000

Operating loss                  (327)      (368)       (47)
Depreciation                      376        409        831
Decrease/(increase) in          (742)        218        118
stocks
Decrease/(increase) in        (1,090)      (805)      1,233
debtors
Increase/(decrease) in          1,060         75      (393)
creditors
                            ---------  ---------  ---------
NET CASHFLOW FROM               (723)      (471)      1,742
OPERATIONS

Interest                        (319)      (330)      (644)
Taxation                            0          0       (19)
Capital expenditure             (165)        (7)      (117)
Dividends paid                      0          0          0
                            ---------  ---------  ---------
NET CASHFLOW BEFORE           (1,207)      (808)        962
FINANCING

Financing                       4,410      (654)      (554)
                            ---------  ---------  ---------

INCREASE/(DECREASE) IN CASH
IN THE PERIOD                   3,203    (1,462)        408
                            =========  =========  =========


RECONCILIATION OF NET
CASHFLOW TO MOVEMENT IN NET
DEBT

Increase in cash in the         3,203    (1,462)        408
year
Cash outflow from decrease
in debt and lease finance       2,660        654        804
                            ---------  ---------  ---------
                                5,863      (808)      1,212

Inception of finance leases      (24)       (38)       (30)
                            ---------  ---------  ---------
Movement in net debt            5,839      (846)      1,182

NET DEBT, BEGINNING OF        (7,665)    (8,847)    (8,847)
PERIOD
                            ---------  ---------  ---------
NET DEBT, END OF PERIOD       (1,826)    (9,693)    (7,665)
                            =========  =========  =========


NOTES

1. ACCOUNTING POLICIES

The  interim results contained in this report, which have
not  been  audited, have been prepared  using  accounting
policies consistent with those used in the preparation of
the  annual  report and accounts for the  year  ended  31
March 2000.


2. TAXATION

The corporation tax charge for the period is based on the
effective rate which it is estimated will apply  for  the
full year.


3. COMPARATIVE FIGURES

The comparative figures for the year ended 31 March 2000,
which  do not constitute statutory accounts, are abridged
from  the  company's statutory accounts which  have  been
filed with the Registrar of Companies. The report of  the
auditors  on these accounts was unqualified and  did  not
contain  a statement under section 237(2) or (3)  of  the
Companies Act 1985.


4. APPROVAL AND DISTRIBUTION

This report was approved by the Board of Directors on  24
January  2001  and  is  being sent to  all  shareholders.
Additional   copies  are  available  from   the   Company
Secretary at the Registered Office, Kilver Court, Shepton
Mallet, Bath, BA4 5NF.
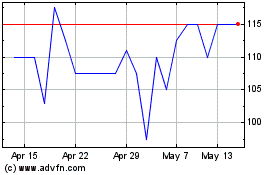
Mulberry (LSE:MUL)
Historical Stock Chart
From Jun 2024 to Jul 2024

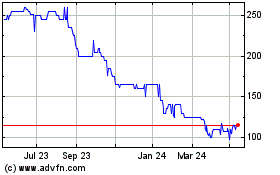
Mulberry (LSE:MUL)
Historical Stock Chart
From Jul 2023 to Jul 2024
