Mulberry Group PLC - Interim Results
January 27 2000 - 2:03AM
UK Regulatory
RNS Number:5103E
Mulberry Group PLC
27 January 2000


MULBERRY GROUP PLC
INTERIM RESULTS FOR THE SIX MONTHS TO 30 SEPTEMBER 1999


HIGHLIGHTS:

        MULBERRY SEES THE FIRST SIGNS OF RECOVERY

     After  two incredibly difficult years we are seeing
 the  first signs of recovery and the benefits of all the
 hard work of our management and staff.

    A clear strategy of focusing on the core accessories
 products  combined  with  the steps  we  have  taken  to
 simplify the business is producing results.

     Our  licensing programme is now well underway  with
 Kravets in the USA and Toray in Japan and we continue to
 look for new strategic global partners.

     Like for like sales for the last six months in  our
 full price UK retail outlets increased by 4% overall and
 12% for Accessories compared to last year.  Like for like
 sales  for  the six weeks to 15 January 2000  were  8.1%
 ahead.

     The  key  ingredients in our turnaround  have  been
 focused  marketing  and  merchandising  and  above  all,
 design.

    Chairman, Roger Saul comments 'As fashion moves away
 from  minimalism towards a return to colour and texture,
 Mulberry  is  now perfectly placed to capture  this  new
 feeling.  We are already seeing a groundswell of success
 with a 12% increase in handbag sales this last Autumn.'


For further information:

Roger Saul
Chairman  and Designer, Mulberry Group  Plc          Tel:
01749 340 532


CHAIRMAN'S STATEMENT

After  two  incredibly difficult years we are seeing  the
first signs of recovery and the benefits of all the  hard
work  of  our management and staff.  A clear strategy  of
focusing  on the core accessories products combined  with
the  steps  we  have taken to simplify  the  business  is
producing results.  Our licensing programme is  now  well
underway  with Kravets in the USA and Toray in Japan  and
we  continue  to look for new strategic global  partners.
We maintain our policy of improving the efficiency of our
operations whilst strengthening the innovation and design
flair  that  have  been the foundation  of  the  Mulberry
brand.

This six month period covers the last four months of  the
Spring/Summer 1999 season and the first two months of the
Autumn/Winter 1999 season.  The results for Spring/Summer
continued the pattern of last year with reducing sales at
both retail and wholesale.  The Autumn/Winter 1999 season
has  shown  a  markedly different pattern with  increased
sales at retail.

Like  for like sales for the last six months in our  full
price  UK retail outlets increased by 4% overall and  12%
for  Accessories compared to last year.   Like  for  like
sales  for  the  six weeks to 15 January 2000  were  8.1%
ahead.   Margins  improved during the  period.   We  have
avoided  the  price or margin pressure reported  by  many
British  retailers and stocks are tight.  In  Europe  our
major franchise shop partners have also had a good Autumn
season.

Accordingly, we are confident of an improved  result  for
the  second six months to 31 March 2000 compared to  last
year.   The  key ingredients in our turnaround have  been
focused  marketing  and  merchandising  and  above   all,
design.   We continue to reduce overheads and close  non-
profit making operations.

Over  the last two years we have moved approximately  50%
of  our accessory sourcing from the UK to overseas.   The
full margin benefit of this sourcing is now in place  for
the  second  six  months of the year  as  this  programme
becomes fully operational.

FINANCIAL REVIEW

Sales  were #12.1 million (1998: #12.9 million) producing
a  reduced loss before tax of #0.70 million (1998:  #0.80
million).   The Board is not recommending the payment  of
an interim dividend.

Sales  were reduced by 6%.  This reduction was more  than
offset  by an overall improvement of 4.5% in gross margin
for  the  Group.  This resulted from the success of  both
our  stock reduction policy and better buying,  with  the
result that we sold less product at mark-down compared to
the  previous  year when we were clearing excess  stocks.
Margins in our core accessories division were 4.5% higher
than  last  year due to improved manufacturing efficiency
and the increasing benefit of international sourcing.

The continued focus on cost control resulted in a further
4%  reduction,  on  a like for like basis,  in  operating
expenses  in  the period. (1998 operating  expenses  were
reduced by #0.5 million received as compensation for loss
of sales from our former distributor in Japan).

Interest   costs  were  #0.14  million  less   than   the
comparable  period last year at #0.33 million, reflecting
the reduction in UK interest rates.

Stocks  have reduced to #6.2 million (1998: #7.2 million)
and are #1.0 million lower than a year ago.

HOME LICENSING

The agreement with Kravet to license our home furnishings
business,  which had been signed at the date of  my  last
report,  has been successfully implemented.   All  stocks
were  transferred on 1 September 1999, related  overheads
have  been cut and all costs of the transaction have been
reflected in this period.

We  have  moved  from  a full margin  sales,  design  and
sourcing  business, with the associated overheads,  to  a
royalty income stream based structure controlling  design
and  brand image with dramatically reduced costs.   Sales
for the period include #1.6 million for the sale of stock
to Kravet which was part of the agreement.

Sales  by  Kravet in the four months to 31 December  1999
have been at higher levels than last year and we have now
designed  the  largest and most exciting new  ranges  for
launch  in Spring.  We are confident that this will  lead
to a growing level of royalty receipts.

JAPAN

The  appointment of Toray as our master licensee has been
concluded   successfully  and   following   approval   by
shareholders  on  1  November 1999, their  investment  of
#250,000 in 1% preference shares has been completed.   We
are currently discussing the first potential sub-licenses
and    look   forward   to   developing   this   business
relationship.   This  is  a long-term  project  of  great
strategic importance and we anticipate that the  benefits
will begin to show in the year to 31 March 2002.

Roger Saul
Chairman
27 January 2000
CONSOLIDATED PROFIT AND LOSS ACCOUNT


                              Unaudited Unaudited   Audited
                                      6         6        12
                                 months    months    months
                                     to        to        to
                                30.9.99   30.9.98   31.3.99
                                  #'000     #'000     #'000

TURNOVER                         12,149    12,945    27,393
Cost of sales                   (6,143)   (7,134)  (14,974)
                               --------  --------  --------
                                      -         -         -
GROSS PROFIT                      6,006     5,811    12,419
Other operating expenses        (6,374)   (6,144)  (13,291)
(net)
                               --------  --------  --------
                                      -         -         -
OPERATING PROFIT/(LOSS)           (368)     (333)     (872)
Group share of loss of
associated company                    -         -      (47)
Interest payable and similar
charges                           (330)     (470)     (860)
                               --------  --------  --------
                                      -         -         -

Profit/(loss) on ordinary
activities before taxation        (698)     (803)   (1,779)

Tax on profit/(loss) on
ordinary activities (note 2)          -       240       (8)
                               --------  --------  --------
                                      -         -         -
PROFIT/(LOSS) FOR THE PERIOD      (698)     (563)   (1,787)
Dividends                             -         -         -
                               --------  --------  --------
                                      -         -         -

RETAINED PROFIT/(ACCUMULATED      (698)     (563)   (1,787)
LOSS)
                               ========  ========  ========

Earnings/(loss) per share       (3.32p)   (2.70p)   (8.57p)

Dividend per share                  Nil       Nil       Nil
                                  pence     pence     pence


CONSOLIDATED BALANCE SHEET


                            Unaudited  Unaudited    Audited
                              30.9.99    30.9.98    31.3.99
                                #'000      #'000      #'000

FIXED ASSETS                    5,803      6,284      6,168

CURRENT ASSETS
Stocks                          6,178      7,225      6,396
Debtors                         5,661      6,950      4,856
Cash                                7         17          -
                            ---------  ---------  ---------
                               11,846     14,192     11,252

CREDITORS: Amounts falling
due within one year          (12,029)   (11,159)   (10,986)
                            ---------  ---------  ---------
NET CURRENT                     (183)      3,033        266
(LIABILITIES)/ASSETS
                            ---------  ---------  ---------
TOTAL ASSETS LESS CURRENT
LIABILITIES                     5,620      9,317      6,434

CREDITORS: Amounts falling
due after one year            (1,934)    (3,707)    (2,050)
PROVISIONS FOR LIABILITIES
AND CHARGES                         -       (10)          -
                            ---------  ---------  ---------
NET ASSETS                      3,686      5,600      4,384
                            =========  =========  =========

CAPITAL AND RESERVES
Called up share capital         1,049      1,036      1,049
Reserves                        2,637      4,564      3,335
                            ---------  ---------  ---------
                                3,686      5,600      4,384
                            =========  =========  =========


CASH FLOW STATEMENT


                            Unaudited  Unaudited    Audited
                             6 months   6 months  12 months
                                   to         to         to
                              30.9.99    30.9.98    31.3.99
                                #'000      #'000      #'000

Operating profit/(loss)         (368)      (333)      (872)
Depreciation                      409        494        883
Decrease/(increase) in            218        709      1,538
stocks
Decrease/(increase) in          (805)      (566)      1,256
debtors
Increase/(decrease) in             75        988      (490)
creditors
                            ---------  ---------  ---------
NET CASHFLOW FROM               (471)      1,292      2,315
OPERATIONS

Interest                        (330)      (470)      (843)
Taxation                            0          0        234
Capital expenditure               (7)      (466)      (806)
Dividends paid                      0       (56)       (56)
                            ---------  ---------  ---------
NET CASHFLOW BEFORE             (808)        300        844
FINANCING

Financing                       (654)      (580)      (429)
                            ---------  ---------  ---------

(DECREASE)/INCREASE IN CASH
IN THE PERIOD                 (1,462)      (280)        415
                            =========  =========  =========


RECONCILIATION OF NET
CASHFLOW TO MOVEMENT IN NET
DEBT

(Decrease)/Increase in cash
in the year                   (1,462)      (280)        415
Cash outflow from decrease
in debt and lease finance         654        580        429
                            ---------  ---------  ---------
                                (808)        300        844

Inception of finance leases      (38)       (12)       (54)
                            ---------  ---------  ---------
Movement in net debt            (846)        288        790

NET DEBT, BEGINNING OF        (8,847)    (9,637)    (9,637)
PERIOD
                            ---------  ---------  ---------
NET DEBT, END OF PERIOD       (9,693)    (9,349)    (8,847)
                            =========  =========  =========


NOTES

1. ACCOUNTING POLICIES
   The  interim  results contained in this report,  which
   have  not  been  audited,  have  been  prepared  using
   accounting policies consistent with those used in  the
   preparation of the annual report and accounts for  the
   year ended 31 March 1999.

2. TAXATION
   The corporation tax charge for the period is based  on
   the  effective rate which it is estimated  will  apply
   for the full year.

3. COMPARATIVE FIGURES
   The  comparative figures for the year ended  31  March
   1999, which do not constitute statutory accounts,  are
   abridged  from the company's statutory accounts  which
   have been filed with the Registrar of Companies.   The
   report   of   the  auditors  on  these  accounts   was
   unqualified  and  did not contain  a  statement  under
   section 237(2) or (3) of the Companies Act 1985.

4. APPROVAL AND DISTRIBUTION
   This report was approved by the Board of Directors  on
   26   January   2000   and  is  being   sent   to   all
   shareholders.   Additional copies are  available  from
   the   Company  Secretary  at  the  Registered  Office:
   Kilver Court, Shepton Mallet, Bath, BA4 5NF.


END

IR SEDFUMSSSELF
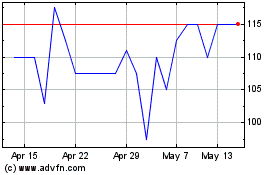
Mulberry (LSE:MUL)
Historical Stock Chart
From Jun 2024 to Jul 2024

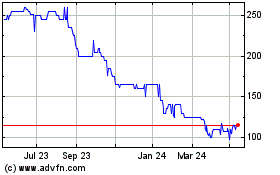
Mulberry (LSE:MUL)
Historical Stock Chart
From Jul 2023 to Jul 2024
