Final Results -12-
March 25 2009 - 3:01AM
UK Regulatory
| in U.S. dollars per   |  |             |  |             |  |          |  |             |  |             |  |          |  |
| share)                |  |             |  |             |  |          |  |             |  |             |  |          |  |
+-----------------------+--+-------------+--+-------------+--+----------+--+-------------+--+-------------+--+----------+--+


  Consolidated Balance Sheet
+-----------------------------------------------+--+-----------+--+----------+--+
|                                               |  |    As at 31 December    |  |
+-----------------------------------------------+--+-------------------------+--+
|                                               |  |   2008    |  |  2007    |  |
+-----------------------------------------------+--+-----------+--+----------+--+
|                                               |  |          US$(000)          |
+-----------------------------------------------+--+----------------------------+
| ASSETS                                        |  |           |  |          |  |
+-----------------------------------------------+--+-----------+--+----------+--+
| Non-current assets                            |  |           |  |          |  |
+-----------------------------------------------+--+-----------+--+----------+--+
| Property, plant and equipment                 |  |   488,984 |  |  263,062 |  |
+-----------------------------------------------+--+-----------+--+----------+--+
| Intangible assets                             |  |     2,668 |  |    2,896 |  |
+-----------------------------------------------+--+-----------+--+----------+--+
| Investments accounted under equity method     |  |   136,019 |  |        - |  |
+-----------------------------------------------+--+-----------+--+----------+--+
| Available-for-sale financial assets           |  |    17,794 |  |   15,100 |  |
+-----------------------------------------------+--+-----------+--+----------+--+
| Trade and other receivables                   |  |    38,304 |  |   25,518 |  |
+-----------------------------------------------+--+-----------+--+----------+--+
| Income tax receivable                         |  |       802 |  |      616 |  |
+-----------------------------------------------+--+-----------+--+----------+--+
| Deferred income tax assets                    |  |    20,795 |  |   22,400 |  |
+-----------------------------------------------+--+-----------+--+----------+--+
|                                               |  |   705,366 |  |  329,592 |  |
+-----------------------------------------------+--+-----------+--+----------+--+
| Current assets                                |  |           |  |          |  |
+-----------------------------------------------+--+-----------+--+----------+--+
| Inventories                                   |  |    49,220 |  |   47,012 |  |
+-----------------------------------------------+--+-----------+--+----------+--+
| Trade and other receivables                   |  |   123,726 |  |  134,180 |  |
+-----------------------------------------------+--+-----------+--+----------+--+
| Income tax receivable                         |  |    14,470 |  |    1,003 |  |
+-----------------------------------------------+--+-----------+--+----------+--+
| Financial assets at fair value through profit |  |     5,569 |  |    8,039 |  |
| and loss                                      |  |           |  |          |  |
+-----------------------------------------------+--+-----------+--+----------+--+
| Cash and cash equivalents                     |  |   116,147 |  |  301,426 |  |
+-----------------------------------------------+--+-----------+--+----------+--+
|                                               |  |   309,132 |  |  491,660 |  |
+-----------------------------------------------+--+-----------+--+----------+--+
| Total assets                                  |  | 1,014,498 |  |  821,252 |  |
+-----------------------------------------------+--+-----------+--+----------+--+
|                                               |  |           |  |          |  |
+-----------------------------------------------+--+-----------+--+----------+--+
| EQUITY AND LIABILITIES                        |  |           |  |          |  |
+-----------------------------------------------+--+-----------+--+----------+--+
| Capital and reserves attributable to          |  |           |  |          |  |
| shareholders of the Parent                    |  |           |  |          |  |
+-----------------------------------------------+--+-----------+--+----------+--+
| Equity share capital                          |  |   146,466 |  |  146,466 |  |
+-----------------------------------------------+--+-----------+--+----------+--+
| Share premium                                 |  |   395,928 |  |  395,928 |  |
+-----------------------------------------------+--+-----------+--+----------+--+
| Other reserves                                |  |  (250,831 | )| (205,556 | )|
+-----------------------------------------------+--+-----------+--+----------+--+
| Retained earnings                             |  |   182,612 |  |  229,202 |  |
+-----------------------------------------------+--+-----------+--+----------+--+
|                                               |  |   474,175 |  |  566,040 |  |
+-----------------------------------------------+--+-----------+--+----------+--+
| Minority interest                             |  |    68,843 |  |   50,008 |  |
+-----------------------------------------------+--+-----------+--+----------+--+
| Total equity                                  |  |   543,018 |  |  616,048 |  |
+-----------------------------------------------+--+-----------+--+----------+--+
| Non-current liabilities                       |  |           |  |          |  |
+-----------------------------------------------+--+-----------+--+----------+--+
| Trade and other payables                      |  |       627 |  |      859 |  |
+-----------------------------------------------+--+-----------+--+----------+--+
| Borrowings                                    |  |   231,692 |  |   55,209 |  |
+-----------------------------------------------+--+-----------+--+----------+--+
| Provisions                                    |  |    37,687 |  |   30,821 |  |
+-----------------------------------------------+--+-----------+--+----------+--+
| Deferred income tax liabilities               |  |    15,839 |  |    9,091 |  |
+-----------------------------------------------+--+-----------+--+----------+--+
|                                               |  |   285,845 |  |   95,980 |  |
+-----------------------------------------------+--+-----------+--+----------+--+
| Current liabilities                           |  |           |  |          |  |
+-----------------------------------------------+--+-----------+--+----------+--+
| Trade and other payables                      |  |    82,291 |  |   52,176 |  |
+-----------------------------------------------+--+-----------+--+----------+--+
| Borrowings                                    |  |    98,070 |  |   33,169 |  |
+-----------------------------------------------+--+-----------+--+----------+--+
| Provisions                                    |  |     4,277 |  |   13,029 |  |
+-----------------------------------------------+--+-----------+--+----------+--+
| Income tax payable                            |  |       997 |  |   10,850 |  |
+-----------------------------------------------+--+-----------+--+----------+--+
|                                               |  |   185,635 |  |  109,224 |  |
+-----------------------------------------------+--+-----------+--+----------+--+
| Total liabilities                             |  |   471,480 |  |  205,204 |  |
+-----------------------------------------------+--+-----------+--+----------+--+
| Total equity and liabilities                  |  | 1,014,498 |  |  821,252 |  |
+-----------------------------------------------+--+-----------+--+----------+--+


Consolidated Cash Flow Statement
+-----------------------------------------------+--+----------+--+----------+--+
|                                               |  |Year ended 31 December  |  |
+-----------------------------------------------+--+------------------------+--+
|                                               |  |  2008    |  |  2007    |  |
+-----------------------------------------------+--+----------+--+----------+--+
|                                               |  |         US$(000)          |
+-----------------------------------------------+--+---------------------------+
| Cash flows from operating activities          |  |          |  |          |  |
+-----------------------------------------------+--+----------+--+----------+--+
| Cash generated from operations                |  |  102,167 |  |   34,338 |  |
+-----------------------------------------------+--+----------+--+----------+--+
| Interest received                             |  |    7,512 |  |   18,390 |  |
+-----------------------------------------------+--+----------+--+----------+--+
| Interest paid                                 |  |   (4,302 | )|   (1,217 | )|
+-----------------------------------------------+--+----------+--+----------+--+
| Payments of mine closure costs                |  |   (1,476 | )|   (2,023 | )|
+-----------------------------------------------+--+----------+--+----------+--+
| Tax paid                                      |  |  (25,260 | )|  (28,084 | )|
+-----------------------------------------------+--+----------+--+----------+--+
| Net cash generated from operating activities  |  |   78,641 |  |   21,404 |  |
+-----------------------------------------------+--+----------+--+----------+--+
| Cash flows from investing activities          |  |          |  |          |  |
+-----------------------------------------------+--+----------+--+----------+--+
| Purchase of property, plant and equipment     |  | (296,027 | )| (134,119 | )|
+-----------------------------------------------+--+----------+--+----------+--+
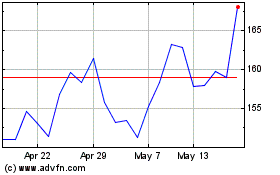
Hochschild Mining (LSE:HOC)
Historical Stock Chart
From Jul 2024 to Aug 2024

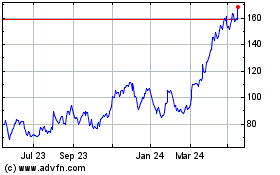
Hochschild Mining (LSE:HOC)
Historical Stock Chart
From Aug 2023 to Aug 2024
