YANGAROO Reports 2016 Annual and Fourth Quarter Results
April 25 2017 - 9:00AM

YANGAROO Inc. (TSX-V:YOO) (OTC:YOOIF), the leading
secure digital media management and distribution company, today
announced its results for the year and fourth quarter ended
December 31, 2016.
Revenue for the fiscal year 2016 was $5,336,831,
3% lower than in fiscal 2015. Revenue for the fourth quarter was
$1,569,355, 3% lower than the revenue for the same period in 2015
and 24% higher than the previous quarter with positive EBITDA of
$181,394. Annual loss from operations was $717,780, a reduction of
24% over the previous year.
Advertising Division had annual revenue of
$2,556,298. Political advertising tends to be committed in advance
and negatively impacted the amount of traditional advertising
traffic, particularly in the second half of the year. Advertising
revenues increased immediately post-election.
Entertainment Division’s annual revenue was
$2,780,533 generally flat over 2015. YANGAROO Awards entered into a
new multi-year agreement with The Tony Awards and renewed
agreements with The Academy of Country Music Awards, The Junos, and
others.
“Despite a challenging US election related
summer and fall in the Advertising division, I am encouraged by the
sales growth in November and December, post-election,” said Gary
Moss, President and CEO of YANGAROO. “We signed up 124 new
customers during the year, capitalizing on the completion of our
television broadcast footprint. Significant new brand wins
contributed for the first time during the quarter. I am pleased
that the growth from both new and existing customers has continued
into 2017.”
Total operating expenses for the year ended
December 31, 2016 was $6,054,611, 6% lower than the previous year,
primarily as a result of cost management and completion of vesting
of majority of stock options. The loss from operations for 2016 was
$717,780, down from $945,225 in 2015, a 24% improvement. Excluding
the impact of non-cash and non-operating costs, the fourth quarter
of 2016 had positive normalized cash flow of $160,093.
Summary of operating results for the
years and fourth quarters ended December 31:
|
$CDN |
Year |
4th Quarter |
|
|
2016 |
2015 |
2016 |
2015 |
|
Revenue |
5,336,831 |
|
5,489,070 |
|
1,569,355 |
1,610,115 |
|
EBITDA (loss) |
(663,184 |
) |
(648,872 |
) |
181,394 |
373,229 |
|
Normalized EBITDA (loss) |
(547,712 |
) |
(707,010 |
) |
160,093 |
234,038 |
|
Net gain (loss) for the period |
(834,933 |
) |
(797,214 |
) |
139,987 |
331,986 |
|
Gain (loss) per share (basic & diluted) |
(0.014 |
) |
(0.014 |
) |
0.002 |
0.006 |
| |
|
|
|
|
|
|
Please note, all currency in this press release
is denoted in Canadian dollars.
The full text of the financial statements and
Management Discussion & Analysis is available at
www.yangaroo.com and at www.sedar.com.
About YANGAROO:
YANGAROO is a company dedicated to digital media
management. YANGAROO’s patented Digital Media Distribution System
(DMDS) is a secure cloud-based platform that provides users the
ability to leverage technology; automating dozens of steps to
eliminate errors and streamline content delivery efficiently.
Content, such as music, music videos, and advertising can be
quickly distributed to a network of over 11,000 television, radio,
media, retailers, and other authorized recipients. The YANGAROO
Awards platform is the industry standard and powers most of North
America's major awards shows.
YANGAROO has offices in Toronto, New York, and
Los Angeles. YANGAROO trades on the TSX Venture Exchange (TSX-V)
under the symbol YOO and in the U.S. under OTCBB: YOOIF.
The statements contained in this release that
are not purely historical are forward-looking statements and are
subject to risks and uncertainties that could cause such statements
to differ materially from actual future events or results. Such
forward-looking statements are made pursuant to the safe harbor
provisions of the Private Securities Litigation Reform Act of 1995.
The TSX Venture Exchange does not accept responsibility for the
adequacy or accuracy of this release.
Contact:

Gary Moss
(416) 534-0607
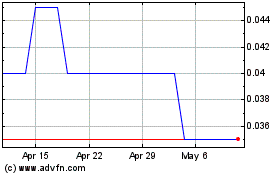
Yangaroo (TSXV:YOO)
Historical Stock Chart
From Dec 2024 to Jan 2025

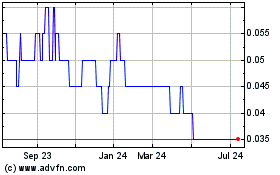
Yangaroo (TSXV:YOO)
Historical Stock Chart
From Jan 2024 to Jan 2025
