false
N-CSRS
N-2
0001546429
0001546429
2024-01-01
2024-06-30
0001546429
bgb:PreferredSharesMember
2024-01-01
2024-06-30
0001546429
bgb:CommonSharesMember
2024-01-01
2024-06-30
0001546429
2024-06-30
iso4217:USD
xbrli:shares
iso4217:USD
xbrli:shares
xbrli:pure
UNITED
STATES
SECURITIES
AND EXCHANGE COMMISSION
Washington,
D.C. 20549
FORM
N-CSR
CERTIFIED
SHAREHOLDER REPORT OF REGISTERED
MANAGEMENT
INVESTMENT COMPANIES
Investment
Company Act file number: 811-22686
Blackstone
Strategic Credit 2027 Term Fund
(exact
name of Registrant as specified in charter)
345
Park Avenue, 31st Floor
New
York, New York 10154
(Address
of principal executive offices) (Zip code)
(Name
and address of agent for service)
Marisa
Beeney
Blackstone
Alternative Credit Advisors LP
345
Park Avenue, 31st Floor
New
York, New York 10154
Registrant’s
telephone number, including area code: (877) 876-1121
Date
of fiscal year end: December 31
Date
of reporting period: June 30, 2024
Item
1. Report to Stockholders.

Table
of Contents
| Manager Commentary |
2 |
| Fund Summary |
4 |
| Portfolio of Investments |
13 |
| Statements of Assets and Liabilities |
72 |
| Statements of Operations |
73 |
| Statements of Changes in Net Assets |
74 |
| Statements of Cash Flows |
75 |
| Financial Highlights |
76 |
| Notes to Financial Statements |
86 |
| Summary of Dividend Reinvestment Plan |
103 |
| Additional Information |
104 |
| Privacy Procedures |
106 |
| Approval of Investment Advisory Agreement |
116 |
| Trustees & Officers |
120 |
| Blackstone Credit &
Insurance Funds |
Manager Commentary |
June
30, 2024 (Unaudited)
To
Our Shareholders:
Strong
market technicals, resilient fundamentals and the potential to earn historically elevated total returns ensured positive performance
across the US loan and high yield markets over the first half of 2024. Loans beat high yield, gaining 1.90% over the second quarter
and 4.38% over the first six months, with gains of 1.09% and 2.58%, respectively, for high yield.1 Both asset classes
outperformed investment grade bonds and US Treasuries, although lagged equites, and also lagged respective gains made through
the first half of 2023.2
A
generally supportive macroeconomic backdrop underpinned performance, as hopes for a potential soft landing replaced last year’s
recession concerns at the start of the year. As the quarter progressed, markets took their cue from economic growth, the continuous
stream of economic data releases and any sign that the U.S. Federal Reserve (the “Fed”) sufficiently subdued inflation
to ease restrictive monetary policy. Although inflation slowed through the second half of 2023, it turned sticky with a series
of upside surprises as 2024 got underway, despite the Fed holding base rates at their highest level in 22 years (5.25%-5.50%)
since July 2023.3 The prospect of delays to the Fed pivot, which may cause the economy to slow too quickly, sparked
greater rate volatility, which impacted fixed rate investment grade performance and high yield performance over the second quarter.4
Renewed disinflation and moderating growth toward the end of the first half of 2024 reinvigorated hopes for a Fed pivot
and the start of looser monetary conditions later this year.5
6-Month
Total Returns as of June 30, 2024
| US
Loans (Morningstar LSTA Leveraged Loan Index) |
4.40% |
| US High
Yield Bonds (Bloomberg High Yield US High Yield Index) |
2.58% |
| 3-month Treasury Bills (Bloomberg U.S. Treasury
Bellwethers: 3 Month) |
2.65% |
| 10-year Treasuries (Bloomberg U.S. Treasury
Bellwethers: 10 Year) |
-2.03% |
| US
Aggregate Bonds (Bloomberg U.S. Aggregate Index) |
-0.71% |
| US Investment Grade Bonds (Bloomberg U.S. Corporate
Investment Grade Index) |
-0.49% |
| Emerging
Markets (Bloomberg EM USD Aggregate Index) |
2.22% |
| US
Large Cap Equities (S&P 500® Index) |
15.29% |
Sources:
Bloomberg, Barclays, S&P/LCD
Past
Performance is no guarantee of future results. Index performance is shown for illustrative purposes only. You cannot invest directly
in an index.
Higher
base rates ensured coupon-clipping or “carry” was the primary driver of returns across credit markets over the first
half of 2024, fueling demand, which pushed credit spreads close to the lowest levels recorded.6 Strong appetite lifted
average loan prices to an annual high of $97 in May, continuing the rally underway since November 2023.7 The percentage
of the loan market priced above par topped 60% in May, a high since 20188— triggering a record $372 billion repricing
wave.9 Meanwhile, the high yield Index yield-to-worst rose to the widest levels so far in 2024 of 8.3% post April CPI,
from 7.48% at the start of the year, before hovering along at ~8% for the rest of the first half of 2024.10
Loan
and high yield retail funds secured inflows—of $12 billion and $5.5 billion respectively—over the first half of 2024,
reversing the significant outflows over the same period in 2023.11 CLO creation, at just over $100 billion in the year-to-date
period, almost doubled issuance in the same period in 2023,12 although elevated redemption activity significantly reduced
net CLO supply and sent cash back to investors.13 Heavy demand from investors, including US and European banks and
insurance companies and Japanese banks, also drove CLO liability spreads lower.14
On
the other side of the technical ledger, capital markets reopened in earnest in 2024, and the subsequent heavy issuance pushed
high yield supply 79% ahead of last year, and institutional loan supply a hefty 182% ahead of last year.15 New money
supply remained scarce, but loan and high yield borrowers shored up balance sheets by cutting interest expense and bolstering
free cash flow through refinancings, repricings and by extending maturities as record pace.16 As a result, just $40
billion of loans are due to mature by the end of 2025, while $111 billion of high yield bonds are due in 2024-2025, down from
$159 billion at the start of 2024.17
Tightening
loan spreads enabled borrowers to refinance more expensive direct lending loans in the cheaper syndicated loan market. The market
refinanced $6.3 billion of privately placed second-lien debt with syndicated first-lien term loans in the first six months of
2024, compared to less than $400 million in the first six months of 2023.18
Headwinds
remain as we move into the second half of the year, including a more challenging fundamental backdrop due to slower growth, higher
rates and the potential for ongoing volatility, as well as the US presidential election in November, and other geopolitical concerns.
Corporate
fundamentals have weakened but remain resilient due to earnings growth and refinancing/repricing efforts. Credit defaults have
mostly been confined to idiosyncratic situations and remain close to the long-term averages.19 Liability management
exercises remain elevated, and their potential to erode value for investors is something we continue to monitor closely.20
We
expect appetite for CCC-rated assets to remain limited and very credit specific in this tougher environment,21 but
believe that managers able to target cash-flow-positive credits in sectors that are more resilient through the cycle can seek
safer yield in leveraged finance markets and avoid secularly challenged CCCs.22 Managers may also have the opportunity
to differentiate themselves through this period of increased credit and performance dispersion.
| 2 |
www.blackstone-credit.com |
| Blackstone Credit & Insurance
Funds |
Manager
Commentary |
June
30, 2024 (Unaudited)
We
believe that moderating growth and ongoing disinflation should provide the Fed with air cover to finally bring rates down. Lower
rates are likely to reduce the cost of capital for corporate borrowers, alleviating the pressure on those more highly levered
entities, setting up a supportive environment for risk assets, in our view.
At
Blackstone Credit & Insurance, we value your continued investment and confidence in us and in our family of funds. Additional
information about our funds is available on our website at www.blackstone-credit.com.
Sincerely,
Blackstone
Liquid Credit Strategies LLC
All
figures are approximate and as of June 30, 2024, unless otherwise indicated. The words “we”, “us”, and
“our” refer to BSL, BGX and BGB, unless the context requires otherwise. In all other instances, including with respect
to current and forward-looking views and opinions of the market and BSL, BGX and BGB 's portfolio and performance positioning,
these terms refer to BSL’s, BGX’s and BGB’s adviser, Blackstone Liquid Credit Strategies LLC.
Certain
information contained in this communication constitutes “forward-looking statements” within the meaning of the federal
securities laws and the Private Securities Litigation Reform Act of 1995. These forward-looking statements can be identified by
the use of forward-looking terminology, such as “outlook,” “indicator,” “believes,” “expects,”
“potential,” “continues,” “may,” “can,” “will,” “should,”
“seeks,” “approximately,” “predicts,” “intends,” “plans,” “estimates,”
“anticipates”, “confident,” “conviction,” “identified” or the negative versions
of these words or other comparable words thereof. These may include BSL’s, BGX’s and BGB’s financial estimates
and their underlying assumptions, statements about plans, objectives and expectations with respect to future operations, statements
regarding future performance, statements regarding economic and market trends and statements regarding identified but not yet
closed investments. Such forward-looking statements are inherently uncertain and there are or may be important factors that could
cause actual outcomes or results to differ materially from those indicated in such statements. BSL, BGX and BGB believe these
factors include but are not limited to those described under the section entitled “Risk Factors” in their prospectuses
and annual reports for the most recent fiscal year, and any such updated factors included in their periodic filings with the Securities
and Exchange Commission (the “SEC”), which are accessible on the SEC’s website at www.sec.gov. These factors
should not be construed as exhaustive and should be read in conjunction with the other cautionary statements that are included
in this document (or BSL’s, BGX’s and BGB’s prospectus and other filings). Except as otherwise required by federal
securities laws, BSL, BGX and BGB undertake no obligation to publicly update or revise any forward-looking statements, whether
as a result of new information, future developments or otherwise.
| 1 | Morningstar
LSTA Leveraged Loan Index, Bloomberg High Yield Index, as of June 30, 2024. |
| 2 | BBG
S&P 500 Index, Morningstar LSTA Leveraged Loan Index, Bloomberg High Yield Index,
Bloomberg US Corporate Index, as of June 30, 2024, and as of June 30, 2023. |
| 3 | BBC
News, Fed raises interest rates to highest in 22 years, as of July 26, 2024. |
| 4 | Bloomberg
High Yield Index, Bloomberg US Corporate Index, as of June 30, 2024. |
| 5 | BXCI
Views and Beliefs, as of June 2024. |
| 6 | BBG
US HY Index and US Corporate IG Index, as of June 30, 2024. |
| 7 | Morningstar
LSTA Leveraged Loan Index, Bloomberg High Yield Index, as of June 30, 2024. |
| 8 | Morningstar
LSTA US Loan Index, as of May 31, 2024. |
| 9 | Pitchbook
LCD data, as of June 25, 2024. (Q2 US Leveraged Loan Market Wrap: Demand surges, leading
to record activity, as of June 26, 2024.) |
| 10 | BBG
HY Corporate Index, as of June 30, 2024. |
| 11 | JP
Morgan High Yield and Leveraged Loan Morning Intelligence, as of June 28, 2024. |
| 12 | Pitchbook
LCD CLO Data, as of June 25, 2024. |
| 13 | Pitchbook
LCD, Q2 US CLO Wrap: Tailwinds strengthen as market sets record pace of new issuance,
as of June 27, 2024. |
| 14 | Pitchbook
LCD, Q2 US CLO Wrap: Tailwinds strengthen as market sets record pace of new issuance,
as of June 27, 2024. |
| 15 | Pitchbook
LCD data, as of June 30, 2024. |
| 16 | Pitchbook
LCD, Q2 US Leveraged Loan Market Wrap, as of June 26, 2024. Barclays CLO Research, as
of June 21, 2024. |
| 17 | Pitchbook
LCD, Q2 US Leveraged Loan Market Wrap, as of June 26, 2024. |
| 18 | Pitchbook
LCD, Q2 Private Credit Wrap: Lenders strengthen defences against refi, repricing wave,
as of June 20, 2024. |
| 19 | JP
Morgan Default Monitor, as of June 3, 2024. |
| 20 | JP
Morgan Mid-Year Outlook, as of May 26, 2024. |
| 21 | Fed
dot plot, BBG US High Yield Corporate Index, as of June 30, 2024. |
| 22 | BXCI
Views and Beliefs, as of June 2024. JP Morgan Default Monitor, as of August 1, 2024.
Pitchbook LCD, Quick Take: Lower-rated loans fare worst in Monday's market plunge, as
of August 7, 2024. |
| Semi-Annual
Report | June 30, 2024 |
3 |
| Blackstone
Senior Floating Rate 2027 Term Fund |
Fund
Summary |
June
30, 2024 (Unaudited)
Blackstone
Senior Floating Rate 2027 Term Fund
Fund
Overview
Blackstone
Senior Floating Rate 2027 Term Fund (“BSL” or herein, the “Fund”) is a closed-end term fund that trades
on the New York Stock Exchange under the symbol “BSL”. BSL’s primary investment objective is to seek high current
income, with a secondary objective to seek preservation of capital, consistent with its primary goal of high current income. Under
normal market conditions, the Fund invests at least 80% of its Managed Assets in senior, secured floating rate loans (“Senior
Loans”). BSL may also invest in second-lien loans and high yield bonds and employs financial leverage, which may increase
risk to the Fund. The Fund has a limited term, and absent shareholder approval to extend the life of the Fund, the Fund will dissolve
on or about May 31, 2027.
Portfolio
Management Commentary
Fund
Performance
As
of June 30, 2024, BSL outperformed its benchmark, the Morningstar LSTA Leveraged Loan Index (“Morningstar LLI”), on
a Net Asset Value (“NAV”) per share basis for the six-month, one-year, five-year, ten-year, and since inception periods
and underperformed its benchmark for the three-year period. On a share price basis, the Fund underperformed its benchmark for
the three-year, five-year, and since inception periods. The shares of the Fund traded at an average discount to NAV of 5.2% for
the six months ended June 30, 2024, compared to its peer group average discount of 3.4% over the same period.
NAV
Performance Factors
The
Fund’s outperformance relative to the benchmark for the six months ended June 30, 2024 was primarily attributable to the
Fund’s leverage and credit selection within the Fund’s loan allocation. The Fund’s allocation to CLO securities
also contributed to the Fund’s outperformance for the period. By issuer, the largest positive contributors to performance
were Global Medical Response Inc, Radiology Partners Inc, and Covenant Surgical Partners Inc. The most significant detractors
were Atlas CC Acquisition Corp, Magenta Buyer LLC, and Ivanti Software Inc.
Portfolio
Activity and Positioning
During
the period, we continued to dynamically manage the Fund. The Fund’s largest sector overweights were financial services,
commercial & professional services, and capital goods; the largest sector underweights included materials, media & entertainment,
and consumer discretionary & retail. The Fund’s asset allocation remained stable during the period.
| 4 |
www.blackstone-credit.com |
| Blackstone Senior Floating
Rate 2027 Term Fund |
Fund Summary |
June
30, 2024 (Unaudited)
Performance
Summary
Performance
quoted represents past performance, which may be higher or lower than current performance. Past performance is not indicative
of future results. The returns shown do not reflect taxes that an investor would pay on Fund distributions or on the sale of Fund
shares. To obtain the most recent month-end performance, visit www.blackstone-credit.com.
Value
of a $10,000 Investment
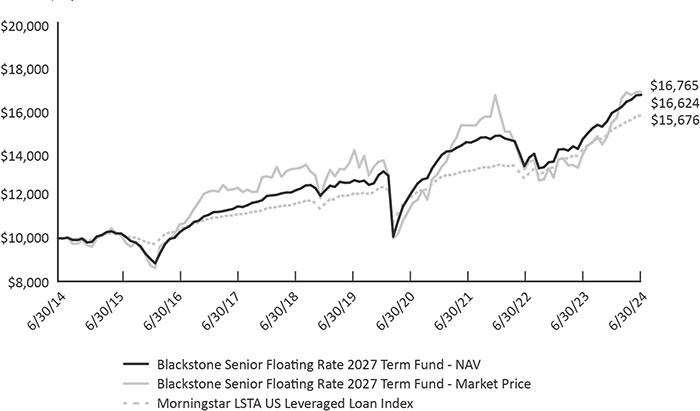
BSL
Total Return (as of June 30, 2024)
| |
6
Month |
1
Year |
3
Year |
5
Year |
10
Year |
Since
Inception |
| NAV* |
5.29%** |
14.04% |
4.82% |
5.76% |
5.21% |
5.72% |
| Market
Price* |
9.22% |
20.84% |
3.28% |
4.43% |
5.30% |
4.97% |
| Morningstar
LSTA US Leveraged Loan Index |
4.40% |
11.11% |
6.14% |
5.53% |
4.60% |
5.05% |
| * | NAV
is equal to the total assets attributable to common shareholders less liabilities divided by the number of common shares outstanding.
Market Price is the price at which a share can currently be traded in the market. Market Price is based on the close price at
4 p.m. ET and does not represent the returns an investor would receive if shares were traded at other times. Return assumes distributions
are reinvested pursuant to the Fund’s dividend reinvestment plan. Performance data quoted represents past performance and
does not guarantee future results. |
| ** | Excludes
adjustments in accordance with accounting principles generally accepted in the United States of America and as such, the net asset
value and total return for shareholder transactions reported to the market as of June 30, 2024 may differ from the net asset value
for financial reporting purposes. |
| Semi-Annual Report | June
30, 2024 |
5 |
| Blackstone Senior Floating
Rate 2027 Term Fund |
Fund Summary |
June
30, 2024 (Unaudited)
BSL’s
Portfolio Composition*
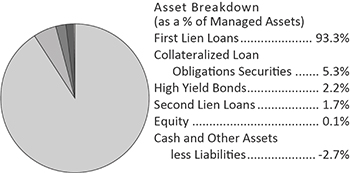
| * | Numbers
may not sum to 100.00% due to rounding. The Fund’s Cash and Other represents net
cash and other assets and liabilities, which includes amounts payable for investments
purchased but not yet settled and amounts receivable for investments sold but not yet
settled. At period end, the amounts payable for investments purchased but not yet settled
exceeded the amount of cash on hand. The Fund uses sales proceeds or funds from its leverage
program to settle amounts payable for investments purchased, but such amounts are not
reflected in the Fund’s net cash. |
BSL’s
Moody’s Rating*
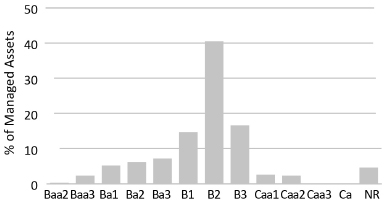
| * | For
more information on Moody's ratings and descriptions refer to https://ratings.moodys.io/ratings.
|
Portfolio
Characteristics
| Average
All-In Rate |
8.66% |
| Current Dividend Yield^ |
9.76% |
| Effective
Duration^^ |
0.19
yr |
| Average
Position* |
0.19% |
| Leverage* |
31.99% |
| ^ | Using current dividend rate of $0.114/share and market
price/share as of June 30, 2024. |
| ^^ | Loan
durations are based on the actual remaining time until the underlying base rate is reset for each individual loan. |
| * | As
a percentage of Managed Assets. |
Top
10 Issuers*
| Focus
Financial Partners LLC |
0.9% |
| Delta Topco Inc |
0.9% |
| Peraton
Corp. |
0.8% |
| Endurance International Group Holdings Inc |
0.8% |
| Trans
Union LLC |
0.7% |
| Bain
Capital Credit Clo, Limited |
0.7% |
| Genesee
& Wyoming Inc |
0.7% |
| Auris
Luxembourg III SARL |
0.7% |
| Cifc
Funding Ltd |
0.7% |
| Global
Medical Response |
0.7% |
| Top
10 Issuer |
7.6% |
| * | As
a percentage of Managed Assets. |
Portfolio
holdings and distributions are subject to change and are not recommendations to buy or sell any security.
Top
5 Industries*^
| Software |
12.5% |
| Professional Services |
8.5% |
| Financial
Services |
6.7% |
| Health
Care Providers & Services |
5.7% |
| Commercial
Services & Supplies |
5.0% |
| Top
5 Industries |
38.4% |
| * | As
a percentage of Managed Assets. |
| ^ | GICS
Industry Classification Schema. |
| 6 |
www.blackstone-credit.com |
| Blackstone Long-Short Credit
Income Fund |
Fund Summary |
June
30, 2024 (Unaudited)
Blackstone
Long-Short Credit Income Fund
Fund
Overview
Blackstone
Long Short Credit Income Fund (“BGX” or herein, the “Fund”) is a closed-end fund that trades on the
New York Stock Exchange under the symbol “BGX”. BGX’s primary investment objective is to provide current
income, with a secondary objective of capital appreciation. BGX will take long positions in investments which we believe
offer the potential for attractive returns under various economic and interest rate environments. BGX may also take short
positions in investments which we believe will under-perform due to a greater sensitivity to earnings growth of the issuer,
default risk or the general level and direction of interest rates. BGX must hold no less than 70% of its Managed Assets in
first- and second-lien secured loans (“Secured Loans”), but may also invest in unsecured loans and high yield
bonds.
Portfolio
Management Commentary
Fund
Performance
As
of June 30, 2024, BGX outperformed a composite weighting of the Morningstar LLI and the Bloomberg U.S. High Yield Index (“Bloomberg
HYI”) (85% loans, 15% high yield bonds) on a NAV per share basis for the six-month, one-year, five-year, ten-year, and since
inception periods and underperformed its benchmark for the three-year period. On a share price basis, the Fund underperformed
its benchmark for the three-year and five-year periods. The shares of the Fund traded at an average discount to NAV of 7.7% for
the six months ended June 30, 2024, compared to its peer group average discount of 3.5% over the same period.
NAV
Performance Factors
The
Fund’s outperformance relative to the benchmark for the six months ended June 30, 2024 was primarily attributable to the
Fund’s leverage and credit selection within the Fund’s loan allocation. The Fund’s allocation to CLO securities
also contributed to the Fund’s outperformance for the period. By issuer, the largest positive contributors to performance
were Global Medical Response, Radiology Partners Inc, and Covenant Surgical Partners Inc. The most significant detractors were
Atlas CC Acquisition Corp, Magenta Buyer LLC, and Carestream Health Holdings Inc.
Portfolio
Activity and Positioning
During
the period, we continued to dynamically manage the Fund. The Fund’s largest sector overweights were financial services,
commercial & professional services, and capital goods; the largest sector underweights included media & entertainment,
materials, and energy. The Fund’s asset allocation remained stable during the period.
| Semi-Annual Report | June
30, 2024 |
7 |
| Blackstone Long-Short Credit
Income Fund |
Fund Summary |
June
30, 2024 (Unaudited)
Performance
Summary
Performance
quoted represents past performance, which may be higher or lower than current performance. Past performance is not indicative
of future results. The returns shown do not reflect taxes that an investor would pay on Fund distributions or on the sale of Fund
shares. To obtain the most recent month-end performance, visit www.blackstone-credit.com.
Value
of a $10,000 Investment
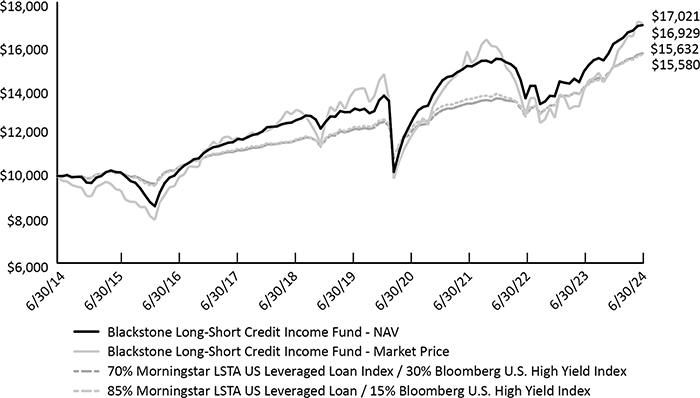
BGX
Total Return (as of June 30, 2024)
| |
6
Month |
1
Year |
3
Year |
5
Year |
10
Year |
Since
Inception |
| NAV* |
5.39%** |
14.32% |
4.00% |
5.53% |
5.41% |
5.82% |
| Market
Price* |
13.21% |
21.91% |
2.67% |
4.54% |
5.46% |
4.94% |
| 70% Morningstar LSTA US LLI / 30% Bloomberg
U.S. HYI |
3.86% |
10.94% |
4.82% |
5.07% |
4.53% |
4.97% |
| 85% Morningstar LLI / 15% Bloomberg HYI*** |
4.13% |
11.03% |
5.48% |
5.30% |
4.57% |
4.83% |
| * | NAV
is equal to the total assets attributable to common shareholders less liabilities divided by the number of common shares outstanding.
Market Price is the price at which a share can currently be traded in the market. Market Price is based on the close price at
4 p.m. ET and does not represent the returns an investor would receive if shares were traded at other times. Return assumes distributions
are reinvested pursuant to the Fund’s dividend reinvestment plan. Performance data quoted represents past performance and
does not guarantee future results. |
| ** | Excludes
adjustments in accordance with accounting principles generally accepted in the United
States of America and as such, the net asset value and total return for shareholder transactions
reported to the market as of June 30, 2024 may differ from the net asset value for financial
reporting purposes. |
| *** | Effective
June 1, 2023, BGX changed its benchmark from a composite weighting of the Morningstar
LLI and the Bloomberg U.S. High Yield Index (“Bloomberg HYI”) (70% loans,
30% high yield bonds) to a composite weighting of the Morningstar LLI and the Bloomberg
HYI (85% loans, 15% high yield bonds) in order to reflect the midpoint of the Fund’s
possible exposure to high yield bond investments, rather than the maximum level. |
| 8 |
www.blackstone-credit.com |
| Blackstone Long-Short Credit
Income Fund |
Fund Summary |
June
30, 2024 (Unaudited)
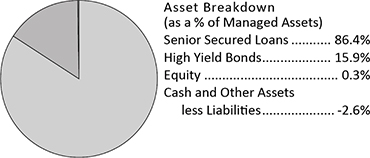
BGX’s
Portfolio Composition*
| * | Numbers
may not sum to 100.00% due to rounding. The Fund’s Cash and Other represents net
cash and other assets and liabilities, which includes amounts payable for investments
purchased but not yet settled and amounts receivable for investments sold but not yet
settled. At period end, the amounts payable for investments purchased but not yet settled
exceeded the amount of cash on hand. The Fund uses sales proceeds or funds from its leverage
program to settle amounts payable for investments purchased, but such amounts are not
reflected in the Fund’s net cash. |
BGX’s
Moody’s Rating Distribution*
| * | For
more information on Moody's ratings and descriptions refer to https://ratings.moodys.io/ratings.
|
Portfolio
Characteristics
| Average
All-In Rate |
8.54% |
| Current Dividend Yield^ |
10.14% |
| Effective
Duration^^ |
0.40
yr |
| Average
Position* |
0.20% |
| Leverage* |
31.95% |
| ^ | Using current dividend rate of $0.105/share and market
price/share as of June 30, 2024. |
| ^^ | Loan
durations are based on the actual remaining time until the underlying base rate is reset for each individual loan. |
| * | As
a percentage of Managed Assets. |
Top
10 Issuers*
| Clover
Clo |
0.8% |
| Peraton
Corp. |
0.8% |
| Focus
Financial Partners LLC |
0.8% |
| Allied Universal Holdco LLC |
0.8% |
| LTI
Holdings, Inc. |
0.8% |
| Genuine
Financial Holdings LLC |
0.7% |
| Genesee
& Wyoming Inc |
0.7% |
| Cotiviti
Corporation |
0.7% |
| First
Brands Group LLC |
0.7% |
| Citco
Funding LLC |
0.7% |
| Top
10 Issuer |
7.5% |
| * | As
a percentage of Managed Assets. |
Portfolio
holdings and distributions are subject to change and are not recommendations to buy or sell any security.
Top
5 Industries*^
| Software |
11.0% |
| Professional Services |
7.4% |
| Financial
Services |
6.4% |
| Health
Care Providers & Services |
5.9% |
| Commercial
Services & Supplies |
4.8% |
| Top
5 Industries |
35.5% |
| * | As
a percentage of Managed Assets. |
| ^ | GICS
Industry Classification Schema. |
| Semi-Annual Report | June
30, 2024 |
9 |
| Blackstone Strategic Credit
2027 Term Fund |
Fund Summary |
June
30, 2024 (Unaudited)
Blackstone
Strategic Credit 2027 Term Fund
Fund
Overview
Blackstone
Strategic Credit 2027 Term Fund (“BGB” or herein, the “Fund”) is a closed-end term fund that trades on
the New York Stock Exchange under the symbol “BGB”. BGB’s primary investment objective is to seek high current
income, with a secondary objective to seek preservation of capital, consistent with its primary goal of high current income. BGB
invests primarily in a diversified portfolio of loans and other fixed income instruments of predominantly U.S. corporate issuers,
including first- and second-lien loans (“Senior Secured Loans”) and high yield corporate bonds of varying maturities.
BGB must hold no less than 80% of its Managed Assets in credit investments comprised of corporate fixed income instruments and
other investments (including derivatives) with similar economic characteristics. The Fund has a limited term and will dissolve
on or about September 15, 2027, absent shareholder approval to extend such term.
Portfolio
Management Commentary
Fund
Performance
As
of June 30, 2024, BGB outperformed a composite weighting of the Morningstar LLI and the Bloomberg HYI (75% loans, 25% high yield
bonds) on a NAV per share basis for the six-month, one-year, ten-year, and since inception periods and underperformed its benchmark
for the three-year and five-year periods. On a share price basis, the Fund underperformed for the three-year, five-year, and since
inception periods. The shares of the Fund traded at an average discount to NAV of 7.6% for the six months ended June 30, 2024,
compared to its peer group average discount of 3.5% over the same period.
NAV
Performance Factors
The
Fund’s outperformance relative to the benchmark for the six months ended June 30, 2024 was primarily attributable to the
Fund’s leverage and credit selection within the Fund’s loan allocation. The Fund’s credit selection within its
high yield bond allocation also contributed to the Fund’s outperformance for the period. By issuer, the largest positive
contributors to performance were Global Medical Response Inc, Radiology partners Inc, and Covenant Surgical Partners Inc. The
most significant detractors were Atlas CC Acquisition Corp, Magenta Buyer LLC, and CSC Holdings LLC.
Portfolio
Activity and Positioning
During
the period, we continued to dynamically manage the Fund. The Fund’s largest sector overweights were commercial & professional
services, capital goods, and financial services; the largest sector underweights included materials, media & entertainment,
and consumer services. The Fund’s asset allocation remained stable during the period.
| 10 |
www.blackstone-credit.com |
| Blackstone Strategic Credit
2027 Term Fund |
Fund Summary |
June
30, 2024 (Unaudited)
Performance
Summary
Performance
quoted represents past performance, which may be higher or lower than current performance. Past performance is not indicative
of future results. The returns shown do not reflect taxes that an investor would pay on Fund distributions or on the sale of Fund
shares. To obtain the most recent month-end performance, visit www.blackstone-credit.com.
Value
of a $10,000 Investment
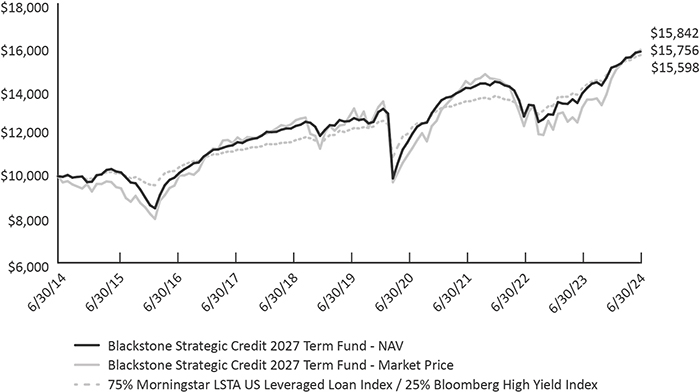
BGB
Total Return (as of June 30, 2024)
| |
6
Month |
1
Year |
3
Year |
5
Year |
10
Year |
Since
Inception |
| NAV* |
4.95%** |
13.97% |
3.82% |
4.66% |
4.65% |
5.09% |
| Market
Price* |
9.28% |
20.29% |
3.26% |
4.44% |
4.71% |
4.05% |
| 75% Morningstar
LSTA US LLI / 25% Bloomberg HYI |
3.95% |
10.97% |
5.04% |
5.15% |
4.55% |
4.80% |
| * | NAV
is equal to the total assets attributable to common shareholders less liabilities divided by the number of common shares outstanding.
Market Price is the price at which a share can currently be traded in the market. Market Price is based on the close price at
4 p.m. ET and does not represent the returns an investor would receive if shares were traded at other times. Return assumes distributions
are reinvested pursuant to the Fund’s dividend reinvestment plan. Performance data quoted represents past performance and
does not guarantee future results. |
| ** | Excludes
adjustments in accordance with accounting principles generally accepted in the United States of America and as such, the net asset
value and total return for shareholder transactions reported to the market as of June 30, 2024 may differ from the net asset value
for financial reporting purposes. |
| Semi-Annual Report | June
30, 2024 |
11 |
| Blackstone Strategic Credit
2027 Term Fund |
Fund Summary |
June
30, 2024 (Unaudited)
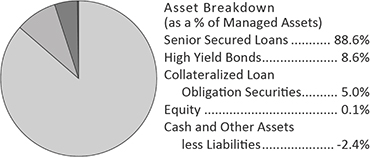
BGB’s
Portfolio Composition*
| * | Numbers
may not sum to 100.00% due to rounding. The Fund’s Cash and Other represents net cash and other assets and liabilities,
which includes amounts payable for investments purchased but not yet settled and amounts receivable for investments sold but not
yet settled. At period end, the amounts payable for investments purchased but not yet settled exceeded the amount of cash on hand.
The Fund uses sales proceeds or funds from its leverage program to settle amounts payable for investments purchased, but such
amounts are not reflected in the Fund’s net cash. |
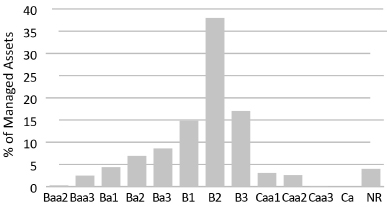
BGB’s
Moody’s Rating Distribution*
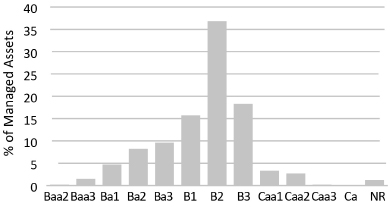
| * | For
more information on Moody's ratings and descriptions refer to https://ratings.moodys.io/ratings. |
Portfolio
Characteristics
| Average All-In
Rate |
8.18% |
| Current Dividend Yield^ |
10.19% |
| Effective
Duration^^ |
0.62
yr |
| Average Position* |
0.19% |
| Leverage* |
37.08% |
| ^ | Using current dividend rate of $0.101/share and market
price/share as of June 30, 2024. |
| ^^ | Loan
durations are based on the actual remaining time until the underlying base rate is reset for each individual loan. |
| * | As
a percentage of Managed Assets. |
Top
10 Issuers*
| Peraton
Corp. |
0.8% |
| Caesars Entertain Inc |
0.7% |
| Trans
Union LLC |
0.7% |
| Genesee
& Wyoming Inc |
0.7% |
| Cotiviti
Corporation |
0.7% |
| Genuine
Financial Holdings LLC |
0.7% |
| Focus
Financial Partners LLC |
0.7% |
| LTI Holdings,
Inc. |
0.7% |
| Pro Mach
Group, Inc. |
0.7% |
| Transdigm
Inc |
0.7% |
| Top
10 Issuer |
7.1% |
| * | As
a percentage of Managed Assets. |
Portfolio
holdings and distributions are subject to change and are not recommendations to buy or sell any security.
Top
5 Industries*^
| Software |
10.5% |
| Professional
Services |
7.7% |
| Health Care Providers & Services |
5.9% |
| Commercial
Services & Supplies |
4.5% |
| Hotels,
Restaurants & Leisure |
4.4% |
| Top
5 Industries |
33.0% |
| * | As
a percentage of Managed Assets. |
| ^ | GICS
Industry Classification Schema. |
| 12 |
www.blackstone-credit.com |
| Blackstone Senior Floating Rate 2027 Term Fund |
Portfolio of Investments |
June
30, 2024 (Unaudited)
| | |
Principal
Amount | | |
Value | |
| FLOATING RATE LOAN INTERESTS(a) - 139.78% | |
| | | |
| | |
| Aerospace & Defense - 4.50% | |
| | | |
| | |
| Atlas CC Acquisition Corp., First Lien B Term Loan, 3M CME TERM SOFR + 4.25%, 0.75% Floor, 05/25/2028 | |
$ | 1,331,077 | | |
$ | 987,400 | |
| Atlas CC Acquisition Corp., First Lien C Term Loan, 3M CME TERM SOFR + 4.25%, 0.75% Floor, 05/25/2028 | |
| 270,032 | | |
| 200,311 | |
| Dynasty Acquisition Co Inc., First Lien Term Loan, 1M US SOFR + 3.50%, 08/24/2028 | |
| 162,911 | | |
| 163,688 | |
| Nordam Group LLC, First Lien Initial Term Loan, 1M US SOFR + 5.50%, 04/09/2026 | |
| 1,667,600 | | |
| 1,609,234 | |
| Novaria Holdings, LLC, First Lien Term Loan, 1M US SOFR + 4.25%, 06/05/2031(b) | |
| 547,222 | | |
| 551,326 | |
| Peraton Corp., First Lien B Term Loan, 1M US SOFR + 3.75%, 0.75% Floor, 02/01/2028 | |
| 2,269,683 | | |
| 2,272,690 | |
| Standard Aero, Ltd., First Lien Term Loan, 1M US SOFR + 3.50%, 08/24/2028 | |
| 62,814 | | |
| 63,114 | |
| TransDigm, Inc., First Lien Term Loan, 3M CME TERM SOFR + 3.25%, 02/28/2031 | |
| 1,509,172 | | |
| 1,514,077 | |
| Vertex Aerospace Corp., First Lien Term Loan, 1M US SOFR + 2.75%, 12/06/2030 | |
| 849,993 | | |
| 852,042 | |
| World Wide Technology Holding Co LLC, First Lien Term Loan, 3M CME TERM SOFR + 3.50%, 0.50%
Floor, 04/21/2031 | |
| 445,386 | | |
| 448,170 | |
| | |
| | | |
| 8,662,052 | |
| | |
| | | |
| | |
| Air Freight & Logistics - 2.20% | |
| | | |
| | |
| ASP LS Acquisition Corp., First Lien Term Loan, 3M CME TERM SOFR + 4.50%, 0.75% Floor, 05/07/2028 | |
| 482,595 | | |
| 412,554 | |
| Clue Opco LLC, First Lien Term Loan, 3M CME TERM SOFR + 4.50%, 12/19/2030 | |
| 1,188,978 | | |
| 1,111,843 | |
| Rinchem Company, Inc., First Lien Term Loan, 3M CME TERM SOFR + 4.25%, 03/02/2029 | |
| 1,349,677 | | |
| 1,169,252 | |
| Savage Enterprises LLC, First Lien Term Loan, 3M US L + 3.25%, 0.50% Floor, 09/15/2028 | |
| 592,689 | | |
| 594,775 | |
| WWEX UNI TopCo Holdings LLC, First Lien Initial Term Loan, 3M CME TERM SOFR + 4.00%, 0.75% Floor, 07/26/2028 | |
| 946,812 | | |
| 950,741 | |
| | |
| | | |
| 4,239,165 | |
| | |
| | | |
| | |
| Automobile Components - 2.34% | |
| | | |
| | |
| Belron Finance US LLC, First Lien Term Loan, 3M CME TERM SOFR + 2.25%, 0.50% Floor, 04/18/2029 | |
| 361,249 | | |
| 362,528 | |
| Clarios Glob LP, First Lien Term Loan, 6M CME TERM SOFR + 2.75%, 06/05/2030 | |
| 1,402,650 | | |
| 1,407,692 | |
| First Brands Group LLC, First Lien Term Loan, 3M CME TERM SOFR + 5.00%, 1.00% Floor, 03/30/2027 | |
| 1,095,531 | | |
| 1,090,738 | |
| First Brands Group, LLC, First Lien 2018 New Tranche E Term Loan, 3M CME TERM SOFR + 5.00%, 03/30/2027 | |
| 797,095 | | |
| 793,237 | |
| LTI Holdings, Inc., First Lien Term Loan, 1M US SOFR + 4.75%, 07/24/2026 | |
| 411,906 | | |
| 408,277 | |
| LTI Holdings, Inc., Second Lien Initial Term Loan, 1M US SOFR + 6.75%, 09/06/2026 | |
| 468,085 | | |
| 444,096 | |
| | |
| | | |
| 4,506,568 | |
| | |
| | | |
| | |
| Beverages - 0.64% | |
| | | |
| | |
| Triton Water Holdings, Inc., First Lien Initial Term Loan, 3M CME TERM SOFR + 3.25%, 0.50% Floor, 03/31/2028 | |
| 1,226,544 | | |
| 1,228,384 | |
| | |
| | | |
| | |
| Biotechnology - 0.94% | |
| | | |
| | |
| Grifols Worldwide Operations, First Lien Term Loan, 1M US SOFR + 2.00%, 11/15/2027 | |
| 1,836,439 | | |
| 1,808,893 | |
| | |
| | | |
| | |
| Broadline Retail - 0.20% | |
| | | |
| | |
| Peer Hldg III BV, First Lien Term Loan, 6M CME TERM SOFR + 3.00%, 06/23/2031 | |
| 381,229 | | |
| 382,103 | |
| | |
| | | |
| | |
| Building Products - 3.62% | |
| | | |
| | |
| Gulfside Supply Inc, First Lien Term Loan, 6M CME TERM SOFR + 3.50%, 05/29/2031(b) | |
| 262,418 | | |
| 262,910 | |
| LBM Acquisition LLC, First Lien Term Loan, 1M US SOFR + 3.75%, 05/30/2031 | |
| 1,484,336 | | |
| 1,461,551 | |
| LHS Borrower, LLC, First Lien Term Loan, 1M US SOFR + 4.75%, 0.50% Floor, 02/16/2029 | |
| 816,918 | | |
| 775,255 | |
| Miter Brands Acquisition Holdco Inc., First Lien Term Loan, 1M US SOFR + 3.50%, 03/28/2031 | |
| 964,311 | | |
| 971,346 | |
See
Notes to Financial Statements.
| Semi-Annual Report | June
30, 2024 |
13 |
| Blackstone Senior Floating Rate 2027 Term Fund |
Portfolio of Investments |
June
30, 2024 (Unaudited)
| | |
Principal
Amount | | |
Value | |
| Building Products (continued) | |
| | |
| |
| Oscar Acquisitionco LLC, First Lien Term Loan, 3M CME TERM SOFR + 4.25%, 0.50% Floor, 04/29/2029 | |
$ | 1,104,946 | | |
$ | 1,105,725 | |
| Resideo Funding Inc, First Lien Term Loan, 6M CME TERM SOFR + 2.25%, 06/13/2031 | |
| 151,862 | | |
| 151,863 | |
| Tailwind Smith Cooper Intermediate Corp., First Lien Initial Term Loan, 3M CME TERM SOFR + 5.00%, 05/28/2026 | |
| 1,458,624 | | |
| 1,459,536 | |
| Trulite Holding Corp., First Lien Term Loan, 1M US SOFR + 6.00%, 03/01/2030 | |
| 799,298 | | |
| 777,317 | |
| | |
| | | |
| 6,965,503 | |
| | |
| | | |
| | |
| Capital Markets - 5.79% | |
| | | |
| | |
| Apex Group Treasury, Ltd., First Lien USD Term Loan, 3M CME TERM SOFR + 3.75%, 0.50% Floor, 07/27/2028 | |
| 1,436,153 | | |
| 1,439,744 | |
| AssetMark 6/24 TLB 1L, First Lien Term Loan, 6M CME TERM SOFR + 3.25%, 06/03/2031 | |
| 609,074 | | |
| 610,216 | |
| Cetera Financial 5/24 TLB 1L, First Lien Term Loan, 3M CME TERM SOFR + 9.34%, 08/09/2030 | |
| 1,596,407 | | |
| 1,604,557 | |
| Citadel Securities LP, First Lien Term Loan, 1M US SOFR + 2.25%, 07/29/2030 | |
| 435,195 | | |
| 436,936 | |
| CITCO FDG LLC, First Lien Term Loan, 3M CME TERM SOFR + 2.75%, 04/27/2028 | |
| 1,930,650 | | |
| 1,939,502 | |
| CPI Holdco B LLC, First Lien Term Loan, 1M US SOFR + 2.00%, 05/17/2031 | |
| 507,229 | | |
| 507,310 | |
| Edelman Financial Engines Center LLC, First Lien Term Loan, 1M US SOFR + 3.25%, 04/07/2028 | |
| 60,900 | | |
| 61,057 | |
| Focus Financial Partners LLC, First Lien Term Loan, 1M US SOFR + 2.50%, 0.50% Floor, 06/30/2028 | |
| 1,968,304 | | |
| 1,968,766 | |
| Focus Financial Partners, LLC, First Lien Term Loan, 1M US SOFR + 2.75%, 06/30/2028 | |
| 534,741 | | |
| 534,819 | |
| Kestra Advisor Services Holdings A INC, First Lien Term Loan, 1M US SOFR + 4.00%, 03/22/2031 | |
| 610,720 | | |
| 613,697 | |
| Osaic Holdings Inc aka Advisor Group, First Lien Term Loan, 1M US SOFR + 4.00%, 08/17/2028 | |
| 1,424,594 | | |
| 1,430,741 | |
| | |
| | | |
| 11,147,345 | |
| | |
| | | |
| | |
| Chemicals - 2.35% | |
| | | |
| | |
| CI Maroon Holdings LLC, First Lien Term Loan, 3M CME TERM SOFR + 4.00%, 03/01/2031 | |
| 369,000 | | |
| 371,306 | |
| Ecovyst Catalyst Technologies LLC, First Lien Term Loan, 6M CME TERM SOFR + 2.25%, 06/12/2031 | |
| 1,631,438 | | |
| 1,633,037 | |
| Geon Performance Solutions LLC, First Lien Term Loan, 3M CME TERM SOFR + 4.25%, 0.75% Floor, 08/18/2028 | |
| 1,136,361 | | |
| 1,142,759 | |
| Nouryon USA Ltarfruit US TLB 1L, First Lien Term Loan, 3M CME TERM SOFR + 3.50%, 04/03/2028 | |
| 942,875 | | |
| 946,529 | |
| Starfruit US Holdco LLC TLB 1L, First Lien Term Loan, 3M CME TERM SOFR + 3.50%, 04/03/2028 | |
| 422,340 | | |
| 424,980 | |
| | |
| | | |
| 4,518,611 | |
| | |
| | | |
| | |
| Commercial Services & Supplies - 7.34% | |
| | | |
| | |
| Action Environmental Group, Inc., First Lien Term Loan: | |
| | | |
| | |
| 3M CME TERM SOFR + 4.00%, 0.50% Floor, 10/24/2030(b) | |
| 1,249,416 | | |
| 1,258,786 | |
| 6M CME TERM SOFR + 4.00%, 0.50% Floor, 10/24/2030(b) | |
| 92,430 | | |
| 93,123 | |
| 6M CME TERM SOFR + 4.00%, 0.50% Floor, 10/24/2030(b) | |
| 123,240 | | |
| 124,165 | |
| Allied Universal Holdco LLC, First Lien Initial U.S. Dollar Term Loan, 1M US SOFR + 3.75%, 0.50% Floor, 05/12/2028 | |
| 1,496,154 | | |
| 1,492,092 | |
| Aramark Intermediate HoldCo Corp., First Lien U.S. B-4 Term Loan, 1M US SOFR + 1.75%, 01/15/2027 | |
| 700,000 | | |
| 700,788 | |
| Belfor Holdings, Inc., First Lien Term Loan, 1M US SOFR + 3.75%, 0.50% Floor, 11/01/2030 | |
| 276,889 | | |
| 278,966 | |
| Equiniti Group PLC, First Lien Term Loan, 6M CME TERM SOFR + 4.50%, 12/11/2028 | |
| 1,465,385 | | |
| 1,473,628 | |
| Garda World Security Corp., First Lien Term Loan, 3M CME TERM SOFR + 4.25%, 02/01/2029 | |
| 1,805,846 | | |
| 1,819,389 | |
| GFL Environmental, Inc., First Lien Term Loan, 6M US L + 0.00%, 0.50% Floor, 06/27/2031(b) | |
| 163,333 | | |
| 163,742 | |
| Justrite Safety Group, First Lien Delayed Draw Term Loan, 1M US SOFR + 4.50%, 06/28/2026 | |
| 73,695 | | |
| 73,742 | |
| Justrite Safety Group, First Lien Initial Term Loan, 1M US SOFR + 4.50%, 06/28/2026 | |
| 1,363,125 | | |
| 1,363,984 | |
See
Notes to Financial Statements.
| 14 |
www.blackstone-credit.com |
| Blackstone Senior Floating Rate 2027 Term Fund |
Portfolio of Investments |
June
30, 2024 (Unaudited)
| | |
Principal
Amount | | |
Value | |
| Commercial Services & Supplies (continued) | |
| | |
| |
| Omnia Partners, LLC, First Lien Term Loan, L + 3.75%, 07/25/2030 | |
$ | 1,557,039 | | |
$ | 1,559,709 | |
| Prime Sec Services Borrower LLC, TL, First Lien Term Loan, 3M CME TERM SOFR + 2.25%, 10/13/2030 | |
| 1,212,153 | | |
| 1,213,002 | |
| Strategic Materials Holding Corp., Second Lien Initial Term Loan, 3M CME TERM SOFR + 7.75%, 1.00% Floor, 10/31/2025(b) | |
| 800,000 | | |
| 16,000 | |
| TMF Sapphire US LLC aka TMF Group TLB 1L, First Lien Term Loan 05/03/2028 | |
| 289,455 | | |
$ | 290,586 | |
| TRC Companies, First Lien Term Loan, 1M US SOFR + 3.75%, 12/08/2028 | |
| 1,118,855 | | |
| 1,122,631 | |
| United Site Cov-Lite, First Lien Term Loan, 3M CME TERM SOFR + 4.25%, 12/15/2028 | |
| 1,068,493 | | |
| 715,297 | |
| Vestis Corp, First Lien Term Loan, 3M CME TERM SOFR + 2.25%, 02/22/2031 | |
| 374,063 | | |
| 372,738 | |
| | |
| | | |
| 14,132,368 | |
| | |
| | | |
| | |
| Communications Equipment - 0.05% | |
| | | |
| | |
| MLN US HoldCo LLC, First Lien B Term Loan, 3M CME TERM SOFR + 4.50%, 11/30/2025 | |
| 854,492 | | |
| 96,130 | |
| | |
| | | |
| | |
| | |
| | | |
| | |
| Construction & Engineering - 2.12% | |
| | | |
| | |
| Amentum Government Services Holdings LLC, First Lien Term Loan, 1M US SOFR + 4.00%, 02/15/2029 | |
| 1,080,378 | | |
| 1,086,456 | |
| Artera Services LLC aka PowerTeam, First Lien Term Loan, 3M CME TERM SOFR + 4.50%, 02/15/2031 | |
| 307,522 | | |
| 309,525 | |
| Azuria Water Solutions Inc aka Aegion TLB 1L, First Lien Term Loan 05/17/2028 | |
| 1,420,703 | | |
| 1,428,190 | |
| Groundworks LLC, First Lien Term Loan: | |
| | | |
| | |
| 1M US SOFR + 3.50%, 03/14/2031 | |
| 544,898 | | |
| 545,238 | |
| 6M CME TERM SOFR + 4.00%, 03/14/2031(c) | |
| 5,516 | | |
| 5,519 | |
| Touchdown Acquirer Inc aka TenCate, First Lien Term Loan, 3M CME TERM SOFR + 4.00%, 02/21/2031 | |
| 401,639 | | |
| 404,024 | |
| Tutor Perini Corp., First Lien B Term Loan, 1M US SOFR + 4.75%, 1.00% Floor, 08/18/2027 | |
| 300,960 | | |
| 302,027 | |
| | |
| | | |
| 4,080,979 | |
| | |
| | | |
| | |
| Construction Materials - 1.01% | |
| | | |
| | |
| Quikrete Holdings, Inc., First Lien Term Loan, 1M US SOFR + 2.50%, 04/14/2031 | |
| 1,476,968 | | |
| 1,481,968 | |
| Summit Materials LLC, First Lien Term Loan, 3M CME TERM SOFR + 2.50%, 01/12/2029 | |
| 203,447 | | |
| 205,100 | |
| Tamko Building Products LLC, First Lien Term Loan, 1M US SOFR + 3.25%, 09/20/2030 | |
| 249,873 | | |
| 250,185 | |
| | |
| | | |
| 1,937,253 | |
| | |
| | | |
| | |
| Containers & Packaging - 2.84% | |
| | | |
| | |
| Altium Packaging LLC, First Lien Term Loan, 1M US SOFR + 2.50%, 06/11/2031 | |
| 131,250 | | |
| 131,250 | |
| Anchor Packaging LLC, First Lien Term Loan, 1M US SOFR + 3.75%, 07/18/2029 | |
| 414,000 | | |
| 414,813 | |
| Berlin Packaging LLC, First Lien Term Loan, 6M CME TERM SOFR + 4.00%, 06/07/2031 | |
| 575,620 | | |
| 577,583 | |
| ProAmpac PG Borrower LLC, First Lien Term Loan, 3M CME TERM SOFR + 4.00%, 0.75% Floor, 09/15/2028 | |
| 495,360 | | |
| 497,156 | |
| Reynolds Consumer Products LLC, First Lien Initial Term Loan, 1M US SOFR + 1.75%, 02/04/2027 | |
| 1,443,718 | | |
| 1,448,114 | |
| Supplyone 3/24, First Lien Term Loan, 6M CME TERM SOFR + 4.50%, 04/19/2031 | |
| 774,245 | | |
| 776,425 | |
| Trident TPI Holdings, Inc., First Lien Term Loan, 3M CME TERM SOFR + 9.33%, 0.50% Floor, 09/15/2028 | |
| 1,615,642 | | |
| 1,620,021 | |
| | |
| | | |
| 5,465,362 | |
| Distributors - 1.51% | |
| | | |
| | |
| Burgess Point Purchaser Corp., First Lien Term Loan, 1M US SOFR + 5.25%, 07/25/2029 | |
| 1,449,920 | | |
| 1,409,141 | |
| Johnstone Supply LLC, First Lien Term Loan, 3M CME TERM SOFR + 3.00%, 05/16/2031 | |
| 547,000 | | |
| 548,367 | |
| S&S Holdings LLC, First Lien Initial Term Loan, 1M US SOFR + 5.00%, 0.50% Floor, 03/11/2028 | |
| 959,055 | | |
| 961,453 | |
| | |
| | | |
| 2,918,961 | |
See
Notes to Financial Statements.
| Semi-Annual Report | June
30, 2024 |
15 |
| Blackstone Senior Floating Rate 2027 Term Fund |
Portfolio of Investments |
June
30, 2024 (Unaudited)
| | |
Principal
Amount | | |
Value | |
| Diversified Consumer Services - 3.15% | |
| | |
| |
| Cengage Learning, Inc., First Lien Term Loan, 6M CME TERM SOFR + 4.25%, 1.00% Floor, 03/24/2031 | |
$ | 804,974 | | |
$ | 808,246 | |
| Fugue Finance LLC aka Nord Anglia, First Lien Term Loan, 3M CME TERM SOFR + 3.75%, 02/26/2031 | |
| 340,095 | | |
| 343,369 | |
| Imagine Learning LLC, First Lien Term Loan, 1M US SOFR + 3.50%, 12/21/2029 | |
| 1,147,125 | | |
| 1,148,375 | |
| Loyalty Ventures, Inc., First Lien Term Loan, 3M Prime + 3.50%, 11/03/2027(b) | |
| 462,410 | | |
| 4,624 | |
| McKissock Investment Holdings, LLC, First Lien Term Loan, 3M CME TERM SOFR + 5.00%, 03/12/2029 | |
| 227,367 | | |
| 228,528 | |
| Mister Car Wash 3/24, First Lien Term Loan, 1M US SOFR + 3.00%, 03/27/2031 | |
| 379,673 | | |
| 381,266 | |
| Spring Education Group, Inc., First Lien Term Loan, 3M CME TERM SOFR + 4.00%, 10/04/2030 | |
| 850,400 | | |
| 855,626 | |
| St. George's University Scholastic Services LLC, First Lien Term Loan B Term Loan, 1M US SOFR + 2.75%, 0.50% Floor, 02/10/2029 | |
| 1,030,176 | | |
| 1,030,820 | |
| TruGreen LP, First Lien Term Loan, 1M US SOFR + 4.00%, 0.75% Floor, 11/02/2027 | |
| 435,762 | | |
| 420,946 | |
| Wand NewCo 3 Inc aka Caliber Collision, First Lien Term Loan, 1M US SOFR + 3.75%, 01/30/2031 | |
| 847,764 | | |
| 854,347 | |
| | |
| | | |
| 6,076,147 | |
| | |
| | | |
| | |
| Diversified REITs - 0.38% | |
| | | |
| | |
| Iron Mountain Information Management LLC, First Lien Term Loan, 3M CME TERM SOFR + 2.25%, 01/31/2031 | |
| 466,200 | | |
| 464,839 | |
| Opry Entertainment/OEG, First Lien Term Loan, 6M CME TERM SOFR + 3.75%, 06/25/2031(b) | |
| 262,160 | | |
| 262,815 | |
| | |
| | | |
| 727,654 | |
| | |
| | | |
| | |
| Diversified Telecommunication Services - 3.48% | |
| | | |
| | |
| Coral-US Co-Borrower LLC, First Lien B-5 Term Loan, 1M US SOFR + 2.25%, 01/31/2028 | |
| 804,325 | | |
| 778,812 | |
| Level 3 Financing Inc., First Lien Term Loan: | |
| | | |
| | |
| 1M US SOFR + 6.56%, 04/15/2029 | |
| 410,203 | | |
| 402,577 | |
| 1M US SOFR + 6.56%, 04/15/2030 | |
| 413,212 | | |
| 403,295 | |
| Lorca Finco PLC, First Lien Term Loan, 6M CME TERM SOFR + 3.50%, 04/17/2031 | |
| 326,667 | | |
| 327,892 | |
| Lumen Technologies Inc, First Lien Term Loan, 1M US SOFR + 2.25%, 04/15/2029 | |
| 1,504 | | |
| 1,042 | |
| Lumen Technologies, Inc., First Lien Term Loan, 1M US SOFR + 6.00%, 06/01/2028 | |
| 39,971 | | |
| 33,309 | |
| Radiate Holdco, LLC,, First Lien Term Loan, 1M US SOFR + 3.25%, 09/25/2026 | |
| 1,277,078 | | |
| 1,037,894 | |
| Telenet Financing USD LLC, First Lien Term Loan, 1M US SOFR + 2.00%, 04/30/2028 | |
| 1,056,336 | | |
| 1,007,703 | |
| UPC Financing Partnership, First Lien Facility AT Term Loan, 1M US SOFR + 2.25%, 04/30/2028 | |
| 1,331,027 | | |
| 1,309,750 | |
| Zacapa S.A.R.L., First Lien Term Loan, 3M CME TERM SOFR + 4.00%, 03/22/2029 | |
| 1,402,395 | | |
| 1,403,054 | |
| | |
| | | |
| 6,705,328 | |
| | |
| | | |
| | |
| Electric Utilities - 1.48% | |
| | | |
| | |
| Generation Bridge Northeast LLC, First Lien Term Loan, 1M US SOFR + 3.50%, 08/22/2029 | |
| 589,794 | | |
| 594,217 | |
| NRG Energy 3/24 Cov-Lite, First Lien Term Loan, 1M US SOFR + 2.00%, 04/16/2031 | |
| 815,049 | | |
| 816,170 | |
| Vistra Operations Co. LLC, First Lien 2018 Incremental Term Loan, 1M US SOFR + 2.00%, 12/20/2030 | |
| 1,439,824 | | |
| 1,442,602 | |
| | |
| | | |
| 2,852,989 | |
| | |
| | | |
| | |
| Electrical Equipment - 0.68% | |
| | | |
| | |
| WEC US Holdings Ltd., First Lien Term Loan, 1M US SOFR + 2.75%, 01/27/2031 | |
| 1,315,697 | | |
| 1,318,454 | |
| | |
| | | |
| | |
| Electronic Equipment, Instruments & Components - 2.07% | |
| | | |
| | |
| Celestica 5/24 TLB 1L, First Lien Term Loan, 1M US SOFR + 1.75%, 05/23/2031 | |
| 199,662 | | |
| 199,662 | |
| Coherent Corp., First Lien Term Loan, 1M US SOFR + 2.50%, 0.50% Floor, 07/02/2029 | |
| 1,005,831 | | |
| 1,007,843 | |
| DG Investment Intermediate Holdings 2, Inc., Second Lien Initial Term Loan, 1M US SOFR + 6.75%, 0.75% Floor, 03/30/2029 | |
| 601,071 | | |
| 590,835 | |
| Discovery Energy Corp., First Lien Term Loan, 3M CME TERM SOFR + 4.75%, 05/01/2031 | |
| 784,467 | | |
| 788,758 | |
See
Notes to Financial Statements.
| 16 |
www.blackstone-credit.com |
| Blackstone Senior Floating Rate 2027 Term Fund |
Portfolio of Investments |
June
30, 2024 (Unaudited)
| | |
Principal
Amount | | |
Value | |
| Electronic Equipment, Instruments & Components (continued) | |
| | |
| |
| Mirion Technologies US, Inc., First Lien Term Loan, 3M CME TERM SOFR + 2.25%, 0.50% Floor, 10/20/2028 | |
$ | 1,391,584 | | |
$ | 1,395,285 | |
| | |
| | | |
| 3,982,383 | |
| | |
| | | |
| | |
| Energy Equipment & Services - 0.33% | |
| | | |
| | |
| Ursa Minor US Bidco LLC aka Rosen, First Lien Term Loan, 3M CME TERM SOFR + 3.50%, 03/26/2031 | |
| 639,507 | | |
| 644,572 | |
| | |
| | | |
| | |
| Entertainment - 1.24% | |
| | | |
| | |
| CE Intermediate I LLC, First Lien Term Loan, 3M CME TERM SOFR + 3.50%, 0.50% Floor, 11/10/2028 | |
| 853,689 | | |
| 856,625 | |
| EP Purcasher, LLC, First Lien Term Loan, 3M CME TERM SOFR + 3.50%, 11/06/2028 | |
| 1,533,929 | | |
| 1,536,675 | |
| | |
| | | |
| 2,393,300 | |
| | |
| | | |
| | |
| Financial Services - 1.79% | |
| | | |
| | |
| FleetCor Technologies Operating Co. LLC, First Lien Term Loan, 1M US SOFR + 1.75%, 04/28/2028 | |
| 1,178,755 | | |
| 1,180,800 | |
| Mitchell International, First Lien Term Loan, 6M CME TERM SOFR + 3.25%, 06/17/2031 | |
| 1,646,975 | | |
| 1,635,018 | |
| Planet US Buyer, LLC, First Lien Term Loan, 3M CME TERM SOFR + 3.50%, 02/07/2031 | |
| 627,705 | | |
| 632,491 | |
| Polaris Newco LLC, First Lien Dollar Term Loan, 3M CME TERM SOFR + 4.00%, 0.50% Floor, 06/02/2028 | |
| 684 | | |
| 685 | |
| | |
| | | |
| 3,448,994 | |
| | |
| | | |
| | |
| Food Products - 1.58% | |
| | | |
| | |
| CH Guenther 11/21, First Lien Term Loan, 3M CME TERM SOFR + 3.00%, 12/08/2028 | |
| 567,236 | | |
| 569,012 | |
| Froneri International, Ltd., First Lien Facility B2 Term Loan, 1M US SOFR + 2.25%, 01/29/2027 | |
| 1,016,692 | | |
| 1,017,271 | |
| Saratoga Food Specialties LLC, First Lien Term Loan, 3M CME TERM SOFR + 3.75%, 03/07/2029 | |
| 296,456 | | |
| 298,495 | |
| Snacking Investments BidCo Pty, Ltd., First Lien Initial US Term Loan, 3M CME TERM SOFR + 4.00%, 1.00% Floor, 12/18/2026 | |
| 1,148,006 | | |
| 1,150,876 | |
| | |
| | | |
| 3,035,654 | |
| | |
| | | |
| | |
| Ground Transportation - 2.60% | |
| | | |
| | |
| Genesee & WY Inc, First Lien Term Loan, 3M CME TERM SOFR + 2.00%, 04/10/2031 | |
| 2,020,158 | | |
| 2,020,349 | |
| Uber Technologies, Inc., First Lien Term Loan, 3M CME TERM SOFR + 2.75%, 03/03/2030 | |
| 1,235,058 | | |
| 1,242,426 | |
| XPO, Inc., First Lien Term Loan, 1M US SOFR + 2.00%, 05/24/2028 | |
| 1,731,298 | | |
| 1,738,388 | |
| | |
| | | |
| 5,001,163 | |
| | |
| | | |
| | |
| Health Care Equipment & Supplies - 1.56% | |
| | | |
| | |
| Resonetics LLC, First Lien Term Loan, 3M CME TERM SOFR + 9.08%, 06/06/2031 | |
| 983,970 | | |
| 987,045 | |
| Siemens/SivantosWS Audiology, First Lien Term Loan, 6M CME TERM SOFR + 4.25%, 02/28/2029 | |
| 2,012,288 | | |
| 2,019,835 | |
| | |
| | | |
| 3,006,880 | |
| | |
| | | |
| | |
| Health Care Providers & Services - 8.16% | |
| | | |
| | |
| DaVita, Inc., First Lien B Term Loan, 3M CME TERM SOFR + 1.75%, 08/12/2026 | |
| 563,555 | | |
| 564,025 | |
| Global Medical Response, Inc., First Lien Term Loan, 3M CME TERM SOFR + 5.50%, 1.00% Floor, 10/31/2028(d) | |
| 2,062,708 | | |
| 2,001,858 | |
| Heartland Dental LLC, First Lien Term Loan, 6M CME TERM SOFR + 4.50%, 0.75% Floor, 04/28/2028 | |
| 1,159,158 | | |
| 1,163,581 | |
| IVI America LLC aka IVIRMA, First Lien Term Loan, 6M CME TERM SOFR + 4.50%, 04/18/2031 | |
| 512,500 | | |
| 516,264 | |
| MED ParentCo, LP, First Lien Term Loan, 1M US SOFR + 4.00%, 04/15/2031 | |
| 520,534 | | |
| 520,976 | |
| Medical Solutions LLC, First Lien Term Loan, 1M US SOFR + 3.25%, 11/01/2028 | |
| 1,120,353 | | |
| 854,068 | |
See
Notes to Financial Statements.
| Semi-Annual Report | June
30, 2024 |
17 |
| Blackstone Senior Floating Rate 2027 Term Fund |
Portfolio of Investments |
June
30, 2024 (Unaudited)
| | |
Principal
Amount | | |
Value | |
| Health Care Providers & Services (continued) | |
| | |
| |
| Midwest Physcn Admin Srvcs LLC, First Lien Term Loan, 3M CME TERM SOFR + 3.25%, 03/12/2028 | |
$ | 1,380,341 | | |
$ | 1,212,975 | |
| NAPA Management Services Corp., First Lien Term Loan, 1M US SOFR + 5.25%, 0.75% Floor, 02/23/2029 | |
| 1,139,661 | | |
| 1,093,482 | |
| Onex TSG Intermediate Corp., First Lien Initial Term Loan, 3M CME TERM SOFR + 4.75%, 0.75% Floor, 02/28/2028 | |
| 1,374,167 | | |
| 1,373,019 | |
| Outcomes Group Holdings, Inc., First Lien Term Loan, 3M US L + 4.25%, 05/06/2031 | |
| 894,490 | | |
| 898,474 | |
| Pathway Vet Alliance LLC, First Lien 2021 Replacement Term Loan, 1M US SOFR + 3.75%, 03/31/2027 | |
| 1,499,697 | | |
| 1,185,323 | |
| Pediatric Associates Holding Co. LLC, First Lien Term Loan, 1M US SOFR + 3.25%, 0.50% Floor, 12/29/2028 | |
| 1,409,406 | | |
| 1,365,651 | |
| Radiology Partners Inc, First Lien Term Loan, 6M CME TERM SOFR + 5.00%, 01/31/2029 | |
| 1,472,242 | | |
| 1,400,102 | |
| Surgery Center Holdings Inc, First Lien Term Loan, 1M US SOFR + 2.75%, 12/19/2030 | |
| 342,132 | | |
| 343,438 | |
| U.S. Anesthesia Partners, Inc., First Lien Term Loan, 3M CME TERM SOFR + 4.25%, 0.50% Floor, 10/01/2028 | |
| 1,271,565 | | |
| 1,222,997 | |
| | |
| | | |
| 15,716,233 | |
| | |
| | | |
| | |
| Health Care Technology - 2.86% | |
| | | |
| | |
| Cotiviti Inc., First Lien Term Loan, 6M US L + 0.00%, 05/01/2031 | |
| 2,008,027 | | |
| 2,000,920 | |
| Gainwell Acquisition Corp., First Lien Term Loan, 3M CME TERM SOFR + 4.00%, 0.75% Floor, 10/01/2027 | |
| 1,446,038 | | |
| 1,403,857 | |
| GHX Ultimate Parent Corp., First Lien Term Loan, 3M CME TERM SOFR + 4.00%, 0.50% Floor, 06/30/2027(b) | |
| 1,188,103 | | |
| 1,197,014 | |
| Project Ruby Ultimate Parent Corp., First Lien Closing Date Term Loan, 1M US SOFR + 3.25%, 0.75% Floor, 03/10/2028 | |
| 728,431 | | |
| 730,401 | |
| Waystar Technologies, Inc., First Lien Term Loan, 6M CME TERM SOFR + 3.00%, 10/22/2029 | |
| 169,962 | | |
| 170,387 | |
| | |
| | | |
| 5,502,579 | |
| | |
| | | |
| | |
| Hotels, Restaurants & Leisure - 5.88% | |
| | | |
| | |
| 1011778 BC UNLIMITED LIABILITY CO, First Lien Term Loan, 1M US SOFR + 1.75%, 09/20/2030 | |
| 1,772,296 | | |
| 1,770,054 | |
| Bally's Corp., First Lien Term Loan, 3M CME TERM SOFR + 3.25%, 0.50% Floor, 10/02/2028 | |
| 1,361,499 | | |
| 1,296,120 | |
| Caesars Entertainment, Inc., First Lien Term Loan: | |
| | | |
| | |
| 3M CME TERM SOFR + 2.75%, 0.50% Floor, 02/06/2030 | |
| 1,260,725 | | |
| 1,263,184 | |
| 3M CME TERM SOFR + 2.75%, 0.50% Floor, 02/06/2031 | |
| 437,756 | | |
| 438,645 | |
| Cedar Fair LP, First Lien Term Loan, 1M US SOFR + 2.00%, 05/01/2031 | |
| 340,018 | | |
| 339,860 | |
| Entain plc, First Lien Term Loan, 3M CME TERM SOFR + 2.75%, 10/31/2029 | |
| 1,294,233 | | |
| 1,297,928 | |
| Fertitta Entertainment, LLC, First Lien Term Loan, 1M US SOFR + 3.75%, 01/27/2029 | |
| 645,744 | | |
| 647,235 | |
| Flutter Financing B.V., First Lien Term Loan, 3M CME TERM SOFR + 2.25%, 11/25/2030 | |
| 1,805,069 | | |
| 1,808,273 | |
| Hilton Grand Vacations Borrower, LLC, First Lien Term Loan, 1M US SOFR + 2.75%, 01/17/2031 | |
| 233,324 | | |
| 233,616 | |
| IRB Holding Corporation, First Lien Term Loan, 1M US SOFR + 2.75%, 12/15/2027 | |
| 836,626 | | |
| 837,254 | |
| LC Ahab US Bidco LLC, First Lien Term Loan, 1M US SOFR + 3.50%, 05/01/2031 | |
| 313,752 | | |
| 314,734 | |
| OVG Business Services, LLC TLB 1L, First Lien Term Loan, 6M US L + 0.00%, 06/13/2031 | |
| 521,709 | | |
| 521,385 | |
| Tacala Investment Corp, First Lien Term Loan, 1M US SOFR + 4.00%, 01/31/2031 | |
| 561,624 | | |
| 564,727 | |
| | |
| | | |
| 11,333,015 | |
| | |
| | | |
| | |
| Household Durables - 0.91% | |
| | | |
| | |
| ACProducts Holdings, Inc., First Lien Term Loan, 3M US L + 4.25%, 0.50% Floor, 05/17/2028 | |
| 2,068,715 | | |
| 1,759,266 | |
| | |
| | | |
| | |
| Independent Power and Renewable Electricity Producers - 0.69% | |
| | | |
| | |
| Calpine Corp., First Lien Term Loan, 1M US SOFR + 2.00%, 01/31/2031 | |
| 1,332,558 | | |
| 1,329,920 | |
| | |
| | | |
| | |
| Insurance - 3.27% | |
| | | |
| | |
| AmWINS Group, Inc., First Lien Term Loan, 1M US SOFR + 2.25%, 0.75% Floor, 02/19/2028 | |
| 660,303 | | |
| 660,561 | |
See
Notes to Financial Statements.
| 18 |
www.blackstone-credit.com |
| Blackstone Senior Floating Rate 2027 Term Fund |
Portfolio of Investments |
June
30, 2024 (Unaudited)
| | |
Principal
Amount | | |
Value | |
| Insurance (continued) | |
| | |
| |
| AssuredPartners, Inc., First Lien Term Loan, 1M US SOFR + 3.50%, 02/14/2031 | |
$ | 347,410 | | |
$ | 348,713 | |
| Baldwin Insurance Group Holdings LLC, First Lien Term Loan, 6M CME TERM SOFR + 3.50%, 05/26/2031(b) | |
| 878,178 | | |
| 879,275 | |
| BroadStreet Partners Inc, First Lien Term Loan, 6M CME TERM SOFR + 3.25%, 06/13/2031 | |
| 1,115,759 | | |
| 1,114,085 | |
| Hyperion Refinance Sarl, First Lien Term Loan: | |
| | | |
| | |
| 1M US SOFR + 4.00%, 0.50% Floor, 04/18/2030 | |
| 1,456,842 | | |
| 1,460,856 | |
| 1M US SOFR + 3.50%, 0.50% Floor, 02/15/2031 | |
| 487,595 | | |
| 489,260 | |
| Truist Insurance 3/24 2nd Lien Cov-Lite, Second Lien Term Loan, 3M CME TERM SOFR + 4.75%, 05/06/2032 | |
| 567,317 | | |
| 580,081 | |
| USI Inc/NY aka Compass Investors TLB, First Lien Term Loan, 3M CME TERM SOFR + 2.75%, 09/27/2030 | |
| 770,019 | | |
| 770,982 | |
| | |
| | | |
| 6,303,813 | |
| | |
| | | |
| | |
| Interactive Media & Services - 0.68% | |
| | | |
| | |
| Foundational Education Group, Inc., First Lien Term Loan, 3M CME TERM SOFR + 3.75%, 08/31/2028(b) | |
| 34,218 | | |
| 33,362 | |
| LI Group Holdings, Inc., First Lien 2021 Term Loan, 1M US SOFR + 3.50%, 0.75% Floor, 03/11/2028(b) | |
| 1,282,560 | | |
| 1,285,766 | |
| | |
| | | |
| 1,319,128 | |
| | |
| | | |
| | |
| IT Services - 5.77% | |
| | | |
| | |
| Access CIG LLC, First Lien Term Loan, 3M CME TERM SOFR + 5.00%, 0.50% Floor, 08/18/2028 | |
| 900,955 | | |
| 907,856 | |
| Ahead DB Holdings, LLC, First Lien Term Loan, 3M CME TERM SOFR + 4.25%, 02/01/2031 | |
| 1,340,314 | | |
| 1,346,393 | |
| Asurion LLC, Second Lien Term Loan, 1M US SOFR + 5.25%, 01/20/2029 | |
| 61,459 | | |
| 56,874 | |
| Blackhawk Network Holdings Inc, First Lien Term Loan, 1M US SOFR + 5.00%, 03/12/2029 | |
| 1,000,000 | | |
| 1,003,440 | |
| Chrysaor Bidco Sarl DDTL 1L, First Lien Term Loan, 6M CME TERM SOFR + 4.00%, 05/14/2031 | |
| 22,473 | | |
| 22,599 | |
| Chrysaor Bidco Sarl TLB 1L, First Lien Term Loan, 6M CME TERM SOFR + 4.00%, 05/14/2031 | |
| 303,869 | | |
| 305,580 | |
| Dcert Buyer, Inc., Second Lien First Amendment Refinancing Term Loan, 1M US SOFR + 7.00%, 02/19/2029 | |
| 1,881,655 | | |
| 1,688,785 | |
| Go Daddy Oper Co LLC, First Lien Term Loan, 1M US SOFR + 1.75%, 05/30/2031 | |
| 472,500 | | |
| 472,637 | |
| Newfold Digital Holdings Group, Inc., First Lien Initial Term Loan, 1M US SOFR + 3.50%, 0.75% Floor, 02/10/2028 | |
| 2,326,630 | | |
| 2,166,674 | |
| Presidio/Fortress Intermediate 4/24 TLB 1L, First Lien Term Loan, 6M CME TERM SOFR + 4.00%, 05/09/2031(b) | |
| 1,242,000 | | |
| 1,245,105 | |
| Skopima Merger Sub Inc., First Lien Initial Term Loan, 1M US SOFR + 4.00%, 05/12/2028 | |
| 599,786 | | |
| 600,053 | |
| Virtusa Corp., First Lien Term Loan, 1M US SOFR + 3.25%, 0.75% Floor, 02/15/2029 | |
| 918,491 | | |
| 922,078 | |
| World Wide Technology 3/24, First Lien Term Loan, 1M US SOFR + 2.75%, 03/01/2030(b) | |
| 366,285 | | |
| 368,117 | |
| | |
| | | |
| 11,106,191 | |
| | |
| | | |
| | |
| Leisure Products - 0.08% | |
| | | |
| | |
| Amer Sports Co, First Lien Term Loan, 3M CME TERM SOFR + 3.25%, 02/17/2031(b) | |
| 153,933 | | |
| 155,087 | |
| | |
| | | |
| | |
| Life Sciences Tools & Services - 2.22% | |
| | | |
| | |
| Catalent Pharma Solutions, Inc., First Lien Term Loan, 1M US SOFR + 2.00%, 0.50% Floor, 02/22/2028 | |
| 1,150,433 | | |
| 1,151,296 | |
| Curia Global, Inc., First Lien 2021 Term Loan, 3M CME TERM SOFR + 3.75%, 0.75% Floor, 08/30/2026 | |
| 1,505,395 | | |
| 1,421,823 | |
| IQVIA INC., First Lien Term Loan, 3M CME TERM SOFR + 2.00%, 01/02/2031 | |
| 194,216 | | |
| 195,248 | |
| Loire UK Midco 3, Ltd., First Lien Facility B2 Term Loan, 1M US SOFR + 3.75%, 0.75% Floor, 04/21/2027 | |
| 923,260 | | |
| 918,260 | |
See
Notes to Financial Statements.
| Semi-Annual Report | June
30, 2024 |
19 |
| Blackstone Senior Floating Rate 2027 Term Fund |
Portfolio of Investments |
June
30, 2024 (Unaudited)
| | |
Principal
Amount | | |
Value | |
| Life Sciences Tools & Services (continued) | |
| | |
| |
| Parexel International Corporation, First Lien Term Loan, 1M US SOFR + 3.25%, 0.50% Floor, 11/15/2028 | |
$ | 581,643 | | |
$ | 583,550 | |
| | |
| | | |
| 4,270,177 | |
| | |
| | | |
| | |
| Machinery - 6.50% | |
| | | |
| | |
| Asp Blade Holdings, Inc., First Lien Term Loan, 3M CME TERM SOFR + 4.00%, 0.50% Floor, 10/13/2028 | |
| 238,402 | | |
| 182,318 | |
| Bettcher Industries, Inc., First Lien Term Loan, 3M CME TERM SOFR + 4.00%, 12/14/2028 | |
| 825,902 | | |
| 824,353 | |
| Crosby US Acquisition corp., First Lien Term Loan, 1M US SOFR + 4.00%, 08/16/2029 | |
| 399,189 | | |
| 401,892 | |
| Engineered Machinery Holdings, Inc., First Lien Term Loan, 3M CME TERM SOFR + 3.75%, 0.75% Floor, 05/19/2028 | |
| 1,413,479 | | |
| 1,420,879 | |
| Hyperion Materials & Technologies, Inc., First Lien Initial Term Loan, 3M CME TERM SOFR + 4.50%, 0.50% Floor, 08/30/2028 | |
| 716,388 | | |
| 699,732 | |
| INNIO Group Hldg GmbH, First Lien Term Loan, 6M CME TERM SOFR + 3.50%, 11/02/2028 | |
| 184,467 | | |
| 185,102 | |
| LSF11 Trinity Bidco Inc, First Lien Term Loan, 3M CME TERM SOFR + 3.50%, 06/14/2030 | |
| 1,067,892 | | |
| 1,074,235 | |
| Osmosis Buyer Limited, First Lien Initial B Term Loan, 3M CME TERM SOFR + 4.00%, 0.50% Floor, 07/31/2028 | |
| 1,613,606 | | |
| 1,618,301 | |
| Pro Mach Group, Inc., First Lien Closing Date Initial Term Loan, 1M US SOFR + 3.50%, 1.00% Floor, 08/31/2028 | |
| 1,448,756 | | |
| 1,457,810 | |
| Project Castle, Inc., First Lien Term Loan, 3M CME TERM SOFR + 5.50%, 06/01/2029 | |
| 1,493,400 | | |
| 1,337,840 | |
| SPX FLOW Inc, First Lien Term Loan, 1M US SOFR + 3.50%, 04/05/2029 | |
| 430,235 | | |
| 433,212 | |
| TK Elevator Midco GmbH, First Lien Term Loan, 6M CME TERM SOFR + 3.50%, 04/30/2030 | |
| 1,792,009 | | |
| 1,803,487 | |
| Victory Buyer LLC, First Lien Term Loan, 3M CME TERM SOFR + 3.75%, 0.50% Floor, 11/19/2028 | |
| 1,122,205 | | |
| 1,082,928 | |
| | |
| | | |
| 12,522,089 | |
| | |
| | | |
| | |
| Media - 1.43% | |
| | | |
| | |
| ABG Intermediate Holdings 2 LLC, First Lien Term Loan, 6M CME TERM SOFR + 2.75%, 12/21/2028 | |
| 218,958 | | |
| 219,438 | |
| American Greetings Corp., First Lien Term Loan, 1M US SOFR + 5.75%, 10/30/2029 | |
| 859,413 | | |
| 865,592 | |
| Cable One, Inc., First Lien Term Loan, 3M US L + 2.00%, 05/03/2028 | |
| 350,384 | | |
| 345,566 | |
| Cogeco Financing 2 LP, First Lien Term Loan, 3M CME TERM SOFR + 2.50%, 0.50% Floor, 09/01/2028 | |
| 198,311 | | |
| 192,256 | |
| Fleet Midco I Ltd., First Lien Term Loan, 1M US SOFR + 3.25%, 02/21/2031 | |
| 444,701 | | |
| 447,480 | |
| Univision Communications, Inc., First Lien Term Loan, 1M US SOFR + 3.25%, 0.75% Floor, 03/15/2026 | |
| 691,938 | | |
| 693,108 | |
| | |
| | | |
| 2,763,440 | |
| | |
| | | |
| | |
| Metals & Mining - 0.18% | |
| | | |
| | |
| Arsenal AIC Parent, LLC, First Lien Term Loan, 1M US SOFR + 3.75%, 08/18/2030 | |
| 341,639 | | |
| 344,116 | |
| | |
| | | |
| | |
| | |
| | | |
| | |
| Mortgage Real Estate Investment - 0.30% | |
| | | |
| | |
| Blackstone Mortgage Trust, Inc., First Lien Term Loan: | |
| | | |
| | |
| 1M US SOFR + 2.25%, 04/23/2026 | |
| 294,588 | | |
| 289,800 | |
| 1M US SOFR + 2.75%, 0.50% Floor, 04/23/2026 | |
| 294,670 | | |
| 290,987 | |
| | |
| | | |
| 580,787 | |
| | |
| | | |
| | |
| Oil, Gas & Consumable Fuels - 0.90% | |
| | | |
| | |
| Buckeye Partners LP, First Lien Term Loan: | |
| | | |
| | |
| 1M US SOFR + 2.00%, 11/01/2026 | |
| 354,058 | | |
| 354,816 | |
| 3M CME TERM SOFR + 2.00%, 11/22/2030 | |
| 259,145 | | |
| 259,428 | |
| Freeport LNG, First Lien Term Loan, 3M CME TERM SOFR + 3.50%, 12/21/2028 | |
| 363,368 | | |
| 363,417 | |
| GIP Pilot Acquisition Partners LP, First Lien Term Loan, 3M CME TERM SOFR + 2.50%, 10/04/2030 | |
| 358,142 | | |
| 359,038 | |
See
Notes to Financial Statements.
| 20 |
www.blackstone-credit.com |
| Blackstone Senior Floating Rate 2027 Term Fund |
Portfolio of Investments |
June
30, 2024 (Unaudited)
| | |
Principal
Amount | | |
Value | |
| Oil, Gas & Consumable Fuels (continued) | |
| | |
| |
| Whitewater Whistler Holdings LLC, First Lien Term Loan, 6M CME TERM SOFR + 2.25%, 02/15/2030 | |
$ | 399,770 | | |
$ | 400,354 | |
| | |
| | | |
| 1,737,053 | |
| | |
| | | |
| | |
| Passenger Airlines - 1.32% | |
| | | |
| | |
| Air Canada, First Lien Term Loan, 3M CME TERM SOFR + 2.50%, 03/21/2031 | |
| 577,135 | | |
| 578,668 | |
| American Airlines, Inc., First Lien 2020 Term Loan, 6M CME TERM SOFR + 1.75%, 01/29/2027 | |
| 228,870 | | |
| 228,370 | |
| American Airlines, Inc., First Lien Term Loan, 1M US SOFR + 2.75%, 02/15/2028 | |
| 602,828 | | |
| 602,243 | |
| United Airlines, Inc. aka Continental, First Lien Term Loan, 1M US SOFR + 2.75%, 02/22/2031 | |
| 1,123,178 | | |
| 1,127,390 | |
| | |
| | | |
| 2,536,671 | |
| | |
| | | |
| | |
| Pharmaceuticals - 1.33% | |
| | | |
| | |
| Elanco Animal Health, Inc., First Lien B Term Loan, 1M US SOFR + 1.75%, 08/01/2027 | |
| 1,376,867 | | |
| 1,373,535 | |
| Padagis LLC, First Lien Initial Term Loan, 3M CME TERM SOFR + 4.75%, 0.50% Floor, 07/06/2028(b) | |
| 1,216,013 | | |
| 1,191,693 | |
| | |
| | | |
| 2,565,228 | |
| | |
| | | |
| | |
| Professional Services - 12.48% | |
| | | |
| | |
| AG Group Holdings, Inc., First Lien Term Loan, 1M US SOFR + 4.00%, 12/29/2028 | |
| 1,758,610 | | |
| 1,756,412 | |
| AlixPartners, LLP, First Lien USD B Term Loan, 1M US SOFR + 2.50%, 0.50% Floor, 02/04/2028 | |
| 1,516,292 | | |
| 1,519,135 | |
| Ankura Consulting Group LLC, First Lien Term Loan, 3M CME TERM SOFR + 4.25%, 0.75% Floor, 03/17/2028 | |
| 302,175 | | |
| 303,372 | |
| Cast & Crew LLC, First Lien Term Loan, 1M US SOFR + 3.75%, 0.50% Floor, 12/29/2028 | |
| 1,010,019 | | |
| 1,011,821 | |
| CoreLogic, Inc., First Lien Initial Term Loan, 1M US SOFR + 3.50%, 0.50% Floor, 06/02/2028 | |
| 361,789 | | |
| 357,008 | |
| CoreLogic, Inc., Second Lien Initial Term Loan, 1M US SOFR + 6.50%, 0.50% Floor, 06/04/2029 | |
| 567,442 | | |
| 557,512 | |
| DTI Holdco, Inc., First Lien Term Loan, 1M US SOFR + 4.75%, 04/26/2029 | |
| 747,830 | | |
| 751,831 | |
| Dun & Bradstreet Corp., First Lien Term Loan, 1M US SOFR + 2.75%, 01/18/2029 | |
| 928,511 | | |
| 930,252 | |
| EAB Global, Inc., First Lien Term Loan, 3M CME TERM SOFR + 3.50%, 0.50% Floor, 08/16/2028 | |
| 850,789 | | |
| 851,002 | |
| Eisner Advisory Group LLC, First Lien Term Loan, 1M US SOFR + 4.00%, 02/28/2031 | |
| 967,145 | | |
| 977,827 | |
| Element Materials Technology Group Holdings DTL, First Lien Term Loan, 3M CME TERM SOFR + 4.25%, 07/06/2029 | |
| 562,728 | | |
| 565,660 | |
| Element Materials Technology Group Holdings, First Lien Term Loan, 3M CME TERM SOFR + 4.25%, 07/06/2029 | |
| 1,219,244 | | |
| 1,225,597 | |
| Galaxy US Opco Inc. TL, First Lien Term Loan, 3M CME TERM SOFR + 4.75%, 04/29/2029 | |
| 983,131 | | |
| 802,072 | |
| Genuine Financial Holdings LLC, First Lien Term Loan, 3M CME TERM SOFR + 4.00%, 09/27/2030 | |
| 1,837,787 | | |
| 1,834,112 | |
| Grant Thornton 5/24 Cov-Lite TLB 1L, First Lien Term Loan, 6M CME TERM SOFR + 3.75%, 06/02/2031 | |
| 936,876 | | |
| 940,731 | |
| Inmar, Inc., First Lien Term Loan, 1M US SOFR + 5.50%, 05/01/2026 | |
| 589,248 | | |
| 591,458 | |
| Isolved, Inc., First Lien Term Loan, 1M US SOFR + 3.50%, 10/15/2030 | |
| 350,223 | | |
| 351,536 | |
| Lereta, LLC, First Lien Term Loan, 1M US SOFR + 5.25%, 07/30/2028 | |
| 479,804 | | |
| 361,851 | |
| Mermaid Bidco Inc aka Datasite TL 1L, First Lien Term Loan, 6M CME TERM SOFR + 3.50%, 06/30/2031(b) | |
| 505,545 | | |
| 506,809 | |
| Neptune Bidco US, Inc., First Lien Term Loan: | |
| | | |
| | |
| 3M CME TERM SOFR + 4.75%, 10/11/2028 | |
| 474,335 | | |
| 446,230 | |
| 3M CME TERM SOFR + 5.00%, 0.50% Floor, 04/11/2029 | |
| 606,429 | | |
| 572,317 | |
| Ryan LLC., First Lien Term Loan, 1M US SOFR + 3.50%, 11/14/2030 | |
| 698,673 | | |
| 702,428 | |
| Sedwick CMS 2/23 TLB, First Lien Term Loan, 1M US SOFR + 3.75%, 02/24/2028 | |
| 867,923 | | |
| 869,972 | |
See
Notes to Financial Statements.
| Semi-Annual Report | June
30, 2024 |
21 |
| Blackstone Senior Floating Rate 2027 Term Fund |
Portfolio of Investments |
June
30, 2024 (Unaudited)
| | |
Principal
Amount | | |
Value | |
| Professional Services (continued) | |
| | |
| |
| Trans Union LLC, First Lien Term Loan: | |
| | |
| |
| 1M US SOFR + 2.00%, 12/01/2028 | |
$ | 281,428 | | |
$ | 281,854 | |
| 6M CME TERM SOFR + 1.75%, 06/06/2031 | |
| 1,768,357 | | |
| 1,767,473 | |
| TTF Holdings LLC, First Lien Term Loan, 6M CME TERM SOFR + 4.00%, 06/20/2031(b) | |
| 779,034 | | |
| 779,034 | |
| Vaco Holdings, LLC, First Lien Term Loan, 3M CME TERM SOFR + 5.00%, 01/21/2029 | |
| 1,471,393 | | |
| 1,463,418 | |
| Veritext 3/24, First Lien Term Loan, 1M US SOFR + 3.50%, 08/09/2030 | |
| 959,188 | | |
| 964,823 | |
| | |
| | | |
| 24,043,547 | |
| | |
| | | |
| | |
| Real Estate Management & Development - 0.72% | |
| | | |
| | |
| Cushman & Wakefield US Borrower LLC, First Lien Initial Term Loan, 1M US SOFR + 3.00%, 01/31/2030(b) | |
| 581,176 | | |
| 581,902 | |
| Cushman & Wakefield US Borrower LLC, First Lien Term Loan, 1M US SOFR + 3.75%, 0.50% Floor, 01/31/2030(b) | |
| 790,890 | | |
| 796,822 | |
| | |
| | | |
| 1,378,724 | |
| | |
| | | |
| | |
| Software - 18.25% | |
| | | |
| | |
| Apttus Corp., First Lien Initial Term Loan, 1M US SOFR + 4.00%, 0.75% Floor, 05/08/2028 | |
| 272,582 | | |
| 272,923 | |
| BEP Intermediate/Buyers Edge 4/24 TLB, First Lien Term Loan, 1M US SOFR + 3.75%, 04/25/2031(b) | |
| 340,735 | | |
| 342,439 | |
| Boost Newco Borrower LLC aka Worldpay 1L TL, First Lien Term Loan 01/31/2031 | |
| 867,155 | | |
| 869,445 | |
| Boxer Parent Company Inc., First Lien Term Loan, 3M CME TERM SOFR + 4.00%, 12/29/2028 | |
| 446,014 | | |
| 447,486 | |
| Central Parent, Inc., First Lien Term Loan, 3M CME TERM SOFR + 3.25%, 07/06/2029 | |
| 1,692,738 | | |
| 1,673,169 | |
| Cloud Software Group Inc aka Balboa/Citrix TLB 1L, First Lien Term Loan, 3M CME TERM SOFR + 4.00%, 03/30/2029 | |
| 1,576,043 | | |
| 1,576,737 | |
| Cloud Software Group Inc, First Lien Term Loan, 3M CME TERM SOFR + 4.50%, 03/21/2031 | |
| 265,716 | | |
| 266,775 | |
| Cloudera, Inc., First Lien Term Loan, 3M CME TERM SOFR + 3.75%, 0.50% Floor, 10/08/2028 | |
| 1,144,148 | | |
| 1,146,293 | |
| Connectwise, LLC, First Lien Term Loan, 3M CME TERM SOFR + 3.50%, 0.50% Floor, 09/29/2028 | |
| 757,852 | | |
| 753,684 | |
| Cornerstone OnDemand, Inc., First Lien Initial Term Loan, 1M US SOFR + 3.75%, 0.50% Floor, 10/16/2028 | |
| 1,770,902 | | |
| 1,676,451 | |
| Delta Topco, Inc., First Lien Term Loan, 3M CME TERM SOFR + 3.50%, 11/30/2029 | |
| 1,788,855 | | |
| 1,790,161 | |
| Epicor Software Corp, First Lien Term Loan: | |
| | | |
| | |
| 1M US SOFR + 3.25%, 05/30/2031(c) | |
| 322,751 | | |
| 324,499 | |
| 3M US L + 0.00%, 05/30/2031 | |
| 42,901 | | |
| 43,134 | |
| Fiserv Investment Solutions, Inc., First Lien Initial Term Loan, 3M CME TERM SOFR + 4.00%, 02/18/2027 | |
| 1,440,506 | | |
| 1,389,339 | |
| Flexera Software LLC, First Lien Term Loan, 3M CME TERM SOFR + 8.83%, 03/03/2028 | |
| 495,514 | | |
| 497,992 | |
| Genesys Cloud Services Holdings II LLC aka Genesys, First Lien Term Loan, 1M US SOFR + 3.75%, 12/01/2027 | |
| 157,796 | | |
| 159,061 | |
| Genesys Cloud Services Holdings II LLC, First Lien Term Loan, 1M US SOFR + 3.50%, 0.75% Floor, 12/01/2027 | |
| 1,395,199 | | |
| 1,403,424 | |
| Help/Systems Holdings, Inc., First Lien Seventh Amendment Refinancing Term Loan, 3M CME TERM SOFR + 4.00%, 0.75% Floor, 11/19/2026 | |
| 1,303,650 | | |
| 1,177,359 | |
| Idera INC, First Lien Term Loan, 1M US SOFR + 3.50%, 03/02/2028 | |
| 1,352,552 | | |
| 1,344,944 | |
| Infoblox 4/24 2nd lien TL 1L, Second Lien Term Loan, 3M CME TERM SOFR + 5.25%, 11/29/2030 | |
| 652,689 | | |
| 663,784 | |
| Instructure Holdings, INC., First Lien Term Loan, 3M CME TERM SOFR + 2.75%, 10/30/2028 | |
| 318,045 | | |
| 318,244 | |
| Ivanti Software, Inc., First Lien First Amendment Term Loan, 3M CME TERM SOFR + 4.00%, 0.75% Floor, 12/01/2027 | |
| 247,187 | | |
| 195,587 | |
| Ivanti Software, Inc., Second Lien Term Loan, 3M CME TERM SOFR + 7.25%, 12/01/2028 | |
| 537,313 | | |
| 353,619 | |
| Magenta Buyer LLC, First Lien Initial Term Loan, 1M US SOFR + 5.00%, 0.75% Floor, 07/27/2028 | |
| 1,677,104 | | |
| 940,226 | |
| Mitnick Corporate Purchaser Inc., First Lien Term Loan, 3M CME TERM SOFR + 4.50%, 05/02/2029 | |
| 992,797 | | |
| 926,280 | |
| Modena Buyer LLC, First Lien Term Loan, 6M CME TERM SOFR + 4.25%, 04/18/2031 | |
| 979,226 | | |
| 957,042 | |
| Perforce Software, Inc., First Lien New Term Loan, 1M US SOFR + 3.75%, 07/01/2026 | |
| 320,231 | | |
| 319,831 | |
See
Notes to Financial Statements.
| 22 |
www.blackstone-credit.com |
| Blackstone Senior Floating Rate 2027 Term Fund |
Portfolio of Investments |
June
30, 2024 (Unaudited)
| | |
Principal
Amount | | |
Value | |
| Software (continued) | |
| | |
| |
| Planview Parent Inc, First Lien Term Loan, 6M CME TERM SOFR + 3.75%, 12/17/2027 | |
$ | 625,783 | | |
$ | 626,043 | |
| Project Alpha Intermediate Holding Inc, First Lien Term Loan, 6M CME TERM SOFR + 3.75%, 10/28/2030 | |
| 1,228,620 | | |
| 1,233,909 | |
| Project Leopard Holdings, Inc., First Lien Term Loan, 3M CME TERM SOFR + 5.25%, 0.50% Floor, 07/20/2029 | |
| 980,642 | | |
| 915,277 | |
| Proofpoint Inc, First Lien Term Loan, 3M CME TERM SOFR + 3.00%, 08/31/2028 | |
| 258,967 | | |
| 259,502 | |
| Quartz Acquireco LLC, First Lien Term Loan, 3M CME TERM SOFR + 2.75%, 06/28/2030 | |
| 1,546,264 | | |
| 1,549,163 | |
| Quest Borrower Ltd., First Lien Term Loan, 3M CME TERM SOFR + 4.25%, 02/01/2029 | |
| 1,726,766 | | |
| 1,286,924 | |
| Rocket Software, Inc., First Lien Term Loan, 1M US SOFR + 4.75%, 0.50% Floor, 11/28/2028 | |
| 1,077,303 | | |
| 1,083,126 | |
| SS&C Technologies, Inc., First Lien Term Loan, 1M US SOFR + 2.00%, 05/09/2031 | |
| 1,488,152 | | |
| 1,492,006 | |
| Surf Holdings Sarl., First Lien Dollar Tranche Term Loan, 1M US SOFR + 3.50%, 03/05/2027 | |
| 1,633,000 | | |
| 1,636,830 | |
| Vision Solutions, Inc., First Lien Term Loan, 3M CME TERM SOFR + 4.25%, 0.75% Floor, 04/24/2028 | |
| 1,676,619 | | |
| 1,653,565 | |
| VS Buyer LLC, First Lien Term Loan, 1M US SOFR + 3.25%, 04/12/2031 | |
| 708,547 | | |
| 711,204 | |
| Webpros Luxembourg Sarl, First Lien Term Loan, 1M US SOFR + 4.00%, 03/28/2031(b) | |
| 305,195 | | |
| 308,056 | |
| Xplor T1, LLC, First Lien Term Loan, 3M CME TERM SOFR + 9.60%, 06/14/2031(b) | |
| 553,000 | | |
| 553,000 | |
| | |
| | | |
| 35,138,533 | |
| | |
| | | |
| | |
| Specialty Retail - 1.79% | |
| | | |
| | |
| APRO LLC, First Lien Term Loan, 6M CME TERM SOFR + 4.00%, 06/13/2034(b) | |
| 553,226 | | |
| 553,918 | |
| EG America LLC, First Lien Term Loan, 3M CME TERM SOFR + 5.50%, 0.50% Floor, 02/07/2028 | |
| 529,223 | | |
| 523,712 | |
| HomeServe USA Corp., First Lien Term Loan, 1M US SOFR + 2.50%, 10/21/2030 | |
| 352,998 | | |
| 354,286 | |
| Mavis Tire Express Services Topco Corp., First Lien Term Loan, 1M US SOFR + 3.75%, 0.75% Floor, 05/04/2028 | |
| 221,430 | | |
| 222,198 | |
| Spencer Spirit IH LLC, First Lien Term Loan, 6M US L + 0.00%, 06/01/2034(b) | |
| 814,897 | | |
| 814,897 | |
| StubHub Holdco Sub LLC, First Lien Term Loan, 1M US SOFR + 4.75%, 03/15/2030 | |
| 969,978 | | |
| 971,496 | |
| | |
| | | |
| 3,440,507 | |
| | |
| | | |
| | |
| Technology Hardware, Storage & Peripherals - 0.25% | |
| | | |
| | |
| Xerox 11/23, First Lien Term Loan, 1M US SOFR + 4.00%, 11/17/2029 | |
| 479,700 | | |
| 479,925 | |
| | |
| | | |
| | |
| Textiles, Apparel & Luxury Goods - 0.65% | |
| | | |
| | |
| Champ Acquisition Corp., First Lien Initial Term Loan, 3M CME TERM SOFR + 5.50%, 12/19/2025 | |
| 1,241,539 | | |
| 1,247,591 | |
| | |
| | | |
| | |
| Trading Companies & Distributors - 4.71% | |
| | | |
| | |
| American Builders & Contractors Supply Co., Inc., First Lien Term Loan, 1M US SOFR + 2.00%, 01/31/2031 | |
| 225,414 | | |
| 226,147 | |
| Avolon TLB Borrower 1 (US), First Lien Term Loan, 1M US SOFR + 2.00%, 06/22/2028 | |
| 731,704 | | |
| 733,533 | |
| CD&R Hydr SunSource, First Lien Term Loan, 1M US SOFR + 4.00%, 03/25/2031 | |
| 764,539 | | |
| 766,928 | |
| Core & Main LP, First Lien Term Loan, 3M CME TERM SOFR + 2.25%, 02/09/2031(b) | |
| 176,859 | | |
| 177,413 | |
| FCG Acquisitions, Inc., First Lien Initial Term Loan, 1M US L + 3.75%, 0.50% Floor, 03/31/2028 | |
| 603,266 | | |
| 604,096 | |
| FCG Acquisitions, Inc., First Lien Term Loan 03/31/2028 | |
| 538,020 | | |
| 540,038 | |
| Foundation Building Materials, Inc., First Lien Term Loan, 3M CME TERM SOFR + 4.00%, 01/29/2031 | |
| 1,080,035 | | |
| 1,077,038 | |
| Kodiak Building Partners Inc., First Lien Term Loan, 3M CME TERM SOFR + 3.25%, 0.75% Floor, 03/12/2028 | |
| 1,483,043 | | |
| 1,485,594 | |
| Park River Holdings, Inc., First Lien Initial Term Loan, 3M CME TERM SOFR + 3.25%, 0.75% Floor, 12/28/2027 | |
| 572,616 | | |
| 561,004 | |
| White Cap Buyer LLC, First Lien Term Loan, 1M US SOFR + 3.25%, 10/19/2029 | |
| 1,488,454 | | |
| 1,492,688 | |
| Windsor Holdings III LLC, First Lien Term Loan, 1M US SOFR + 4.00%, 08/01/2030 | |
| 1,394,267 | | |
| 1,405,072 | |
| | |
| | | |
| 9,069,551 | |
See
Notes to Financial Statements.
| Semi-Annual Report | June
30, 2024 |
23 |
| Blackstone Senior Floating Rate 2027 Term Fund |
Portfolio of Investments |
June
30, 2024 (Unaudited)
| | |
Principal
Amount | | |
Value | |
| Transportation Infrastructure - 0.50% | |
| | |
| |
| Brown Group Holding LLC, First Lien Term Loan, 1M US SOFR + 2.75%, 0.50% Floor, 06/07/2028 | |
$ | 970,257 | | |
$ | 970,927 | |
| | |
| | | |
| | |
| Wireless Telecommunication Services - 0.16% | |
| | | |
| | |
| CCI Buyer, Inc., First Lien Initial Term Loan, 3M CME TERM SOFR + 4.00%, 0.75% Floor, 12/17/2027 | |
| 302,961 | | |
| 303,647 | |
| |
|
|
|
| |
|
| |
| TOTAL FLOATING RATE LOAN INTERESTS |
|
|
|
| |
|
| |
| (Cost $272,983,776) |
|
|
|
| |
| 269,200,940 | |
| | |
|
| | |
| |
| COLLATERALIZED LOAN OBLIGATION SECURITIES(a) - 7.83% | |
|
| | |
| |
| Consumer Finance - 0.25% | |
|
| | |
| |
| PPM CLO 3, Ltd., 3M CME TERM SOFR + 6.87%, 04/17/2034(b)(e) | |
| 500,000 | | |
| 475,028 | |
| | |
| | | |
| | |
| Financial Services - 7.58% | |
| | | |
| | |
| Allegro CLO XII, Ltd., 3M CME TERM SOFR + 7.36%, 01/21/2032(b)(e) | |
| 1,000,000 | | |
| 1,005,639 | |
| Ares LXI CLO, Ltd., 3M CME TERM SOFR + 3.90%, 04/20/2037(b)(e) | |
| 1,000,000 | | |
| 1,021,194 | |
| Bain Capital Credit CLO 2020-4, Ltd., 3M CME TERM SOFR + 7.98%, 10/20/2036(b)(e) | |
| 1,000,000 | | |
| 1,045,880 | |
| Bain Capital Credit CLO 2022-3, Ltd., 3M CME TERM SOFR + 3.70%, 07/17/2035(b)(e) | |
| 1,000,000 | | |
| 1,003,336 | |
| Barings CLO, Ltd. 2018-III, 3M CME TERM SOFR + 3.16%, 07/20/2029(b)(e) | |
| 1,000,000 | | |
| 1,003,611 | |
| Carlyle US CLO 2022-6, Ltd., 3M CME TERM SOFR + 4.75%, 10/25/2036(b)(e) | |
| 1,000,000 | | |
| 1,031,596 | |
| CIFC Funding 2019-V, Ltd., 3M CME TERM SOFR + 3.41%, 01/15/2035(b)(e) | |
| 1,000,000 | | |
| 1,004,653 | |
| CIFC Funding 2022-VII, Ltd., 3M CME TERM SOFR + 5.35%, 10/22/2035(b)(e) | |
| 1,000,000 | | |
| 1,012,333 | |
| Clover CLO 2021-3 LLC, 3M CME TERM SOFR + 3.36%, 01/25/2035(b)(e) | |
| 1,250,000 | | |
| 1,256,579 | |
| HPS Loan Management CLO 6-2015, Ltd., 3M CME TERM SOFR + 5.36%, 02/05/2031(b)(e) | |
| 834,000 | | |
| 830,902 | |
| Octagon 60, Ltd., 3M CME TERM SOFR + 5.00%, 10/20/2035(b)(e) | |
| 1,000,000 | | |
| 1,013,091 | |
| Park Avenue Institutional Advisers CLO, Ltd. 2022-1, 3M CME TERM SOFR + 7.29%, 04/20/2035(b)(e) | |
| 1,000,000 | | |
| 987,437 | |
| Rad CLO 5, Ltd., 3M CME TERM SOFR + 6.96%, 07/24/2032(b)(e) | |
| 500,000 | | |
| 503,603 | |
| Romark CLO IV, Ltd., 3M CME TERM SOFR + 7.21%, 07/10/2034(b)(e) | |
| 1,000,000 | | |
| 970,596 | |
| Sound Point CLO XXXII, Ltd., 3M CME TERM SOFR + 6.96%, 10/25/2034(b)(e) | |
| 1,000,000 | | |
| 910,905 | |
| | |
| | | |
| 14,601,355 | |
| |
|
|
|
| |
|
| |
| TOTAL COLLATERALIZED LOAN OBLIGATION SECURITIES |
|
|
|
| |
|
| |
| (Cost $14,942,903) |
|
|
|
| |
| 15,076,383 | |
| | |
|
| | |
| |
| CORPORATE BONDS - 3.20% | |
|
| | |
| |
| Aerospace & Defense - 0.11% | |
|
| | |
| |
| KBR, Inc., 4.750%, 09/30/2028(e) | |
| 20,000 | | |
| 18,688 | |
| TransDigm, Inc.: | |
| | | |
| | |
| 4.625%, 01/15/2029 | |
| 34,000 | | |
| 31,753 | |
| 4.880%, 05/01/2029 | |
| 105,000 | | |
| 98,461 | |
| Triumph Group, Inc., 9.000%, 03/15/2028(e) | |
| 52,000 | | |
| 54,573 | |
| | |
| | | |
| 203,475 | |
| | |
| | | |
| | |
| Automobile Components - 0.02% | |
| | | |
| | |
| Patrick Industries, Inc., 4.750%, 05/01/2029(e) | |
| 45,000 | | |
| 41,509 | |
| | |
| | | |
| | |
| Banks - 0.02% | |
| | | |
| | |
| Popular, Inc., 7.250%, 03/13/2028 | |
| 30,000 | | |
| 30,835 | |
| | |
| | | |
| | |
| Beverages - 0.02% | |
| | | |
| | |
| Primo Water Holdings, Inc., 4.375%, 04/30/2029(e) | |
| 44,000 | | |
| 40,571 | |
See
Notes to Financial Statements.
| 24 |
www.blackstone-credit.com |
| Blackstone Senior Floating Rate 2027 Term Fund |
Portfolio of Investments |
June
30, 2024 (Unaudited)
| | |
Principal
Amount | | |
Value | |
| Broadline Retail - 0.06% | |
| | |
| |
| Kohl's Corp., 5.550%, 07/17/2045 | |
$ | 10,000 | | |
$ | 6,828 | |
| Nordstrom, Inc., 5.000%, 01/15/2044 | |
| 17,000 | | |
| 13,747 | |
| Rakuten Group, Inc.: | |
| | | |
| | |
| 11.250%, 02/15/2027(e) | |
| 69,000 | | |
| 73,820 | |
| 9.750%, 04/15/2029(e) | |
| 20,000 | | |
| 20,645 | |
| | |
| | | |
| 115,040 | |
| | |
| | | |
| | |
| Building Products - 0.01% | |
| | | |
| | |
| Griffon Corp., 5.750%, 03/01/2028 | |
| 18,000 | | |
| 17,384 | |
| | |
| | | |
| | |
| Chemicals - 0.07% | |
| | | |
| | |
| Chemours Co., 5.750%, 11/15/2028(e) | |
| 55,000 | | |
| 50,841 | |
| CVR Partners LP / CVR Nitrogen Finance Corp., 6.125%, 06/15/2028(e) | |
| 30,000 | | |
| 28,849 | |
| Tronox, Inc., 4.625%, 03/15/2029(e) | |
| 65,000 | | |
| 58,744 | |
| | |
| | | |
| 138,434 | |
| | |
| | | |
| | |
| Commercial Services & Supplies - 0.06% | |
| | | |
| | |
| Cimpress PLC, 7.000%, 06/15/2026 | |
| 60,000 | | |
| 60,015 | |
| CoreCivic, Inc., 8.250%, 04/15/2029 | |
| 20,000 | | |
| 20,690 | |
| Deluxe Corp., 8.000%, 06/01/2029(e) | |
| 10,000 | | |
| 9,396 | |
| Pitney Bowes, Inc., 7.250%, 03/15/2029(e) | |
| 32,000 | | |
| 28,783 | |
| | |
| | | |
| 118,884 | |
| | |
| | | |
| | |
| Construction & Engineering - 0.02% | |
| | | |
| | |
| Great Lakes Dredge & Dock Corp., 5.250%, 06/01/2029(e) | |
| 14,000 | | |
| 12,509 | |
| Tutor Perini Corp., 11.880%, 04/30/2029(e) | |
| 28,000 | | |
| 30,142 | |
| | |
| | | |
| 42,651 | |
| | |
| | | |
| | |
| Consumer Finance - 0.26% | |
| | | |
| | |
| Ally Financial, Inc., 6.700%, 02/14/2033 | |
| 17,000 | | |
| 16,911 | |
| Enova International, Inc., 11.250%, 12/15/2028(e) | |
| 15,000 | | |
| 16,035 | |
| FirstCash, Inc.: | |
| | | |
| | |
| 4.630%, 09/01/2028(e) | |
| 20,000 | | |
| 18,817 | |
| 5.625%, 01/01/2030(e) | |
| 55,000 | | |
| 52,145 | |
| 6.875%, 03/01/2032(e) | |
| 39,000 | | |
| 39,043 | |
| goeasy, Ltd.: | |
| | | |
| | |
| 9.250%, 12/01/2028(e) | |
| 37,000 | | |
| 39,308 | |
| 7.625%, 07/01/2029(e) | |
| 30,000 | | |
| 30,626 | |
| Navient Corp.: | |
| | | |
| | |
| 5.000%, 03/15/2027 | |
| 20,000 | | |
| 19,113 | |
| 4.880%, 03/15/2028 | |
| 50,000 | | |
| 45,940 | |
| 9.380%, 07/25/2030 | |
| 19,000 | | |
| 19,997 | |
| 11.500%, 03/15/2031 | |
| 20,000 | | |
| 22,050 | |
| 5.625%, 08/01/2033 | |
| 20,000 | | |
| 15,983 | |
| OneMain Finance Corp.: | |
| | | |
| | |
| 3.880%, 09/15/2028 | |
| 10,000 | | |
| 8,976 | |
| 5.375%, 11/15/2029 | |
| 15,000 | | |
| 14,079 | |
| 7.875%, 03/15/2030 | |
| 33,000 | | |
| 34,051 | |
| 7.500%, 05/15/2031 | |
| 9,000 | | |
| 9,115 | |
| PRA Group, Inc.: | |
| | | |
| | |
| 8.380%, 02/01/2028(e) | |
| 10,000 | | |
| 9,974 | |
| 8.880%, 01/31/2030(e) | |
| 15,000 | | |
| 14,987 | |
| Synchrony Financial, 7.250%, 02/02/2033 | |
| 51,000 | | |
| 50,743 | |
See
Notes to Financial Statements.
| Semi-Annual Report | June
30, 2024 |
25 |
| Blackstone Senior Floating Rate 2027 Term Fund |
Portfolio of Investments |
June
30, 2024 (Unaudited)
| | |
Principal
Amount | | |
Value | |
| Consumer Finance (continued) | |
| | |
| |
| World Acceptance Corp., 7.000%, 11/01/2026(e) | |
$ | 15,000 | | |
$ | 14,312 | |
| | |
| | | |
| 492,205 | |
| | |
| | | |
| | |
| Containers & Packaging - 0.01% | |
| | | |
| | |
| Ardagh Metal Packaging Finance USA LLC / Ardagh Metal Packaging Finance PLC, 4.000%, 09/01/2029(e) | |
| 25,000 | | |
| 21,184 | |
| | |
| | | |
| | |
| Diversified Consumer Services - 0.01% | |
| | | |
| | |
| Adtalem Global Education, Inc., 5.500%, 03/01/2028(e) | |
| 25,000 | | |
| 24,077 | |
| | |
| | | |
| | |
| Diversified REITs - 0.04% | |
| | | |
| | |
| Iron Mountain, Inc., 5.625%, 07/15/2032(e) | |
| 57,000 | | |
| 54,175 | |
| Service Properties Trust: | |
| | | |
| | |
| 4.950%, 10/01/2029 | |
| 19,000 | | |
| 14,433 | |
| 4.375%, 02/15/2030 | |
| 20,000 | | |
| 14,147 | |
| | |
| | | |
| 82,755 | |
| | |
| | | |
| | |
| Diversified Telecommunication Services - 0.13% | |
| | | |
| | |
| Cogent Communications Group, Inc., 7.000%, 06/15/2027(e) | |
| 67,000 | | |
| 66,437 | |
| Consolidated Communications, Inc., 6.500%, 10/01/2028(e) | |
| 27,000 | | |
| 23,142 | |
| Frontier Communications Holdings LLC: | |
| | | |
| | |
| 6.750%, 05/01/2029(e) | |
| 100,000 | | |
| 91,825 | |
| 5.875%, 11/01/2029 | |
| 22,000 | | |
| 19,189 | |
| 6.000%, 01/15/2030(e) | |
| 15,000 | | |
| 13,071 | |
| Viasat, Inc.: | |
| | | |
| | |
| 6.500%, 07/15/2028(e) | |
| 32,000 | | |
| 24,257 | |
| 7.500%, 05/30/2031(e) | |
| 10,000 | | |
| 6,656 | |
| | |
| | | |
| 244,577 | |
| | |
| | | |
| | |
| Electric Utilities - 0.03% | |
| | | |
| | |
| NRG Energy, Inc., 3.625%, 02/15/2031(e) | |
| 16,000 | | |
| 13,734 | |
| Vistra Operations Co. LLC: | |
| | | |
| | |
| 5.000%, 07/31/2027(e) | |
| 20,000 | | |
| 19,360 | |
| 7.750%, 10/15/2031(e) | |
| 27,000 | | |
| 28,139 | |
| | |
| | | |
| 61,233 | |
| | |
| | | |
| | |
| Energy Equipment & Services - 0.14% | |
| | | |
| | |
| Archrock Partners LP / Archrock Partners Finance Corp., 6.250%, 04/01/2028(e) | |
| 49,000 | | |
| 48,575 | |
| Enerflex, Ltd., 9.000%, 10/15/2027(e) | |
| 45,000 | | |
| 45,723 | |
| Helix Energy Solutions Group, Inc., 9.750%, 03/01/2029(e) | |
| 25,000 | | |
| 26,674 | |
| Precision Drilling Corp., 6.875%, 01/15/2029(e) | |
| 30,000 | | |
| 29,706 | |
| Transocean, Inc., 7.500%, 04/15/2031 | |
| 26,000 | | |
| 24,412 | |
| USA Compression Partners LP / USA Compression Finance Corp., 7.125%, 03/15/2029(e) | |
| 50,000 | | |
| 50,422 | |
| Valaris, Ltd., 8.380%, 04/30/2030(e) | |
| 50,000 | | |
| 51,804 | |
| | |
| | | |
| 277,316 | |
| | |
| | | |
| | |
| Entertainment - 0.02% | |
| | | |
| | |
| Cinemark USA, Inc., 5.250%, 07/15/2028(e) | |
| 48,000 | | |
| 45,931 | |
| | |
| | | |
| | |
| Financial Services - 0.17% | |
| | | |
| | |
| Burford Capital Global Finance LLC, 9.250%, 07/01/2031(e) | |
| 40,000 | | |
| 42,150 | |
| Compass Group Diversified Holdings LLC, 5.250%, 04/15/2029(e) | |
| 10,000 | | |
| 9,494 | |
| Encore Capital Group, Inc.: | |
| | | |
| | |
| 9.250%, 04/01/2029(e) | |
| 15,000 | | |
| 15,650 | |
| 8.500%, 05/15/2030(e) | |
| 23,000 | | |
| 23,442 | |
See
Notes to Financial Statements.
| 26 |
www.blackstone-credit.com |
| Blackstone Senior Floating Rate 2027 Term Fund |
Portfolio of Investments |
June
30, 2024 (Unaudited)
| | |
Principal
Amount | | |
Value | |
| Financial Services (continued) | |
| | |
| |
| Nationstar Mortgage Holdings, Inc.: | |
| | |
| |
| 6.000%, 01/15/2027(e) | |
$ | 50,000 | | |
$ | 49,514 | |
| 5.500%, 08/15/2028(e) | |
| 70,000 | | |
| 67,329 | |
| 7.125%, 02/01/2032(e) | |
| 6,000 | | |
| 6,042 | |
| PennyMac Financial Services, Inc.: | |
| | | |
| | |
| 4.250%, 02/15/2029(e) | |
| 90,000 | | |
| 81,928 | |
| 7.875%, 12/15/2029(e) | |
| 19,000 | | |
| 19,607 | |
| 5.750%, 09/15/2031(e) | |
| 15,000 | | |
| 14,059 | |
| PHH Mortgage Corp., 7.875%, 03/15/2026(e) | |
| 6,000 | | |
| 5,870 | |
| | |
| | | |
| 335,085 | |
| | |
| | | |
| | |
| Food Products - 0.02% | |
| | | |
| | |
| Post Holdings, Inc., 4.625%, 04/15/2030(e) | |
| 50,000 | | |
| 45,977 | |
| | |
| | | |
| | |
| Gas Utilities - 0.04% | |
| | | |
| | |
| Suburban Propane Partners LP/Suburban Energy Finance Corp., 5.000%, 06/01/2031(e) | |
| 57,000 | | |
| 51,380 | |
| Superior Plus LP / Superior General Partner, Inc., 4.500%, 03/15/2029(e) | |
| 30,000 | | |
| 27,559 | |
| | |
| | | |
| 78,939 | |
| | |
| | | |
| | |
| Health Care Providers & Services - 0.14% | |
| | | |
| | |
| AdaptHealth LLC: | |
| | | |
| | |
| 6.125%, 08/01/2028(e) | |
| 35,000 | | |
| 33,451 | |
| 5.125%, 03/01/2030(e) | |
| 40,000 | | |
| 35,027 | |
| CHS/Community Health Systems, Inc.: | |
| | | |
| | |
| 6.875%, 04/15/2029(e) | |
| 9,000 | | |
| 6,893 | |
| 6.125%, 04/01/2030(e) | |
| 23,000 | | |
| 16,119 | |
| 10.880%, 01/15/2032(e) | |
| 37,000 | | |
| 38,555 | |
| DaVita, Inc.: | |
| | | |
| | |
| 4.625%, 06/01/2030(e) | |
| 110,000 | | |
| 99,492 | |
| 3.750%, 02/15/2031(e) | |
| 15,000 | | |
| 12,809 | |
| ModivCare Escrow Issuer, Inc., 5.000%, 10/01/2029(e) | |
| 5,000 | | |
| 3,529 | |
| Pediatrix Medical Group, Inc., 5.375%, 02/15/2030(e) | |
| 25,000 | | |
| 22,128 | |
| | |
| | | |
| 268,003 | |
| | |
| | | |
| | |
| Health Care REITs - 0.04% | |
| | | |
| | |
| MPT Operating Partnership LP / MPT Finance Corp.: | |
| | | |
| | |
| 5.250%, 08/01/2026 | |
| 15,000 | | |
| 13,644 | |
| 5.000%, 10/15/2027 | |
| 40,000 | | |
| 33,073 | |
| 4.625%, 08/01/2029 | |
| 48,000 | | |
| 34,888 | |
| | |
| | | |
| 81,605 | |
| | |
| | | |
| | |
| Hotels, Restaurants & Leisure - 0.06% | |
| | | |
| | |
| Brinker International, Inc., 8.250%, 07/15/2030(e) | |
| 25,000 | | |
| 26,271 | |
| Churchill Downs, Inc., 4.750%, 01/15/2028(e) | |
| 30,000 | | |
| 28,673 | |
| NCL Corp., Ltd., 5.875%, 03/15/2026(e) | |
| 60,000 | | |
| 59,360 | |
| | |
| | | |
| 114,304 | |
| | |
| | | |
| | |
| Household Durables - 0.10% | |
| | | |
| | |
| Dream Finders Homes, Inc., 8.250%, 08/15/2028(e) | |
| 10,000 | | |
| 10,250 | |
| Forestar Group, Inc., 3.850%, 05/15/2026(e) | |
| 30,000 | | |
| 28,773 | |
| LGI Homes, Inc., 8.750%, 12/15/2028(e) | |
| 23,000 | | |
| 23,971 | |
| M/I Homes, Inc.: | |
| | | |
| | |
| 4.950%, 02/01/2028 | |
| 20,000 | | |
| 19,304 | |
| 3.950%, 02/15/2030 | |
| 30,000 | | |
| 26,778 | |
See
Notes to Financial Statements.
| Semi-Annual Report | June
30, 2024 |
27 |
| Blackstone Senior Floating Rate 2027 Term Fund |
Portfolio of Investments |
June
30, 2024 (Unaudited)
| | |
Principal
Amount | | |
Value | |
| Household Durables (continued) | |
| | |
| |
| Tempur Sealy International, Inc.: | |
| | |
| |
| 4.000%, 04/15/2029(e) | |
$ | 85,000 | | |
$ | 76,758 | |
| 3.880%, 10/15/2031(e) | |
| 15,000 | | |
| 12,587 | |
| | |
| | | |
| 198,421 | |
| | |
| | | |
| | |
| Household Products - 0.02% | |
| | | |
| | |
| Energizer Holdings, Inc., 4.750%, 06/15/2028(e) | |
| 44,000 | | |
| 41,233 | |
| | |
| | | |
| | |
| Industrial Conglomerates - 0.07% | |
| | | |
| | |
| Icahn Enterprises LP / Icahn Enterprises Finance Corp.: | |
| | | |
| | |
| 6.250%, 05/15/2026 | |
| 50,000 | | |
| 49,648 | |
| 5.250%, 05/15/2027 | |
| 8,000 | | |
| 7,516 | |
| 9.750%, 01/15/2029(e) | |
| 35,000 | | |
| 36,304 | |
| 9.000%, 06/15/2030(e) | |
| 31,000 | | |
| 30,870 | |
| | |
| | | |
| 124,338 | |
| | |
| | | |
| | |
| IT Services - 0.09% | |
| | | |
| | |
| Bread Financial Holdings, Inc., 9.750%, 03/15/2029(e) | |
| 63,000 | | |
| 66,245 | |
| Conduent Business Services LLC / Conduent State & Local Solutions, Inc., 6.000%, 11/01/2029(e) | |
| 40,000 | | |
| 37,405 | |
| Sabre GLBL, Inc.: | |
| | | |
| | |
| 8.630%, 06/01/2027(e) | |
| 43,000 | | |
| 39,655 | |
| 11.250%, 12/15/2027(e) | |
| 22,000 | | |
| 21,400 | |
| | |
| | | |
| 164,705 | |
| | |
| | | |
| | |
| Machinery - 0.02% | |
| | | |
| | |
| Allison Transmission, Inc., 4.750%, 10/01/2027(e) | |
| 30,000 | | |
| 29,015 | |
| Park-Ohio Industries, Inc., 6.625%, 04/15/2027 | |
| 16,000 | | |
| 15,418 | |
| Wabash National Corp., 4.500%, 10/15/2028(e) | |
| 2,000 | | |
| 1,802 | |
| | |
| | | |
| 46,235 | |
| | |
| | | |
| | |
| Marine Transportation - 0.01% | |
| | | |
| | |
| Danaos Corp., 8.500%, 03/01/2028(e) | |
| 17,000 | | |
| 17,480 | |
| | |
| | | |
| | |
| Media - 0.25% | |
| | | |
| | |
| Advantage Sales & Marketing, Inc., 6.500%, 11/15/2028(e) | |
| 55,000 | | |
| 49,813 | |
| AMC Networks, Inc., 4.250%, 02/15/2029 | |
| 24,000 | | |
| 16,218 | |
| CCO Holdings LLC / CCO Holdings Capital Corp.: | |
| | | |
| | |
| 5.125%, 05/01/2027(e) | |
| 30,000 | | |
| 28,829 | |
| 5.000%, 02/01/2028(e) | |
| 30,000 | | |
| 28,072 | |
| 5.375%, 06/01/2029(e) | |
| 12,000 | | |
| 10,928 | |
| 4.750%, 03/01/2030(e) | |
| 20,000 | | |
| 17,335 | |
| 4.250%, 02/01/2031(e) | |
| 15,000 | | |
| 12,258 | |
| 7.375%, 03/01/2031(e) | |
| 20,000 | | |
| 19,733 | |
| 4.500%, 05/01/2032 | |
| 18,000 | | |
| 14,510 | |
| Clear Channel Outdoor Holdings, Inc.: | |
| | | |
| | |
| 7.750%, 04/15/2028(e) | |
| 38,000 | | |
| 33,293 | |
| 7.500%, 06/01/2029(e) | |
| 38,000 | | |
| 31,792 | |
| CSC Holdings LLC: | |
| | | |
| | |
| 7.500%, 04/01/2028(e) | |
| 5,000 | | |
| 2,659 | |
| 11.750%, 01/31/2029(e) | |
| 30,000 | | |
| 25,604 | |
| 5.750%, 01/15/2030(e) | |
| 10,000 | | |
| 3,783 | |
| Gray Television, Inc.: | |
| | | |
| | |
| 4.750%, 10/15/2030(e) | |
| 49,000 | | |
| 29,448 | |
| 5.375%, 11/15/2031(e) | |
| 37,000 | | |
| 21,005 | |
See
Notes to Financial Statements.
| 28 |
www.blackstone-credit.com |
| Blackstone Senior Floating Rate 2027 Term Fund |
Portfolio of Investments |
June
30, 2024 (Unaudited)
| | |
Principal
Amount | | |
Value | |
| Media (continued) | |
| | |
| |
| Nexstar Media, Inc.: | |
| | |
| |
| 5.625%, 07/15/2027(e) | |
$ | 125,000 | | |
$ | 118,846 | |
| 4.750%, 11/01/2028(e) | |
| 10,000 | | |
| 8,900 | |
| Sinclair Television Group, Inc., 5.500%, 03/01/2030(e) | |
| 12,000 | | |
| 7,309 | |
| | |
| | | |
| 480,335 | |
| | |
| | | |
| | |
| Metals & Mining - 0.19% | |
| | | |
| | |
| Eldorado Gold Corp., 6.250%, 09/01/2029(e) | |
| 35,000 | | |
| 33,665 | |
| FMG Resources August 2006 Pty, Ltd.: | |
| | | |
| | |
| 5.875%, 04/15/2030(e) | |
| 9,000 | | |
| 8,802 | |
| 6.125%, 04/15/2032(e) | |
| 30,000 | | |
| 29,685 | |
| Hudbay Minerals, Inc., 4.500%, 04/01/2026(e) | |
| 40,000 | | |
| 39,166 | |
| Iamgold Corp, 5.750%, 10/15/2028(e) | |
| 34,000 | | |
| 32,158 | |
| Kaiser Aluminum Corp., 4.625%, 03/01/2028(e) | |
| 20,000 | | |
| 18,737 | |
| Mineral Resources, Ltd.: | |
| | | |
| | |
| 8.130%, 05/01/2027(e) | |
| 43,000 | | |
| 43,375 | |
| 8.000%, 11/01/2027(e) | |
| 45,000 | | |
| 46,088 | |
| 9.250%, 10/01/2028(e) | |
| 30,000 | | |
| 31,523 | |
| New Gold, Inc., 7.500%, 07/15/2027(e) | |
| 25,000 | | |
| 25,191 | |
| SunCoke Energy, Inc., 4.880%, 06/30/2029(e) | |
| 34,000 | | |
| 30,840 | |
| Taseko Mines, Ltd., 8.250%, 05/01/2030(e) | |
| 34,000 | | |
| 34,825 | |
| | |
| | | |
| 374,055 | |
| | |
| | | |
| | |
| Mortgage Real Estate Investment - 0.11% | |
| | | |
| | |
| Apollo Commercial Real Estate Finance, Inc., 4.625%, 06/15/2029(e) | |
| 32,000 | | |
| 26,862 | |
| Rithm Capital Corp., 8.000%, 04/01/2029(e) | |
| 72,000 | | |
| 69,956 | |
| Starwood Property Trust, Inc.: | |
| | | |
| | |
| 3.630%, 07/15/2026(e) | |
| 10,000 | | |
| 9,417 | |
| 4.380%, 01/15/2027(e) | |
| 100,000 | | |
| 94,780 | |
| 7.250%, 04/01/2029(e) | |
| 8,000 | | |
| 8,096 | |
| | |
| | | |
| 209,111 | |
| | |
| | | |
| | |
| Office REITs - 0.02% | |
| | | |
| | |
| Brandywine Operating Partnership LP, 4.550%, 10/01/2029 | |
| 20,000 | | |
| 17,432 | |
| Vornado Realty LP, 3.400%, 06/01/2031 | |
| 20,000 | | |
| 15,723 | |
| | |
| | | |
| 33,155 | |
| | |
| | | |
| | |
| Oil, Gas & Consumable Fuels - 0.37% | |
| | | |
| | |
| Berry Petroleum Co. LLC, 7.000%, 02/15/2026(e) | |
| 15,000 | | |
| 14,840 | |
| California Resources Corp., 8.250%, 06/15/2029(e) | |
| 23,000 | | |
| 23,494 | |
| Calumet Specialty Products Partners LP / Calumet Finance Corp.: | |
| | | |
| | |
| 8.130%, 01/15/2027(e) | |
| 12,000 | | |
| 11,326 | |
| 9.750%, 07/15/2028(e) | |
| 33,000 | | |
| 31,283 | |
| CNX Resources Corp.: | |
| | | |
| | |
| 6.000%, 01/15/2029(e) | |
| 52,000 | | |
| 50,927 | |
| 7.250%, 03/01/2032(e) | |
| 16,000 | | |
| 16,331 | |
| Comstock Resources, Inc.: | |
| | | |
| | |
| 6.750%, 03/01/2029(e) | |
| 70,000 | | |
| 67,892 | |
| 5.875%, 01/15/2030(e) | |
| 29,000 | | |
| 27,005 | |
| CVR Energy, Inc., 8.500%, 01/15/2029(e) | |
| 70,000 | | |
| 70,349 | |
| Delek Logistics Partners LP / Delek Logistics Finance Corp.: | |
| | | |
| | |
| 7.125%, 06/01/2028(e) | |
| 52,000 | | |
| 51,394 | |
| 8.630%, 03/15/2029(e) | |
| 18,000 | | |
| 18,538 | |
| DT Midstream, Inc., 4.125%, 06/15/2029(e) | |
| 23,000 | | |
| 21,267 | |
| Energean PLC, 6.500%, 04/30/2027(e) | |
| 10,000 | | |
| 9,864 | |
See
Notes to Financial Statements.
| Semi-Annual Report | June
30, 2024 |
29 |
| Blackstone Senior Floating Rate 2027 Term Fund |
Portfolio of Investments |
June
30, 2024 (Unaudited)
| | |
Principal
Amount | | |
Value | |
| Oil, Gas & Consumable Fuels (continued) | |
| | |
| |
| EnQuest PLC, 11.630%, 11/01/2027(e) | |
$ | 9,000 | | |
$ | 9,151 | |
| Karoon USA Finance, Inc., 10.500%, 05/14/2029(e) | |
| 7,000 | | |
| 7,044 | |
| Magnolia Oil & Gas Operating LLC / Magnolia Oil & Gas Finance Corp., 6.000%, 08/01/2026(e) | |
| 15,000 | | |
| 14,867 | |
| New Fortress Energy, Inc., 6.500%, 09/30/2026(e) | |
| 85,000 | | |
| 78,268 | |
| NGL Energy Operating LLC / NGL Energy Finance Corp.: | |
| | | |
| | |
| 8.130%, 02/15/2029(e) | |
| 18,000 | | |
| 18,354 | |
| 8.380%, 02/15/2032(e) | |
| 10,000 | | |
| 10,162 | |
| Northern Oil & Gas, Inc.: | |
| | | |
| | |
| 8.130%, 03/01/2028(e) | |
| 60,000 | | |
| 60,722 | |
| 8.750%, 06/15/2031(e) | |
| 11,000 | | |
| 11,556 | |
| Parkland Corp., 4.500%, 10/01/2029(e) | |
| 24,000 | | |
| 21,987 | |
| PBF Holding Co. LLC / PBF Finance Corp., 7.875%, 09/15/2030(e) | |
| 28,000 | | |
| 28,688 | |
| Sunoco LP / Sunoco Finance Corp., 4.500%, 05/15/2029 | |
| 28,000 | | |
| 26,207 | |
| W&T Offshore, Inc., 11.750%, 02/01/2026(e) | |
| 15,000 | | |
| 15,442 | |
| | |
| | | |
| 716,958 | |
| | |
| | | |
| | |
| Paper & Forest Products - 0.02% | |
| | | |
| | |
| Mativ Holdings, Inc., 6.875%, 10/01/2026(e) | |
| 20,000 | | |
| 19,894 | |
| Mercer International, Inc., 5.125%, 02/01/2029 | |
| 22,000 | | |
| 19,384 | |
| | |
| | | |
| 39,278 | |
| | |
| | | |
| | |
| Passenger Airlines - 0.01% | |
| | | |
| | |
| American Airlines, Inc., 7.250%, 02/15/2028(e) | |
| 10,000 | | |
| 10,017 | |
| | |
| | | |
| | |
| | |
| | | |
| | |
| Personal Care Products - 0.03% | |
| | | |
| | |
| Edgewell Personal Care Co., 5.500%, 06/01/2028(e) | |
| 50,000 | | |
| 48,825 | |
| Herbalife Nutrition, Ltd. / HLF Financing, Inc., 7.875%, 09/01/2025(e) | |
| 10,000 | | |
| 9,832 | |
| HLF Financing Sarl LLC / Herbalife International, Inc., 4.875%, 06/01/2029(e) | |
| 5,000 | | |
| 3,469 | |
| | |
| | | |
| 62,126 | |
| | |
| | | |
| | |
| Pharmaceuticals - 0.02% | |
| | | |
| | |
| Organon & Co. / Organon Foreign Debt Co-Issuer BV: | |
| | | |
| | |
| 6.750%, 05/15/2034(e) | |
| 18,000 | | |
| 17,998 | |
| 7.875%, 05/15/2034(e) | |
| 11,000 | | |
| 11,316 | |
| | |
| | | |
| 29,314 | |
| | |
| | | |
| | |
| Real Estate Management & Development - 0.05% | |
| | | |
| | |
| Howard Hughes Corp., 4.380%, 02/01/2031(e) | |
| 40,000 | | |
| 34,479 | |
| Landsea Homes Corp., 8.880%, 04/01/2029(e) | |
| 11,000 | | |
| 10,904 | |
| Newmark Group, Inc., 7.500%, 01/12/2029(e) | |
| 42,000 | | |
| 43,211 | |
| | |
| | | |
| 88,594 | |
| | |
| | | |
| | |
| Semiconductors & Semiconductor Equipment - 0.01% | |
| | | |
| | |
| ams-OSRAM AG, 12.250%, 03/30/2029(e) | |
| 25,000 | | |
| 25,917 | |
| | |
| | | |
| | |
| Software - 0.07% | |
| | | |
| | |
| Fair Isaac Corp., 4.000%, 06/15/2028(e) | |
| 110,000 | | |
| 102,989 | |
| MicroStrategy, Inc., 6.125%, 06/15/2028(e) | |
| 34,000 | | |
| 32,989 | |
| | |
| | | |
| 135,978 | |
| | |
| | | |
| | |
| Specialized REITs - 0.03% | |
| | | |
| | |
| Uniti Group LP / Uniti Fiber Holdings, Inc. / CSL Capital LLC, 6.000%, 01/15/2030(e) | |
| 20,000 | | |
| 12,125 | |
See
Notes to Financial Statements.
| 30 |
www.blackstone-credit.com |
| Blackstone Senior Floating Rate 2027 Term Fund |
Portfolio of Investments |
June
30, 2024 (Unaudited)
| | |
Principal
Amount | | |
Value | |
| Specialized REITs (continued) | |
| | |
| |
| Uniti Group LP / Uniti Group Finance, Inc. / CSL Capital LLC, 6.500%, 02/15/2029(e) | |
$ | 58,000 | | |
$ | 37,048 | |
| | |
| | | |
| 49,173 | |
| | |
| | | |
| | |
| Specialty Retail - 0.10% | |
| | | |
| | |
| Asbury Automotive Group, Inc., 5.000%, 02/15/2032(e) | |
| 20,000 | | |
| 18,133 | |
| Bath & Body Works, Inc., 6.950%, 03/01/2033 | |
| 20,000 | | |
| 19,489 | |
| Foot Locker, Inc., 4.000%, 10/01/2029(e) | |
| 32,000 | | |
| 26,696 | |
| Gap, Inc.: | |
| | | |
| | |
| 3.625%, 10/01/2029(e) | |
| 37,000 | | |
| 32,065 | |
| 3.875%, 10/01/2031(e) | |
| 45,000 | | |
| 37,612 | |
| Sonic Automotive, Inc., 4.880%, 11/15/2031(e) | |
| 20,000 | | |
| 17,624 | |
| Upbound Group, Inc., 6.375%, 02/15/2029(e) | |
| 6,000 | | |
| 5,761 | |
| Victoria's Secret & Co., 4.625%, 07/15/2029(e) | |
| 44,000 | | |
| 36,619 | |
| | |
| | | |
| 193,999 | |
| | |
| | | |
| | |
| Technology Hardware, Storage & Peripherals - 0.05% | |
| | | |
| | |
| Xerox Holdings Corp., 5.500%, 08/15/2028(e) | |
| 104,000 | | |
| 89,676 | |
| | |
| | | |
| | |
| Textiles, Apparel & Luxury Goods - 0.03% | |
| | | |
| | |
| Crocs, Inc., 4.250%, 03/15/2029(e) | |
| 25,000 | | |
| 22,813 | |
| Wolverine World Wide, Inc., 4.000%, 08/15/2029(e) | |
| 40,000 | | |
| 33,520 | |
| | |
| | | |
| 56,333 | |
| | |
| | | |
| | |
| Tobacco - 0.03% | |
| | | |
| | |
| Vector Group, Ltd., 5.750%, 02/01/2029(e) | |
| 60,000 | | |
| 56,282 | |
| | |
| | | |
| | |
| TOTAL CORPORATE BONDS | |
| | | |
| | |
| (Cost $6,060,127) | |
| | | |
| 6,164,687 | |
| | |
Shares | | |
Value | |
| COMMON STOCK - 0.19% | |
| | | |
| | |
| Health Care Equipment & Supplies - 0.04% | |
| | | |
| | |
| Carestream Health Holdings Inc(b)(f) | |
| 55,510 | | |
| 90,204 | |
| | |
| | | |
| | |
| Health Care Providers & Services - 0.15% | |
| | | |
| | |
| Envision Healthcare Corp. Equity(f) | |
| 29,091 | | |
| 288,485 | |
| | |
| | | |
| | |
| TOTAL COMMON STOCK | |
| | | |
| | |
| (Cost $2,026,807) | |
| | | |
| 378,689 | |
| | |
| | | |
| | |
| SHORT-TERM INVESTMENTS - 3.31% | |
| | | |
| | |
| Open-end Investment Companies - 3.31% | |
| | | |
| | |
| Bank of New York Cash Reserve | |
| | | |
| | |
| (1.69% 7-Day Yield) | |
| 6,369,627 | | |
| 6,369,627 | |
| | |
| | | |
| | |
| TOTAL SHORT-TERM INVESTMENTS | |
| | | |
| | |
| (Cost $6,369,627) | |
| | | |
| 6,369,627 | |
See
Notes to Financial Statements.
| Semi-Annual Report | June
30, 2024 |
31 |
| Blackstone Senior Floating Rate 2027 Term Fund |
Portfolio of Investments |
June
30, 2024 (Unaudited)
| Total Investments- 154.32% | |
| |
| (Cost $302,383,241) | |
$ | 297,190,326 | |
| | |
| | |
| Liabilities in Excess of Other Assets - (7.28)% | |
| (14,010,422 | ) |
| | |
| | |
| Leverage Facility - (47.05)% | |
| (90,600,000 | ) |
| |
| | |
| Net Assets - 100.00% | |
$ | 192,579,904 | |
Amounts
above are shown as a percentage of net assets as of June 30, 2024.
Investment
Abbreviations:
LIBOR
- London Interbank Offered Rate
SOFR
- Secured Overnight Financing Rate
Reference
Rates:
1M
US L - 1 Month LIBOR as of June 30, 2024 was 5.45%
3M
US L - 3 Month LIBOR as of June 30, 2024 was 5.59%
6M
US L - 6 Month LIBOR as of June 30, 2024 was 5.68%
1M
US SOFR- 1 Month SOFR as of June 30, 2024 was 5.34%
3M
US SOFR - 3 Month SOFR as of June 30, 2024 was 5.32%
6M
US SOFR - 6 Month SOFR as of June 30, 2024 was 5.25%
1M
CME TERM SOFR - 1 Month CME TERM SOFR as of June 30, 2024 was 5.34%
3M CME TERM SOFR - 3 Month CME TERM SOFR as of June 30, 2024
was 5.32%
6M CME TERM SOFR - 6 Month CME TERM SOFR as of June 30, 2024 was 5.25%
PRIME - US Prime Rate as of June 30, 2024 was
8.50%
| (a) | Floating
or variable rate security. The reference rate is described above. The rate in effect
as of June 30, 2024 is based on the reference rate plus the displayed spread as of the
security's last reset date. Where applicable, the reference rate is subject to a floor
rate. |
| (b) | Level
3 assets valued using significant unobservable inputs as a result of unavailable quoted
prices from an active market or the unavailability of other significant observable inputs. |
| (c) | A
portion of this position was not funded as of June 30, 2024. The Portfolio of Investments
records only the funded portion of each position. As of June 30, 2024, the Fund has unfunded
delayed draw loans in the amount of $424,300. Fair value of these unfunded delayed draws
was $426,493. Additional information is provided in Note 9 General Commitments and Contingencies. |
| (d) | Represents
a payment-in-kind (“PIK”) security which may pay interest/dividend in additional
par/shares. |
| (e) | Security
exempt from registration under Rule 144A of the Securities Act of 1933. Total market
value of Rule 144A securities amounts to $20,302,986, which represented approximately
10.54% of net assets as of June 30, 2024. Such securities may normally be sold to qualified
institutional buyers in transactions exempt from registration. |
| (f) | Non-income
producing security. |
See
Notes to Financial Statements.
| 32 |
www.blackstone-credit.com |
| Blackstone
Long-Short Credit Income Fund |
Portfolio
of Investments |
June
30, 2024 (Unaudited)
| | |
Principal
Amount | | |
Value | |
| FLOATING RATE LOAN INTERESTS(a) - 130.25% | |
| | | |
| | |
| Aerospace & Defense - 4.55% | |
| | | |
| | |
| Atlas CC Acquisition Corp., First Lien B Term Loan, 3M CME TERM SOFR + 4.25%, 0.75% Floor, 05/25/2028 | |
$ | 1,295,166 | | |
$ | 960,761 | |
| Atlas CC Acquisition Corp., First Lien C Term Loan, 3M CME TERM SOFR + 4.25%, 0.75% Floor, 05/25/2028 | |
| 262,746 | | |
| 194,907 | |
| Dynasty Acquisition Co Inc., First Lien Term Loan, 1M US SOFR + 3.50%, 08/24/2028 | |
| 525,615 | | |
| 528,122 | |
| Nordam Group LLC, First Lien Initial Term Loan, 1M US SOFR + 5.50%, 04/09/2026 | |
| 1,364,400 | | |
| 1,316,646 | |
| Novaria Holdings, LLC, First Lien Term Loan, 1M US SOFR + 4.25%, 06/05/2031(b) | |
| 480,556 | | |
| 484,160 | |
| Peraton Corp., First Lien B Term Loan, 1M US SOFR + 3.75%, 0.75% Floor, 02/01/2028 | |
| 1,983,310 | | |
| 1,985,938 | |
| Standard Aero, Ltd., First Lien Term Loan, 1M US SOFR + 3.50%, 08/24/2028 | |
| 202,664 | | |
| 203,631 | |
| TransDigm, Inc., First Lien Term Loan, 3M CME TERM SOFR + 3.25%, 02/28/2031 | |
| 848,761 | | |
| 851,519 | |
| Vertex Aerospace Corp., First Lien Term Loan, 1M US SOFR + 2.75%, 12/06/2030 | |
| 784,022 | | |
| 785,911 | |
| World Wide Technology Holding Co LLC, First Lien Term Loan, 3M CME TERM SOFR + 3.50%, 0.50% Floor, 04/21/2031 | |
| 380,788 | | |
| 383,168 | |
| | |
| | | |
| 7,694,763 | |
| | |
| | | |
| | |
| Air Freight & Logistics - 2.29% | |
| | | |
| | |
| ASP LS Acquisition Corp., First Lien Term Loan, 3M CME TERM SOFR + 4.50%, 0.75% Floor, 05/07/2028 | |
| 422,763 | | |
| 361,405 | |
| Clue Opco LLC, First Lien Term Loan, 3M CME TERM SOFR + 4.50%, 12/19/2030 | |
| 1,049,644 | | |
| 981,549 | |
| Rinchem Company, Inc., First Lien Term Loan, 3M CME TERM SOFR + 4.25%, 03/02/2029 | |
| 1,190,523 | | |
| 1,031,374 | |
| Savage Enterprises LLC, First Lien Term Loan, 3M US L + 3.25%, 0.50% Floor, 09/15/2028 | |
| 512,776 | | |
| 514,581 | |
| WWEX UNI TopCo Holdings LLC, First Lien Initial Term Loan, 3M CME TERM SOFR + 4.00%, 0.75% Floor, 07/26/2028 | |
| 972,425 | | |
| 976,460 | |
| | |
| | | |
| 3,865,369 | |
| | |
| | | |
| | |
| Automobile Components - 2.62% | |
| | | |
| | |
| Belron Finance US LLC, First Lien Term Loan, 3M CME TERM SOFR + 2.25%, 0.50% Floor, 04/18/2029 | |
| 320,439 | | |
| 321,573 | |
| Clarios Glob LP, First Lien Term Loan, 6M CME TERM SOFR + 2.75%, 06/05/2030 | |
| 496,074 | | |
| 497,857 | |
| First Brands Group LLC, First Lien Term Loan, 3M CME TERM SOFR + 5.00%, 1.00% Floor, 03/30/2027 | |
| 936,175 | | |
| 932,080 | |
| First Brands Group, LLC, First Lien 2018 New Tranche E Term Loan, 3M CME TERM SOFR + 5.00%, 03/30/2027 | |
| 781,035 | | |
| 777,254 | |
| LTI Holdings, Inc., First Lien Initial Term Loan, 1M CME TERM SOFR + 3.50%, 09/06/2025 | |
| 1,184,821 | | |
| 1,169,916 | |
| LTI Holdings, Inc., First Lien Term Loan, 1M US SOFR + 4.75%, 07/24/2026 | |
| 360,418 | | |
| 357,243 | |
| LTI Holdings, Inc., Second Lien Initial Term Loan, 1M US SOFR + 6.75%, 09/06/2026 | |
| 382,979 | | |
| 363,351 | |
| | |
| | | |
| 4,419,274 | |
| Beverages - 0.38% | |
| | | |
| | |
| Triton Water Holdings, Inc., First
Lien Initial Term Loan, 3M CME TERM SOFR + 3.25%, 0.50% Floor, 03/31/2028 | |
| 633,336 | | |
| 634,286 | |
| | |
| | | |
| | |
| Biotechnology - 0.61% | |
| | | |
| | |
| Grifols Worldwide Operations, First Lien Term Loan, 1M US SOFR + 2.00%, 11/15/2027 | |
| 1,042,898 | | |
| 1,027,254 | |
| | |
| | | |
| | |
| Broadline Retail - 0.20% | |
| | | |
| | |
| Peer Hldg III BV, First Lien Term Loan, 6M CME TERM SOFR + 3.00%, 06/23/2031 | |
| 334,266 | | |
| 335,033 | |
| | |
| | | |
| | |
| Building Products - 3.72% | |
| | | |
| | |
| Gulfside Supply Inc, First Lien Term Loan, 6M CME TERM SOFR + 3.50%, 05/29/2031(b) | |
| 231,284 | | |
| 231,717 | |
| LBM Acquisition LLC, First Lien Term Loan, 1M US SOFR + 3.75%, 05/30/2031 | |
| 1,259,443 | | |
| 1,240,111 | |
| LHS Borrower, LLC, First Lien Term Loan, 1M US SOFR + 4.75%, 0.50% Floor, 02/16/2029 | |
| 727,489 | | |
| 690,387 | |
| Miter Brands Acquisition Holdco Inc., First Lien Term Loan, 1M US SOFR + 3.50%, 03/28/2031 | |
| 828,659 | | |
| 834,704 | |
See Notes to Financial Statements.
| Semi-Annual Report
| June 30, 2024 |
33 |
| Blackstone
Long-Short Credit Income Fund |
Portfolio
of Investments |
June
30, 2024 (Unaudited)
| | |
Principal
Amount | | |
Value | |
| Building Products (continued) | |
| | | |
| | |
| Oscar Acquisitionco LLC, First Lien Term Loan, 3M CME TERM SOFR + 4.25%, 0.50% Floor, 04/29/2029 | |
$ | 1,128,030 | | |
$ | 1,128,825 | |
| Resideo Funding Inc, First Lien Term Loan, 6M CME TERM SOFR + 2.25%, 06/13/2031 | |
| 133,155 | | |
| 133,155 | |
| Tailwind Smith Cooper Intermediate Corp., First Lien Initial Term Loan, 3M CME TERM SOFR + 5.00%, 05/28/2026 | |
| 1,341,912 | | |
| 1,342,751 | |
| Trulite Holding Corp., First Lien Term Loan, 1M US SOFR + 6.00%, 03/01/2030 | |
| 700,201 | | |
| 680,946 | |
| | |
| | | |
| 6,282,596 | |
| | |
| | | |
| | |
| Capital Markets - 5.50% | |
| | | |
| | |
| Apex Group Treasury, Ltd., First Lien USD Term Loan, 3M CME TERM SOFR + 3.75%, 0.50% Floor, 07/27/2028 | |
| 1,200,323 | | |
| 1,203,324 | |
| AssetMark 6/24 TLB 1L, First Lien Term Loan, 6M CME TERM SOFR + 3.25%, 06/03/2031 | |
| 534,746 | | |
| 535,749 | |
| Cetera Financial 5/24 TLB 1L, First Lien Term Loan, 3M CME TERM SOFR + 9.34%, 08/09/2030 | |
| 1,265,886 | | |
| 1,272,348 | |
| Citadel Securities LP, First Lien Term Loan, 1M US SOFR + 2.25%, 07/29/2030 | |
| 370,596 | | |
| 372,078 | |
| CITCO FDG LLC, First Lien Term Loan, 3M CME TERM SOFR + 2.75%, 04/27/2028 | |
| 1,698,400 | | |
| 1,706,187 | |
| CPI Holdco B LLC, First Lien Term Loan, 1M US SOFR + 2.00%, 05/17/2031 | |
| 445,330 | | |
| 445,401 | |
| Edelman Financial Engines Center LLC, First Lien Term Loan, 1M US SOFR + 3.25%, 04/07/2028 | |
| 54,064 | | |
| 54,204 | |
| Focus Financial Partners LLC, First Lien Term Loan, 1M US SOFR + 2.50%, 0.50% Floor, 06/30/2028 | |
| 1,425,301 | | |
| 1,425,636 | |
| Focus Financial Partners, LLC, First Lien Term Loan, 1M US SOFR + 2.75%, 06/30/2028 | |
| 474,583 | | |
| 474,652 | |
| Kestra Advisor Services Holdings A INC, First Lien Term Loan, 1M US SOFR + 4.00%, 03/22/2031 | |
| 521,346 | | |
| 523,888 | |
| Osaic Holdings Inc aka Advisor Group, First Lien Term Loan, 1M US SOFR + 4.00%, 08/17/2028 | |
| 1,261,763 | | |
| 1,267,207 | |
| | |
| | | |
| 9,280,674 | |
| | |
| | | |
| | |
| Chemicals - 1.12% | |
| | | |
| | |
| CI Maroon Holdings LLC, First Lien Term Loan, 3M CME TERM SOFR + 4.00%, 03/01/2031 | |
| 315,000 | | |
| 316,969 | |
| Ecovyst Catalyst Technologies LLC, First Lien Term Loan, 6M CME TERM SOFR + 2.25%, 06/12/2031 | |
| 1,233,490 | | |
| 1,234,698 | |
| Geon Performance Solutions LLC, First Lien Term Loan, 3M CME TERM SOFR + 4.25%, 0.75% Floor, 08/18/2028 | |
| 341,852 | | |
| 343,777 | |
| | |
| | | |
| 1,895,444 | |
| | |
| | | |
| | |
| Commercial Services & Supplies - 6.83% | |
| | | |
| | |
| Action Environmental Group, Inc., First Lien Term Loan: | |
| | | |
| | |
| 3M CME TERM SOFR + 4.00%, 0.50% Floor, 10/24/2030(b) | |
| 1,191,805 | | |
| 1,200,743 | |
| 6M CME TERM SOFR + 4.00%, 0.50% Floor, 10/24/2030(b) | |
| 82,950 | | |
| 83,572 | |
| 6M CME TERM SOFR + 4.00%, 0.50% Floor, 10/24/2030(b) | |
| 110,600 | | |
| 111,430 | |
| Allied Universal Holdco LLC, First Lien Initial U.S. Dollar Term Loan, 1M US SOFR + 3.75%, 0.50% Floor, 05/12/2028 | |
| 1,903,776 | | |
| 1,898,607 | |
| Aramark Intermediate HoldCo Corp., First Lien U.S. B-4 Term Loan, 1M US SOFR + 1.75%, 01/15/2027 | |
| 750,000 | | |
| 750,844 | |
| Belfor Holdings, Inc., First Lien Term Loan, 1M US SOFR + 3.75%, 0.50% Floor, 11/01/2030 | |
| 236,369 | | |
| 238,141 | |
| Equiniti Group PLC, First Lien Term Loan, 6M CME TERM SOFR + 4.50%, 12/11/2028 | |
| 297,143 | | |
| 298,814 | |
| Garda World Security Corp., First Lien Term Loan, 3M CME TERM SOFR + 4.25%, 02/01/2029 | |
| 1,619,188 | | |
| 1,631,332 | |
| GFL Environmental, Inc., First Lien Term Loan, 6M US L + 0.00%, 0.50% Floor, 06/27/2031(b) | |
| 145,000 | | |
| 145,362 | |
| Justrite Safety Group, First Lien Delayed Draw Term Loan, 1M US SOFR + 4.50%, 06/28/2026 | |
| 64,238 | | |
| 64,279 | |
| Justrite Safety Group, First Lien Initial Term Loan, 1M US SOFR + 4.50%, 06/28/2026 | |
| 1,188,202 | | |
| 1,188,950 | |
| Omnia Partners, LLC, First Lien Term Loan, L + 3.75%, 07/25/2030 | |
| 1,122,186 | | |
| 1,124,111 | |
| Prime Sec Services Borrower LLC, TL, First Lien Term Loan, 3M CME TERM SOFR + 2.25%, 10/13/2030 | |
| 1,074,615 | | |
| 1,075,367 | |
See Notes to Financial Statements.
| 34 | www.blackstone-credit.com |
| Blackstone
Long-Short Credit Income Fund |
Portfolio
of Investments |
June
30, 2024 (Unaudited)
| | |
Principal
Amount | | |
Value | |
| Commercial Services & Supplies (continued) | |
| | | |
| | |
| Strategic Materials Holding Corp., Second Lien Initial Term Loan, 3M CME TERM SOFR + 7.75%, 1.00% Floor, 10/31/2025(b) | |
$ | 533,333 | | |
$ | 10,667 | |
| TMF Sapphire Bidco B.V., TL, First Lien Term Loan, 3M CME TERM SOFR + 4.00%, 05/03/2028 | |
| 645 | | |
| 648 | |
| TMF Sapphire US LLC aka TMF Group TLB 1L, First Lien Term Loan 05/03/2028 | |
| 256,891 | | |
$ | 257,895 | |
| TRC Companies, First Lien Term Loan, 1M US SOFR + 3.75%, 12/08/2028 | |
| 491,742 | | |
| 493,402 | |
| United Site Cov-Lite, First Lien Term Loan, 3M CME TERM SOFR + 4.25%, 12/15/2028 | |
| 943,279 | | |
| 631,474 | |
| Vestis Corp, First Lien Term Loan, 3M CME TERM SOFR + 2.25%, 02/22/2031 | |
| 320,122 | | |
| 318,989 | |
| | |
| | | |
| 11,524,627 | |
| | |
| | | |
| | |
| Communications Equipment - 0.05% | |
| | | |
| | |
| MLN US HoldCo LLC, First Lien B Term Loan, 3M CME TERM SOFR + 4.50%, 11/30/2025 | |
| 699,130 | | |
| 78,652 | |
| | |
| | | |
| | |
| Construction & Engineering - 2.39% | |
| | | |
| | |
| Aegion Corporation, First Lien Term Loan, 3M CME TERM SOFR + 4.25%, 05/17/2028 | |
| 3,476 | | |
| 3,494 | |
| Amentum Government Services Holdings LLC, First Lien Term Loan, 1M US SOFR + 4.00%, 02/15/2029 | |
| 1,289,455 | | |
| 1,296,708 | |
| Artera Services LLC aka PowerTeam, First Lien Term Loan, 3M CME TERM SOFR + 4.50%, 02/15/2031 | |
| 262,919 | | |
| 264,632 | |
| Azuria Water Solutions Inc aka Aegion TLB 1L, First Lien Term Loan 05/17/2028 | |
| 1,386,772 | | |
| 1,394,080 | |
| Groundworks LLC, First Lien Term Loan: | |
| | | |
| | |
| 1M US SOFR + 3.50%, 03/14/2031 | |
| 676,848 | | |
| 677,272 | |
| 6M CME TERM SOFR + 4.00%, 03/14/2031(c) | |
| 19,932 | | |
| 19,944 | |
| Touchdown Acquirer Inc aka TenCate, First Lien Term Loan, 3M CME TERM SOFR + 4.00%, 02/21/2031 | |
| 345,901 | | |
| 347,956 | |
| Tutor Perini Corp., First Lien B Term Loan, 1M US SOFR + 4.75%, 1.00% Floor, 08/18/2027 | |
| 34,918 | | |
| 35,042 | |
| | |
| | | |
| 4,039,128 | |
| | |
| | | |
| | |
| Construction Materials - 1.59% | |
| | | |
| | |
| Quikrete Holdings, Inc., First Lien Term Loan, 1M US SOFR + 2.50%, 04/14/2031 | |
| 989,154 | | |
| 992,502 | |
| Summit Materials LLC, First Lien Term Loan, 3M CME TERM SOFR + 2.50%, 01/12/2029 | |
| 175,277 | | |
| 176,701 | |
| Tamko Building Products LLC, First Lien Term Loan, 1M US SOFR + 3.25%, 09/20/2030 | |
| 1,502,982 | | |
| 1,504,861 | |
| | |
| | | |
| 2,674,064 | |
| | |
| | | |
| | |
| Containers & Packaging - 2.99% | |
| | | |
| | |
| Altium Packaging LLC, First Lien Term Loan, 1M US SOFR + 2.50%, 06/11/2031 | |
| 116,518 | | |
| 116,518 | |
| Anchor Packaging LLC, First Lien Term Loan, 1M US SOFR + 3.75%, 07/18/2029 | |
| 363,000 | | |
| 363,713 | |
| Berlin Packaging LLC, First Lien Term Loan, 6M CME TERM SOFR + 4.00%, 06/07/2031 | |
| 505,375 | | |
| 507,098 | |
| ProAmpac PG Borrower LLC, First Lien Term Loan, 3M CME TERM SOFR + 4.00%, 0.75% Floor, 09/15/2028 | |
| 820,740 | | |
| 823,715 | |
| Supplyone 3/24, First Lien Term Loan, 6M CME TERM SOFR + 4.50%, 04/19/2031 | |
| 679,367 | | |
| 681,279 | |
| Tricorbraun Holdings, Inc., First Lien Closing Date Initial Term Loan, 1M CME TERM SOFR + 3.25%, 0.50% Floor, 03/03/2028 | |
| 1,187,755 | | |
| 1,187,387 | |
| Trident TPI Holdings, Inc., First Lien Term Loan, 3M CME TERM SOFR + 9.33%, 0.50% Floor, 09/15/2028 | |
| 1,366,145 | | |
| 1,369,847 | |
| | |
| | | |
| 5,049,557 | |
| | |
| | | |
| | |
| Distributors - 1.55% | |
| | | |
| | |
| Burgess Point Purchaser Corp., First Lien Term Loan, 1M US SOFR + 5.25%, 07/25/2029 | |
| 1,277,742 | | |
| 1,241,805 | |
| Johnstone Supply LLC, First Lien Term Loan, 3M CME TERM SOFR + 3.00%, 05/16/2031 | |
| 480,247 | | |
| 481,448 | |
| S&S Holdings LLC, First Lien Initial Term Loan, 1M US SOFR + 5.00%, 0.50% Floor, 03/11/2028 | |
| 889,571 | | |
| 891,795 | |
| | |
| | | |
| 2,615,048 | |
See Notes to Financial Statements.
| Semi-Annual Report | June 30, 2024 |
35 |
| Blackstone
Long-Short Credit Income Fund |
Portfolio
of Investments |
June
30, 2024 (Unaudited)
| | |
Principal
Amount | | |
Value | |
| Diversified Consumer Services - 3.22% | |
| | | |
| | |
| Cengage Learning, Inc., First Lien Term Loan, 6M CME TERM SOFR + 4.25%, 1.00% Floor, 03/24/2031 | |
$ | 687,173 | | |
$ | 689,966 | |
| Fugue Finance LLC aka Nord Anglia, First Lien Term Loan, 3M CME TERM SOFR + 3.75%, 02/26/2031 | |
| 290,325 | | |
| 293,119 | |
| Imagine Learning LLC, First Lien Term Loan, 1M US SOFR + 3.50%, 12/21/2029 | |
| 977,550 | | |
| 978,616 | |
| Loyalty Ventures, Inc., First Lien Term Loan, 3M Prime + 3.50%, 11/03/2027(b) | |
| 409,425 | | |
| 4,094 | |
| McKissock Investment Holdings, LLC, First Lien Term Loan, 3M CME TERM SOFR + 5.00%, 03/12/2029 | |
| 135,176 | | |
| 135,866 | |
| Mister Car Wash 3/24, First Lien Term Loan, 1M US SOFR + 3.00%, 03/27/2031 | |
| 326,984 | | |
| 328,356 | |
| Spring Education Group, Inc., First Lien Term Loan, 3M CME TERM SOFR + 4.00%, 10/04/2030 | |
| 757,130 | | |
| 761,783 | |
| St. George's University Scholastic Services LLC, First Lien Term Loan B Term Loan, 1M US SOFR + 2.75%, 0.50% Floor, 02/10/2029 | |
| 1,121,880 | | |
| 1,122,581 | |
| TruGreen LP, First Lien Term Loan, 1M US SOFR + 4.00%, 0.75% Floor, 11/02/2027 | |
| 394,678 | | |
| 381,258 | |
| Wand NewCo 3 Inc aka Caliber Collision, First Lien Term Loan, 1M US SOFR + 3.75%, 01/30/2031 | |
| 727,065 | | |
| 732,711 | |
| | |
| | | |
| 5,428,350 | |
| | |
| | | |
| | |
| Diversified REITs - 0.37% | |
| | | |
| | |
| Iron Mountain Information Management LLC, First Lien Term Loan, 3M CME TERM SOFR + 2.25%, 01/31/2031 | |
| 400,619 | | |
| 399,449 | |
| Opry Entertainment/OEG, First Lien Term Loan, 6M CME TERM SOFR + 3.75%, 06/25/2031(b) | |
| 229,356 | | |
| 229,929 | |
| | |
| | | |
| 629,378 | |
| | |
| | | |
| | |
| Diversified Telecommunication Services - 3.59% | |
| | | |
| | |
| Coral-US Co-Borrower LLC, First Lien B-5 Term Loan, 1M US SOFR + 2.25%, 01/31/2028 | |
| 704,605 | | |
| 682,255 | |
| Level 3 Financing Inc., First Lien Term Loan: | |
| | | |
| | |
| 1M US SOFR + 6.56%, 04/15/2029 | |
| 172,908 | | |
| 169,694 | |
| 1M US SOFR + 6.56%, 04/15/2030 | |
| 174,177 | | |
| 169,996 | |
| Lorca Finco PLC, First Lien Term Loan, 6M CME TERM SOFR + 3.50%, 04/17/2031 | |
| 290,000 | | |
| 291,088 | |
| Lumen Technologies, Inc., First Lien Term Loan, 1M US SOFR + 6.00%, 06/01/2028 | |
| 17,062 | | |
| 14,218 | |
| Radiate Holdco, LLC,, First Lien Term Loan, 1M US SOFR + 3.25%, 09/25/2026 | |
| 1,178,841 | | |
| 958,056 | |
| Telenet Financing USD LLC, First Lien Term Loan, 1M US SOFR + 2.00%, 04/30/2028 | |
| 980,607 | | |
| 935,460 | |
| UPC Financing Partnership, First Lien Facility AT Term Loan, 1M US SOFR + 2.25%, 04/30/2028 | |
| 1,335,308 | | |
| 1,313,964 | |
| Virgin Media Bristol LLC, First Lien Term Loan, 1M CME TERM SOFR + 2.50%, 01/31/2028 | |
| 493,300 | | |
| 472,586 | |
| Zacapa S.A.R.L., First Lien Term Loan, 3M CME TERM SOFR + 4.00%, 03/22/2029 | |
| 1,040,647 | | |
| 1,041,136 | |
| | |
| | | |
| 6,048,453 | |
| | |
| | | |
| | |
| Electric Utilities - 1.47% | |
| | | |
| | |
| Generation Bridge Northeast LLC, First Lien Term Loan, 1M US SOFR + 3.50%, 08/22/2029 | |
| 521,335 | | |
| 525,245 | |
| NRG Energy 3/24 Cov-Lite, First Lien Term Loan, 1M US SOFR + 2.00%, 04/16/2031 | |
| 714,000 | | |
| 714,982 | |
| Vistra Operations Co. LLC, First Lien 2018 Incremental Term Loan, 1M US SOFR + 2.00%, 12/20/2030 | |
| 1,229,118 | | |
| 1,231,490 | |
| | |
| | | |
| 2,471,717 | |
| | |
| | | |
| | |
| Electrical Equipment - 0.59% | |
| | | |
| | |
| Generac Power 6/24 TL, First Lien Term Loan 02/12/2031(b) | |
| 1,000,000 | | |
| 1,002,500 | |
| | |
| | | |
| | |
| Electronic Equipment, Instruments & Components - 1.92% | |
| | | |
| | |
| Celestica 5/24 TLB 1L, First Lien Term Loan, 1M US SOFR + 1.75%, 05/23/2031 | |
| 175,338 | | |
| 175,338 | |
| Coherent Corp., First Lien Term Loan, 1M US SOFR + 2.50%, 0.50% Floor, 07/02/2029 | |
| 1,023,173 | | |
| 1,025,219 | |
| DG Investment Intermediate Holdings 2, Inc., Second Lien Initial Term Loan, 1M US SOFR + 6.75%, 0.75% Floor, 03/30/2029 | |
| 581,429 | | |
| 571,527 | |
| Discovery Energy Corp., First Lien Term Loan, 3M CME TERM SOFR + 4.75%, 05/01/2031 | |
| 669,667 | | |
| 673,330 | |
See Notes to Financial Statements.
| 36 | www.blackstone-credit.com |
| Blackstone
Long-Short Credit Income Fund |
Portfolio
of Investments |
June
30, 2024 (Unaudited)
| | |
Principal
Amount | | |
Value | |
| Electronic Equipment, Instruments & Components (continued) | |
| | | |
| | |
| Mirion Technologies US, Inc., First Lien Term Loan, 3M CME TERM SOFR + 2.25%, 0.50% Floor, 10/20/2028 | |
$ | 793,222 | | |
$ | 795,331 | |
| | |
| | | |
| 3,240,745 | |
| | |
| | | |
| | |
| Energy Equipment & Services - 0.34% | |
| | | |
| | |
| Ursa Minor US Bidco LLC aka Rosen, First Lien Term Loan, 3M CME TERM SOFR + 3.50%, 03/26/2031 | |
| 560,221 | | |
| 564,658 | |
| | |
| | | |
| | |
| Entertainment - 1.01% | |
| | | |
| | |
| CE Intermediate I LLC, First Lien Term Loan, 3M CME TERM SOFR + 3.50%, 0.50% Floor, 11/10/2028 | |
| 752,675 | | |
| 755,264 | |
| EP Purcasher, LLC, First Lien Term Loan, 3M CME TERM SOFR + 3.50%, 11/06/2028 | |
| 940,005 | | |
| 941,688 | |
| | |
| | | |
| 1,696,952 | |
| | |
| | | |
| | |
| Financial Services - 1.52% | |
| | | |
| | |
| Mitchell International, First Lien Term Loan, 6M CME TERM SOFR + 3.25%, 06/17/2031 | |
| 1,209,780 | | |
| 1,200,997 | |
| Planet US Buyer, LLC, First Lien Term Loan, 3M CME TERM SOFR + 3.50%, 02/07/2031 | |
| 540,595 | | |
| 544,717 | |
| Polaris Newco LLC, First Lien Dollar Term Loan, 3M CME TERM SOFR + 4.00%, 0.50% Floor, 06/02/2028 | |
| 821,051 | | |
| 821,704 | |
| | |
| | | |
| 2,567,418 | |
| | |
| | | |
| | |
| Food Products - 1.20% | |
| | | |
| | |
| CH Guenther 11/21, First Lien Term Loan, 3M CME TERM SOFR + 3.00%, 12/08/2028 | |
| 271,204 | | |
| 272,053 | |
| Froneri International, Ltd., First Lien Facility B2 Term Loan, 1M US SOFR + 2.25%, 01/29/2027 | |
| 980,927 | | |
| 981,486 | |
| Saratoga Food Specialties LLC, First Lien Term Loan, 3M CME TERM SOFR + 3.75%, 03/07/2029 | |
| 253,073 | | |
| 254,812 | |
| Snacking Investments BidCo Pty, Ltd., First Lien Initial US Term Loan, 3M CME TERM SOFR + 4.00%, 1.00% Floor, 12/18/2026 | |
| 516,834 | | |
| 518,126 | |
| | |
| | | |
| 2,026,477 | |
| | |
| | | |
| | |
| Ground Transportation - 1.05% | |
| | | |
| | |
| Genesee & WY Inc, First Lien Term Loan, 3M CME TERM SOFR + 2.00%, 04/10/2031 | |
| 1,765,113 | | |
| 1,765,281 | |
| | |
| | | |
| | |
| Health Care Equipment & Supplies - 1.47% | |
| | | |
| | |
| Resonetics LLC, First Lien Term Loan, 3M CME TERM SOFR + 9.08%, 06/06/2031 | |
| 862,757 | | |
| 865,453 | |
| Siemens/SivantosWS Audiology, First Lien Term Loan, 6M CME TERM SOFR + 4.25%, 02/28/2029 | |
| 1,600,818 | | |
| 1,606,821 | |
| | |
| | | |
| 2,472,274 | |
| | |
| | | |
| | |
| Health Care Providers & Services - 7.97% | |
| | | |
| | |
| DaVita, Inc., First Lien B Term Loan, 3M CME TERM SOFR + 1.75%, 08/12/2026 | |
| 601,558 | | |
| 602,060 | |
| Global Medical Response, Inc., First Lien Term Loan, 3M CME TERM SOFR + 5.50%, 1.00% Floor, 10/31/2028(d) | |
| 1,563,867 | | |
| 1,517,733 | |
| Heartland Dental LLC, First Lien Term Loan, 6M CME TERM SOFR + 4.50%, 0.75% Floor, 04/28/2028 | |
| 1,004,535 | | |
| 1,008,367 | |
| IVI America LLC aka IVIRMA, First Lien Term Loan, 6M CME TERM SOFR + 4.50%, 04/18/2031 | |
| 437,500 | | |
| 440,714 | |
| MED ParentCo, LP, First Lien Term Loan, 1M US SOFR + 4.00%, 04/15/2031 | |
| 455,086 | | |
| 455,473 | |
| Medical Solutions LLC, First Lien Term Loan, 1M US SOFR + 3.25%, 11/01/2028 | |
| 981,452 | | |
| 748,181 | |
| Midwest Physcn Admin Srvcs LLC, First Lien Term Loan, 3M CME TERM SOFR + 3.25%, 03/12/2028 | |
| 1,202,685 | | |
| 1,056,859 | |
| NAPA Management Services Corp., First Lien Term Loan, 1M US SOFR + 5.25%, 0.75% Floor, 02/23/2029 | |
| 1,002,798 | | |
| 962,165 | |
See Notes to Financial Statements.
| Semi-Annual Report
| June 30, 2024 |
37 |
| Blackstone
Long-Short Credit Income Fund |
Portfolio
of Investments |
June
30, 2024 (Unaudited)
| | |
Principal
Amount | | |
Value | |
| Health Care Providers & Services (continued) | |
| | | |
| | |
| Onex TSG Intermediate Corp., First Lien Initial Term Loan, 3M CME TERM SOFR + 4.75%, 0.75% Floor, 02/28/2028 | |
$ | 1,329,259 | | |
$ | 1,328,150 | |
| Outcomes Group Holdings, Inc., First Lien Term Loan, 3M US L + 4.25%, 05/06/2031 | |
| 764,477 | | |
| 767,882 | |
| Pathway Vet Alliance LLC, First Lien 2021 Replacement Term Loan, 1M US SOFR + 3.75%, 03/31/2027 | |
| 1,229,550 | | |
| 971,805 | |
| Pediatric Associates Holding Co. LLC, First Lien Term Loan, 1M US SOFR + 3.25%, 0.50% Floor, 12/29/2028 | |
| 1,015,172 | | |
| 983,656 | |
| Radiology Partners Inc, First Lien Term Loan, 6M CME TERM SOFR + 5.00%, 01/31/2029 | |
| 1,298,917 | | |
| 1,235,270 | |
| Surgery Center Holdings Inc, First Lien Term Loan, 1M US SOFR + 2.75%, 12/19/2030 | |
| 293,130 | | |
| 294,248 | |
| U.S. Anesthesia Partners, Inc., First Lien Term Loan, 3M CME TERM SOFR + 4.25%, 0.50% Floor, 10/01/2028 | |
| 1,107,037 | | |
| 1,064,754 | |
| | |
| | | |
| 13,437,317 | |
| | |
| | | |
| | |
| Health Care Technology - 2.59% | |
| | | |
| | |
| Cotiviti Inc., First Lien Term Loan, 6M US L + 0.00%, 05/01/2031 | |
| 1,753,130 | | |
| 1,746,923 | |
| Gainwell Acquisition Corp., First Lien Term Loan, 3M CME TERM SOFR + 4.00%, 0.75% Floor, 10/01/2027 | |
| 1,519,350 | | |
| 1,475,030 | |
| GHX Ultimate Parent Corp., First Lien Term Loan, 3M CME TERM SOFR + 4.00%, 0.50% Floor, 06/30/2027(b) | |
| 997,962 | | |
| 1,005,447 | |
| Waystar Technologies, Inc., First Lien Term Loan, 6M CME TERM SOFR + 3.00%, 10/22/2029 | |
| 144,838 | | |
| 145,200 | |
| | |
| | | |
| 4,372,600 | |
| | |
| | | |
| | |
| Hotels, Restaurants & Leisure - 6.16% | |
| | | |
| | |
| 1011778 BC UNLIMITED LIABILITY CO, First Lien Term Loan, 1M US SOFR + 1.75%, 09/20/2030 | |
| 1,430,017 | | |
| 1,428,208 | |
| Bally's Corp., First Lien Term Loan, 3M CME TERM SOFR + 3.25%, 0.50% Floor, 10/02/2028 | |
| 1,385,299 | | |
| 1,318,777 | |
| Caesars Entertainment, Inc., First Lien Term Loan: | |
| | | |
| | |
| 3M CME TERM SOFR + 2.75%, 0.50% Floor, 02/06/2030 | |
| 1,194,040 | | |
| 1,196,368 | |
| 3M CME TERM SOFR + 2.75%, 0.50% Floor, 02/06/2031 | |
| 350,746 | | |
| 351,458 | |
| Cedar Fair LP, First Lien Term Loan, 1M US SOFR + 2.00%, 05/01/2031 | |
| 297,386 | | |
| 297,247 | |
| Entain plc, First Lien Term Loan, 3M CME TERM SOFR + 2.75%, 10/31/2029 | |
| 1,142,049 | | |
| 1,145,309 | |
| Fertitta Entertainment, LLC, First Lien Term Loan, 1M US SOFR + 3.75%, 01/27/2029 | |
| 834,862 | | |
| 836,790 | |
| Flutter Financing B.V., First Lien Term Loan, 3M CME TERM SOFR + 2.25%, 11/25/2030 | |
| 1,555,398 | | |
| 1,558,159 | |
| Hilton Grand Vacations Borrower, LLC, First Lien Term Loan, 1M US SOFR + 2.75%, 01/17/2031 | |
| 699,914 | | |
| 700,789 | |
| IRB Holding Corporation, First Lien Term Loan, 1M US SOFR + 2.75%, 12/15/2027 | |
| 349,112 | | |
| 349,374 | |
| LC Ahab US Bidco LLC, First Lien Term Loan, 1M US SOFR + 3.50%, 05/01/2031 | |
| 274,413 | | |
| 275,272 | |
| OVG Business Services, LLC TLB 1L, First Lien Term Loan, 6M US L + 0.00%, 06/13/2031 | |
| 457,441 | | |
| 457,157 | |
| Tacala Investment Corp, First Lien Term Loan, 1M US SOFR + 4.00%, 01/31/2031 | |
| 481,392 | | |
| 484,052 | |
| | |
| | | |
| 10,398,960 | |
| | |
| | | |
| | |
| Household Durables - 0.81% | |
| | | |
| | |
| ACProducts Holdings, Inc., First Lien Term Loan, 3M US L + 4.25%, 0.50% Floor, 05/17/2028 | |
| 1,601,893 | | |
| 1,362,274 | |
| | |
| | | |
| | |
| Independent Power and Renewable Electricity Producers - 0.82% | |
| | | |
| | |
| Calpine Corp., First Lien Term Loan, 1M US SOFR + 2.00%, 01/31/2031 | |
| 1,381,912 | | |
| 1,379,176 | |
| | |
| | | |
| | |
| Insurance - 3.27% | |
| | | |
| | |
| AmWINS Group, Inc., First Lien Term Loan, 1M US SOFR + 2.25%, 0.75% Floor, 02/19/2028 | |
| 491,036 | | |
| 491,227 | |
| Baldwin Insurance Group Holdings LLC, First Lien Term Loan, 6M CME TERM SOFR + 3.50%, 05/26/2031(b) | |
| 1,045,425 | | |
| 1,046,732 | |
| BroadStreet Partners Inc, First Lien Term Loan, 6M CME TERM SOFR + 3.25%, 06/13/2031 | |
| 845,429 | | |
| 844,161 | |
| Hyperion Refinance Sarl, First Lien Term Loan: | |
| | | |
| | |
| 1M US SOFR + 4.00%, 0.50% Floor, 04/18/2030 | |
| 1,265,407 | | |
| 1,268,893 | |
| 1M US SOFR + 3.50%, 0.50% Floor, 02/15/2031 | |
| 427,890 | | |
| 429,351 | |
See Notes to Financial Statements.
| 38 | www.blackstone-credit.com |
| Blackstone
Long-Short Credit Income Fund |
Portfolio
of Investments |
June
30, 2024 (Unaudited)
| | |
Principal
Amount | | |
Value | |
| Insurance (continued) | |
| | | |
| | |
| Truist Insurance 3/24 2nd Lien Cov-Lite, Second Lien Term Loan, 3M CME TERM SOFR + 4.75%, 05/06/2032 | |
$ | 472,588 | | |
$ | 483,221 | |
| USI Inc/NY aka Compass Investors TLB, First Lien Term Loan, 3M CME TERM SOFR + 2.75%, 09/27/2030 | |
| 952,620 | | |
| 953,811 | |
| | |
| | | |
| 5,517,396 | |
| | |
| | | |
| | |
| Interactive Media & Services - 0.36% | |
| | | |
| | |
| Foundational Education Group, Inc., First Lien Term Loan, 3M CME TERM SOFR + 3.75%, 08/31/2028(b) | |
| 32,882 | | |
| 32,060 | |
| LI Group Holdings, Inc., First Lien 2021 Term Loan, 1M US SOFR + 3.50%, 0.75% Floor, 03/11/2028(b) | |
| 576,077 | | |
| 577,517 | |
| | |
| | | |
| 609,577 | |
| | |
| | | |
| | |
| IT Services - 4.50% | |
| | | |
| | |
| Access CIG LLC, First Lien Term Loan, 3M CME TERM SOFR + 5.00%, 0.50% Floor, 08/18/2028 | |
| 135,239 | | |
| 136,275 | |
| Ahead DB Holdings, LLC, First Lien Term Loan, 3M CME TERM SOFR + 4.25%, 02/01/2031 | |
| 668,582 | | |
| 671,614 | |
| Asurion LLC, Second Lien Term Loan, 1M US SOFR + 5.25%, 01/20/2029 | |
| 53,839 | | |
| 49,822 | |
| Chrysaor Bidco Sarl DDTL 1L, First Lien Term Loan, 6M CME TERM SOFR + 4.00%, 05/14/2031 | |
| 19,735 | | |
| 19,846 | |
| Chrysaor Bidco Sarl TLB 1L, First Lien Term Loan, 6M CME TERM SOFR + 4.00%, 05/14/2031 | |
| 266,849 | | |
| 268,352 | |
| Dcert Buyer, Inc., Second Lien First Amendment Refinancing Term Loan, 1M US SOFR + 7.00%, 02/19/2029 | |
| 1,625,691 | | |
| 1,459,057 | |
| Go Daddy Oper Co LLC, First Lien Term Loan, 1M US SOFR + 1.75%, 05/30/2031 | |
| 414,000 | | |
| 414,120 | |
| Newfold Digital Holdings Group, Inc., First Lien Initial Term Loan, 1M US SOFR + 3.50%, 0.75% Floor, 02/10/2028 | |
| 1,542,792 | | |
| 1,436,725 | |
| Presidio/Fortress Intermediate 4/24 TLB 1L, First Lien Term Loan, 6M CME TERM SOFR + 4.00%, 05/09/2031(b) | |
| 1,089,000 | | |
| 1,091,722 | |
| Skopima Merger Sub Inc., First Lien Initial Term Loan, 1M US SOFR + 4.00%, 05/12/2028 | |
| 551,301 | | |
| 551,547 | |
| Virtusa Corp., First Lien Term Loan, 1M US SOFR + 3.25%, 0.75% Floor, 02/15/2029 | |
| 1,138,249 | | |
| 1,142,694 | |
| World Wide Technology 3/24, First Lien Term Loan, 1M US SOFR + 2.75%, 03/01/2030(b) | |
| 351,986 | | |
| 353,746 | |
| | |
| | | |
| 7,595,520 | |
| | |
| | | |
| | |
| Life Sciences Tools & Services - 2.42% | |
| | | |
| | |
| Catalent Pharma Solutions, Inc., First Lien Term Loan, 1M US SOFR + 2.00%, 0.50% Floor, 02/22/2028 | |
| 1,160,366 | | |
| 1,161,236 | |
| Curia Global, Inc., First Lien 2021 Term Loan, 3M CME TERM SOFR + 3.75%, 0.75% Floor, 08/30/2026 | |
| 1,253,175 | | |
| 1,183,605 | |
| IQVIA INC., First Lien Term Loan, 3M CME TERM SOFR + 2.00%, 01/02/2031 | |
| 167,428 | | |
| 168,317 | |
| Loire UK Midco 3, Ltd., First Lien Facility B2 Term Loan, 1M US SOFR + 3.75%, 0.75% Floor, 04/21/2027 | |
| 889,564 | | |
| 884,747 | |
| Parexel International Corporation, First Lien Term Loan, 1M US SOFR + 3.25%, 0.50% Floor, 11/15/2028 | |
| 684,815 | | |
| 687,062 | |
| | |
| | | |
| 4,084,967 | |
| | |
| | | |
| | |
| Machinery - 6.44% | |
| | | |
| | |
| Asp Blade Holdings, Inc., First Lien Term Loan, 3M CME TERM SOFR + 4.00%, 0.50% Floor, 10/13/2028 | |
| 229,095 | | |
| 175,201 | |
| Bettcher Industries, Inc., First Lien Term Loan, 3M CME TERM SOFR + 4.00%, 12/14/2028 | |
| 730,038 | | |
| 728,669 | |
| Crosby US Acquisition corp., First Lien Term Loan, 1M US SOFR + 4.00%, 08/16/2029 | |
| 340,771 | | |
| 343,078 | |
| Engineered Machinery Holdings, Inc., First Lien Term Loan, 3M CME TERM SOFR + 3.75%, 0.75% Floor, 05/19/2028 | |
| 1,338,879 | | |
| 1,345,888 | |
| Hyperion Materials & Technologies, Inc., First Lien Initial Term Loan, 3M CME TERM SOFR + 4.50%, 0.50% Floor, 08/30/2028 | |
| 630,924 | | |
| 616,255 | |
| INNIO Group Hldg GmbH, First Lien Term Loan, 6M CME TERM SOFR + 3.50%, 11/02/2028 | |
| 157,472 | | |
| 158,014 | |
See Notes to Financial Statements.
| Semi-Annual Report
| June 30, 2024 |
39 |
| Blackstone
Long-Short Credit Income Fund |
Portfolio
of Investments |
June
30, 2024 (Unaudited)
| | |
Principal
Amount | | |
Value | |
| Machinery (continued) | |
| | | |
| | |
| INNIO Group Holding GmbH, First Lien Term Loan, 3M CME TERM SOFR + 4.25%, 11/02/2028 | |
$ | 395 | | |
$ | 396 | |
| LSF11 Trinity Bidco Inc, First Lien Term Loan, 3M CME TERM SOFR + 3.50%, 06/14/2030 | |
| 989,614 | | |
| 995,493 | |
| Osmosis Buyer Limited, First Lien Initial B Term Loan, 3M CME TERM SOFR + 4.00%, 0.50% Floor, 07/31/2028 | |
| 1,395,648 | | |
| 1,399,709 | |
| Pro Mach Group, Inc., First Lien Closing Date Initial Term Loan, 1M US SOFR + 3.50%, 1.00% Floor, 08/31/2028 | |
| 1,174,438 | | |
| 1,181,779 | |
| Project Castle, Inc., First Lien Term Loan, 3M CME TERM SOFR + 5.50%, 06/01/2029 | |
| 1,316,059 | | |
| 1,178,971 | |
| SPX FLOW Inc, First Lien Term Loan, 1M US SOFR + 3.50%, 04/05/2029 | |
| 386,852 | | |
| 389,529 | |
| TK Elevator Midco GmbH, First Lien Term Loan, 6M CME TERM SOFR + 3.50%, 04/30/2030 | |
| 1,097,266 | | |
| 1,104,294 | |
| Victory Buyer LLC, First Lien Term Loan, 3M CME TERM SOFR + 3.75%, 0.50% Floor, 11/19/2028 | |
| 1,295,664 | | |
| 1,250,316 | |
| | |
| | | |
| 10,867,592 | |
| | |
| | | |
| | |
| Media - 1.16% | |
| | | |
| | |
| ABG Intermediate Holdings 2 LLC, First Lien Term Loan, 6M CME TERM SOFR + 2.75%, 12/21/2028 | |
| 194,381 | | |
| 194,807 | |
| American Greetings Corp., First Lien Term Loan, 1M US SOFR + 5.75%, 10/30/2029 | |
| 750,350 | | |
| 755,745 | |
| Cable One, Inc., First Lien Term Loan, 3M US L + 2.00%, 05/03/2028 | |
| 306,943 | | |
| 302,723 | |
| Cogeco Financing 2 LP, First Lien Term Loan, 3M CME TERM SOFR + 2.50%, 0.50% Floor, 09/01/2028 | |
| 173,686 | | |
| 168,383 | |
| Fleet Midco I Ltd., First Lien Term Loan, 1M US SOFR + 3.25%, 02/21/2031 | |
| 382,987 | | |
| 385,381 | |
| Univision Communications, Inc., First Lien Term Loan, 1M US SOFR + 3.25%, 0.75% Floor, 03/15/2026 | |
| 157,218 | | |
| 157,483 | |
| | |
| | | |
| 1,964,522 | |
| | |
| | | |
| | |
| Metals & Mining - 0.74% | |
| | | |
| | |
| Arsenal AIC Parent, LLC, First Lien Term Loan, 1M US SOFR + 3.75%, 08/18/2030 | |
| 1,243,957 | | |
| 1,252,975 | |
| | |
| | | |
| | |
| Mortgage Real Estate Investment - 0.34% | |
| | | |
| | |
| Blackstone Mortgage Trust, Inc., First Lien Term Loan: | |
| | | |
| | |
| 1M US SOFR + 2.25%, 04/23/2026 | |
| 294,588 | | |
| 289,800 | |
| 1M US SOFR + 2.75%, 0.50% Floor, 04/23/2026 | |
| 294,670 | | |
| 290,987 | |
| | |
| | | |
| 580,787 | |
| | |
| | | |
| | |
| Oil, Gas & Consumable Fuels - 0.85% | |
| | | |
| | |
| Buckeye Partners LP, First Lien Term Loan: | |
| | | |
| | |
| 1M US SOFR + 2.00%, 11/01/2026 | |
| 357,474 | | |
| 358,239 | |
| 3M CME TERM SOFR + 2.00%, 11/22/2030 | |
| 262,554 | | |
| 262,842 | |
| Freeport LNG, First Lien Term Loan, 3M CME TERM SOFR + 3.50%, 12/21/2028 | |
| 142,278 | | |
| 142,297 | |
| GIP Pilot Acquisition Partners LP, First Lien Term Loan, 3M CME TERM SOFR + 2.50%, 10/04/2030 | |
| 317,105 | | |
| 317,898 | |
| Whitewater Whistler Holdings LLC, First Lien Term Loan, 6M CME TERM SOFR + 2.25%, 02/15/2030 | |
| 352,922 | | |
| 353,437 | |
| | |
| | | |
| 1,434,713 | |
| Passenger Airlines - 1.30% | |
| | | |
| | |
| Air Canada, First Lien Term Loan, 3M CME TERM SOFR + 2.50%, 03/21/2031 | |
| 491,820 | | |
| 493,125 | |
| American Airlines, Inc., First Lien 2020 Term Loan, 6M CME TERM SOFR + 1.75%, 01/29/2027 | |
| 200,716 | | |
| 200,277 | |
| American Airlines, Inc., First Lien Term Loan, 1M US SOFR + 2.75%, 02/15/2028 | |
| 535,010 | | |
| 534,491 | |
| United Airlines, Inc. aka Continental, First Lien Term Loan, 1M US SOFR + 2.75%, 02/22/2031 | |
| 967,308 | | |
| 970,936 | |
| | |
| | | |
| 2,198,829 | |
See Notes to Financial Statements.
| 40 | www.blackstone-credit.com |
| Blackstone
Long-Short Credit Income Fund |
Portfolio
of Investments |
June
30, 2024 (Unaudited)
| | |
Principal
Amount | | |
Value | |
| Pharmaceuticals - 1.48% | |
| | |
| |
| Elanco Animal Health, Inc., First Lien B Term Loan, 1M US SOFR + 1.75%, 08/01/2027 | |
$ | 1,361,425 | | |
$ | 1,358,130 | |
| Padagis LLC, First Lien Initial Term Loan, 3M CME TERM SOFR + 4.75%, 0.50% Floor, 07/06/2028(b) | |
| 1,158,828 | | |
| 1,135,651 | |
| | |
| | | |
| 2,493,781 | |
| | |
| | | |
| | |
| Professional Services - 10.85% | |
| | | |
| | |
| AG Group Holdings, Inc., First Lien Term Loan, 1M US SOFR + 4.00%, 12/29/2028 | |
| 1,249,199 | | |
| 1,247,637 | |
| AlixPartners, LLP, First Lien USD B Term Loan, 1M US SOFR + 2.50%, 0.50% Floor, 02/04/2028 | |
| 951,821 | | |
| 953,606 | |
| Ankura Consulting Group LLC, First Lien Term Loan, 3M CME TERM SOFR + 4.25%, 0.75% Floor, 03/17/2028 | |
| 263,925 | | |
| 264,970 | |
| Cast & Crew LLC, First Lien Term Loan, 1M US SOFR + 3.75%, 0.50% Floor, 12/29/2028 | |
| 880,774 | | |
| 882,347 | |
| CoreLogic, Inc., First Lien Initial Term Loan, 1M US SOFR + 3.50%, 0.50% Floor, 06/02/2028 | |
| 394,396 | | |
| 389,184 | |
| CoreLogic, Inc., Second Lien Initial Term Loan, 1M US SOFR + 6.50%, 0.50% Floor, 06/04/2029 | |
| 553,488 | | |
| 543,802 | |
| DTI Holdco, Inc., First Lien Term Loan, 1M US SOFR + 4.75%, 04/26/2029 | |
| 718,635 | | |
| 722,479 | |
| Dun & Bradstreet Corp., First Lien Term Loan, 1M US SOFR + 2.75%, 01/18/2029 | |
| 666,330 | | |
| 667,579 | |
| EAB Global, Inc., First Lien Term Loan, 3M CME TERM SOFR + 3.50%, 0.50% Floor, 08/16/2028 | |
| 755,292 | | |
| 755,481 | |
| Eisner Advisory Group LLC, First Lien Term Loan, 1M US SOFR + 4.00%, 02/28/2031 | |
| 847,239 | | |
| 856,596 | |
| Element Materials Technology Group Holdings DTL, First Lien Term Loan, 3M CME TERM SOFR + 4.25%, 07/06/2029 | |
| 290,278 | | |
| 291,791 | |
| Element Materials Technology Group Holdings, First Lien Term Loan, 3M CME TERM SOFR + 4.25%, 07/06/2029 | |
| 628,938 | | |
| 632,215 | |
| Galaxy US Opco Inc. TL, First Lien Term Loan, 3M CME TERM SOFR + 4.75%, 04/29/2029 | |
| 861,341 | | |
| 702,712 | |
| Genuine Financial Holdings LLC, First Lien Term Loan, 3M CME TERM SOFR + 4.00%, 09/27/2030 | |
| 1,810,052 | | |
| 1,806,432 | |
| Grant Thornton 5/24 Cov-Lite TLB 1L, First Lien Term Loan, 6M CME TERM SOFR + 3.75%, 06/02/2031 | |
| 822,739 | | |
| 826,124 | |
| Isolved, Inc., First Lien Term Loan, 1M US SOFR + 3.50%, 10/15/2030 | |
| 311,131 | | |
| 312,298 | |
| Lereta, LLC, First Lien Term Loan, 1M US SOFR + 5.25%, 07/30/2028 | |
| 425,826 | | |
| 321,143 | |
| Mermaid Bidco Inc aka Datasite TL 1L, First Lien Term Loan, 6M CME TERM SOFR + 3.50%, 06/30/2031(b) | |
| 448,800 | | |
| 449,922 | |
| Neptune Bidco US, Inc., First Lien Term Loan: | |
| | | |
| | |
| 3M CME TERM SOFR + 4.75%, 10/11/2028 | |
| 415,331 | | |
| 390,722 | |
| 3M CME TERM SOFR + 5.00%, 0.50% Floor, 04/11/2029 | |
| 531,244 | | |
| 501,362 | |
| Ryan LLC., First Lien Term Loan, 1M US SOFR + 3.50%, 11/14/2030 | |
| 601,461 | | |
| 604,694 | |
| Sedwick CMS 2/23 TLB, First Lien Term Loan, 1M US SOFR + 3.75%, 02/24/2028 | |
| 770,503 | | |
| 772,322 | |
| Trans Union LLC, First Lien Term Loan, 6M CME TERM SOFR + 1.75%, 06/06/2031 | |
| 1,075,436 | | |
| 1,074,898 | |
| TTF Holdings LLC, First Lien Term Loan, 6M CME TERM SOFR + 4.00%, 06/20/2031(b) | |
| 682,817 | | |
| 682,817 | |
| Vaco Holdings, LLC, First Lien Term Loan, 3M CME TERM SOFR + 5.00%, 01/21/2029 | |
| 1,278,174 | | |
| 1,271,247 | |
| Veritext 3/24, First Lien Term Loan, 1M US SOFR + 3.50%, 08/09/2030 | |
| 379,490 | | |
| 381,720 | |
| | |
| | | |
| 18,306,100 | |
| | |
| | | |
| | |
| Real Estate Management & Development - 0.65% | |
| | | |
| | |
| Cushman & Wakefield US Borrower LLC, First Lien Initial Term Loan, 1M US SOFR + 3.00%, 01/31/2030(b) | |
| 505,291 | | |
| 505,922 | |
| Cushman & Wakefield US Borrower LLC, First Lien Term Loan, 1M US SOFR + 3.75%, 0.50% Floor, 01/31/2030(b) | |
| 577,320 | | |
| 581,650 | |
| | |
| | | |
| 1,087,572 | |
| | |
| | | |
| | |
| Software - 15.92% | |
| | | |
| | |
| Apttus Corp., First Lien Initial Term Loan, 1M US SOFR + 4.00%, 0.75% Floor, 05/08/2028 | |
| 306,315 | | |
| 306,698 | |
| BEP Intermediate/Buyers Edge 4/24 TLB, First Lien Term Loan, 1M US SOFR + 3.75%, 04/25/2031(b) | |
| 298,143 | | |
| 299,634 | |
See Notes to Financial Statements.
| Semi-Annual Report
| June 30, 2024 |
41 |
| Blackstone
Long-Short Credit Income Fund |
Portfolio
of Investments |
June
30, 2024 (Unaudited)
| | |
Principal
Amount | | |
Value | |
| Software (continued) | |
| | | |
| | |
| Boost Newco Borrower LLC aka Worldpay 1L TL, First Lien Term Loan 01/31/2031 | |
| 767,099 | | |
$ | 769,124 | |
| Boxer Parent Company Inc., First Lien Term Loan, 3M CME TERM SOFR + 4.00%, 12/29/2028 | |
| 380,221 | | |
| 381,476 | |
| Central Parent, Inc., First Lien Term Loan, 3M CME TERM SOFR + 3.25%, 07/06/2029 | |
| 940,294 | | |
| 929,424 | |
| Cloud Software Group Inc aka Balboa/Citrix TLB 1L, First Lien Term Loan, 3M CME TERM SOFR + 4.00%, 03/30/2029 | |
| 1,490,431 | | |
| 1,491,087 | |
| Cloud Software Group Inc, First Lien Term Loan, 3M CME TERM SOFR + 4.50%, 03/21/2031 | |
| 195,132 | | |
| 195,909 | |
| Cloudera, Inc., First Lien Term Loan, 3M CME TERM SOFR + 3.75%, 0.50% Floor, 10/08/2028 | |
| 994,911 | | |
| 996,776 | |
| Cornerstone OnDemand, Inc., First Lien Initial Term Loan, 1M US SOFR + 3.75%, 0.50% Floor, 10/16/2028 | |
| 1,659,295 | | |
| 1,570,796 | |
| Delta Topco, Inc., First Lien Term Loan, 3M CME TERM SOFR + 3.50%, 11/30/2029 | |
| 541,858 | | |
| 542,253 | |
| Epicor Software Corp, First Lien Term Loan: | |
| | | |
| | |
| 1M US SOFR + 3.25%, 05/30/2031(c) | |
| 283,331 | | |
| 284,865 | |
| 3M US L + 0.00%, 05/30/2031 | |
| 37,662 | | |
| 37,866 | |
| Fiserv Investment Solutions, Inc., First Lien Initial Term Loan, 3M CME TERM SOFR + 4.00%, 02/18/2027 | |
| 1,329,352 | | |
| 1,282,134 | |
| Flexera Software LLC, First Lien Term Loan, 3M CME TERM SOFR + 8.83%, 03/03/2028 | |
| 433,208 | | |
| 435,374 | |
| Help/Systems Holdings, Inc., First Lien Seventh Amendment Refinancing Term Loan, 3M CME TERM SOFR + 4.00%, 0.75% Floor, 11/19/2026 | |
| 1,173,097 | | |
| 1,059,454 | |
| Idera INC, First Lien Term Loan, 1M US SOFR + 3.50%, 03/02/2028 | |
| 1,208,059 | | |
| 1,201,263 | |
| Infoblox 4/24 2nd lien TL 1L, Second Lien Term Loan, 3M CME TERM SOFR + 5.25%, 11/29/2030 | |
| 579,428 | | |
| 589,278 | |
| Instructure Holdings, INC., First Lien Term Loan, 3M CME TERM SOFR + 2.75%, 10/30/2028 | |
| 274,008 | | |
| 274,180 | |
| Ivanti Software, Inc., First Lien First Amendment Term Loan, 3M CME TERM SOFR + 4.00%, 0.75% Floor, 12/01/2027 | |
| 240,682 | | |
| 190,440 | |
| Ivanti Software, Inc., Second Lien Term Loan, 3M CME TERM SOFR + 7.25%, 12/01/2028 | |
| 476,866 | | |
| 313,837 | |
| Magenta Buyer LLC, First Lien Initial Term Loan, 1M US SOFR + 5.00%, 0.75% Floor, 07/27/2028 | |
| 1,548,030 | | |
| 867,864 | |
| Mitnick Corporate Purchaser Inc., First Lien Term Loan, 3M CME TERM SOFR + 4.50%, 05/02/2029 | |
| 383,272 | | |
| 357,593 | |
| Modena Buyer LLC, First Lien Term Loan, 6M CME TERM SOFR + 4.25%, 04/18/2031 | |
| 869,313 | | |
| 849,619 | |
| Perforce Software, Inc., First Lien New Term Loan, 1M US SOFR + 3.75%, 07/01/2026 | |
| 245,494 | | |
| 245,187 | |
| Planview Parent Inc, First Lien Term Loan, 6M CME TERM SOFR + 3.75%, 12/17/2027 | |
| 555,542 | | |
| 555,773 | |
| Project Alpha Intermediate Holding Inc, First Lien Term Loan, 6M CME TERM SOFR + 3.75%, 10/28/2030 | |
| 1,072,356 | | |
| 1,076,973 | |
| Project Leopard Holdings, Inc., First Lien Term Loan, 3M CME TERM SOFR + 5.25%, 0.50% Floor, 07/20/2029 | |
| 861,341 | | |
| 803,928 | |
| Proofpoint Inc, First Lien Term Loan, 3M CME TERM SOFR + 3.00%, 08/31/2028 | |
| 220,517 | | |
| 220,972 | |
| Quartz Acquireco LLC, First Lien Term Loan, 3M CME TERM SOFR + 2.75%, 06/28/2030 | |
| 1,469,822 | | |
| 1,472,578 | |
| Quest Borrower Ltd., First Lien Term Loan, 3M CME TERM SOFR + 4.25%, 02/01/2029 | |
| 1,513,360 | | |
| 1,127,877 | |
| Rocket Software, Inc., First Lien Term Loan, 1M US SOFR + 4.75%, 0.50% Floor, 11/28/2028 | |
| 943,982 | | |
| 949,084 | |
| SS&C Technologies, Inc., First Lien Term Loan, 1M US SOFR + 2.00%, 05/09/2031 | |
| 1,308,057 | | |
| 1,311,445 | |
| Surf Holdings Sarl., First Lien Dollar Tranche Term Loan, 1M US SOFR + 3.50%, 03/05/2027 | |
| 890,727 | | |
| 892,816 | |
| Vision Solutions, Inc., First Lien Term Loan, 3M CME TERM SOFR + 4.25%, 0.75% Floor, 04/24/2028 | |
| 1,627,463 | | |
| 1,605,085 | |
| VS Buyer LLC, First Lien Term Loan, 1M US SOFR + 3.25%, 04/12/2031 | |
| 619,708 | | |
| 622,032 | |
| Webpros Luxembourg Sarl, First Lien Term Loan, 1M US SOFR + 4.00%, 03/28/2031(b) | |
| 262,262 | | |
| 264,721 | |
| Xplor T1, LLC, First Lien Term Loan, 3M CME TERM SOFR + 9.60%, 06/14/2031(b) | |
| 483,000 | | |
| 483,000 | |
| | |
| | | |
| 26,858,415 | |
| Specialty Retail - 2.21% | |
| | | |
| | |
| APRO LLC, First Lien Term Loan, 6M CME TERM SOFR + 4.00%, 06/13/2034(b) | |
| 491,129 | | |
| 491,743 | |
| EG America LLC, First Lien Term Loan, 3M CME TERM SOFR + 5.50%, 0.50% Floor, 02/07/2028 | |
| 415,237 | | |
| 410,912 | |
| HomeServe USA Corp., First Lien Term Loan, 1M US SOFR + 2.50%, 10/21/2030 | |
| 311,631 | | |
| 312,768 | |
| Mavis Tire Express Services Topco Corp., First Lien Term Loan, 1M US SOFR + 3.75%, 0.75% Floor, 05/04/2028 | |
| 929,437 | | |
| 932,663 | |
See Notes to Financial Statements.
| 42 | www.blackstone-credit.com |
| Blackstone
Long-Short Credit Income Fund |
Portfolio
of Investments |
June
30, 2024 (Unaudited)
| | |
Principal
Amount | | |
Value | |
| Specialty Retail (continued) | |
| | | |
| | |
| Spencer Spirit IH LLC, First Lien Term Loan, 6M US L + 0.00%, 06/01/2034(b) | |
$ | 723,429 | | |
$ | 723,429 | |
| StubHub Holdco Sub LLC, First Lien Term Loan, 1M US SOFR + 4.75%, 03/15/2030 | |
| 848,021 | | |
| 849,348 | |
| | |
| | | |
| 3,720,863 | |
| | |
| | | |
| | |
| Technology Hardware, Storage & Peripherals - 0.46% | |
| | | |
| | |
| Xerox 11/23, First Lien Term Loan, 1M US SOFR + 4.00%, 11/17/2029 | |
| 775,755 | | |
| 776,120 | |
| | |
| | | |
| | |
| Textiles, Apparel & Luxury Goods - 0.61% | |
| | | |
| | |
| Champ Acquisition Corp., First Lien Initial Term Loan, 3M CME TERM SOFR + 5.50%, 12/19/2025 | |
| 1,015,804 | | |
| 1,020,756 | |
| | |
| | | |
| | |
| Trading Companies & Distributors - 3.22% | |
| | | |
| | |
| American Builders & Contractors Supply Co., Inc., First Lien Term Loan, 1M US SOFR + 2.00%, 01/31/2031 | |
| 191,260 | | |
| 191,883 | |
| Avolon TLB Borrower 1 (US), First Lien Term Loan, 1M US SOFR + 2.00%, 06/22/2028 | |
| 649,387 | | |
| 651,010 | |
| CD&R Hydr SunSource, First Lien Term Loan, 1M US SOFR + 4.00%, 03/25/2031 | |
| 653,652 | | |
| 655,694 | |
| Core & Main LP, First Lien Term Loan, 3M CME TERM SOFR + 2.25%, 02/09/2031(b) | |
| 155,203 | | |
| 155,689 | |
| Fastlane Parent Co., Inc., First Lien Term Loan, 1M CME TERM SOFR + 4.50%, 0.50% Floor, 09/29/2028 | |
| 375,857 | | |
| 374,730 | |
| FCG Acquisitions, Inc., First Lien Initial Term Loan, 1M US L + 3.75%, 0.50% Floor, 03/31/2028 | |
| 724,821 | | |
| 725,818 | |
| Foundation Building Materials, Inc., First Lien Term Loan, 3M CME TERM SOFR + 4.00%, 01/29/2031 | |
| 930,030 | | |
| 927,449 | |
| Park River Holdings, Inc., First Lien Initial Term Loan, 3M CME TERM SOFR + 3.25%, 0.75% Floor, 12/28/2027 | |
| 742,876 | | |
| 727,811 | |
| White Cap Buyer LLC, First Lien Term Loan, 1M US SOFR + 3.25%, 10/19/2029 | |
| 393,287 | | |
| 394,406 | |
| Windsor Holdings III LLC, First Lien Term Loan, 1M US SOFR + 4.00%, 08/01/2030 | |
| 625,156 | | |
| 630,001 | |
| | |
| | | |
| 5,434,491 | |
| | |
| | | |
| | |
| Transportation Infrastructure - 0.30% | |
| | | |
| | |
| Brown Group Holding LLC, First Lien Term Loan, 1M US SOFR + 2.75%, 0.50% Floor, 06/07/2028 | |
| 507,837 | | |
| 508,188 | |
| | |
| | | |
| | |
| Wireless Telecommunication Services - 0.67% | |
| | | |
| | |
| CCI Buyer, Inc., First Lien Initial Term Loan, 3M CME TERM SOFR + 4.00%, 0.75% Floor, 12/17/2027 | |
| 1,121,096 | | |
| 1,123,635 | |
| | |
| | | |
| | |
| TOTAL FLOATING RATE LOAN INTERESTS | |
| | | |
| | |
| (Cost $222,965,135) | |
| | | |
| 219,717,098 | |
| | |
| | | |
| | |
| COLLATERALIZED LOAN OBLIGATION SECURITIES(a) - 7.29% | |
| | | |
| | |
| Consumer Finance - 0.29% | |
| | | |
| | |
| Parallel 2021-2, Ltd., 3M CME TERM SOFR + 7.46%, 10/20/2034(b)(e) | |
| 500,000 | | |
| 491,383 | |
| | |
| | | |
| | |
| Financial Services - 7.00% | |
| | | |
| | |
| Bain Capital Credit CLO 2022-3, Ltd., 3M CME TERM SOFR + 3.70%, 07/17/2035(b)(e) | |
| 1,620,000 | | |
| 1,625,404 | |
| CIFC Funding 2019-V, Ltd., 3M CME TERM SOFR + 3.41%, 01/15/2035(b)(e) | |
| 1,600,000 | | |
| 1,607,445 | |
| Clover CLO 2021-3 LLC, 3M CME TERM SOFR + 3.36%, 01/25/2035(b)(e) | |
| 2,000,000 | | |
| 2,010,526 | |
| Danby Park CLO, Ltd., 3M CME TERM SOFR + 5.33%, 10/21/2035(b)(e) | |
| 1,000,000 | | |
| 1,015,264 | |
| HPS Loan Management CLO 6-2015, Ltd., 3M CME TERM SOFR + 5.36%, 02/05/2031(b)(e) | |
| 833,000 | | |
| 829,906 | |
| Magnetite XXXV, Ltd., 3M CME TERM SOFR + 4.00%, 10/25/2036(b)(e) | |
| 1,000,000 | | |
| 1,027,418 | |
| OCP CLO 2020-18, Ltd., 3M CME TERM SOFR + 6.69%, 07/20/2032(b)(e) | |
| 1,000,000 | | |
| 1,003,043 | |
| Park Avenue Institutional Advisers CLO, Ltd. 2022-1, 3M CME TERM SOFR + 7.29%, 04/20/2035(b)(e) | |
| 1,000,000 | | |
| 987,437 | |
| PPM CLO 3, Ltd., 3M CME TERM SOFR + 6.87%, 04/17/2034(b)(e) | |
| 500,000 | | |
| 475,028 | |
See Notes to Financial Statements.
| Semi-Annual Report
| June 30, 2024 |
43 |
| Blackstone
Long-Short Credit Income Fund |
Portfolio
of Investments |
June
30, 2024 (Unaudited)
| | |
Principal
Amount | | |
Value | |
| Financial Services (continued) | |
| | | |
| | |
| Rad CLO 5, Ltd., 3M CME TERM SOFR + 6.96%, 07/24/2032(b)(e) | |
$ | 250,000 | | |
$ | 251,801 | |
| Romark CLO IV, Ltd., 3M CME TERM SOFR + 7.21%, 07/10/2034(b)(e) | |
| 1,000,000 | | |
| 970,596 | |
| | |
| | | |
| 11,803,868 | |
| | |
| | | |
| | |
| TOTAL COLLATERALIZED LOAN OBLIGATION SECURITIES | |
| | | |
| | |
| (Cost $12,121,874) | |
| | | |
| 12,295,251 | |
| | |
| | | |
| | |
| CORPORATE BONDS - 12.64% | |
| | | |
| | |
| Aerospace & Defense - 0.45% | |
| | | |
| | |
| Bombardier, Inc., 7.000%, 06/01/2032(e) | |
| 40,000 | | |
| 40,606 | |
| BWX Technologies, Inc., 4.125%, 06/30/2028(e) | |
| 70,000 | | |
| 65,431 | |
| KBR, Inc., 4.750%, 09/30/2028(e) | |
| 60,000 | | |
| 56,064 | |
| TransDigm, Inc.: | |
| | | |
| | |
| 4.625%, 01/15/2029 | |
| 109,000 | | |
| 101,795 | |
| 4.880%, 05/01/2029 | |
| 350,000 | | |
| 328,204 | |
| Triumph Group, Inc., 9.000%, 03/15/2028(e) | |
| 183,000 | | |
| 192,057 | |
| | |
| | | |
| 784,157 | |
| | |
| | | |
| | |
| Automobile Components - 0.08% | |
| | | |
| | |
| Patrick Industries, Inc., 4.750%, 05/01/2029(e) | |
| 155,000 | | |
| 142,975 | |
| | |
| | | |
| | |
| Banks - 0.06% | |
| | | |
| | |
| Popular, Inc., 7.250%, 03/13/2028 | |
| 95,000 | | |
| 97,642 | |
| | |
| | | |
| | |
| Beverages - 0.08% | |
| | | |
| | |
| Primo Water Holdings, Inc., 4.375%, 04/30/2029(e) | |
| 152,000 | | |
| 140,154 | |
| | |
| | | |
| | |
| Broadline Retail - 0.23% | |
| | | |
| | |
| Kohl's Corp., 5.550%, 07/17/2045 | |
| 30,000 | | |
| 20,484 | |
| Nordstrom, Inc., 5.000%, 01/15/2044 | |
| 50,000 | | |
| 40,431 | |
| Rakuten Group, Inc.: | |
| | | |
| | |
| 11.250%, 02/15/2027(e) | |
| 237,000 | | |
| 253,556 | |
| 9.750%, 04/15/2029(e) | |
| 70,000 | | |
| 72,258 | |
| | |
| | | |
| 386,729 | |
| | |
| | | |
| | |
| Building Products - 0.03% | |
| | | |
| | |
| Griffon Corp., 5.750%, 03/01/2028 | |
| 49,000 | | |
| 47,323 | |
| | |
| | | |
| | |
| Chemicals - 0.30% | |
| | | |
| | |
| Chemours Co., 5.750%, 11/15/2028(e) | |
| 200,000 | | |
| 184,877 | |
| CVR Partners LP / CVR Nitrogen Finance Corp., 6.125%, 06/15/2028(e) | |
| 120,000 | | |
| 115,395 | |
| Tronox, Inc., 4.625%, 03/15/2029(e) | |
| 231,000 | | |
| 208,769 | |
| | |
| | | |
| 509,041 | |
| | |
| | | |
| | |
| Commercial Services & Supplies - 0.22% | |
| | | |
| | |
| Cimpress PLC, 7.000%, 06/15/2026 | |
| 130,000 | | |
| 130,032 | |
| CoreCivic, Inc., 8.250%, 04/15/2029 | |
| 70,000 | | |
| 72,416 | |
| Deluxe Corp., 8.000%, 06/01/2029(e) | |
| 70,000 | | |
| 65,767 | |
| Pitney Bowes, Inc.: | |
| | | |
| | |
| 6.875%, 03/15/2027(e) | |
| 35,000 | | |
| 33,092 | |
| 7.250%, 03/15/2029(e) | |
| 85,000 | | |
| 76,455 | |
| | |
| | | |
| 377,762 | |
See
Notes to Financial Statements.
| 44 | www.blackstone-credit.com |
| Blackstone
Long-Short Credit Income Fund |
Portfolio
of Investments |
June
30, 2024 (Unaudited)
| | |
Principal
Amount | | |
Value | |
| Construction & Engineering - 0.12% | |
| | | |
| | |
| Great Lakes Dredge & Dock Corp., 5.250%, 06/01/2029(e) | |
$ | 111,000 | | |
$ | 99,177 | |
| Tutor Perini Corp., 11.880%, 04/30/2029(e) | |
| 94,000 | | |
| 101,192 | |
| | |
| | | |
| 200,369 | |
| | |
| | | |
| | |
| Consumer Finance - 1.01% | |
| | | |
| | |
| Enova International, Inc., 11.250%, 12/15/2028(e) | |
| 50,000 | | |
| 53,451 | |
| FirstCash, Inc.: | |
| | | |
| | |
| 4.630%, 09/01/2028(e) | |
| 90,000 | | |
| 84,677 | |
| 5.625%, 01/01/2030(e) | |
| 170,000 | | |
| 161,174 | |
| 6.875%, 03/01/2032(e) | |
| 136,000 | | |
| 136,152 | |
| goeasy, Ltd.: | |
| | | |
| | |
| 9.250%, 12/01/2028(e) | |
| 134,000 | | |
| 142,359 | |
| 7.625%, 07/01/2029(e) | |
| 120,000 | | |
| 122,503 | |
| Navient Corp.: | |
| | | |
| | |
| 4.880%, 03/15/2028 | |
| 240,000 | | |
| 220,512 | |
| 9.380%, 07/25/2030 | |
| 158,000 | | |
| 166,290 | |
| 11.500%, 03/15/2031 | |
| 40,000 | | |
| 44,101 | |
| OneMain Finance Corp.: | |
| | | |
| | |
| 3.880%, 09/15/2028 | |
| 50,000 | | |
| 44,877 | |
| 7.875%, 03/15/2030 | |
| 159,000 | | |
| 164,064 | |
| 7.500%, 05/15/2031 | |
| 32,000 | | |
| 32,408 | |
| PRA Group, Inc.: | |
| | | |
| | |
| 8.380%, 02/01/2028(e) | |
| 30,000 | | |
| 29,920 | |
| 8.880%, 01/31/2030(e) | |
| 52,000 | | |
| 51,956 | |
| Synchrony Financial, 7.250%, 02/02/2033 | |
| 180,000 | | |
| 179,093 | |
| World Acceptance Corp., 7.000%, 11/01/2026(e) | |
| 68,000 | | |
| 64,883 | |
| | |
| | | |
| 1,698,420 | |
| | |
| | | |
| | |
| Containers & Packaging - 0.04% | |
| | | |
| | |
| Ardagh Metal Packaging Finance USA LLC / Ardagh Metal Packaging Finance PLC, 4.000%, 09/01/2029(e) | |
| 80,000 | | |
| 67,790 | |
| | |
| | | |
| | |
| Diversified Consumer Services - 0.05% | |
| | | |
| | |
| Adtalem Global Education, Inc., 5.500%, 03/01/2028(e) | |
| 90,000 | | |
| 86,677 | |
| | |
| | | |
| | |
| Diversified REITs - 0.28% | |
| | | |
| | |
| Iron Mountain, Inc., 5.625%, 07/15/2032(e) | |
| 360,000 | | |
| 342,160 | |
| Service Properties Trust: | |
| | | |
| | |
| 4.950%, 10/01/2029 | |
| 98,000 | | |
| 74,444 | |
| 4.375%, 02/15/2030 | |
| 80,000 | | |
| 56,588 | |
| | |
| | | |
| 473,192 | |
| | |
| | | |
| | |
| Diversified Telecommunication Services - 0.50% | |
| | | |
| | |
| Cogent Communications Group, Inc., 7.000%, 06/15/2027(e) | |
| 233,000 | | |
| 231,043 | |
| Consolidated Communications, Inc., 6.500%, 10/01/2028(e) | |
| 85,000 | | |
| 72,854 | |
| Frontier Communications Holdings LLC: | |
| | | |
| | |
| 6.750%, 05/01/2029(e) | |
| 360,000 | | |
| 330,571 | |
| 5.875%, 11/01/2029 | |
| 70,000 | | |
| 61,056 | |
| 6.000%, 01/15/2030(e) | |
| 50,000 | | |
| 43,571 | |
| Viasat, Inc.: | |
| | | |
| | |
| 6.500%, 07/15/2028(e) | |
| 110,000 | | |
| 83,384 | |
| 7.500%, 05/30/2031(e) | |
| 40,000 | | |
| 26,621 | |
| | |
| | | |
| 849,100 | |
See
Notes to Financial Statements.
| Semi-Annual
Report | June 30, 2024 |
45 |
| Blackstone
Long-Short Credit Income Fund |
Portfolio
of Investments |
June
30, 2024 (Unaudited)
| | |
Principal
Amount | | |
Value | |
| Electric Utilities - 0.14% | |
| | | |
| | |
| NRG Energy, Inc., 3.625%, 02/15/2031(e) | |
$ | 60,000 | | |
$ | 51,501 | |
| Vistra Operations Co. LLC: | |
| | | |
| | |
| 5.000%, 07/31/2027(e) | |
| 50,000 | | |
| 48,402 | |
| 7.750%, 10/15/2031(e) | |
| 125,000 | | |
| 130,272 | |
| | |
| | | |
| 230,175 | |
| | |
| | | |
| | |
| Energy Equipment & Services - 0.60% | |
| | | |
| | |
| Archrock Partners LP / Archrock Partners Finance Corp., 6.250%, 04/01/2028(e) | |
| 182,000 | | |
| 180,420 | |
| Enerflex, Ltd., 9.000%, 10/15/2027(e) | |
| 160,000 | | |
| 162,571 | |
| Helix Energy Solutions Group, Inc., 9.750%, 03/01/2029(e) | |
| 86,000 | | |
| 91,758 | |
| Precision Drilling Corp., 6.875%, 01/15/2029(e) | |
| 80,000 | | |
| 79,217 | |
| Transocean, Inc., 7.500%, 04/15/2031 | |
| 84,000 | | |
| 78,871 | |
| USA Compression Partners LP / USA Compression Finance Corp., 7.125%, 03/15/2029(e) | |
| 170,000 | | |
| 171,434 | |
| Valaris, Ltd., 8.380%, 04/30/2030(e) | |
| 235,000 | | |
| 243,478 | |
| | |
| | | |
| 1,007,749 | |
| | |
| | | |
| | |
| Entertainment - 0.09% | |
| | | |
| | |
| Cinemark USA, Inc., 5.250%, 07/15/2028(e) | |
| 160,000 | | |
| 153,103 | |
| | |
| | | |
| | |
| Financial Services - 0.58% | |
| | | |
| | |
| Burford Capital Global Finance LLC, 9.250%, 07/01/2031(e) | |
| 140,000 | | |
| 147,524 | |
| Compass Group Diversified Holdings LLC, 5.250%, 04/15/2029(e) | |
| 35,000 | | |
| 33,229 | |
| Encore Capital Group, Inc.: | |
| | | |
| | |
| 9.250%, 04/01/2029(e) | |
| 50,000 | | |
| 52,166 | |
| 8.500%, 05/15/2030(e) | |
| 81,000 | | |
| 82,559 | |
| Nationstar Mortgage Holdings, Inc.: | |
| | | |
| | |
| 6.000%, 01/15/2027(e) | |
| 150,000 | | |
| 148,543 | |
| 5.500%, 08/15/2028(e) | |
| 250,000 | | |
| 240,459 | |
| 5.750%, 11/15/2031(e) | |
| 10,000 | | |
| 9,408 | |
| 7.125%, 02/01/2032(e) | |
| 30,000 | | |
| 30,209 | |
| PennyMac Financial Services, Inc.: | |
| | | |
| | |
| 4.250%, 02/15/2029(e) | |
| 100,000 | | |
| 91,031 | |
| 7.875%, 12/15/2029(e) | |
| 5,000 | | |
| 5,160 | |
| 5.750%, 09/15/2031(e) | |
| 130,000 | | |
| 121,849 | |
| PHH Mortgage Corp., 7.875%, 03/15/2026(e) | |
| 20,000 | | |
| 19,567 | |
| | |
| | | |
| 981,704 | |
| | |
| | | |
| | |
| Food Products - 0.10% | |
| | | |
| | |
| Post Holdings, Inc., 4.625%, 04/15/2030(e) | |
| 180,000 | | |
| 165,518 | |
| | |
| | | |
| | |
| Gas Utilities - 0.14% | |
| | | |
| | |
| Suburban Propane Partners LP/Suburban Energy Finance Corp., 5.000%, 06/01/2031(e) | |
| 130,000 | | |
| 117,182 | |
| Superior Plus LP / Superior General Partner, Inc., 4.500%, 03/15/2029(e) | |
| 130,000 | | |
| 119,422 | |
| | |
| | | |
| 236,604 | |
| | |
| | | |
| | |
| Health Care Providers & Services - 0.59% | |
| | | |
| | |
| AdaptHealth LLC: | |
| | | |
| | |
| 6.125%, 08/01/2028(e) | |
| 120,000 | | |
| 114,689 | |
| 5.125%, 03/01/2030(e) | |
| 140,000 | | |
| 122,596 | |
| CHS/Community Health Systems, Inc.: | |
| | | |
| | |
| 6.875%, 04/15/2029(e) | |
| 62,000 | | |
| 47,486 | |
| 10.880%, 01/15/2032(e) | |
| 210,000 | | |
| 218,828 | |
| DaVita, Inc.: | |
| | | |
| | |
| 4.625%, 06/01/2030(e) | |
| 415,000 | | |
| 375,355 | |
| 3.750%, 02/15/2031(e) | |
| 50,000 | | |
| 42,699 | |
See Notes to Financial Statements.
| 46 | www.blackstone-credit.com |
| Blackstone
Long-Short Credit Income Fund |
Portfolio
of Investments |
June
30, 2024 (Unaudited)
| | |
Principal
Amount | | |
Value | |
| Health Care Providers & Services (continued) | |
| | | |
| | |
| ModivCare Escrow Issuer, Inc., 5.000%, 10/01/2029(e) | |
$ | 20,000 | | |
$ | 14,114 | |
| Pediatrix Medical Group, Inc., 5.375%, 02/15/2030(e) | |
| 70,000 | | |
| 61,958 | |
| | |
| | | |
| 997,725 | |
| | |
| | | |
| | |
| Health Care REITs - 0.17% | |
| | | |
| | |
| MPT Operating Partnership LP / MPT Finance Corp.: | |
| | | |
| | |
| 5.250%, 08/01/2026 | |
| 50,000 | | |
| 45,480 | |
| 5.000%, 10/15/2027 | |
| 140,000 | | |
| 115,756 | |
| 4.625%, 08/01/2029 | |
| 162,000 | | |
| 117,747 | |
| | |
| | | |
| 278,983 | |
| | |
| | | |
| | |
| Hotels, Restaurants & Leisure - 0.19% | |
| | | |
| | |
| Brinker International, Inc., 8.250%, 07/15/2030(e) | |
| 85,000 | | |
| 89,320 | |
| NCL Corp., Ltd., 5.875%, 03/15/2026(e) | |
| 230,000 | | |
| 227,547 | |
| | |
| | | |
| 316,867 | |
| | |
| | | |
| | |
| Household Durables - 0.42% | |
| | | |
| | |
| Dream Finders Homes, Inc., 8.250%, 08/15/2028(e) | |
| 30,000 | | |
| 30,751 | |
| Forestar Group, Inc., 3.850%, 05/15/2026(e) | |
| 105,000 | | |
| 100,706 | |
| LGI Homes, Inc., 8.750%, 12/15/2028(e) | |
| 79,000 | | |
| 82,336 | |
| M/I Homes, Inc.: | |
| | | |
| | |
| 4.950%, 02/01/2028 | |
| 120,000 | | |
| 115,827 | |
| 3.950%, 02/15/2030 | |
| 50,000 | | |
| 44,629 | |
| Tempur Sealy International, Inc., 4.000%, 04/15/2029(e) | |
| 365,000 | | |
| 329,608 | |
| | |
| | | |
| 703,857 | |
| | |
| | | |
| | |
| Household Products - 0.01% | |
| | | |
| | |
| Energizer Holdings, Inc., 4.750%, 06/15/2028(e) | |
| 25,000 | | |
| 23,428 | |
| | |
| | | |
| | |
| Industrial Conglomerates - 0.26% | |
| | | |
| | |
| Icahn Enterprises LP / Icahn Enterprises Finance Corp.: | |
| | | |
| | |
| 6.250%, 05/15/2026 | |
| 180,000 | | |
| 178,733 | |
| 5.250%, 05/15/2027 | |
| 30,000 | | |
| 28,186 | |
| 9.750%, 01/15/2029(e) | |
| 120,000 | | |
| 124,470 | |
| 9.000%, 06/15/2030(e) | |
| 106,000 | | |
| 105,556 | |
| | |
| | | |
| 436,945 | |
| | |
| | | |
| | |
| IT Services - 0.34% | |
| | | |
| | |
| Bread Financial Holdings, Inc., 9.750%, 03/15/2029(e) | |
| 212,000 | | |
| 222,920 | |
| Conduent Business Services LLC / Conduent State & Local Solutions, Inc., 6.000%, 11/01/2029(e) | |
| 135,000 | | |
| 126,243 | |
| Sabre GLBL, Inc.: | |
| | | |
| | |
| 8.630%, 06/01/2027(e) | |
| 150,000 | | |
| 138,332 | |
| 11.250%, 12/15/2027(e) | |
| 80,000 | | |
| 77,817 | |
| | |
| | | |
| 565,312 | |
| | |
| | | |
| | |
| Machinery - 0.10% | |
| | | |
| | |
| Allison Transmission, Inc., 4.750%, 10/01/2027(e) | |
| 110,000 | | |
| 106,389 | |
| Park-Ohio Industries, Inc., 6.625%, 04/15/2027 | |
| 66,000 | | |
| 63,599 | |
| Wabash National Corp., 4.500%, 10/15/2028(e) | |
| 5,000 | | |
| 4,506 | |
| | |
| | | |
| 174,494 | |
| | |
| | | |
| | |
| Marine Transportation - 0.05% | |
| | | |
| | |
| Danaos Corp., 8.500%, 03/01/2028(e) | |
| 80,000 | | |
| 82,259 | |
See Notes to Financial Statements.
| Semi-Annual Report
| June 30, 2024 |
47 |
| Blackstone
Long-Short Credit Income Fund |
Portfolio
of Investments |
June
30, 2024 (Unaudited)
| | |
Principal
Amount | | |
Value | |
| Media - 0.97% | |
| | |
| |
| Advantage Sales & Marketing, Inc., 6.500%, 11/15/2028(e) | |
$ | 186,000 | | |
$ | 168,457 | |
| AMC Networks, Inc., 4.250%, 02/15/2029 | |
| 88,000 | | |
| 59,465 | |
| CCO Holdings LLC / CCO Holdings Capital Corp.: | |
| | | |
| | |
| 5.375%, 06/01/2029(e) | |
| 80,000 | | |
| 72,855 | |
| 4.750%, 03/01/2030(e) | |
| 140,000 | | |
| 121,347 | |
| 4.250%, 02/01/2031(e) | |
| 50,000 | | |
| 40,861 | |
| 7.375%, 03/01/2031(e) | |
| 170,000 | | |
| 167,727 | |
| 4.500%, 05/01/2032 | |
| 20,000 | | |
| 16,122 | |
| Clear Channel Outdoor Holdings, Inc.: | |
| | | |
| | |
| 7.750%, 04/15/2028(e) | |
| 180,000 | | |
| 157,706 | |
| 7.500%, 06/01/2029(e) | |
| 99,000 | | |
| 82,826 | |
| CSC Holdings LLC: | |
| | | |
| | |
| 11.250%, 05/15/2028(e) | |
| 90,000 | | |
| 78,490 | |
| 11.750%, 01/31/2029(e) | |
| 45,000 | | |
| 38,407 | |
| 5.750%, 01/15/2030(e) | |
| 15,000 | | |
| 5,674 | |
| Gray Television, Inc.: | |
| | | |
| | |
| 4.750%, 10/15/2030(e) | |
| 160,000 | | |
| 96,159 | |
| 5.375%, 11/15/2031(e) | |
| 140,000 | | |
| 79,477 | |
| Nexstar Media, Inc.: | |
| | | |
| | |
| 5.625%, 07/15/2027(e) | |
| 395,000 | | |
| 375,553 | |
| 4.750%, 11/01/2028(e) | |
| 50,000 | | |
| 44,500 | |
| Sinclair Television Group, Inc., 5.500%, 03/01/2030(e) | |
| 40,000 | | |
| 24,364 | |
| | |
| | | |
| 1,629,990 | |
| | |
| | | |
| | |
| Metals & Mining - 0.75% | |
| | | |
| | |
| Eldorado Gold Corp., 6.250%, 09/01/2029(e) | |
| 105,000 | | |
| 100,997 | |
| FMG Resources August 2006 Pty, Ltd., 5.875%, 04/15/2030(e) | |
| 130,000 | | |
| 127,137 | |
| Hudbay Minerals, Inc., 4.500%, 04/01/2026(e) | |
| 150,000 | | |
| 146,871 | |
| Iamgold Corp, 5.750%, 10/15/2028(e) | |
| 110,000 | | |
| 104,041 | |
| Kaiser Aluminum Corp., 4.625%, 03/01/2028(e) | |
| 50,000 | | |
| 46,841 | |
| Mineral Resources, Ltd.: | |
| | | |
| | |
| 8.130%, 05/01/2027(e) | |
| 147,000 | | |
| 148,282 | |
| 8.000%, 11/01/2027(e) | |
| 180,000 | | |
| 184,351 | |
| 9.250%, 10/01/2028(e) | |
| 80,000 | | |
| 84,063 | |
| New Gold, Inc., 7.500%, 07/15/2027(e) | |
| 100,000 | | |
| 100,762 | |
| SunCoke Energy, Inc., 4.880%, 06/30/2029(e) | |
| 120,000 | | |
| 108,848 | |
| Taseko Mines, Ltd., 8.250%, 05/01/2030(e) | |
| 111,000 | | |
| 113,694 | |
| | |
| | | |
| 1,265,887 | |
| | |
| | | |
| | |
| Mortgage Real Estate Investment - 0.45% | |
| | | |
| | |
| Apollo Commercial Real Estate Finance, Inc., 4.625%, 06/15/2029(e) | |
| 150,000 | | |
| 125,915 | |
| Rithm Capital Corp., 8.000%, 04/01/2029(e) | |
| 264,000 | | |
| 256,505 | |
| Starwood Property Trust, Inc.: | |
| | | |
| | |
| 4.380%, 01/15/2027(e) | |
| 370,000 | | |
| 350,687 | |
| 7.250%, 04/01/2029(e) | |
| 28,000 | | |
| 28,335 | |
| | |
| | | |
| 761,442 | |
| | |
| | | |
| | |
| Office REITs - 0.07% | |
| | | |
| | |
| Brandywine Operating Partnership LP, 4.550%, 10/01/2029 | |
| 70,000 | | |
| 61,011 | |
| Vornado Realty LP, 3.400%, 06/01/2031 | |
| 70,000 | | |
| 55,032 | |
| | |
| | | |
| 116,043 | |
| | |
| | | |
| | |
| Oil, Gas & Consumable Fuels - 1.52% | |
| | | |
| | |
| Berry Petroleum Co. LLC, 7.000%, 02/15/2026(e) | |
| 50,000 | | |
| 49,468 | |
| California Resources Corp., 8.250%, 06/15/2029(e) | |
| 80,000 | | |
| 81,718 | |
See Notes to Financial Statements.
| 48 | www.blackstone-credit.com |
| Blackstone
Long-Short Credit Income Fund |
Portfolio
of Investments |
June
30, 2024 (Unaudited)
| | |
Principal
Amount | | |
Value | |
| Oil, Gas & Consumable Fuels (continued) | |
| | | |
| | |
| Calumet Specialty Products Partners LP / Calumet Finance Corp., 9.750%, 07/15/2028(e) | |
$ | 138,000 | | |
$ | 130,819 | |
| CNX Resources Corp.: | |
| | | |
| | |
| 6.000%, 01/15/2029(e) | |
| 178,000 | | |
| 174,329 | |
| 7.250%, 03/01/2032(e) | |
| 56,000 | | |
| 57,158 | |
| Comstock Resources, Inc.: | |
| | | |
| | |
| 6.750%, 03/01/2029(e) | |
| 240,000 | | |
| 232,772 | |
| 5.875%, 01/15/2030(e) | |
| 105,000 | | |
| 97,778 | |
| CVR Energy, Inc., 8.500%, 01/15/2029(e) | |
| 230,000 | | |
| 231,147 | |
| Delek Logistics Partners LP / Delek Logistics Finance Corp.: | |
| | | |
| | |
| 7.125%, 06/01/2028(e) | |
| 197,000 | | |
| 194,705 | |
| 8.630%, 03/15/2029(e) | |
| 64,000 | | |
| 65,913 | |
| DT Midstream, Inc., 4.125%, 06/15/2029(e) | |
| 51,000 | | |
| 47,157 | |
| Energean PLC, 6.500%, 04/30/2027(e) | |
| 70,000 | | |
| 69,048 | |
| EnQuest PLC, 11.630%, 11/01/2027(e) | |
| 30,000 | | |
| 30,504 | |
| Karoon USA Finance, Inc., 10.500%, 05/14/2029(e) | |
| 26,000 | | |
| 26,162 | |
| Magnolia Oil & Gas Operating LLC / Magnolia Oil & Gas Finance Corp., 6.000%, 08/01/2026(e) | |
| 50,000 | | |
| 49,555 | |
| New Fortress Energy, Inc., 6.500%, 09/30/2026(e) | |
| 280,000 | | |
| 257,823 | |
| NGL Energy Operating LLC / NGL Energy Finance Corp.: | |
| | | |
| | |
| 8.130%, 02/15/2029(e) | |
| 60,000 | | |
| 61,180 | |
| 8.380%, 02/15/2032(e) | |
| 40,000 | | |
| 40,648 | |
| Northern Oil & Gas, Inc., 8.130%, 03/01/2028(e) | |
| 226,000 | | |
| 228,720 | |
| Parkland Corp., 4.500%, 10/01/2029(e) | |
| 210,000 | | |
| 192,389 | |
| PBF Holding Co. LLC / PBF Finance Corp., 7.875%, 09/15/2030(e) | |
| 125,000 | | |
| 128,069 | |
| Sunoco LP / Sunoco Finance Corp., 4.500%, 05/15/2029 | |
| 72,000 | | |
| 67,390 | |
| W&T Offshore, Inc., 11.750%, 02/01/2026(e) | |
| 50,000 | | |
| 51,474 | |
| | |
| | | |
| 2,565,926 | |
| | |
| | | |
| | |
| Paper & Forest Products - 0.08% | |
| | | |
| | |
| Mativ Holdings, Inc., 6.875%, 10/01/2026(e) | |
| 80,000 | | |
| 79,575 | |
| Mercer International, Inc., 5.125%, 02/01/2029 | |
| 68,000 | | |
| 59,915 | |
| | |
| | | |
| 139,490 | |
| | |
| | | |
| | |
| Passenger Airlines - 0.02% | |
| | | |
| | |
| American Airlines, Inc., 7.250%, 02/15/2028(e) | |
| 36,000 | | |
| 36,061 | |
| | |
| | | |
| | |
| Personal Care Products - 0.03% | |
| | | |
| | |
| Herbalife Nutrition, Ltd. / HLF Financing, Inc., 7.875%, 09/01/2025(e) | |
| 40,000 | | |
| 39,326 | |
| HLF Financing Sarl LLC / Herbalife International, Inc., 4.875%, 06/01/2029(e) | |
| 15,000 | | |
| 10,407 | |
| | |
| | | |
| 49,733 | |
| | |
| | | |
| | |
| Pharmaceuticals - 0.06% | |
| | | |
| | |
| Organon & Co. / Organon Foreign Debt Co-Issuer BV: | |
| | | |
| | |
| 6.750%, 05/15/2034(e) | |
| 63,000 | | |
| 62,991 | |
| 7.875%, 05/15/2034(e) | |
| 37,000 | | |
| 38,064 | |
| | |
| | | |
| 101,055 | |
| | |
| | | |
| | |
| Real Estate Management & Development - 0.19% | |
| | | |
| | |
| Howard Hughes Corp., 4.125%, 02/01/2029(e) | |
| 145,000 | | |
| 129,826 | |
| Landsea Homes Corp., 8.880%, 04/01/2029(e) | |
| 42,000 | | |
| 41,631 | |
| Newmark Group, Inc., 7.500%, 01/12/2029(e) | |
| 143,000 | | |
| 147,123 | |
| | |
| | | |
| 318,580 | |
See
Notes to Financial Statements.
| Semi-Annual
Report | June 30, 2024 |
49 |
| Blackstone
Long-Short Credit Income Fund |
Portfolio
of Investments |
June
30, 2024 (Unaudited)
| | |
Principal
Amount | | |
Value | |
| Semiconductors & Semiconductor Equipment - 0.06% | |
| | | |
| | |
| ams-OSRAM AG, 12.250%, 03/30/2029(e) | |
$ | 90,000 | | |
$ | 93,302 | |
| | |
| | | |
| | |
| Software - 0.28% | |
| | | |
| | |
| Fair Isaac Corp., 4.000%, 06/15/2028(e) | |
| 350,000 | | |
| 327,691 | |
| MicroStrategy, Inc., 6.125%, 06/15/2028(e) | |
| 150,000 | | |
| 145,540 | |
| | |
| | | |
| 473,231 | |
| | |
| | | |
| | |
| Specialized REITs - 0.10% | |
| | | |
| | |
| Uniti Group LP / Uniti Group Finance, Inc. / CSL Capital LLC, 6.500%, 02/15/2029(e) | |
| 270,000 | | |
| 172,467 | |
| | |
| | | |
| | |
| Specialty Retail - 0.41% | |
| | | |
| | |
| Asbury Automotive Group, Inc., 5.000%, 02/15/2032(e) | |
| 60,000 | | |
| 54,398 | |
| Bath & Body Works, Inc., 6.950%, 03/01/2033 | |
| 70,000 | | |
| 68,212 | |
| Foot Locker, Inc., 4.000%, 10/01/2029(e) | |
| 110,000 | | |
| 91,767 | |
| Gap, Inc.: | |
| | | |
| | |
| 3.625%, 10/01/2029(e) | |
| 166,000 | | |
| 143,860 | |
| 3.875%, 10/01/2031(e) | |
| 130,000 | | |
| 108,658 | |
| Sonic Automotive, Inc., 4.880%, 11/15/2031(e) | |
| 100,000 | | |
| 88,121 | |
| Upbound Group, Inc., 6.375%, 02/15/2029(e) | |
| 20,000 | | |
| 19,203 | |
| Victoria's Secret & Co., 4.625%, 07/15/2029(e) | |
| 149,000 | | |
| 124,005 | |
| | |
| | | |
| 698,224 | |
| | |
| | | |
| | |
| Technology Hardware, Storage & Peripherals - 0.18% | |
| | | |
| | |
| Xerox Holdings Corp., 5.500%, 08/15/2028(e) | |
| 356,000 | | |
| 306,966 | |
| | |
| | | |
| | |
| Textiles, Apparel & Luxury Goods - 0.12% | |
| | | |
| | |
| Crocs, Inc., 4.250%, 03/15/2029(e) | |
| 90,000 | | |
| 82,126 | |
| Wolverine World Wide, Inc., 4.000%, 08/15/2029(e) | |
| 140,000 | | |
| 117,322 | |
| | |
| | | |
| 199,448 | |
| | |
| | | |
| | |
| Tobacco - 0.12% | |
| | | |
| | |
| Vector Group, Ltd., 5.750%, 02/01/2029(e) | |
| 215,000 | | |
| 201,675 | |
| | |
| | | |
| | |
| TOTAL CORPORATE BONDS | |
| | | |
| | |
| (Cost $21,018,770) | |
| | | |
| 21,345,574 | |
| |
| Shares | | |
| Value | |
| COMMON STOCK - 0.21% | |
| | | |
| | |
| Health Care Equipment & Supplies - 0.07% | |
| | | |
| | |
| Carestream Health Holdings Inc(b)(f) | |
| 76,071 | | |
| 123,615 | |
| | |
| | | |
| | |
| Health Care Providers & Services - 0.14% | |
| | | |
| | |
| Envision Healthcare Corp. Equity(f) | |
| 23,801 | | |
| 236,027 | |
| | |
| | | |
| | |
| TOTAL COMMON STOCK | |
| | | |
| | |
| (Cost $2,238,878) | |
| | | |
| 359,642 | |
| | |
| | | |
| | |
| SHORT
TERM INVESTMENTS - 2.95% | |
| | | |
| | |
| Open-end
Investment Companies - 2.95% | |
| | | |
| | |
See
Notes to Financial Statements.
| 50 | www.blackstone-credit.com |
| Blackstone
Long-Short Credit Income Fund |
Portfolio
of Investments |
June
30, 2024 (Unaudited)
| | |
Shares | | |
Value | |
| Fidelity
Treasury Portfolio | |
| | |
| |
| (5.20%
7-Day Yield) | |
| 4,969,233 | | |
$ | 4,969,233 | |
| | |
| | | |
| | |
| TOTAL
SHORT TERM INVESTMENTS | |
| | | |
| | |
| (Cost
$4,969,233) | |
| | | |
| 4,969,233 | |
| | |
| | | |
| | |
| Total
Investments- 153.35% | |
| | | |
| | |
| (Cost $263,313,891) | |
| | | |
| 258,686,798 | |
| | |
| | | |
| | |
| Liabilities
in Excess of Other Assets - (6.40)% | |
| | | |
| (10,800,445 | ) |
| | |
| | | |
| | |
| Leverage
Facility - (46.95)% | |
| | | |
| (79,200,000 | ) |
| |
| | | |
| | |
| Net
Assets - 100.00% | |
| | | |
$ | 168,686,352 | |
Amounts
above are shown as a percentage of net assets as of June 30, 2024.
Investment
Abbreviations:
LIBOR
- London Interbank Offered Rate
SOFR
- Secured Overnight Financing Rate
Reference
Rates:
1M
US L - 1 Month LIBOR as of June 30, 2024 was 5.45%
3M US L - 3 Month LIBOR as of June 30, 2024 was 5.59%
6M US L - 6 Month LIBOR
as of June 30, 2024 was 5.68%
1M US SOFR- 1 Month SOFR as of June 30, 2024 was 5.34%
3M US SOFR - 3 Month SOFR as of June 30,
2024 was 5.32%
6M
US SOFR - 6 Month SOFR as of June 30, 2024 was 5.25%
1M
CME TERM SOFR - 1 Month CME TERM SOFR as of June 30, 2024 was 5.34%
3M CME TERM SOFR - 3 Month CME TERM SOFR as of June 30, 2024
was 5.32%
6M CME TERM SOFR - 6 Month CME TERM SOFR as of June 30, 2024 was 5.25%
PRIME - US Prime Rate as of June 30, 2024 was
8.50%
| (a) | Floating
or variable rate security. The reference rate is described above. The rate in effect
as of June 30, 2024 is based on the reference rate plus the displayed spread as of the
security's last reset date. Where applicable, the reference rate is subject to a floor
rate. |
| (b) | Level
3 assets valued using significant unobservable inputs as a result of unavailable quoted
prices from an active market or the unavailability of other significant observable inputs.
|
| (c) | A
portion of this position was not funded as of June 30, 2024. The Portfolio of Investments
records only the funded portion of each position. As of June 30, 2024, the Fund has unfunded
delayed draw loans in the amount of $406,838. Fair value of these unfunded delayed draws
was $408,879. Additional information is provided in Note 9 General Commitments and Contingencies.
|
| (d) | Represents
a payment-in-kind (“PIK”) security which may pay interest/dividend in additional
par/shares. |
| (e) | Security
exempt from registration under Rule 144A of the Securities Act of 1933. Total market
value of Rule 144A securities amounts to $30,583,090, which represented approximately
18.13% of net assets as of June 30, 2024. Such securities may normally be sold to qualified
institutional buyers in transactions exempt from registration. |
| (f) | Non-income
producing security. |
See
Notes to Financial Statements.
| Semi-Annual
Report | June 30, 2024 |
51 |
| Blackstone
Strategic Credit 2027 Term Fund |
Portfolio
of Investments |
June
30, 2024 (Unaudited)
| | |
Principal
Amount | | |
Value | |
| FLOATING RATE LOAN INTERESTS(a) - 137.26% | |
| | | |
| | |
| Aerospace & Defense - 4.25% | |
| | | |
| | |
| Atlas CC Acquisition Corp., First Lien B Term Loan, 3M CME TERM SOFR + 4.25%, 0.75% Floor, 05/25/2028 | |
$ | 4,234,458 | | |
$ | 3,141,142 | |
| Atlas CC Acquisition Corp., First Lien C Term Loan, 3M CME TERM SOFR + 4.25%, 0.75% Floor, 05/25/2028 | |
| 859,032 | | |
| 637,234 | |
| Dynasty Acquisition Co Inc., First Lien Term Loan, 1M US SOFR + 3.50%, 08/24/2028 | |
| 476,516 | | |
| 481,270 | |
| KBR, Inc. TLB 1L, First Lien Term Loan, 1M CME TERM SOFR + 2.25%, 01/17/2031 | |
| 294,012 | | |
| 295,740 | |
| Nordam Group LLC, First Lien Initial Term Loan, 1M US SOFR + 5.50%, 04/09/2026 | |
| 4,548,000 | | |
| 4,388,820 | |
| Novaria Holdings, LLC, First Lien Term Loan, 1M US SOFR + 4.25%, 06/05/2031(b) | |
| 1,750,000 | | |
| 1,763,125 | |
| Peraton Corp., First Lien B Term Loan, 1M US SOFR + 3.75%, 0.75% Floor, 02/01/2028 | |
| 7,162,689 | | |
| 7,172,181 | |
| Standard Aero, Ltd., First Lien Term Loan, 1M US SOFR + 3.50%, 08/24/2028 | |
| 183,732 | | |
| 185,678 | |
| TransDigm Inc, First Lien Term Loan, 6M CME TERM SOFR + 2.75%, 02/28/2031 | |
| 2,843,348 | | |
| 2,852,589 | |
| TransDigm, Inc., First Lien Term Loan, 3M CME TERM SOFR + 2.75%, 03/22/2030 | |
| 289,918 | | |
| 290,795 | |
| Vertex Aerospace Services Corp aka V2X, First Lien Term Loan, 6M CME TERM SOFR + 3.00%, 12/06/2030 | |
| 1,764,135 | | |
| 1,768,387 | |
| World Wide Technology Holding Co LLC, First Lien Term Loan, 3M CME TERM SOFR + 3.50%, 0.50% Floor, 04/21/2031 | |
| 1,264,761 | | |
| 1,272,665 | |
| | |
| | | |
| 24,249,626 | |
| Air Freight & Logistics - 2.20% | |
| | | |
| | |
| ASP LS Acquisition Corp., First Lien Term Loan, 3M CME TERM SOFR + 4.50%, 0.75% Floor, 05/07/2028 | |
| 1,543,845 | | |
| 1,319,779 | |
| Clue Opco LLC, First Lien Term Loan, 3M CME TERM SOFR + 4.50%, 12/19/2030 | |
| 3,483,333 | | |
| 3,257,352 | |
| Rinchem Company, Inc., First Lien Term Loan, 3M CME TERM SOFR + 4.25%, 03/02/2029 | |
| 4,308,230 | | |
| 3,732,306 | |
| Savage Enterprises LLC, First Lien Term Loan, 3M US L + 3.25%, 0.50% Floor, 09/15/2028 | |
| 1,891,278 | | |
| 1,897,935 | |
| WWEX UNI TopCo Holdings LLC, First Lien Initial Term Loan, 3M CME TERM SOFR + 4.00%, 0.75% Floor, 07/26/2028 | |
| 2,315,547 | | |
| 2,325,157 | |
| | |
| | | |
| 12,532,529 | |
| Automobile Components - 3.05% | |
| | | |
| | |
| Belron Finance US LLC, First Lien Term Loan, 3M CME TERM SOFR + 2.25%, 0.50% Floor, 04/18/2029 | |
| 1,065,610 | | |
| 1,069,382 | |
| Clarios Glob LP, First Lien Term Loan, 6M CME TERM SOFR + 2.75%, 06/05/2030 | |
| 4,140,177 | | |
| 4,155,061 | |
| First Brands Group LLC, First Lien Term Loan, 3M CME TERM SOFR + 5.00%, 1.00% Floor, 03/30/2027 | |
| 3,069,162 | | |
| 3,055,735 | |
| First Brands Group, LLC, First Lien 2018 New Tranche E Term Loan, 3M CME TERM SOFR + 5.00%, 03/30/2027 | |
| 2,909,058 | | |
| 2,894,978 | |
| LTI Holdings, Inc., First Lien Initial Term Loan, 1M CME TERM SOFR + 3.50%, 09/06/2025 | |
| 3,832,445 | | |
| 3,784,233 | |
| LTI Holdings, Inc., First Lien Term Loan, 1M US SOFR + 4.75%, 07/24/2026 | |
| 1,209,973 | | |
| 1,199,314 | |
| LTI Holdings, Inc., Second Lien Initial Term Loan, 1M US SOFR + 6.75%, 09/06/2026 | |
| 1,276,596 | | |
| 1,211,170 | |
| | |
| | | |
| 17,369,873 | |
| Beverages - 0.52% | |
| | | |
| | |
| Triton Water Holdings, Inc., First Lien Initial Term Loan, 3M CME TERM SOFR + 3.25%, 0.50% Floor, 03/31/2028 | |
| 2,982,261 | | |
| 2,986,734 | |
| | |
| | | |
| | |
| Biotechnology - 0.77% | |
| | | |
| | |
| Grifols Worldwide Operations, First Lien Term Loan, 1M US SOFR + 2.00%, 11/15/2027 | |
| 4,453,982 | | |
| 4,387,172 | |
| | |
| | | |
| | |
| Broadline Retail - 0.20% | |
| | | |
| | |
| Peer Hldg III BV, First Lien Term Loan, 6M CME TERM SOFR + 3.00%, 06/23/2031 | |
| 1,132,635 | | |
| 1,135,235 | |
| | |
| | | |
| | |
| Building Products - 3.90% | |
| | | |
| | |
| Gulfside Supply Inc, First Lien Term Loan, 6M CME TERM SOFR + 3.50%, 05/29/2031(b) | |
| 840,627 | | |
| 842,203 | |
| LBM Acquisition LLC, First Lien Term Loan, 1M US SOFR + 3.75%, 05/30/2031 | |
| 4,452,581 | | |
| 4,384,234 | |
See
Notes to Financial Statements.
| 52 |
www.blackstone-credit.com |
| Blackstone
Strategic Credit 2027 Term Fund |
Portfolio
of Investments |
June
30, 2024 (Unaudited)
| | |
Principal
Amount | | |
Value | |
| Building Products (continued) | |
| | |
| |
| LHS Borrower, LLC, First Lien Term Loan, 1M US SOFR + 4.75%, 0.50% Floor, 02/16/2029 | |
$ | 2,604,153 | | |
$ | 2,471,341 | |
| Miter Brands Acquisition Holdco Inc., First Lien Term Loan, 1M US SOFR + 3.50%, 03/28/2031 | |
| 2,739,588 | | |
| 2,759,573 | |
| Oscar Acquisitionco LLC, First Lien Term Loan, 3M CME TERM SOFR + 4.25%, 0.50% Floor, 04/29/2029 | |
| 4,398,555 | | |
| 4,401,656 | |
| Resideo Funding Inc, First Lien Term Loan, 6M CME TERM SOFR + 2.25%, 06/13/2031 | |
| 485,300 | | |
| 485,302 | |
| Tailwind Smith Cooper Intermediate Corp., First Lien Initial Term Loan, 3M CME TERM SOFR + 5.00%, 05/28/2026 | |
| 4,426,752 | | |
| 4,429,519 | |
| Trulite Holding Corp., First Lien Term Loan, 1M US SOFR + 6.00%, 03/01/2030 | |
| 2,556,993 | | |
| 2,486,676 | |
| | |
| | | |
| 22,260,504 | |
| Capital Markets - 5.65% | |
| | | |
| | |
| Apex Group Treasury, Ltd., First Lien USD Term Loan, 3M CME TERM SOFR + 3.75%, 0.50% Floor, 07/27/2028 | |
| 4,786,578 | | |
| 4,798,545 | |
| AssetMark 6/24 TLB 1L, First Lien Term Loan, 6M CME TERM SOFR + 3.25%, 06/03/2031 | |
| 1,953,165 | | |
| 1,956,828 | |
| Cetera Financial 5/24 TLB 1L, First Lien Term Loan, 3M CME TERM SOFR + 9.34%, 08/09/2030 | |
| 4,445,338 | | |
| 4,468,032 | |
| Citadel Securities LP, First Lien Term Loan, 1M US SOFR + 2.25%, 07/29/2030 | |
| 1,228,260 | | |
| 1,233,173 | |
| CITCO FDG LLC, First Lien Term Loan, 3M CME TERM SOFR + 2.75%, 04/27/2028 | |
| 5,671,283 | | |
| 5,697,286 | |
| CPI Holdco B LLC, First Lien Term Loan, 1M US SOFR + 2.00%, 05/17/2031 | |
| 1,626,572 | | |
| 1,626,832 | |
| Edelman Financial Engines Center LLC, First Lien Term Loan, 1M US SOFR + 3.25%, 04/07/2028 | |
| 195,750 | | |
| 196,255 | |
| Focus Financial Partners LLC, First Lien Term Loan, 1M US SOFR + 2.50%, 0.50% Floor, 06/30/2028 | |
| 4,669,064 | | |
| 4,670,161 | |
| Focus Financial Partners, LLC, First Lien Term Loan, 1M US SOFR + 2.75%, 06/30/2028 | |
| 1,564,119 | | |
| 1,564,345 | |
| Kestra Advisor Services Holdings A INC, First Lien Term Loan, 1M US SOFR + 4.00%, 03/22/2031 | |
| 1,727,890 | | |
| 1,736,314 | |
| Osaic Holdings Inc aka Advisor Group, First Lien Term Loan, 1M US SOFR + 4.00%, 08/17/2028 | |
| 4,235,674 | | |
| 4,253,951 | |
| | |
| | | |
| 32,201,722 | |
| Chemicals - 2.08% | |
| | | |
| | |
| CI Maroon Holdings LLC, First Lien Term Loan, 3M CME TERM SOFR + 4.00%, 03/01/2031 | |
| 1,044,000 | | |
| 1,050,525 | |
| Ecovyst Catalyst Technologies LLC, First Lien Term Loan, 6M CME TERM SOFR + 2.25%, 06/12/2031 | |
| 4,245,123 | | |
| 4,249,283 | |
| Geon Performance 4/24 TLB 1L, First Lien Term Loan, 6M CME TERM SOFR + 4.25%, 08/18/2028 | |
| 3,021,219 | | |
| 3,038,229 | |
| Nouryon USA Ltarfruit US TLB 1L, First Lien Term Loan, 3M CME TERM SOFR + 3.50%, 04/03/2028 | |
| 3,523,375 | | |
| 3,537,028 | |
| | |
| | | |
| 11,875,065 | |
| Commercial Services & Supplies - 6.74% | |
| | | |
| | |
| Action Environmental Group, Inc., First Lien Term Loan: | |
| | | |
| | |
| 6M CME TERM SOFR + 4.00%, 0.50% Floor, 10/24/2030(b) | |
| 298,620 | | |
| 300,860 | |
| 6M CME TERM SOFR + 4.00%, 0.50% Floor, 10/24/2030(b) | |
| 398,160 | | |
| 401,146 | |
| 6M CME TERM SOFR + 4.25%, 0.50% Floor, 10/24/2030(b) | |
| 1,872,283 | | |
| 1,886,325 | |
| Allied Universal Holdco LLC, First Lien Initial U.S. Dollar Term Loan, 1M US SOFR + 3.75%, 0.50% Floor, 05/12/2028 | |
| 5,970,552 | | |
| 5,954,342 | |
| Aramark 3/24 B8 TL 1L, First Lien Term Loan, 1M CME TERM SOFR + 2.00%, 06/22/2030 | |
| 118,007 | | |
| 118,346 | |
| Aramark Intermediate HoldCo Corp., First Lien U.S. B-4 Term Loan, 1M US SOFR + 1.75%, 01/15/2027 | |
| 1,500,000 | | |
| 1,501,687 | |
| Belfor Holdings, Inc., First Lien Term Loan, 1M US SOFR + 3.75%, 0.50% Floor, 11/01/2030 | |
| 783,393 | | |
| 789,269 | |
| Equiniti Group PLC, First Lien Term Loan, 6M CME TERM SOFR + 4.50%, 12/11/2028 | |
| 2,076,273 | | |
| 2,087,952 | |
| Garda World Security Corp., First Lien Term Loan, 3M CME TERM SOFR + 4.25%, 02/01/2029 | |
| 5,505,648 | | |
| 5,546,941 | |
| GFL Environmental, Inc., First Lien Term Loan, 6M US L + 0.00%, 0.50% Floor, 06/27/2031(b) | |
| 525,000 | | |
| 526,312 | |
See
Notes to Financial Statements.
| Semi-Annual Report
| June 30, 2024 |
53 |
| Blackstone
Strategic Credit 2027 Term Fund |
Portfolio
of Investments |
June
30, 2024 (Unaudited)
| | |
Principal
Amount | | |
Value | |
| Commercial Services & Supplies (continued) | |
| | |
| |
| Justrite Safety Group, First Lien Delayed Draw Term Loan, 1M US SOFR + 4.50%, 06/28/2026 | |
$ | 218,946 | | |
$ | 219,084 | |
| Justrite Safety Group, First Lien Initial Term Loan, 1M US SOFR + 4.50%, 06/28/2026 | |
| 4,049,793 | | |
| 4,052,344 | |
| Omnia Partners, LLC, First Lien Term Loan, L + 3.75%, 07/25/2030 | |
| 3,796,295 | | |
| 3,802,806 | |
| Prime Sec Services Borrower LLC, TL, First Lien Term Loan, 3M CME TERM SOFR + 2.25%, 10/13/2030 | |
| 3,714,390 | | |
| 3,716,990 | |
| Strategic Materials Holding Corp., Second Lien Initial Term Loan, 3M CME TERM SOFR + 7.75%, 1.00% Floor, 10/31/2025(b) | |
| 2,666,667 | | |
| 53,333 | |
| TMF Sapphire US LLC aka TMF Group TLB 1L, First Lien Term Loan 05/03/2028 | |
| 846,655 | | |
$ | 849,965 | |
| TRC Companies, First Lien Term Loan, 1M US SOFR + 3.75%, 12/08/2028 | |
| 3,453,036 | | |
| 3,464,690 | |
| United Site Cov-Lite, First Lien Term Loan, 3M CME TERM SOFR + 4.25%, 12/15/2028 | |
| 3,130,351 | | |
| 2,095,598 | |
| Vestis Corp, First Lien Term Loan, 3M CME TERM SOFR + 2.25%, 02/22/2031 | |
| 1,058,323 | | |
| 1,054,577 | |
| | |
| | | |
| 38,422,567 | |
| Communications Equipment - 0.05% | |
| | | |
| | |
| MLN US HoldCo LLC, First Lien B Term Loan, 3M CME TERM SOFR + 4.50%, 11/30/2025 | |
| 2,330,432 | | |
| 262,174 | |
| | |
| | | |
| | |
| Construction & Engineering - 1.84% | |
| | | |
| | |
| Amentum Government Services Holdings LLC, First Lien Term Loan, 1M US SOFR + 4.00%, 02/15/2029 | |
| 2,296,823 | | |
| 2,309,743 | |
| Artera Services LLC aka PowerTeam, First Lien Term Loan, 3M CME TERM SOFR + 4.50%, 02/15/2031 | |
| 873,268 | | |
| 878,958 | |
| Azuria Water Solutions Inc aka Aegion TLB 1L, First Lien Term Loan 05/17/2028 | |
| 4,500,334 | | |
| 4,524,051 | |
| Groundworks LLC, First Lien Term Loan: | |
| | | |
| | |
| 1M US SOFR + 3.50%, 03/14/2031 | |
| 1,465,414 | | |
| 1,466,330 | |
| 6M CME TERM SOFR + 4.00%, 03/14/2031(c) | |
| 43,153 | | |
| 43,180 | |
| Touchdown Acquirer Inc aka TenCate, First Lien Term Loan, 3M CME TERM SOFR + 4.00%, 02/21/2031 | |
| 1,142,621 | | |
| 1,149,408 | |
| Tutor Perini Corp., First Lien B Term Loan, 1M US SOFR + 4.75%, 1.00% Floor, 08/18/2027 | |
| 125,192 | | |
| 125,635 | |
| | |
| | | |
| 10,497,305 | |
| Construction Materials - 0.69% | |
| | | |
| | |
| Quikrete Holdings, Inc., First Lien Term Loan, 1M US SOFR + 2.50%, 04/14/2031 | |
| 2,622,610 | | |
| 2,631,487 | |
| Summit Materials LLC, First Lien Term Loan, 3M CME TERM SOFR + 2.50%, 01/12/2029 | |
| 582,171 | | |
| 586,901 | |
| Tamko Building Products LLC, First Lien Term Loan, 1M US SOFR + 3.25%, 09/20/2030 | |
| 733,993 | | |
| 734,911 | |
| | |
| | | |
| 3,953,299 | |
| Containers & Packaging - 3.04% | |
| | | |
| | |
| Altium Packaging LLC, First Lien Term Loan, 1M US SOFR + 2.50%, 06/11/2031 | |
| 421,875 | | |
| 421,875 | |
| Anchor Packaging LLC, First Lien Term Loan, 1M US SOFR + 3.75%, 07/18/2029 | |
| 1,323,000 | | |
| 1,325,600 | |
| Berlin Packaging LLC, First Lien Term Loan, 6M CME TERM SOFR + 4.00%, 06/07/2031 | |
| 1,845,887 | | |
| 1,852,181 | |
| ProAmpac PG Borrower LLC, First Lien Term Loan, 3M CME TERM SOFR + 4.00%, 0.75% Floor, 09/15/2028 | |
| 1,921,556 | | |
| 1,928,521 | |
| Supplyone 3/24, First Lien Term Loan, 6M CME TERM SOFR + 4.50%, 04/19/2031 | |
| 2,474,783 | | |
| 2,481,749 | |
| Tricorbraun Holdings, Inc., First Lien Closing Date Initial Term Loan, 1M CME TERM SOFR + 3.25%, 0.50% Floor, 03/03/2028 | |
| 4,556,479 | | |
| 4,555,066 | |
| Trident TPI Holdings, Inc., First Lien Term Loan, 3M CME TERM SOFR + 9.33%, 0.50% Floor, 09/15/2028 | |
| 4,730,949 | | |
| 4,743,770 | |
| | |
| | | |
| 17,308,762 | |
| Distributors - 1.57% | |
| | | |
| | |
| Burgess Point Purchaser Corp., First Lien Term Loan, 1M US SOFR + 5.25%, 07/25/2029 | |
| 4,259,140 | | |
| 4,139,351 | |
| Johnstone Supply LLC, First Lien Term Loan, 3M CME TERM SOFR + 3.00%, 05/16/2031 | |
| 1,754,108 | | |
| 1,758,494 | |
See
Notes to Financial Statements.
| 54 |
www.blackstone-credit.com |
| Blackstone
Strategic Credit 2027 Term Fund |
Portfolio
of Investments |
June
30, 2024 (Unaudited)
| | |
Principal
Amount | | |
Value | |
| Distributors (continued) | |
| | |
| |
| S&S Holdings LLC, First Lien Initial Term Loan, 1M US SOFR + 5.00%, 0.50% Floor, 03/11/2028 | |
$ | 3,039,476 | | |
$ | 3,047,075 | |
| | |
| | | |
| 8,944,920 | |
| Diversified Consumer Services - 3.52% | |
| | | |
| | |
| Cengage Learning, Inc., First Lien Term Loan, 6M CME TERM SOFR + 4.25%, 1.00% Floor, 03/24/2031 | |
| 2,277,487 | | |
| 2,286,745 | |
| Fugue Finance LLC aka Nord Anglia, First Lien Term Loan, 3M CME TERM SOFR + 3.75%, 02/26/2031 | |
| 962,220 | | |
| 971,482 | |
| Imagine Learning LLC, First Lien Term Loan, 1M US SOFR + 3.50%, 12/21/2029 | |
| 3,241,875 | | |
| 3,245,409 | |
| Loyalty Ventures, Inc., First Lien Term Loan, 3M Prime + 3.50%, 11/03/2027(b) | |
| 1,353,511 | | |
| 13,535 | |
| McKissock Investment Holdings, LLC, First Lien Term Loan, 3M CME TERM SOFR + 5.00%, 03/12/2029 | |
| 2,879,496 | | |
| 2,894,196 | |
| Mister Car Wash 3/24, First Lien Term Loan, 1M US SOFR + 3.00%, 03/27/2031 | |
| 1,080,132 | | |
| 1,084,663 | |
| Spring Education Group, Inc., First Lien Term Loan, 3M CME TERM SOFR + 4.00%, 10/04/2030 | |
| 2,729,509 | | |
| 2,746,282 | |
| TruGreen LP, First Lien Term Loan, 1M US SOFR + 4.00%, 0.75% Floor, 11/02/2027 | |
| 1,399,644 | | |
| 1,352,056 | |
| Univ Support Services LLC, First Lien Term Loan, 6M CME TERM SOFR + 2.75%, 02/10/2029 | |
| 3,036,806 | | |
| 3,038,704 | |
| Wand NewCo 3 Inc aka Caliber Collision, First Lien Term Loan, 1M US SOFR + 3.75%, 01/30/2031 | |
| 2,402,476 | | |
| 2,421,131 | |
| | |
| | | |
| 20,054,203 | |
| Diversified REITs - 0.38% | |
| | | |
| | |
| Iron Mountain Information Management LLC, First Lien Term Loan, 3M CME TERM SOFR + 2.25%, 01/31/2031 | |
| 1,324,465 | | |
| 1,320,597 | |
| Opry Entertainment/OEG, First Lien Term Loan, 6M CME TERM SOFR + 3.75%, 06/25/2031(b) | |
| 841,151 | | |
| 843,254 | |
| | |
| | | |
| 2,163,851 | |
| Diversified Telecommunication Services - 3.55% | |
| | | |
| | |
| Coral-US Co-Borrower LLC, First Lien B-5 Term Loan, 1M US SOFR + 2.25%, 01/31/2028 | |
| 2,573,075 | | |
| 2,491,457 | |
| Level 3 Financing Inc., First Lien Term Loan: | |
| | | |
| | |
| 1M US SOFR + 6.56%, 04/15/2029 | |
| 1,259,453 | | |
| 1,236,040 | |
| 1M US SOFR + 6.56%, 04/15/2030 | |
| 1,268,693 | | |
| 1,238,244 | |
| Lorca Finco PLC, First Lien Term Loan, 6M CME TERM SOFR + 3.50%, 04/17/2031 | |
| 1,050,000 | | |
| 1,053,938 | |
| Lumen Technologies Inc, First Lien Term Loan, 1M US SOFR + 2.25%, 04/15/2029 | |
| 3,838 | | |
| 2,660 | |
| Lumen Technologies, Inc., First Lien Term Loan, 1M US SOFR + 6.00%, 06/01/2028 | |
| 124,278 | | |
| 103,565 | |
| Radiate Holdco, LLC,, First Lien Term Loan, 1M US SOFR + 3.25%, 09/25/2026 | |
| 3,929,471 | | |
| 3,193,520 | |
| Telenet Financing USD LLC, First Lien Term Loan, 1M US SOFR + 2.00%, 04/30/2028 | |
| 3,116,588 | | |
| 2,973,100 | |
| UPC Financing Partnership, First Lien Facility AT Term Loan, 1M US SOFR + 2.25%, 04/30/2028 | |
| 4,447,467 | | |
| 4,376,375 | |
| Zacapa S.A.R.L., First Lien Term Loan, 3M CME TERM SOFR + 4.00%, 03/22/2029 | |
| 3,568,147 | | |
| 3,569,824 | |
| | |
| | | |
| 20,238,723 | |
| Electric Utilities - 1.48% | |
| | | |
| | |
| Generation Bridge Northeast LLC, First Lien Term Loan, 1M US SOFR + 3.50%, 08/22/2029 | |
| 1,727,243 | | |
| 1,740,197 | |
| NRG Energy 3/24 Cov-Lite, First Lien Term Loan, 1M US SOFR + 2.00%, 04/16/2031 | |
| 2,607,383 | | |
| 2,610,968 | |
| Vistra Operations Co. LLC, First Lien 2018 Incremental Term Loan, 1M US SOFR + 2.00%, 12/20/2030 | |
| 4,073,647 | | |
| 4,081,509 | |
| | |
| | | |
| 8,432,674 | |
| Electrical Equipment - 1.00% | |
| | | |
| | |
| Generac Power 6/24 TL, First Lien Term Loan 02/12/2031(b) | |
| 4,000,000 | | |
| 4,010,000 | |
| WEC US Holdings Ltd., First Lien Term Loan, 1M US SOFR + 2.75%, 01/27/2031 | |
| 1,715,024 | | |
| 1,718,617 | |
| | |
| | | |
| 5,728,617 | |
See
Notes to Financial Statements.
| Semi-Annual Report
| June 30, 2024 |
55 |
| Blackstone
Strategic Credit 2027 Term Fund |
Portfolio
of Investments |
June
30, 2024 (Unaudited)
| | |
Principal
Amount | | |
Value | |
| Electronic Equipment, Instruments & Components - 2.43% | |
| | |
| |
| Celestica 5/24 TLB 1L, First Lien Term Loan, 1M US SOFR + 1.75%, 05/23/2031 | |
$ | 638,514 | | |
$ | 638,514 | |
| Coherent Corp., First Lien Term Loan, 1M US SOFR + 2.50%, 0.50% Floor, 07/02/2029 | |
| 4,623,800 | | |
| 4,633,048 | |
| DG Investment Intermediate Holdings 2, Inc., Second Lien Initial Term Loan, 1M US SOFR + 6.75%, 0.75% Floor, 03/30/2029 | |
| 1,885,714 | | |
| 1,853,601 | |
| Discovery Energy Corp., First Lien Term Loan, 3M CME TERM SOFR + 4.75%, 05/01/2031 | |
| 2,219,467 | | |
| 2,231,607 | |
| Mirion Technologies US, Inc., First Lien Term Loan, 3M CME TERM SOFR + 2.25%, 0.50% Floor,
10/20/2028 | |
| 4,490,471 | | |
| 4,502,415 | |
| | |
| | | |
| 13,859,185 | |
| Energy Equipment & Services - 0.36% | |
| | | |
| | |
| Ursa Minor US Bidco LLC aka Rosen, First Lien Term Loan, 3M CME TERM SOFR + 3.50%, 03/26/2031 | |
| 2,045,815 | | |
| 2,062,018 | |
| | |
| | | |
| | |
| Entertainment - 1.76% | |
| | | |
| | |
| CE Intermediate I LLC, First Lien Term Loan, 3M CME TERM SOFR + 3.50%, 0.50% Floor, 11/10/2028 | |
| 2,493,711 | | |
| 2,502,289 | |
| EP Purcasher, LLC, First Lien Term Loan, 3M CME TERM SOFR + 3.50%, 11/06/2028 | |
| 3,018,739 | | |
| 3,024,143 | |
| Live Nation Entertainment, Inc., First Lien Term Loan, 1M CME TERM SOFR + 1.75%, 10/19/2026 | |
| 4,528,682 | | |
| 4,531,513 | |
| | |
| | | |
| 10,057,945 | |
| Financial Services - 1.24% | |
| | | |
| | |
| Mitchell International, First Lien Term Loan, 6M CME TERM SOFR + 3.25%, 06/17/2031 | |
| 5,336,249 | | |
| 5,297,508 | |
| Planet US Buyer, LLC, First Lien Term Loan, 3M CME TERM SOFR + 3.50%, 02/07/2031 | |
| 1,785,756 | | |
| 1,799,373 | |
| | |
| | | |
| 7,096,881 | |
| Food Products - 1.12% | |
| | | |
| | |
| CH Guenther 11/21, First Lien Term Loan, 3M CME TERM SOFR + 3.00%, 12/08/2028 | |
| 629,244 | | |
| 631,213 | |
| Froneri International, Ltd., First Lien Facility B2 Term Loan, 1M US SOFR + 2.25%, 01/29/2027 | |
| 3,140,402 | | |
| 3,142,192 | |
| Saratoga Food Specialties LLC, First Lien Term Loan, 3M CME TERM SOFR + 3.75%, 03/07/2029 | |
| 838,755 | | |
| 844,522 | |
| Snacking Investments BidCo Pty, Ltd., First Lien Initial US Term Loan, 3M CME TERM SOFR + 4.00%, 1.00% Floor, 12/18/2026 | |
| 1,751,492 | | |
| 1,755,871 | |
| | |
| | | |
| 6,373,798 | |
| Ground Transportation - 1.99% | |
| | | |
| | |
| Genesee & WY Inc, First Lien Term Loan, 3M CME TERM SOFR + 2.00%, 04/10/2031 | |
| 6,469,107 | | |
| 6,469,721 | |
| Uber Technologies, Inc., First Lien Term Loan, 3M CME TERM SOFR + 2.75%, 03/03/2030 | |
| 3,656,806 | | |
| 3,678,619 | |
| XPO, Inc., First Lien Term Loan, 1M US SOFR + 2.00%, 05/24/2028 | |
| 1,196,000 | | |
| 1,200,898 | |
| | |
| | | |
| 11,349,238 | |
| Health Care Equipment & Supplies - 1.54% | |
| | | |
| | |
| Resonetics LLC, First Lien Term Loan, 3M CME TERM SOFR + 9.08%, 06/06/2031 | |
| 3,144,427 | | |
| 3,154,253 | |
| Siemens/SivantosWS Audiology, First Lien Term Loan, 6M CME TERM SOFR + 4.25%, 02/28/2029 | |
| 5,622,109 | | |
| 5,643,192 | |
| | |
| | | |
| 8,797,445 | |
| Health Care Providers & Services - 8.05% | |
| | | |
| | |
| DaVita, Inc., First Lien B Term Loan, 3M CME TERM SOFR + 1.75%, 08/12/2026 | |
| 1,909,496 | | |
| 1,911,091 | |
| Global Medical Response, Inc., First Lien Term Loan, 3M CME TERM SOFR + 5.50%, 1.00% Floor, 10/31/2028(d) | |
| 4,761,507 | | |
| 4,621,042 | |
| Heartland Dental LLC, First Lien Term Loan, 6M CME TERM SOFR + 4.50%, 0.75% Floor, 04/28/2028 | |
| 3,230,111 | | |
| 3,242,434 | |
See
Notes to Financial Statements.
| 56 |
www.blackstone-credit.com |
| Blackstone
Strategic Credit 2027 Term Fund |
Portfolio
of Investments |
June
30, 2024 (Unaudited)
| | |
Principal
Amount | | |
Value | |
| Health Care Providers & Services (continued) | |
| | |
| |
| IVI America LLC aka IVIRMA, First Lien Term Loan, 6M CME TERM SOFR + 4.50%, 04/18/2031 | |
$ | 1,450,000 | | |
$ | 1,460,650 | |
| MED ParentCo, LP, First Lien Term Loan, 1M US SOFR + 4.00%, 04/15/2031 | |
| 1,667,883 | | |
| 1,669,300 | |
| Medical Solutions LLC, First Lien Term Loan, 1M US SOFR + 3.25%, 11/01/2028 | |
| 3,584,066 | | |
| 2,732,205 | |
| Midwest Physcn Admin Srvcs LLC, First Lien Term Loan, 3M CME TERM SOFR + 3.25%, 03/12/2028 | |
| 4,439,908 | | |
| 3,901,569 | |
| NAPA Management Services Corp., First Lien Term Loan, 1M US SOFR + 5.25%, 0.75% Floor, 02/23/2029 | |
| 3,512,555 | | |
| 3,370,227 | |
| Onex TSG Intermediate Corp., First Lien Initial Term Loan, 3M CME TERM SOFR + 4.75%, 0.75% Floor, 02/28/2028 | |
| 4,338,056 | | |
| 4,334,433 | |
| Outcomes Group Holdings, Inc., First Lien Term Loan, 3M US L + 4.25%, 05/06/2031 | |
| 2,537,854 | | |
| 2,549,160 | |
| Pathway Vet Alliance LLC, First Lien 2021 Replacement Term Loan, 1M US SOFR + 3.75%, 03/31/2027 | |
| 4,401,534 | | |
| 3,478,863 | |
| Pediatric Associates Holding Co. LLC, First Lien Term Loan, 1M US SOFR + 3.25%, 0.50% Floor, 12/29/2028 | |
| 3,362,758 | | |
| 3,258,362 | |
| Radiology Partners Inc, First Lien Term Loan, 6M CME TERM SOFR + 5.00%, 01/31/2029 | |
| 4,749,111 | | |
| 4,516,405 | |
| Surgery Center Holdings Inc, First Lien Term Loan, 1M US SOFR + 2.75%, 12/19/2030 | |
| 980,019 | | |
| 983,758 | |
| U.S. Anesthesia Partners, Inc., First Lien Term Loan, 3M CME TERM SOFR + 4.25%, 0.50% Floor, 10/01/2028 | |
| 4,042,852 | | |
| 3,888,435 | |
| | |
| | | |
| 45,917,934 | |
| Health Care Technology - 2.65% | |
| | | |
| | |
| Cotiviti Inc., First Lien Term Loan, 6M US L + 0.00%, 05/01/2031 | |
| 6,388,733 | | |
| 6,366,116 | |
| Gainwell Acquisition Corp., First Lien Term Loan, 3M CME TERM SOFR + 4.00%, 0.75% Floor, 10/01/2027 | |
| 2,805,463 | | |
| 2,723,628 | |
| GHX Ultimate Parent Corp., First Lien Term Loan, 3M CME TERM SOFR + 4.00%, 0.50% Floor, 06/30/2027(b) | |
| 3,195,401 | | |
| 3,219,366 | |
| Project Ruby Ultimate Parent Corp., First Lien Closing Date Term Loan, 1M US SOFR + 3.25%, 0.75% Floor, 03/10/2028 | |
| 2,301,936 | | |
| 2,308,163 | |
| Waystar Technologies, Inc., First Lien Term Loan, 6M CME TERM SOFR + 3.00%, 10/22/2029 | |
| 480,329 | | |
| 481,529 | |
| | |
| | | |
| 15,098,802 | |
| Hotels, Restaurants & Leisure - 6.51% | |
| | | |
| | |
| 1011778 BC UNLIMITED LIABILITY CO, First Lien Term Loan, 1M US SOFR + 1.75%, 09/20/2030 | |
| 2,695,455 | | |
| 2,692,045 | |
| 1011778 BC Unlimited Liability Company, First Lien Term Loan, 3M CME TERM SOFR + 2.25%, 0.50% Floor, 09/20/2030 | |
| 2,593,829 | | |
| 2,590,548 | |
| Bally's Corp., First Lien Term Loan, 3M CME TERM SOFR + 3.25%, 0.50% Floor, 10/02/2028 | |
| 4,478,863 | | |
| 4,263,788 | |
| Caesars Entertainment, Inc., First Lien Term Loan: | |
| | | |
| | |
| 3M CME TERM SOFR + 2.75%, 0.50% Floor, 02/06/2030 | |
| 3,916,965 | | |
| 3,924,603 | |
| 3M CME TERM SOFR + 2.75%, 0.50% Floor, 02/06/2031 | |
| 2,806,155 | | |
| 2,811,851 | |
| Cedar Fair LP, First Lien Term Loan, 1M US SOFR + 2.00%, 05/01/2031 | |
| 1,088,681 | | |
| 1,088,175 | |
| Entain plc, First Lien Term Loan, 3M CME TERM SOFR + 2.75%, 10/31/2029 | |
| 3,798,799 | | |
| 3,809,645 | |
| Fertitta Entertainment, LLC, First Lien Term Loan, 1M US SOFR + 3.75%, 01/27/2029 | |
| 3,054,582 | | |
| 3,061,638 | |
| Flutter Financing B.V., First Lien Term Loan, 3M CME TERM SOFR + 2.25%, 11/25/2030 | |
| 4,878,745 | | |
| 4,887,405 | |
| Hilton Grand Vacations Borrower, LLC, First Lien Term Loan, 1M US SOFR + 2.75%, 01/17/2031 | |
| 2,499,822 | | |
| 2,502,947 | |
| IRB Holding Corporation, First Lien Term Loan, 1M US SOFR + 2.75%, 12/15/2027 | |
| 1,212,451 | | |
| 1,213,360 | |
| LC Ahab US Bidco LLC, First Lien Term Loan, 1M US SOFR + 3.50%, 05/01/2031 | |
| 1,004,582 | | |
| 1,007,726 | |
| OVG Business Services, LLC TLB 1L, First Lien Term Loan, 6M US L + 0.00%, 06/13/2031 | |
| 1,667,201 | | |
| 1,666,167 | |
| Tacala Investment Corp, First Lien Term Loan, 1M US SOFR + 4.00%, 01/31/2031 | |
| 1,597,764 | | |
| 1,606,591 | |
| | |
| | | |
| 37,126,489 | |
See
Notes to Financial Statements.
| Semi-Annual Report
| June 30, 2024 |
57 |
| Blackstone
Strategic Credit 2027 Term Fund |
Portfolio
of Investments |
June
30, 2024 (Unaudited)
| | |
Principal
Amount | | |
Value | |
| Household Durables - 0.86% | |
| | |
| |
| ACProducts Holdings, Inc., First Lien Term Loan, 3M US L + 4.25%, 0.50% Floor, 05/17/2028 | |
$ | 5,756,946 | | |
$ | 4,895,793 | |
| | |
| | | |
| | |
| Independent Power and Renewable Electricity Producers - 0.95% | |
| | | |
| | |
| Calpine Corp., First Lien Term Loan, 1M US SOFR + 2.00%, 01/31/2031 | |
| 5,415,368 | | |
| 5,404,646 | |
| | |
| | | |
| | |
| Insurance - 3.06% | |
| | | |
| | |
| AmWINS Group, Inc., First Lien Term Loan, 1M US SOFR + 2.25%, 0.75% Floor, 02/19/2028 | |
| 5,176,240 | | |
| 5,178,259 | |
| Baldwin Insurance Group Holdings LLC, First Lien Term Loan, 6M CME TERM SOFR + 3.50%, 05/26/2031(b) | |
| 2,509,873 | | |
| 2,513,011 | |
| BroadStreet Partners Inc, First Lien Term Loan, 6M CME TERM SOFR + 3.25%, 06/13/2031 | |
| 1,725,892 | | |
| 1,723,303 | |
| Hyperion Refinance Sarl, First Lien Term Loan: | |
| | | |
| | |
| 1M US SOFR + 4.00%, 0.50% Floor, 04/18/2030 | |
| 4,183,356 | | |
| 4,194,881 | |
| 1M US SOFR + 3.50%, 0.50% Floor, 02/15/2031 | |
| 1,386,645 | | |
| 1,391,380 | |
| Truist Insurance 3/24 2nd Lien Cov-Lite, Second Lien Term Loan, 3M CME TERM SOFR + 4.75%, 05/06/2032 | |
| 1,436,939 | | |
| 1,469,270 | |
| USI Inc/NY aka Compass Investors TLB, First Lien Term Loan, 3M CME TERM SOFR + 2.75%, 09/27/2030 | |
| 996,416 | | |
| 997,662 | |
| | |
| | | |
| 17,467,766 | |
| Interactive Media & Services - 0.34% | |
| | | |
| | |
| Foundational Education Group, Inc., First Lien Term Loan, 3M CME TERM SOFR + 3.75%, 08/31/2028(b) | |
| 106,740 | | |
| 104,071 | |
| LI Group Holdings, Inc., First Lien 2021 Term Loan, 1M US SOFR + 3.50%, 0.75% Floor, 03/11/2028(b) | |
| 1,854,688 | | |
| 1,859,325 | |
| | |
| | | |
| 1,963,396 | |
| IT Services - 5.03% | |
| | | |
| | |
| Access CIG LLC, First Lien Term Loan, 3M CME TERM SOFR + 5.00%, 0.50% Floor, 08/18/2028 | |
| 2,674,201 | | |
| 2,694,686 | |
| Ahead DB Holdings, LLC, First Lien Term Loan, 3M CME TERM SOFR + 4.25%, 02/01/2031 | |
| 1,392,000 | | |
| 1,398,313 | |
| Asurion LLC, Second Lien Term Loan, 1M US SOFR + 5.25%, 01/20/2029 | |
| 196,611 | | |
| 181,942 | |
| Chrysaor Bidco Sarl DDTL 1L, First Lien Term Loan, 6M CME TERM SOFR + 4.00%, 05/14/2031 | |
| 71,981 | | |
| 72,386 | |
| Chrysaor Bidco Sarl TLB 1L, First Lien Term Loan, 6M CME TERM SOFR + 4.00%, 05/14/2031 | |
| 973,306 | | |
| 978,786 | |
| Dcert Buyer, Inc., Second Lien First Amendment Refinancing Term Loan, 1M US SOFR + 7.00%, 02/19/2029 | |
| 5,863,456 | | |
| 5,262,452 | |
| Go Daddy Oper Co LLC, First Lien Term Loan, 1M US SOFR + 1.75%, 05/30/2031 | |
| 1,513,500 | | |
| 1,513,939 | |
| Newfold Digital Holdings Group, Inc., First Lien Initial Term Loan, 1M US SOFR + 3.50%, 0.75% Floor, 02/10/2028 | |
| 4,965,512 | | |
| 4,624,133 | |
| Presidio/Fortress Intermediate 4/24 TLB 1L, First Lien Term Loan, 6M CME TERM SOFR + 4.00%, 05/09/2031(b) | |
| 3,969,000 | | |
| 3,978,922 | |
| Skopima Merger Sub Inc., First Lien Initial Term Loan, 1M US SOFR + 4.00%, 05/12/2028 | |
| 3,262,483 | | |
| 3,263,935 | |
| Virtusa Corp., First Lien Term Loan, 1M US SOFR + 3.25%, 0.75% Floor, 02/15/2029 | |
| 3,526,070 | | |
| 3,539,839 | |
| World Wide Technology 3/24, First Lien Term Loan, 1M US SOFR + 2.75%, 03/01/2030(b) | |
| 1,142,655 | | |
| 1,148,368 | |
| | |
| | | |
| 28,657,701 | |
| Leisure Products - 0.08% | |
| | | |
| | |
| Amer Sports Co, First Lien Term Loan, 3M CME TERM SOFR + 3.25%, 02/17/2031(b) | |
| 437,319 | | |
| 440,599 | |
| | |
| | | |
| | |
| Life Sciences Tools & Services - 2.10% | |
| | | |
| | |
| Catalent Pharma Solutions, Inc., First Lien Term Loan, 1M US SOFR + 2.00%, 0.50% Floor, 02/22/2028 | |
| 4,446,871 | | |
| 4,450,206 | |
| Curia Global, Inc., First Lien 2021 Term Loan, 3M CME TERM SOFR + 3.75%, 0.75% Floor, 08/30/2026 | |
| 2,443,342 | | |
| 2,307,699 | |
| IQVIA INC., First Lien Term Loan, 3M CME TERM SOFR + 2.00%, 01/02/2031 | |
| 535,769 | | |
| 538,614 | |
See
Notes to Financial Statements.
| 58 |
www.blackstone-credit.com |
| Blackstone
Strategic Credit 2027 Term Fund |
Portfolio
of Investments |
June
30, 2024 (Unaudited)
| | |
Principal
Amount | | |
Value | |
| Life Sciences Tools & Services (continued) | |
| | |
| |
| Loire UK Midco 3, Ltd., First Lien Facility B2 Term Loan, 1M US SOFR + 3.75%, 0.75% Floor, 04/21/2027 | |
$ | 2,904,562 | | |
$ | 2,888,834 | |
| Parexel International Corporation, First Lien Term Loan, 1M US SOFR + 3.25%, 0.50% Floor, 11/15/2028 | |
| 1,798,769 | | |
| 1,804,669 | |
| | |
| | | |
| 11,990,022 | |
| Machinery - 6.69% | |
| | | |
| | |
| Asp Blade Holdings, Inc., First Lien Term Loan, 3M CME TERM SOFR + 4.00%, 0.50% Floor, 10/13/2028 | |
| 745,507 | | |
| 570,126 | |
| Bettcher Industries, Inc., First Lien Term Loan, 3M CME TERM SOFR + 4.00%, 12/14/2028 | |
| 2,418,712 | | |
| 2,414,177 | |
| Crosby US Acquisition corp., First Lien Term Loan, 1M US SOFR + 4.00%, 08/16/2029 | |
| 1,129,413 | | |
| 1,137,059 | |
| Engineered Machinery Holdings, Inc., First Lien Term Loan, 3M CME TERM SOFR + 3.75%, 0.75% Floor, 05/19/2028 | |
| 4,344,304 | | |
| 4,367,046 | |
| Hyperion Materials & Technologies, Inc., First Lien Initial Term Loan, 3M CME TERM SOFR + 4.50%, 0.50% Floor, 08/30/2028 | |
| 2,158,490 | | |
| 2,108,305 | |
| INNIO Group Hldg GmbH, First Lien Term Loan, 6M CME TERM SOFR + 3.50%, 11/02/2028 | |
| 521,908 | | |
| 523,703 | |
| LSF11 Trinity Bidco Inc, First Lien Term Loan, 3M CME TERM SOFR + 3.50%, 06/14/2030 | |
| 3,268,350 | | |
| 3,287,764 | |
| Osmosis Buyer Limited, First Lien Initial B Term Loan, 3M CME TERM SOFR + 4.00%, 0.50% Floor, 07/31/2028 | |
| 4,794,724 | | |
| 4,808,677 | |
| Pro Mach Group, Inc., First Lien Closing Date Initial Term Loan, 1M US SOFR + 3.50%, 1.00% Floor, 08/31/2028 | |
| 6,119,563 | | |
| 6,157,810 | |
| Project Castle, Inc., First Lien Term Loan, 3M CME TERM SOFR + 5.50%, 06/01/2029 | |
| 4,386,863 | | |
| 3,929,905 | |
| SPX FLOW Inc, First Lien Term Loan, 1M US SOFR + 3.50%, 04/05/2029 | |
| 1,161,062 | | |
| 1,169,097 | |
| TK Elevator Midco GmbH, First Lien Term Loan, 6M CME TERM SOFR + 3.50%, 04/30/2030 | |
| 3,303,890 | | |
| 3,325,051 | |
| Victory Buyer LLC, First Lien Term Loan, 3M CME TERM SOFR + 3.75%, 0.50% Floor, 11/19/2028 | |
| 4,502,705 | | |
| 4,345,110 | |
| | |
| | | |
| 38,143,830 | |
| Media - 1.57% | |
| | | |
| | |
| ABG Intermediate Holdings 2 LLC, First Lien Term Loan, 6M CME TERM SOFR + 2.75%, 12/21/2028 | |
| 703,795 | | |
| 705,336 | |
| American Greetings Corp., First Lien Term Loan, 1M US SOFR + 5.75%, 10/30/2029 | |
| 2,752,738 | | |
| 2,772,530 | |
| Cable One, Inc., First Lien Term Loan, 3M US L + 2.00%, 05/03/2028 | |
| 1,120,895 | | |
| 1,105,483 | |
| Cogeco Financing 2 LP, First Lien Term Loan, 3M CME TERM SOFR + 2.50%, 0.50% Floor, 09/01/2028 | |
| 634,408 | | |
| 615,036 | |
| Fleet Midco I Ltd., First Lien Term Loan, 1M US SOFR + 3.25%, 02/21/2031 | |
| 1,265,128 | | |
| 1,273,035 | |
| Univision Communications, Inc., First Lien Term Loan, 1M US SOFR + 3.25%, 0.75% Floor, 03/15/2026 | |
| 2,504,269 | | |
| 2,508,501 | |
| | |
| | | |
| 8,979,921 | |
| Metals & Mining - 0.18% | |
| | | |
| | |
| Arsenal AIC Parent, LLC, First Lien Term Loan, 1M US SOFR + 3.75%, 08/18/2030 | |
| 1,003,565 | | |
| 1,010,840 | |
| | |
| | | |
| | |
| Mortgage Real Estate Investment - 0.33% | |
| | | |
| | |
| Blackstone Mortgage Trust, Inc., First Lien Term Loan: | |
| | | |
| | |
| 1M US SOFR + 2.25%, 04/23/2026 | |
| 942,680 | | |
| 927,362 | |
| 1M US SOFR + 2.75%, 0.50% Floor, 04/23/2026 | |
| 942,944 | | |
| 931,157 | |
| | |
| | | |
| 1,858,519 | |
| Oil, Gas & Consumable Fuels - 1.44% | |
| | | |
| | |
| Buckeye Partners LP, First Lien Term Loan: | |
| | | |
| | |
| 1M US SOFR + 2.00%, 11/01/2026 | |
| 1,624,884 | | |
| 1,628,361 | |
| 3M CME TERM SOFR + 2.00%, 11/22/2030 | |
| 1,193,429 | | |
| 1,194,736 | |
| Freeport LNG, First Lien Term Loan, 3M CME TERM SOFR + 3.50%, 12/21/2028 | |
| 3,186,740 | | |
| 3,187,170 | |
See
Notes to Financial Statements.
| Semi-Annual Report
| June 30, 2024 |
59 |
| Blackstone
Strategic Credit 2027 Term Fund |
Portfolio
of Investments |
June
30, 2024 (Unaudited)
| | |
Principal
Amount | | |
Value | |
| Oil, Gas & Consumable Fuels (continued) | |
| | |
| |
| GIP Pilot Acquisition Partners LP, First Lien Term Loan, 3M CME TERM SOFR + 2.50%, 10/04/2030 | |
$ | 1,048,313 | | |
$ | 1,050,933 | |
| Whitewater Whistler Holdings LLC, First Lien Term Loan, 6M CME TERM SOFR + 2.25%, 02/15/2030 | |
| 1,171,201 | | |
| 1,172,911 | |
| | |
| | | |
| 8,234,111 | |
| Passenger Airlines - 1.31% | |
| | | |
| | |
| Air Canada, First Lien Term Loan, 3M CME TERM SOFR + 2.50%, 03/21/2031 | |
| 1,631,034 | | |
| 1,635,365 | |
| American Airlines, Inc., First Lien 2020 Term Loan, 6M CME TERM SOFR + 1.75%, 01/29/2027 | |
| 902,497 | | |
| 900,525 | |
| American Airlines, Inc., First Lien Term Loan, 1M US SOFR + 2.75%, 02/15/2028 | |
| 1,745,461 | | |
| 1,743,768 | |
| United Airlines, Inc. aka Continental, First Lien Term Loan, 1M US SOFR + 2.75%, 02/22/2031 | |
| 3,203,334 | | |
| 3,215,347 | |
| | |
| | | |
| 7,495,005 | |
| Pharmaceuticals - 1.55% | |
| | | |
| | |
| Elanco Animal Health, Inc., First Lien B Term Loan, 1M US SOFR + 1.75%, 08/01/2027 | |
| 5,086,610 | | |
| 5,074,300 | |
| Padagis LLC, First Lien Initial Term Loan, 3M CME TERM SOFR + 4.75%, 0.50% Floor, 07/06/2028(b) | |
| 3,823,033 | | |
| 3,746,572 | |
| | |
| | | |
| 8,820,872 | |
| Professional Services - 12.16% | |
| | | |
| | |
| AG Group Holdings, Inc., First Lien Term Loan, 1M US SOFR + 4.00%, 12/29/2028 | |
| 4,295,010 | | |
| 4,289,641 | |
| AlixPartners, LLP, First Lien USD B Term Loan, 1M US SOFR + 2.50%, 0.50% Floor, 02/04/2028 | |
| 3,104,650 | | |
| 3,110,471 | |
| Ankura Consulting Group LLC, First Lien Term Loan, 3M CME TERM SOFR + 4.25%, 0.75% Floor, 03/17/2028 | |
| 963,900 | | |
| 967,717 | |
| Cast & Crew LLC, First Lien Term Loan, 1M US SOFR + 3.75%, 0.50% Floor, 12/29/2028 | |
| 3,231,102 | | |
| 3,236,869 | |
| CoreLogic, Inc., First Lien Initial Term Loan, 1M US SOFR + 3.50%, 0.50% Floor, 06/02/2028 | |
| 968,287 | | |
| 955,491 | |
| CoreLogic, Inc., Second Lien Initial Term Loan, 1M US SOFR + 6.50%, 0.50% Floor, 06/04/2029 | |
| 1,786,047 | | |
| 1,754,791 | |
| Corporation Service Company, First Lien Term Loan, 1M CME TERM SOFR + 2.75%, 11/02/2029 | |
| 1,353,619 | | |
| 1,360,387 | |
| DTI Holdco, Inc., First Lien Term Loan, 1M US SOFR + 4.75%, 04/26/2029 | |
| 2,332,912 | | |
| 2,345,393 | |
| Dun & Bradstreet Corp., First Lien Term Loan, 1M US SOFR + 2.75%, 01/18/2029 | |
| 3,028,775 | | |
| 3,034,454 | |
| EAB Global, Inc., First Lien Term Loan, 3M CME TERM SOFR + 3.50%, 0.50% Floor, 08/16/2028 | |
| 2,734,679 | | |
| 2,735,363 | |
| Eisner Advisory Group LLC, First Lien Term Loan, 1M US SOFR + 4.00%, 02/28/2031 | |
| 3,093,945 | | |
| 3,128,118 | |
| Element Materials Technology Group Holdings DTL, First Lien Term Loan, 3M CME TERM SOFR + 4.25%, 07/06/2029 | |
| 956,637 | | |
| 961,621 | |
| Element Materials Technology Group Holdings, First Lien Term Loan, 3M CME TERM SOFR + 4.25%, 07/06/2029 | |
| 2,072,712 | | |
| 2,083,511 | |
| Galaxy US Opco Inc. TL, First Lien Term Loan, 3M CME TERM SOFR + 4.75%, 04/29/2029 | |
| 3,155,529 | | |
| 2,574,391 | |
| Genuine Financial Holdings LLC, First Lien Term Loan, 3M CME TERM SOFR + 4.00%, 09/27/2030 | |
| 6,375,879 | | |
| 6,363,127 | |
| Grant Thornton 5/24 Cov-Lite TLB 1L, First Lien Term Loan, 6M CME TERM SOFR + 3.75%, 06/02/2031 | |
| 3,000,857 | | |
| 3,013,205 | |
| Isolved, Inc., First Lien Term Loan, 1M US SOFR + 3.50%, 10/15/2030 | |
| 1,033,887 | | |
| 1,037,764 | |
| Lereta, LLC, First Lien Term Loan, 1M US SOFR + 5.25%, 07/30/2028 | |
| 1,403,427 | | |
| 1,058,416 | |
| Mermaid Bidco Inc aka Datasite TL 1L, First Lien Term Loan, 6M CME TERM SOFR + 3.50%, 06/30/2031(b) | |
| 1,624,966 | | |
| 1,629,028 | |
| Neptune Bidco US, Inc., First Lien Term Loan: | |
| | | |
| | |
| 3M CME TERM SOFR + 4.75%, 10/11/2028 | |
| 1,519,715 | | |
| 1,429,672 | |
| 3M CME TERM SOFR + 5.00%, 0.50% Floor, 04/11/2029 | |
| 1,939,996 | | |
| 1,830,871 | |
| Ryan LLC., First Lien Term Loan, 1M US SOFR + 3.50%, 11/14/2030 | |
| 2,052,430 | | |
| 2,063,462 | |
See
Notes to Financial Statements.
| 60 |
www.blackstone-credit.com |
| Blackstone
Strategic Credit 2027 Term Fund |
Portfolio
of Investments |
June
30, 2024 (Unaudited)
| | |
Principal
Amount | | |
Value | |
| Professional Services (continued) | |
| | |
| |
| Sedwick CMS 2/23 TLB, First Lien Term Loan, 1M US SOFR + 3.75%, 02/24/2028 | |
$ | 2,789,754 | | |
$ | 2,796,338 | |
| Trans Union LLC, First Lien Term Loan: | |
| | | |
| | |
| 1M US SOFR + 2.00%, 12/01/2028 | |
| 949,819 | | |
| 951,258 | |
| 6M CME TERM SOFR + 1.75%, 06/06/2031 | |
| 5,648,918 | | |
| 5,646,094 | |
| TTF Holdings LLC, First Lien Term Loan, 6M CME TERM SOFR + 4.00%, 06/20/2031(b) | |
| 2,309,578 | | |
| 2,309,578 | |
| Vaco Holdings, LLC, First Lien Term Loan, 3M CME TERM SOFR + 5.00%, 01/21/2029 | |
| 4,593,272 | | |
| 4,568,377 | |
| Veritext 3/24, First Lien Term Loan, 1M US SOFR + 3.50%, 08/09/2030 | |
| 2,116,717 | | |
| 2,129,153 | |
| | |
| | | |
| 69,364,561 | |
| Real Estate Management & Development - 0.99% | |
| | | |
| | |
| Cushman & Wakefield US Borrower LLC, First Lien Initial Term Loan, 1M US SOFR + 3.00%, 01/31/2030(b) | |
| 3,113,640 | | |
| 3,117,532 | |
| Cushman & Wakefield US Borrower LLC, First Lien Term Loan, 1M US SOFR + 3.75%, 0.50% Floor, 01/31/2030(b) | |
| 2,534,178 | | |
| 2,553,185 | |
| | |
| | | |
| 5,670,717 | |
| Semiconductors & Semiconductor Equipment - 0.05% | |
| | | |
| | |
| MKS Instruments
6/24 (USD) TLB 1L, First Lien Term Loan 08/17/2029 | |
| 270,872 | | |
| 271,492 | |
| | |
| | | |
| | |
| Software
- 16.15% | |
| | | |
| | |
| Apttus Corp., First Lien Initial Term Loan, 1M US SOFR + 4.00%, 0.75% Floor, 05/08/2028 | |
| 897,799 | | |
| 898,921 | |
| BEP Intermediate/Buyers Edge 4/24 TLB, First Lien Term Loan, 1M US SOFR + 3.75%, 04/25/2031(b) | |
| 1,091,416 | | |
| 1,096,873 | |
| Boost Newco Borrower LLC aka Worldpay 1L TL, First Lien Term Loan 01/31/2031 | |
| 2,543,100 | | |
| 2,549,814 | |
| Boxer Parent Company Inc., First Lien Term Loan, 3M CME TERM SOFR + 4.00%, 12/29/2028 | |
| 1,260,774 | | |
| 1,264,934 | |
| Central Parent, Inc., First Lien Term Loan, 3M CME TERM SOFR + 3.25%, 07/06/2029 | |
| 5,079,721 | | |
| 5,021,000 | |
| Cloud Software Group Inc aka Balboa/Citrix TLB 1L, First Lien Term Loan, 3M CME TERM SOFR + 4.00%, 03/30/2029 | |
| 4,852,049 | | |
| 4,854,184 | |
| Cloud Software Group Inc, First Lien Term Loan, 3M CME TERM SOFR + 4.50%, 03/21/2031 | |
| 455,284 | | |
| 457,098 | |
| Cloudera, Inc., First Lien Term Loan, 3M CME TERM SOFR + 3.75%, 0.50% Floor, 10/08/2028 | |
| 4,733,333 | | |
| 4,742,208 | |
| Cornerstone OnDemand, Inc., First Lien Initial Term Loan, 1M US SOFR + 3.75%, 0.50% Floor, 10/16/2028 | |
| 5,426,925 | | |
| 5,137,480 | |
| Delta Topco, Inc., First Lien Term Loan, 3M CME TERM SOFR + 3.50%, 11/30/2029 | |
| 2,519,595 | | |
| 2,521,434 | |
| Epicor Software Corp, First Lien Term Loan: | |
| | | |
| | |
| 1M US SOFR + 3.25%, 05/30/2031(c) | |
| 1,036,417 | | |
| 1,042,029 | |
| 3M US L + 0.00%, 05/30/2031 | |
| 137,765 | | |
| 138,511 | |
| Fiserv Investment Solutions, Inc., First Lien Initial Term Loan, 3M CME TERM SOFR + 4.00%, 02/18/2027 | |
| 4,577,440 | | |
| 4,414,849 | |
| Flexera Software LLC, First Lien Term Loan, 3M CME TERM SOFR + 8.83%, 03/03/2028 | |
| 1,221,599 | | |
| 1,227,707 | |
| Genesys Cloud Services Holdings II LLC aka Genesys, First Lien Term Loan, 1M US SOFR + 3.75%, 12/01/2027 | |
| 448,294 | | |
| 451,890 | |
| Genesys Cloud Services Holdings II LLC, First Lien Term Loan, 1M US SOFR + 3.50%, 0.75% Floor, 12/01/2027 | |
| 195,920 | | |
| 197,075 | |
| Help/Systems Holdings, Inc., First Lien Seventh
Amendment Refinancing Term Loan, 3M CME TERM SOFR + 4.00%, 0.75% Floor, 11/19/2026 | |
| 3,689,275 | | |
| 3,331,877 | |
| Idera INC, First Lien Term Loan, 1M US SOFR + 3.50%, 03/02/2028 | |
| 5,462,579 | | |
| 5,431,852 | |
| Infoblox 4/24 2nd lien TL 1L, Second Lien Term Loan, 3M CME TERM SOFR + 5.25%, 11/29/2030 | |
| 2,097,928 | | |
| 2,133,592 | |
| Instructure Holdings, INC., First Lien Term Loan, 3M CME TERM SOFR + 2.75%, 10/30/2028 | |
| 910,099 | | |
| 910,668 | |
| Ivanti Software, Inc., First Lien First Amendment Term Loan, 3M CME TERM SOFR + 4.00%, 0.75% Floor, 12/01/2027 | |
| 787,097 | | |
| 622,790 | |
| Ivanti Software, Inc., Second Lien Term Loan, 3M CME TERM SOFR + 7.25%, 12/01/2028 | |
| 1,571,642 | | |
| 1,034,337 | |
| Magenta Buyer LLC, First Lien Initial Term Loan, 1M US SOFR + 5.00%, 0.75% Floor, 07/27/2028 | |
| 5,089,142 | | |
| 2,853,100 | |
See
Notes to Financial Statements.
| Semi-Annual Report
| June 30, 2024 |
61 |
| Blackstone
Strategic Credit 2027 Term Fund |
Portfolio
of Investments |
June
30, 2024 (Unaudited)
| | |
Principal
Amount | | |
Value | |
| Software (continued) | |
| | |
| |
| Mitnick Corporate Purchaser Inc., First Lien Term Loan, 3M CME TERM SOFR + 4.50%, 05/02/2029 | |
$ | 3,125,076 | | |
$ | 2,915,696 | |
| Modena Buyer LLC, First Lien Term Loan, 6M CME TERM SOFR + 4.25%, 04/18/2031 | |
| 3,147,513 | | |
| 3,076,206 | |
| Perforce Software, Inc., First Lien New Term Loan, 1M US SOFR + 3.75%, 07/01/2026 | |
| 846,353 | | |
| 845,295 | |
| Planview Parent Inc, First Lien Term Loan, 6M CME TERM SOFR + 3.75%, 12/17/2027 | |
| 2,011,446 | | |
| 2,012,281 | |
| Project Alpha Intermediate Holding Inc, First Lien Term Loan, 6M CME TERM SOFR + 3.75%, 10/28/2030 | |
| 3,441,521 | | |
| 3,456,337 | |
| Project Leopard Holdings, Inc., First Lien Term Loan, 3M CME TERM SOFR + 5.25%, 0.50% Floor, 07/20/2029 | |
| 3,147,540 | | |
| 2,937,741 | |
| Proofpoint Inc, First Lien Term Loan, 3M CME TERM SOFR + 3.00%, 08/31/2028 | |
| 732,687 | | |
| 734,200 | |
| Quartz Acquireco LLC, First Lien Term Loan, 3M CME TERM SOFR + 2.75%, 06/28/2030 | |
| 1,753,667 | | |
| 1,756,956 | |
| Quest Borrower Ltd., First Lien Term Loan, 3M CME TERM SOFR + 4.25%, 02/01/2029 | |
| 5,193,023 | | |
| 3,870,256 | |
| Rocket Software, Inc., First Lien Term Loan, 1M US SOFR + 4.75%, 0.50% Floor, 11/28/2028 | |
| 3,310,114 | | |
| 3,328,005 | |
| SS&C Technologies, Inc., First Lien Term Loan, 1M US SOFR + 2.00%, 05/09/2031 | |
| 4,786,730 | | |
| 4,799,128 | |
| Vision Solutions, Inc., First Lien Term Loan, 3M CME TERM SOFR + 4.25%, 0.75% Floor, 04/24/2028 | |
| 5,202,292 | | |
| 5,130,760 | |
| VS Buyer LLC, First Lien Term Loan, 1M US SOFR + 3.25%, 04/12/2031 | |
| 2,268,652 | | |
| 2,277,159 | |
| Webpros Luxembourg Sarl, First Lien Term Loan, 1M US SOFR + 4.00%, 03/28/2031(b) | |
| 867,052 | | |
| 875,181 | |
| Xplor T1, LLC, First Lien Term Loan, 3M CME TERM SOFR + 9.60%, 06/14/2031(b) | |
| 1,764,000 | | |
| 1,764,000 | |
| | |
| | | |
| 92,113,424 | |
| Specialty Retail - 2.25% | |
| | | |
| | |
| APRO LLC, First Lien Term Loan, 6M CME TERM SOFR + 4.00%, 06/13/2034(b) | |
| 1,778,226 | | |
| 1,780,449 | |
| EG America LLC, First Lien Term Loan, 3M CME TERM SOFR + 5.50%, 0.50% Floor, 02/07/2028 | |
| 1,395,098 | | |
| 1,380,568 | |
| HomeServe USA Corp., First Lien Term Loan, 1M US SOFR + 2.50%, 10/21/2030 | |
| 1,034,173 | | |
| 1,037,948 | |
| Mavis Tire Express Services Topco Corp., First Lien Term Loan, 1M US SOFR + 3.75%, 0.75% Floor, 05/04/2028 | |
| 2,918,970 | | |
| 2,929,099 | |
| Spencer Spirit IH LLC, First Lien Term Loan, 6M US L + 0.00%, 06/01/2034(b) | |
| 2,619,313 | | |
| 2,619,312 | |
| StubHub Holdco Sub LLC, First Lien Term Loan, 1M US SOFR + 4.75%, 03/15/2030 | |
| 3,107,981 | | |
| 3,112,845 | |
| | |
| | | |
| 12,860,221 | |
| Technology Hardware, Storage & Peripherals - 0.47% | |
| | | |
| | |
| Xerox 11/23, First Lien Term Loan, 1M US SOFR + 4.00%, 11/17/2029 | |
| 2,701,979 | | |
| 2,703,249 | |
| | |
| | | |
| | |
| Textiles, Apparel & Luxury Goods - 0.60% | |
| | | |
| | |
| Champ Acquisition Corp., First Lien Initial Term Loan, 3M CME TERM SOFR + 5.50%, 12/19/2025 | |
| 3,386,012 | | |
| 3,402,519 | |
| | |
| | | |
| | |
| Trading Companies & Distributors - 4.50% | |
| | | |
| | |
| American Builders & Contractors Supply Co., Inc., First Lien Term Loan, 1M US SOFR + 2.00%, 01/31/2031 | |
| 635,257 | | |
| 637,325 | |
| Avolon TLB Borrower 1 (US), First Lien Term Loan, 1M US SOFR + 2.00%, 06/22/2028 | |
| 2,140,233 | | |
| 2,145,583 | |
| CD&R Hydr SunSource, First Lien Term Loan, 1M US SOFR + 4.00%, 03/25/2031 | |
| 2,171,058 | | |
| 2,177,843 | |
| Core & Main LP, First Lien Term Loan, 3M CME TERM SOFR + 2.25%, 02/09/2031(b) | |
| 501,703 | | |
| 503,273 | |
| Fastlane Parent Co., Inc., First Lien Term Loan, 1M CME TERM SOFR + 4.50%, 0.50% Floor, 09/29/2028 | |
| 1,242,539 | | |
| 1,238,812 | |
| FCG Acquisitions, Inc., First Lien Initial Term Loan, 1M US L + 3.75%, 0.50% Floor, 03/31/2028 | |
| 3,510,959 | | |
| 3,515,787 | |
| Foundation Building Materials, Inc., First Lien Term Loan, 3M CME TERM SOFR + 4.00%, 01/29/2031 | |
| 3,060,099 | | |
| 3,051,607 | |
| Kodiak Building Partners Inc., First Lien Term Loan, 3M CME TERM SOFR + 3.25%, 0.75% Floor, 03/12/2028 | |
| 2,382,649 | | |
| 2,386,747 | |
| Park River Holdings, Inc., First Lien Initial Term Loan, 3M CME TERM SOFR + 3.25%, 0.75% Floor, 12/28/2027 | |
| 2,899,424 | | |
| 2,840,624 | |
See
Notes to Financial Statements.
| 62 |
www.blackstone-credit.com |
| Blackstone
Strategic Credit 2027 Term Fund |
Portfolio
of Investments |
June
30, 2024 (Unaudited)
| | |
Principal
Amount | | |
Value | |
| Trading Companies & Distributors (continued) | |
| | |
| |
| White Cap Buyer LLC, First Lien Term Loan, 1M US SOFR + 3.25%, 10/19/2029 | |
$ | 5,020,704 | | |
$ | 5,034,988 | |
| Windsor Holdings III LLC, First Lien Term Loan, 1M US SOFR + 4.00%, 08/01/2030 | |
| 2,086,306 | | |
| 2,102,475 | |
| | |
| | | |
| 25,635,064 | |
| Transportation Infrastructure - 0.31% | |
| | | |
| | |
| Brown Group Holding LLC, First Lien Term Loan, 1M US SOFR + 2.75%, 0.50% Floor, 06/07/2028 | |
| 1,750,136 | | |
| 1,751,344 | |
| | |
| | | |
| | |
| Wireless Telecommunication Services - 0.16% | |
| | | |
| | |
| CCI Buyer, Inc., First Lien Initial Term Loan, 3M CME TERM SOFR + 4.00%, 0.75% Floor, 12/17/2027 | |
| 900,418 | | |
| 902,457 | |
| | |
| | | |
| | |
| TOTAL FLOATING RATE LOAN INTERESTS | |
| | | |
| | |
| (Cost $793,996,947) | |
| | | |
| 782,783,359 | |
| | |
| | | |
| | |
| CORPORATE BONDS - 25.22% | |
| | | |
| | |
| Aerospace & Defense - 0.89% | |
| | | |
| | |
| Bombardier, Inc., 7.000%, 06/01/2032(e) | |
| 400,000 | | |
| 406,056 | |
| KBR, Inc., 4.750%, 09/30/2028(e) | |
| 430,000 | | |
| 401,794 | |
| TransDigm, Inc.: | |
| | | |
| | |
| 4.625%, 01/15/2029 | |
| 1,835,000 | | |
| 1,713,705 | |
| 4.880%, 05/01/2029 | |
| 1,350,000 | | |
| 1,265,929 | |
| Triumph Group, Inc., 9.000%, 03/15/2028(e) | |
| 1,244,000 | | |
| 1,305,565 | |
| | |
| | | |
| 5,093,049 | |
| Automobile Components - 0.18% | |
| | | |
| | |
| Patrick Industries, Inc., 4.750%, 05/01/2029(e) | |
| 1,130,000 | | |
| 1,042,336 | |
| | |
| | | |
| | |
| Banks - 0.12% | |
| | | |
| | |
| Popular, Inc., 7.250%, 03/13/2028 | |
| 660,000 | | |
| 678,358 | |
| | |
| | | |
| | |
| Beverages - 0.16% | |
| | | |
| | |
| Primo Water Holdings, Inc., 4.375%, 04/30/2029(e) | |
| 971,000 | | |
| 895,325 | |
| | |
| | | |
| | |
| Broadline Retail - 0.46% | |
| | | |
| | |
| Kohl's Corp., 5.550%, 07/17/2045 | |
| 200,000 | | |
| 136,560 | |
| Nordstrom, Inc., 5.000%, 01/15/2044 | |
| 340,000 | | |
| 274,935 | |
| Rakuten Group, Inc.: | |
| | | |
| | |
| 11.250%, 02/15/2027(e) | |
| 1,643,000 | | |
| 1,757,776 | |
| 9.750%, 04/15/2029(e) | |
| 447,000 | | |
| 461,416 | |
| | |
| | | |
| 2,630,687 | |
| Building Products - 0.06% | |
| | | |
| | |
| Griffon Corp., 5.750%, 03/01/2028 | |
| 364,000 | | |
| 351,545 | |
| | |
| | | |
| | |
| Chemicals - 0.59% | |
| | | |
| | |
| Chemours Co., 5.750%, 11/15/2028(e) | |
| 1,300,000 | | |
| 1,201,697 | |
| CVR Partners LP / CVR Nitrogen Finance Corp., 6.125%, 06/15/2028(e) | |
| 800,000 | | |
| 769,299 | |
| Tronox, Inc., 4.625%, 03/15/2029(e) | |
| 1,540,000 | | |
| 1,391,796 | |
| | |
| | | |
| 3,362,792 | |
| Commercial Services & Supplies - 0.42% | |
| | | |
| | |
| Cimpress PLC, 7.000%, 06/15/2026 | |
| 859,000 | | |
| 859,210 | |
| CoreCivic, Inc., 8.250%, 04/15/2029 | |
| 550,000 | | |
| 568,980 | |
See
Notes to Financial Statements.
| Semi-Annual Report
| June 30, 2024 |
63 |
| Blackstone
Strategic Credit 2027 Term Fund |
Portfolio
of Investments |
June
30, 2024 (Unaudited)
| | |
Principal
Amount | | |
Value | |
| Commercial Services & Supplies (continued) | |
| | |
| |
| Deluxe Corp., 8.000%, 06/01/2029(e) | |
$ | 270,000 | | |
$ | 253,675 | |
| Pitney Bowes, Inc.: | |
| | | |
| | |
| 6.875%, 03/15/2027(e) | |
| 220,000 | | |
| 208,005 | |
| 7.250%, 03/15/2029(e) | |
| 590,000 | | |
| 530,691 | |
| | |
| | | |
| 2,420,561 | |
| Construction & Engineering - 0.21% | |
| | | |
| | |
| Great Lakes Dredge & Dock Corp., 5.250%, 06/01/2029(e) | |
| 509,000 | | |
| 454,785 | |
| Tutor Perini Corp., 11.880%, 04/30/2029(e) | |
| 695,000 | | |
| 748,174 | |
| | |
| | | |
| 1,202,959 | |
| Consumer Finance - 2.07% | |
| | | |
| | |
| Ally Financial, Inc., 6.700%, 02/14/2033 | |
| 490,000 | | |
| 487,448 | |
| Enova International, Inc., 11.250%, 12/15/2028(e) | |
| 400,000 | | |
| 427,606 | |
| FirstCash, Inc.: | |
| | | |
| | |
| 4.630%, 09/01/2028(e) | |
| 715,000 | | |
| 672,716 | |
| 5.625%, 01/01/2030(e) | |
| 990,000 | | |
| 938,602 | |
| 6.875%, 03/01/2032(e) | |
| 915,000 | | |
| 916,021 | |
| goeasy, Ltd.: | |
| | | |
| | |
| 9.250%, 12/01/2028(e) | |
| 962,000 | | |
| 1,022,008 | |
| 7.625%, 07/01/2029(e) | |
| 728,000 | | |
| 743,186 | |
| Navient Corp.: | |
| | | |
| | |
| 5.000%, 03/15/2027 | |
| 160,000 | | |
| 152,901 | |
| 4.880%, 03/15/2028 | |
| 1,150,000 | | |
| 1,056,619 | |
| 5.500%, 03/15/2029 | |
| 150,000 | | |
| 137,093 | |
| 9.380%, 07/25/2030 | |
| 529,000 | | |
| 556,756 | |
| 11.500%, 03/15/2031 | |
| 580,000 | | |
| 639,460 | |
| 5.625%, 08/01/2033 | |
| 393,000 | | |
| 314,066 | |
| OneMain Finance Corp.: | |
| | | |
| | |
| 3.880%, 09/15/2028 | |
| 300,000 | | |
| 269,264 | |
| 5.375%, 11/15/2029 | |
| 400,000 | | |
| 375,450 | |
| 7.875%, 03/15/2030 | |
| 633,000 | | |
| 653,162 | |
| 7.500%, 05/15/2031 | |
| 217,000 | | |
| 219,765 | |
| PRA Group, Inc.: | |
| | | |
| | |
| 8.380%, 02/01/2028(e) | |
| 200,000 | | |
| 199,470 | |
| 8.880%, 01/31/2030(e) | |
| 350,000 | | |
| 349,703 | |
| Synchrony Financial, 7.250%, 02/02/2033 | |
| 1,205,000 | | |
| 1,198,924 | |
| World Acceptance Corp., 7.000%, 11/01/2026(e) | |
| 465,000 | | |
| 443,687 | |
| | |
| | | |
| 11,773,907 | |
| Containers & Packaging - 0.09% | |
| | | |
| | |
| Ardagh Metal Packaging Finance USA LLC / Ardagh Metal Packaging Finance PLC, 4.000%, 09/01/2029(e) | |
| 620,000 | | |
| 525,370 | |
| | |
| | | |
| | |
| Diversified Consumer Services - 0.11% | |
| | | |
| | |
| Adtalem Global Education, Inc., 5.500%, 03/01/2028(e) | |
| 670,000 | | |
| 645,260 | |
| | |
| | | |
| | |
| Diversified REITs - 0.31% | |
| | | |
| | |
| Iron Mountain, Inc.: | |
| | | |
| | |
| 5.250%, 07/15/2030(e) | |
| 390,000 | | |
| 370,988 | |
| 4.500%, 02/15/2031(e) | |
| 10,000 | | |
| 9,035 | |
| 5.625%, 07/15/2032(e) | |
| 500,000 | | |
| 475,222 | |
See
Notes to Financial Statements.
| 64 |
www.blackstone-credit.com |
| Blackstone
Strategic Credit 2027 Term Fund |
Portfolio
of Investments |
June
30, 2024 (Unaudited)
| | |
Principal
Amount | | |
Value | |
| Diversified REITs (continued) | |
| | |
| |
| Service Properties Trust: | |
| | |
| |
| 3.950%, 01/15/2028 | |
$ | 589,000 | | |
$ | 493,911 | |
| 4.950%, 10/01/2029 | |
| 91,000 | | |
| 69,126 | |
| 4.375%, 02/15/2030 | |
| 500,000 | | |
| 353,673 | |
| | |
| | | |
| 1,771,955 | |
| Diversified Telecommunication Services - 0.98% | |
| | | |
| | |
| Cogent Communications Group, Inc., 7.000%, 06/15/2027(e) | |
| 1,580,000 | | |
| 1,566,730 | |
| Consolidated Communications, Inc., 6.500%, 10/01/2028(e) | |
| 500,000 | | |
| 428,553 | |
| Frontier Communications Holdings LLC: | |
| | | |
| | |
| 6.750%, 05/01/2029(e) | |
| 2,440,000 | | |
| 2,240,538 | |
| 5.875%, 11/01/2029 | |
| 500,000 | | |
| 436,109 | |
| 6.000%, 01/15/2030(e) | |
| 350,000 | | |
| 304,998 | |
| Viasat, Inc.: | |
| | | |
| | |
| 6.500%, 07/15/2028(e) | |
| 770,000 | | |
| 583,688 | |
| 7.500%, 05/30/2031(e) | |
| 80,000 | | |
| 53,243 | |
| | |
| | | |
| 5,613,859 | |
| Electric Utilities - 0.28% | |
| | | |
| | |
| NRG Energy, Inc.: | |
| | | |
| | |
| 3.375%, 02/15/2029(e) | |
| 267,000 | | |
| 237,794 | |
| 3.625%, 02/15/2031(e) | |
| 200,000 | | |
| 171,670 | |
| Vistra Operations Co. LLC: | |
| | | |
| | |
| 5.000%, 07/31/2027(e) | |
| 500,000 | | |
| 484,019 | |
| 7.750%, 10/15/2031(e) | |
| 672,000 | | |
| 700,342 | |
| | |
| | | |
| 1,593,825 | |
| Electronic Equipment, Instruments & Components - 0.05% | |
| | | |
| | |
| Sensata Technologies, Inc., 6.625%, 07/15/2032(e) | |
| 258,000 | | |
| 260,023 | |
| | |
| | | |
| | |
| Energy Equipment & Services - 1.12% | |
| | | |
| | |
| Archrock Partners LP / Archrock Partners Finance Corp., 6.250%, 04/01/2028(e) | |
| 1,203,000 | | |
| 1,192,555 | |
| Enerflex, Ltd., 9.000%, 10/15/2027(e) | |
| 1,050,000 | | |
| 1,066,874 | |
| Helix Energy Solutions Group, Inc., 9.750%, 03/01/2029(e) | |
| 499,000 | | |
| 532,411 | |
| Precision Drilling Corp., 6.875%, 01/15/2029(e) | |
| 670,000 | | |
| 663,441 | |
| Transocean, Inc., 7.500%, 04/15/2031 | |
| 510,000 | | |
| 478,860 | |
| USA Compression Partners LP / USA Compression Finance Corp., 7.125%, 03/15/2029(e) | |
| 1,200,000 | | |
| 1,210,120 | |
| Valaris, Ltd., 8.380%, 04/30/2030(e) | |
| 1,180,000 | | |
| 1,222,572 | |
| | |
| | | |
| 6,366,833 | |
| Entertainment - 0.19% | |
| | | |
| | |
| Cinemark USA, Inc., 5.250%, 07/15/2028(e) | |
| 1,110,000 | | |
| 1,062,153 | |
| | |
| | | |
| | |
| Financial Services - 1.30% | |
| | | |
| | |
| Burford Capital Global Finance LLC, 9.250%, 07/01/2031(e) | |
| 950,000 | | |
| 1,001,054 | |
| Compass Group Diversified Holdings LLC, 5.250%, 04/15/2029(e) | |
| 253,000 | | |
| 240,197 | |
| Encore Capital Group, Inc.: | |
| | | |
| | |
| 9.250%, 04/01/2029(e) | |
| 300,000 | | |
| 312,996 | |
| 8.500%, 05/15/2030(e) | |
| 546,000 | | |
| 556,508 | |
| Nationstar Mortgage Holdings, Inc.: | |
| | | |
| | |
| 6.000%, 01/15/2027(e) | |
| 1,848,000 | | |
| 1,830,045 | |
| 5.500%, 08/15/2028(e) | |
| 900,000 | | |
| 865,654 | |
| 5.750%, 11/15/2031(e) | |
| 220,000 | | |
| 206,971 | |
| 7.125%, 02/01/2032(e) | |
| 50,000 | | |
| 50,348 | |
See
Notes to Financial Statements.
| Semi-Annual Report
| June 30, 2024 |
65 |
| Blackstone
Strategic Credit 2027 Term Fund |
Portfolio
of Investments |
June
30, 2024 (Unaudited)
| | |
Principal
Amount | | |
Value | |
| Financial Services (continued) | |
| | |
| |
| PennyMac Financial Services, Inc.: | |
| | |
| |
| 5.375%, 10/15/2025(e) | |
$ | 460,000 | | |
$ | 456,261 | |
| 4.250%, 02/15/2029(e) | |
| 105,000 | | |
| 95,582 | |
| 7.875%, 12/15/2029(e) | |
| 454,000 | | |
| 468,507 | |
| 5.750%, 09/15/2031(e) | |
| 1,240,000 | | |
| 1,162,257 | |
| PHH Mortgage Corp., 7.875%, 03/15/2026(e) | |
| 160,000 | | |
| 156,539 | |
| | |
| | | |
| 7,402,919 | |
| Food Products - 0.19% | |
| | | |
| | |
| Post Holdings, Inc., 4.625%, 04/15/2030(e) | |
| 1,200,000 | | |
| 1,103,451 | |
| | |
| | | |
| | |
| Gas Utilities - 0.34% | |
| | | |
| | |
| Suburban Propane Partners LP/Suburban Energy Finance Corp., 5.000%, 06/01/2031(e) | |
| 1,360,000 | | |
| 1,225,903 | |
| Superior Plus LP / Superior General Partner, Inc., 4.500%, 03/15/2029(e) | |
| 750,000 | | |
| 688,976 | |
| | |
| | | |
| 1,914,879 | |
| Health Care Providers & Services - 1.22% | |
| | | |
| | |
| AdaptHealth LLC: | |
| | | |
| | |
| 6.125%, 08/01/2028(e) | |
| 810,000 | | |
| 774,153 | |
| 5.125%, 03/01/2030(e) | |
| 1,010,000 | | |
| 884,443 | |
| CHS/Community Health Systems, Inc.: | |
| | | |
| | |
| 6.875%, 04/15/2029(e) | |
| 430,000 | | |
| 329,341 | |
| 10.880%, 01/15/2032(e) | |
| 1,408,000 | | |
| 1,467,187 | |
| DaVita, Inc.: | |
| | | |
| | |
| 4.625%, 06/01/2030(e) | |
| 2,900,000 | | |
| 2,622,962 | |
| 3.750%, 02/15/2031(e) | |
| 300,000 | | |
| 256,192 | |
| ModivCare Escrow Issuer, Inc., 5.000%, 10/01/2029(e) | |
| 130,000 | | |
| 91,741 | |
| Pediatrix Medical Group, Inc., 5.375%, 02/15/2030(e) | |
| 610,000 | | |
| 539,917 | |
| | |
| | | |
| 6,965,936 | |
| Health Care REITs - 0.34% | |
| | | |
| | |
| MPT Operating Partnership LP / MPT Finance Corp.: | |
| | | |
| | |
| 5.250%, 08/01/2026 | |
| 400,000 | | |
| 363,839 | |
| 5.000%, 10/15/2027 | |
| 1,000,000 | | |
| 826,828 | |
| 4.625%, 08/01/2029 | |
| 1,019,000 | | |
| 740,643 | |
| | |
| | | |
| 1,931,310 | |
| Hotels, Restaurants & Leisure - 0.48% | |
| | | |
| | |
| Brinker International, Inc., 8.250%, 07/15/2030(e) | |
| 590,000 | | |
| 619,988 | |
| Churchill Downs, Inc., 4.750%, 01/15/2028(e) | |
| 445,000 | | |
| 425,317 | |
| NCL Corp., Ltd., 5.875%, 03/15/2026(e) | |
| 1,390,000 | | |
| 1,375,173 | |
| Royal Caribbean Cruises, Ltd., 5.500%, 08/31/2026(e) | |
| 340,000 | | |
| 336,441 | |
| | |
| | | |
| 2,756,919 | |
| Household Durables - 0.83% | |
| | | |
| | |
| Dream Finders Homes, Inc., 8.250%, 08/15/2028(e) | |
| 219,000 | | |
| 224,477 | |
| Forestar Group, Inc., 3.850%, 05/15/2026(e) | |
| 600,000 | | |
| 575,465 | |
| LGI Homes, Inc., 8.750%, 12/15/2028(e) | |
| 534,000 | | |
| 556,551 | |
| M/I Homes, Inc.: | |
| | | |
| | |
| 4.950%, 02/01/2028 | |
| 500,000 | | |
| 482,610 | |
| 3.950%, 02/15/2030 | |
| 707,000 | | |
| 631,058 | |
See
Notes to Financial Statements.
| 66 |
www.blackstone-credit.com |
| Blackstone
Strategic Credit 2027 Term Fund |
Portfolio
of Investments |
June
30, 2024 (Unaudited)
| | |
Principal
Amount | | |
Value | |
| Household Durables (continued) | |
| | |
| |
| Tempur Sealy International, Inc.: | |
| | |
| |
| 4.000%, 04/15/2029(e) | |
$ | 2,290,000 | | |
$ | 2,067,953 | |
| 3.880%, 10/15/2031(e) | |
| 230,000 | | |
| 192,993 | |
| | |
| | | |
| 4,731,107 | |
| Household Products - 0.08% | |
| | | |
| | |
| Energizer Holdings, Inc., 4.750%, 06/15/2028(e) | |
| 513,000 | | |
| 480,735 | |
| | |
| | | |
| | |
| Industrial Conglomerates - 0.49% | |
| | | |
| | |
| Icahn Enterprises LP / Icahn Enterprises Finance Corp.: | |
| | | |
| | |
| 6.250%, 05/15/2026 | |
| 974,000 | | |
| 967,147 | |
| 5.250%, 05/15/2027 | |
| 300,000 | | |
| 281,857 | |
| 9.750%, 01/15/2029(e) | |
| 780,000 | | |
| 809,054 | |
| 9.000%, 06/15/2030(e) | |
| 717,000 | | |
| 713,999 | |
| | |
| | | |
| 2,772,057 | |
| IT Services - 0.68% | |
| | | |
| | |
| Bread Financial Holdings, Inc., 9.750%, 03/15/2029(e) | |
| 1,530,000 | | |
| 1,608,814 | |
| Conduent Business Services LLC / Conduent State & Local Solutions, Inc., 6.000%, 11/01/2029(e) | |
| 870,000 | | |
| 813,563 | |
| Sabre GLBL, Inc.: | |
| | | |
| | |
| 8.630%, 06/01/2027(e) | |
| 1,055,000 | | |
| 972,937 | |
| 11.250%, 12/15/2027(e) | |
| 500,000 | | |
| 486,353 | |
| | |
| | | |
| 3,881,667 | |
| Machinery - 0.19% | |
| | | |
| | |
| Allison Transmission, Inc., 4.750%, 10/01/2027(e) | |
| 650,000 | | |
| 628,664 | |
| Park-Ohio Industries, Inc., 6.625%, 04/15/2027 | |
| 395,000 | | |
| 380,631 | |
| Wabash National Corp., 4.500%, 10/15/2028(e) | |
| 50,000 | | |
| 45,054 | |
| | |
| | | |
| 1,054,349 | |
| Marine Transportation - 0.08% | |
| | | |
| | |
| Danaos Corp., 8.500%, 03/01/2028(e) | |
| 450,000 | | |
| 462,705 | |
| | |
| | | |
| | |
| Media - 1.94% | |
| | | |
| | |
| Advantage Sales & Marketing, Inc., 6.500%, 11/15/2028(e) | |
| 1,114,000 | | |
| 1,008,932 | |
| AMC Networks, Inc., 4.250%, 02/15/2029 | |
| 618,000 | | |
| 417,603 | |
| CCO Holdings LLC / CCO Holdings Capital Corp.: | |
| | | |
| | |
| 5.125%, 05/01/2027(e) | |
| 710,000 | | |
| 682,279 | |
| 5.375%, 06/01/2029(e) | |
| 650,000 | | |
| 591,948 | |
| 4.750%, 03/01/2030(e) | |
| 1,025,000 | | |
| 888,436 | |
| 4.500%, 08/15/2030(e) | |
| 120,000 | | |
| 101,680 | |
| 4.250%, 02/01/2031(e) | |
| 220,000 | | |
| 179,786 | |
| 7.375%, 03/01/2031(e) | |
| 350,000 | | |
| 345,321 | |
| 4.500%, 05/01/2032 | |
| 190,000 | | |
| 153,158 | |
| Clear Channel Outdoor Holdings, Inc.: | |
| | | |
| | |
| 7.750%, 04/15/2028(e) | |
| 930,000 | | |
| 814,814 | |
| 7.500%, 06/01/2029(e) | |
| 960,000 | | |
| 803,160 | |
| CSC Holdings LLC: | |
| | | |
| | |
| 7.500%, 04/01/2028(e) | |
| 110,000 | | |
| 58,500 | |
| 11.250%, 05/15/2028(e) | |
| 105,000 | | |
| 91,572 | |
| 11.750%, 01/31/2029(e) | |
| 710,000 | | |
| 605,970 | |
| 5.750%, 01/15/2030(e) | |
| 200,000 | | |
| 75,656 | |
See
Notes to Financial Statements.
| Semi-Annual Report
| June 30, 2024 |
67 |
| Blackstone
Strategic Credit 2027 Term Fund |
Portfolio
of Investments |
June
30, 2024 (Unaudited)
| | |
Principal
Amount | | |
Value | |
| Media (continued) | |
| | |
| |
| Gray Television, Inc.: | |
| | |
| |
| 4.750%, 10/15/2030(e) | |
$ | 1,168,000 | | |
$ | 701,958 | |
| 5.375%, 11/15/2031(e) | |
| 835,000 | | |
| 474,026 | |
| Nexstar Media, Inc.: | |
| | | |
| | |
| 5.625%, 07/15/2027(e) | |
| 2,650,000 | | |
| 2,519,534 | |
| 4.750%, 11/01/2028(e) | |
| 350,000 | | |
| 311,499 | |
| Sinclair Television Group, Inc., 5.500%, 03/01/2030(e) | |
| 390,000 | | |
| 237,553 | |
| | |
| | | |
| 11,063,385 | |
| Metals & Mining - 1.59% | |
| | | |
| | |
| Eldorado Gold Corp., 6.250%, 09/01/2029(e) | |
| 810,000 | | |
| 779,117 | |
| FMG Resources August 2006 Pty, Ltd.: | |
| | | |
| | |
| 5.875%, 04/15/2030(e) | |
| 862,000 | | |
| 843,018 | |
| 6.125%, 04/15/2032(e) | |
| 247,000 | | |
| 244,412 | |
| Hudbay Minerals, Inc., 4.500%, 04/01/2026(e) | |
| 1,000,000 | | |
| 979,141 | |
| Iamgold Corp, 5.750%, 10/15/2028(e) | |
| 760,000 | | |
| 718,826 | |
| Kaiser Aluminum Corp., 4.625%, 03/01/2028(e) | |
| 460,000 | | |
| 430,941 | |
| Mineral Resources, Ltd.: | |
| | | |
| | |
| 8.130%, 05/01/2027(e) | |
| 1,128,000 | | |
| 1,137,838 | |
| 8.000%, 11/01/2027(e) | |
| 1,140,000 | | |
| 1,167,556 | |
| 9.250%, 10/01/2028(e) | |
| 500,000 | | |
| 525,391 | |
| New Gold, Inc., 7.500%, 07/15/2027(e) | |
| 650,000 | | |
| 654,954 | |
| SunCoke Energy, Inc., 4.880%, 06/30/2029(e) | |
| 795,000 | | |
| 721,119 | |
| Taseko Mines, Ltd., 8.250%, 05/01/2030(e) | |
| 847,000 | | |
| 867,556 | |
| | |
| | | |
| 9,069,869 | |
| Mortgage Real Estate Investment - 0.84% | |
| | | |
| | |
| Apollo Commercial Real Estate Finance, Inc., 4.625%, 06/15/2029(e) | |
| 800,000 | | |
| 671,549 | |
| Rithm Capital Corp., 8.000%, 04/01/2029(e) | |
| 1,790,000 | | |
| 1,739,179 | |
| Starwood Property Trust, Inc.: | |
| | | |
| | |
| 3.630%, 07/15/2026(e) | |
| 1,322,000 | | |
| 1,244,938 | |
| 4.380%, 01/15/2027(e) | |
| 1,020,000 | | |
| 966,758 | |
| 7.250%, 04/01/2029(e) | |
| 187,000 | | |
| 189,239 | |
| | |
| | | |
| 4,811,663 | |
| Office REITs - 0.13% | |
| | | |
| | |
| Brandywine Operating Partnership LP, 4.550%, 10/01/2029 | |
| 500,000 | | |
| 435,791 | |
| Vornado Realty LP, 3.400%, 06/01/2031 | |
| 400,000 | | |
| 314,471 | |
| | |
| | | |
| 750,262 | |
| Oil, Gas & Consumable Fuels - 3.07% | |
| | | |
| | |
| Alliance Resource Operating Partners LP / Alliance Resource Finance Corp., 8.630%, 06/15/2029(e) | |
| 10,000 | | |
| 10,270 | |
| Berry Petroleum Co. LLC, 7.000%, 02/15/2026(e) | |
| 400,000 | | |
| 395,741 | |
| California Resources Corp., 8.250%, 06/15/2029(e) | |
| 529,000 | | |
| 540,358 | |
| Calumet Specialty Products Partners LP / Calumet Finance Corp.: | |
| | | |
| | |
| 8.130%, 01/15/2027(e) | |
| 230,000 | | |
| 217,080 | |
| 9.750%, 07/15/2028(e) | |
| 822,000 | | |
| 779,224 | |
| CNX Resources Corp.: | |
| | | |
| | |
| 6.000%, 01/15/2029(e) | |
| 1,298,000 | | |
| 1,271,226 | |
| 7.250%, 03/01/2032(e) | |
| 378,000 | | |
| 385,819 | |
| Comstock Resources, Inc.: | |
| | | |
| | |
| 6.750%, 03/01/2029(e) | |
| 1,520,000 | | |
| 1,474,224 | |
| 5.875%, 01/15/2030(e) | |
| 810,000 | | |
| 754,284 | |
| CVR Energy, Inc., 8.500%, 01/15/2029(e) | |
| 1,650,000 | | |
| 1,658,230 | |
See
Notes to Financial Statements.
| 68 |
www.blackstone-credit.com |
| Blackstone
Strategic Credit 2027 Term Fund |
Portfolio
of Investments |
June
30, 2024 (Unaudited)
| | |
Principal
Amount | | |
Value | |
| Oil, Gas & Consumable Fuels (continued) | |
| | |
| |
| Delek Logistics Partners LP / Delek Logistics Finance Corp.: | |
| | |
| |
| 7.125%, 06/01/2028(e) | |
$ | 1,354,000 | | |
$ | 1,338,228 | |
| 8.630%, 03/15/2029(e) | |
| 430,000 | | |
| 442,854 | |
| DT Midstream, Inc., 4.125%, 06/15/2029(e) | |
| 526,000 | | |
| 486,366 | |
| Energean PLC, 6.500%, 04/30/2027(e) | |
| 300,000 | | |
| 295,922 | |
| EnQuest PLC, 11.630%, 11/01/2027(e) | |
| 220,000 | | |
| 223,696 | |
| Global Partners LP / GLP Finance Corp., 6.875%, 01/15/2029 | |
| 648,000 | | |
| 642,569 | |
| Karoon USA Finance, Inc., 10.500%, 05/14/2029(e) | |
| 170,000 | | |
| 171,061 | |
| Magnolia Oil & Gas Operating LLC / Magnolia Oil & Gas Finance Corp., 6.000%, 08/01/2026(e) | |
| 300,000 | | |
| 297,329 | |
| New Fortress Energy, Inc., 6.500%, 09/30/2026(e) | |
| 2,035,000 | | |
| 1,873,823 | |
| NGL Energy Operating LLC / NGL Energy Finance Corp.: | |
| | | |
| | |
| 8.130%, 02/15/2029(e) | |
| 350,000 | | |
| 356,887 | |
| 8.380%, 02/15/2032(e) | |
| 200,000 | | |
| 203,238 | |
| Northern Oil & Gas, Inc.: | |
| | | |
| | |
| 8.130%, 03/01/2028(e) | |
| 1,050,000 | | |
| 1,062,637 | |
| 8.750%, 06/15/2031(e) | |
| 296,000 | | |
| 310,958 | |
| Parkland Corp., 4.500%, 10/01/2029(e) | |
| 630,000 | | |
| 577,169 | |
| PBF Holding Co. LLC / PBF Finance Corp., 7.875%, 09/15/2030(e) | |
| 674,000 | | |
| 690,547 | |
| Sunoco LP / Sunoco Finance Corp., 4.500%, 05/15/2029 | |
| 665,000 | | |
| 622,420 | |
| W&T Offshore, Inc., 11.750%, 02/01/2026(e) | |
| 400,000 | | |
| 411,792 | |
| | |
| | | |
| 17,493,952 | |
| Paper & Forest Products - 0.16% | |
| | | |
| | |
| Mativ Holdings, Inc., 6.875%, 10/01/2026(e) | |
| 500,000 | | |
| 497,344 | |
| Mercer International, Inc., 5.125%, 02/01/2029 | |
| 480,000 | | |
| 422,928 | |
| | |
| | | |
| 920,272 | |
| Passenger Airlines - 0.04% | |
| | | |
| | |
| American Airlines, Inc., 7.250%, 02/15/2028(e) | |
| 225,000 | | |
| 225,383 | |
| | |
| | | |
| | |
| Personal Care Products - 0.06% | |
| | | |
| | |
| Herbalife Nutrition, Ltd. / HLF Financing, Inc., 7.875%, 09/01/2025(e) | |
| 240,000 | | |
| 235,956 | |
| HLF Financing Sarl LLC / Herbalife International, Inc., 4.875%, 06/01/2029(e) | |
| 120,000 | | |
| 83,255 | |
| | |
| | | |
| 319,211 | |
| Pharmaceuticals - 0.12% | |
| | | |
| | |
| Organon & Co. / Organon Foreign Debt Co-Issuer BV: | |
| | | |
| | |
| 6.750%, 05/15/2034(e) | |
| 428,000 | | |
| 427,942 | |
| 7.875%, 05/15/2034(e) | |
| 248,000 | | |
| 255,131 | |
| | |
| | | |
| 683,073 | |
| Real Estate Management & Development - 0.40% | |
| | | |
| | |
| Howard Hughes Corp., 4.125%, 02/01/2029(e) | |
| 1,050,000 | | |
| 940,116 | |
| Landsea Homes Corp., 8.880%, 04/01/2029(e) | |
| 300,000 | | |
| 297,364 | |
| Newmark Group, Inc., 7.500%, 01/12/2029(e) | |
| 1,018,000 | | |
| 1,047,353 | |
| | |
| | | |
| 2,284,833 | |
| Semiconductors & Semiconductor Equipment - 0.10% | |
| | | |
| | |
| ams-OSRAM AG, 12.250%, 03/30/2029(e) | |
| 550,000 | | |
| 570,177 | |
| | |
| | | |
| | |
| Software - 0.51% | |
| | | |
| | |
| Fair Isaac Corp., 4.000%, 06/15/2028(e) | |
| 2,250,000 | | |
| 2,106,587 | |
See
Notes to Financial Statements.
| Semi-Annual Report
| June 30, 2024 |
69 |
| Blackstone
Strategic Credit 2027 Term Fund |
Portfolio
of Investments |
June
30, 2024 (Unaudited)
| | |
Principal
Amount | | |
Value | |
| Software (continued) | |
| | |
| |
| MicroStrategy, Inc., 6.125%, 06/15/2028(e) | |
$ | 810,000 | | |
$ | 785,917 | |
| | |
| | | |
| 2,892,504 | |
| Specialized REITs - 0.19% | |
| | | |
| | |
| Uniti Group LP / Uniti Fiber Holdings, Inc. / CSL Capital LLC, 6.000%, 01/15/2030(e) | |
| 350,000 | | |
| 212,184 | |
| Uniti Group LP / Uniti Group Finance, Inc. / CSL Capital LLC, 6.500%, 02/15/2029(e) | |
| 1,390,000 | | |
| 887,885 | |
| | |
| | | |
| 1,100,069 | |
| Specialty Retail - 0.76% | |
| | | |
| | |
| Asbury Automotive Group, Inc., 5.000%, 02/15/2032(e) | |
| 400,000 | | |
| 362,653 | |
| Bath & Body Works, Inc., 6.950%, 03/01/2033 | |
| 500,000 | | |
| 487,229 | |
| Foot Locker, Inc., 4.000%, 10/01/2029(e) | |
| 670,000 | | |
| 558,945 | |
| Gap, Inc.: | |
| | | |
| | |
| 3.625%, 10/01/2029(e) | |
| 945,000 | | |
| 818,962 | |
| 3.875%, 10/01/2031(e) | |
| 1,020,000 | | |
| 852,547 | |
| Sonic Automotive, Inc., 4.880%, 11/15/2031(e) | |
| 370,000 | | |
| 326,047 | |
| Upbound Group, Inc., 6.375%, 02/15/2029(e) | |
| 79,000 | | |
| 75,853 | |
| Victoria's Secret & Co., 4.625%, 07/15/2029(e) | |
| 1,024,000 | | |
| 852,220 | |
| | |
| | | |
| 4,334,456 | |
| Technology Hardware, Storage & Peripherals - 0.36% | |
| | | |
| | |
| Xerox Holdings Corp., 5.500%, 08/15/2028(e) | |
| 2,406,000 | | |
| 2,074,607 | |
| | |
| | | |
| | |
| Textiles, Apparel & Luxury Goods - 0.22% | |
| | | |
| | |
| Crocs, Inc., 4.250%, 03/15/2029(e) | |
| 500,000 | | |
| 456,256 | |
| Wolverine World Wide, Inc., 4.000%, 08/15/2029(e) | |
| 930,000 | | |
| 779,354 | |
| | |
| | | |
| 1,235,610 | |
| Tobacco - 0.22% | |
| | | |
| | |
| Vector Group, Ltd., 5.750%, 02/01/2029(e) | |
| 1,355,000 | | |
| 1,271,024 | |
| | |
| | | |
| | |
| TOTAL CORPORATE BONDS | |
| | | |
| | |
| (Cost $141,742,069) | |
| | | |
| 143,849,181 | |
| | |
Shares | | |
Value | |
| COMMON STOCK - 0.43% | |
| | | |
| | |
| Energy Equipment & Services - 0.22% | |
| | | |
| | |
| Brock Holdings III Inc.(b)(f) | |
| 164,832 | | |
| – | |
| Total Safety Holdings, LLC(b)(f) | |
| 2,951 | | |
| 1,106,625 | |
| Utex Industries Holdings, LLC(f) | |
| 3,182 | | |
| 146,372 | |
| | |
| | | |
| 1,252,997 | |
| Health Care Equipment & Supplies - 0.07% | |
| | | |
| | |
| Carestream Health Holdings Inc(b)(f) | |
| 242,545 | | |
| 394,136 | |
| | |
| | | |
| | |
| Health Care Providers & Services - 0.14% | |
| | | |
| | |
| Envision Healthcare Corp. Equity(f) | |
| 79,338 | | |
| 786,768 | |
| | |
| | | |
| | |
| TOTAL COMMON STOCK | |
| | | |
| | |
| (Cost $13,722,925) | |
| | | |
| 2,433,901 | |
See
Notes to Financial Statements.
| 70 |
www.blackstone-credit.com |
| Blackstone
Strategic Credit 2027 Term Fund |
Portfolio
of Investments |
June
30, 2024 (Unaudited)
| | |
Shares | | |
Value | |
| WARRANTS - 0.00%(g) | |
| | |
| |
| Energy Equipment & Services - 0.00%(g) | |
| | | |
| | |
| Utex Industries Holdings, LLC expires 12/31/2049 at $114.76(b) | |
| 7,955 | | |
$ | 3,182 | |
| | |
| | | |
| | |
| TOTAL WARRANTS | |
| | | |
| | |
| (Cost $0) | |
| | | |
| 3,182 | |
| | |
| | | |
| | |
| SHORT TERM INVESTMENTS - 2.92% | |
| | | |
| | |
| Open-end Investment Companies - 2.92% | |
| | | |
| | |
| Fidelity Treasury Portfolio | |
| | | |
| | |
| (5.20% 7-Day Yield) | |
| 16,628,490 | | |
| 16,628,490 | |
| | |
| | | |
| | |
| TOTAL SHORT TERM INVESTMENTS | |
| | | |
| | |
| (Cost $16,628,490) | |
| | | |
| 16,628,490 | |
| | |
| | | |
| | |
| Total Investments- 165.83% | |
| | | |
| | |
| (Cost $966,090,431) | |
| | | |
| 945,698,113 | |
| | |
| | | |
| | |
| Liabilities in Excess of Other Assets - (6.94)% | |
| | | |
| (39,549,508 | ) |
| | |
| | | |
| | |
| Mandatory Redeemable Preferred Shares - (7.85)% | |
| | | |
| | |
| | |
| | | |
| | |
| (liquidation preference plus distributions payable on term preferred shares) | |
| | | |
| (44,763,049 | ) |
| | |
| | | |
| | |
| Leverage Facility - (51.05)% | |
| | | |
| (291,100,000 | ) |
| |
| | | |
| | |
| Net Assets - 100.00% | |
| | | |
$ | 570,285,556 | |
Amounts
above are shown as a percentage of net assets as of June 30, 2024.
Investment
Abbreviations:
LIBOR
- London Interbank Offered Rate
SOFR
- Secured Overnight Financing Rate
Reference
Rates:
1M
US L - 1 Month LIBOR as of June 30, 2024 was 5.45%
3M US L - 3 Month LIBOR as of June 30, 2024 was 5.59%
6M US L - 6 Month LIBOR
as of June 30, 2024 was 5.68%
1M US SOFR- 1 Month SOFR as of June 30, 2024 was 5.34%
3M US SOFR - 3 Month SOFR as of June 30,
2024 was 5.32%
6M US SOFR - 6 Month SOFR as of June 30, 2024 was 5.25%
1M
CME TERM SOFR - 1 Month CME TERM SOFR as of June 30, 2024 was 5.34%
3M CME TERM SOFR - 3 Month CME TERM SOFR as of June 30, 2024
was 5.32%
6M CME TERM SOFR - 6 Month CME TERM SOFR as of June 30, 2024 was 5.25%
PRIME - US Prime Rate as of June 30, 2024 was
8.50%
| (a) | Floating
or variable rate security. The reference rate is described above. The rate in effect
as of June 30, 2024 is based on the reference rate plus the displayed spread as of the
security's last reset date. Where applicable, the reference rate is subject to a floor
rate. |
| (b) | Level
3 assets valued using significant unobservable inputs as a result of unavailable quoted
prices from an active market or the unavailability of other significant observable inputs.
|
| (c) | A
portion of this position was not funded as of June 30, 2024. The Portfolio of Investments
records only the funded portion of each position. As of June 30, 2024, the Fund has unfunded
delayed draw loans in the amount of $926,648. Fair value of these unfunded delayed draws
was $931,050. Additional information is provided in Note 9 General Commitments and Contingencies.
|
| (d) | Represents
a payment-in-kind (“PIK”) security which may pay interest/dividend in additional
par/shares. |
| (e) | Security
exempt from registration under Rule 144A of the Securities Act of 1933. Total market
value of Rule 144A securities amounts to $124,598,751, which represented approximately
21.85% of net assets as of June 30, 2024. Such securities may normally be sold to qualified
institutional buyers in transactions exempt from registration. |
| (f) | Non-income
producing security. |
| (g) | Amount
represents less than 0.005% of net assets. |
See
Notes to Financial Statements.
| Semi-Annual Report
| June 30, 2024 |
71 |
| Blackstone Credit & Insurance
Funds |
Statements
of Assets and Liabilities |
June
30, 2024 (Unaudited)
| | |
Senior Floating Rate
2027 Term Fund | | |
Long-Short Credit
Income Fund | | |
Strategic Credit
2027 Term Fund | |
| ASSETS: | |
| | |
| | |
| |
| Investments, at fair value (Cost $302,383,241, $263,313,891 and $966,090,431, respectively) | |
$ | 297,190,326 | | |
$ | 258,686,798 | | |
$ | 945,698,113 | |
| Cash | |
| 39,406 | | |
| 3,179,765 | | |
| 1,482,836 | |
| Receivable for investment securities sold | |
| 26,993,772 | | |
| 19,663,410 | | |
| 53,421,861 | |
| Interest receivable | |
| 1,683,558 | | |
| 1,600,858 | | |
| 5,882,749 | |
| Net unrealized appreciation on unfunded loan commitments | |
| 3,051 | | |
| 2,880 | | |
| 5,858 | |
| Prepaid offering costs | |
| 358,525 | | |
| 446,647 | | |
| – | |
| Prepaid expenses and other assets | |
| 21,476 | | |
| 17,008 | | |
| 67,712 | |
| Total Assets | |
| 326,290,114 | | |
| 283,597,366 | | |
| 1,006,559,129 | |
| | |
| | | |
| | | |
| | |
| LIABILITIES: | |
| | | |
| | | |
| | |
| Payable for investment securities purchased | |
| 40,848,632 | | |
| 33,805,056 | | |
| 94,739,483 | |
| Leverage facility | |
| 90,600,000 | | |
| 79,200,000 | | |
| 291,100,000 | |
| Interest due on leverage facility | |
| 940,481 | | |
| 415,525 | | |
| 2,137,087 | |
| Accrued investment advisory fee payable | |
| 309,331 | | |
| 506,294 | | |
| 698,357 | |
| Accrued fund accounting and administration fees payable | |
| 204,629 | | |
| 185,853 | | |
| 599,276 | |
| Accrued trustees' fees payable | |
| 28,381 | | |
| 31,218 | | |
| 134,147 | |
| Other payables and accrued expenses | |
| 778,756 | | |
| 767,068 | | |
| 2,102,174 | |
| Mandatory redeemable preferred shares(a) (net of deferred financing costs of: –, – and 523,451, respectively)(a) | |
| – | | |
| – | | |
| 44,476,549 | |
| Distributions payable on mandatory redeemable preferred shares | |
| – | | |
| – | | |
| 286,500 | |
| Total Liabilities | |
| 133,710,210 | | |
| 114,911,014 | | |
| 436,273,573 | |
| Net Assets Attributable to Common Shareholders | |
$ | 192,579,904 | | |
$ | 168,686,352 | | |
$ | 570,285,556 | |
| | |
| | | |
| | | |
| | |
| COMPOSITION OF NET ASSETS ATTRIBUTABLE TO COMMON SHARES: | |
| | | |
| | | |
| | |
| Par value ($0.001 per share, applicable to 13,008,542, 12,708,275 and 44,664,382 shares issued and outstanding) | |
$ | 13,009 | | |
$ | 12,708 | | |
$ | 44,664 | |
| Paid-in capital in excess of par value | |
| 257,204,936 | | |
| 236,816,138 | | |
| 839,503,351 | |
| Total distributable earnings | |
| (64,638,041 | ) | |
| (68,142,494 | ) | |
| (269,262,459 | ) |
| Net Assets Attributable to Common Shareholders | |
$ | 192,579,904 | | |
$ | 168,686,352 | | |
$ | 570,285,556 | |
| | |
| | | |
| | | |
| | |
| Net Asset Value per Common Share | |
$ | 14.80 | | |
$ | 13.27 | | |
$ | 12.77 | |
| (a) | $1,000
liquidation value per share. 45,000 shares issued and outstanding for BGB . |
See
Notes to Financial Statements.
| 72 | www.blackstone-credit.com |
| Blackstone Credit & Insurance
Funds |
Statements
of Operations |
For
the Six Months Ended June 30, 2024 (Unaudited)
| | |
Senior Floating Rate
2027 Term Fund | | |
Long-Short Credit
Income Fund | | |
Strategic Credit
2027 Term Fund | |
| INVESTMENT INCOME: | |
| | |
| | |
| |
| Interest | |
$ | 14,029,757 | | |
$ | 12,167,307 | | |
$ | 43,555,134 | |
| Total Investment Income | |
| 14,029,757 | | |
| 12,167,307 | | |
| 43,555,134 | |
| | |
| | | |
| | | |
| | |
| EXPENSES: | |
| | | |
| | | |
| | |
| Investment advisory fee | |
| 1,268,266 | | |
| 1,008,875 | | |
| 4,461,476 | |
| Fund accounting and administration fees | |
| 151,915 | | |
| 133,207 | | |
| 479,493 | |
| Insurance expense | |
| 2,731 | | |
| 1,891 | | |
| 18,379 | |
| Legal and audit fees | |
| 208,299 | | |
| 129,274 | | |
| 498,039 | |
| Custodian fees | |
| 116,201 | | |
| 41,544 | | |
| 107,937 | |
| Amortization of deferred financing costs | |
| – | | |
| – | | |
| 88,372 | |
| Trustees' fees and expenses | |
| 62,384 | | |
| 55,629 | | |
| 192,783 | |
| Printing expense | |
| 1,206 | | |
| 16,490 | | |
| 17,656 | |
| Transfer agent fees | |
| 5,937 | | |
| 2,823 | | |
| 30,148 | |
| Interest on leverage facility | |
| 3,027,919 | | |
| 2,636,177 | | |
| 9,094,021 | |
| Other expenses | |
| 90,644 | | |
| 65,565 | | |
| 309,881 | |
| Distributions to mandatory redeemable preferred shares | |
| – | | |
| – | | |
| 1,485,000 | |
| Total Expenses | |
| 4,935,502 | | |
| 4,091,475 | | |
| 16,783,185 | |
| Net Investment Income | |
| 9,094,255 | | |
| 8,075,832 | | |
| 26,771,949 | |
| | |
| | | |
| | | |
| | |
| NET REALIZED AND UNREALIZED GAIN/(LOSS) ON INVESTMENTS: | |
| | | |
| | | |
| | |
| Net realized gain/(loss) on: | |
| | | |
| | | |
| | |
| Investment securities and unfunded loan commitments | |
| 624,886 | | |
| 825,815 | | |
| 4,275,364 | |
| Net realized gain: | |
| 624,886 | | |
| 825,815 | | |
| 4,275,364 | |
| Net change in unrealized appreciation/(depreciation) on: | |
| | | |
| | | |
| | |
| Investment securities | |
| (49,627 | ) | |
| (489,369 | ) | |
| (5,055,870 | ) |
| Net change in unrealized appreciation/(depreciation) on investments | |
| (49,627 | ) | |
| (489,369 | ) | |
| (5,055,870 | ) |
| Net Realized and Unrealized Gain/(Loss) on Investments | |
| 575,259 | | |
| 336,446 | | |
| (780,506 | ) |
| | |
| | | |
| | | |
| | |
| Net Increase in Net Assets Attributable to Common Shares from Operations | |
$ | 9,669,514 | | |
$ | 8,412,278 | | |
$ | 25,991,443 | |
See
Notes to Financial Statements.
| Semi-Annual
Report | June 30, 2024 |
73 |
| Blackstone Credit & Insurance
Funds |
Statements
of Changes in Net Assets |
| | |
Senior Floating Rate
2027 Term Fund | | |
Long-Short Credit
Income Fund | | |
Strategic Credit
2027 Term Fund | |
| | |
For the Six
Months Ended
June 30, 2024
(Unaudited) | | |
For the
Year Ended
December 31,
2023 | | |
For the Six
Months Ended
June 30, 2024
(Unaudited) | | |
For the
Year Ended
December 31,
2023 | | |
For the Six
Months Ended
June 30, 2024
(Unaudited) | | |
For the
Year Ended
December 31,
2023 | |
| FROM OPERATIONS: | |
| | | |
| | | |
| | | |
| | | |
| | | |
| | |
| Net investment income(a) | |
$ | 9,094,255 | | |
$ | 17,810,755 | | |
$ | 8,075,832 | | |
$ | 16,070,215 | | |
$ | 26,771,949 | | |
$ | 51,138,592 | |
| Net realized gain/(loss) | |
| 624,886 | | |
| (5,625,243 | ) | |
| 825,815 | | |
| (7,329,703 | ) | |
| 4,275,364 | | |
| (25,331,662 | ) |
| Net change in
unrealized appreciation/(depreciation) on Investment securities | |
| (49,627 | ) | |
| 14,680,231 | | |
| (489,369 | ) | |
| 15,691,034 | | |
| (5,055,870 | ) | |
| 54,842,312 | |
| Net Increase in Net Assets Attributable to Common Shares from Operations | |
| 9,669,514 | | |
| 26,865,743 | | |
| 8,412,278 | | |
| 24,431,546 | | |
| 25,991,443 | | |
| 80,649,242 | |
| | |
| | | |
| | | |
| | | |
| | | |
| | | |
| | |
| DISTRIBUTIONS TO COMMON SHAREHOLDERS: | |
| | |
| From distributable earnings | |
| (7,414,869 | ) | |
| (18,680,266 | ) | |
| (6,646,428 | ) | |
| (17,041,796 | ) | |
| (21,170,917 | ) | |
| (54,043,902 | ) |
| Net Decrease in Net Assets from Distributions to Common Shareholders | |
| (7,414,869 | ) | |
| (18,680,266 | ) | |
| (6,646,428 | ) | |
| (17,041,796 | ) | |
| (21,170,917 | ) | |
| (54,043,902 | ) |
| | |
| | | |
| | | |
| | | |
| | | |
| | | |
| | |
| Net Increase in Net Assets Attributable to Common Shares | |
| 2,254,645 | | |
| 8,185,477 | | |
| 1,765,850 | | |
| 7,389,750 | | |
| 4,820,526 | | |
| 26,605,340 | |
| | |
| | | |
| | | |
| | | |
| | | |
| | | |
| | |
| NET ASSETS ATTRIBUTABLE TO COMMON SHAREHOLDERS: | |
| | |
| Beginning of period | |
| 190,325,259 | | |
| 182,139,782 | | |
| 166,920,502 | | |
| 159,530,752 | | |
| 565,465,030 | | |
| 538,859,690 | |
| End of period | |
$ | 192,579,904 | | |
$ | 190,325,259 | | |
$ | 168,686,352 | | |
$ | 166,920,502 | | |
$ | 570,285,556 | | |
$ | 565,465,030 | |
| (a) | Includes
impact of distributions to preferred shareholders from net investment income. Distributions
on the Fund's mandatory redeemable preferred stock ("MRPS") are treated as
an operating expense under GAAP and are included in the calculation of net investment
income. See Note 11 - Leverage. The Long-Short Credit Income Fund and the Strategic Credit
2027 Term Fund recorded distributions of $– and $1,485,000, respectively, to holders
of MRPS for the six months ended June 30, 2024. For the fiscal year ended December 31,
2023, the Long-Short Credit Income Fund and the Strategic Credit 2027 Term Fund recorded
distributions of $416,686 and $2,183,294, respectively, to holders of MRPS. See Note
12 for details on tax characterization of distributions. |
See
Notes to Financial Statements.
| 74 | www.blackstone-credit.com |
| Blackstone Credit & Insurance
Funds |
Statements
of Cash Flows |
For
the Six Months Ended June 30, 2024 (Unaudited)
| | |
Senior Floating Rate
2027 Term Fund | | |
Long-Short Credit
Income Fund | | |
Strategic Credit
2027 Term Fund | |
| CASH FLOWS FROM OPERATING ACTIVITIES: | |
| | |
| | |
| |
| Net increase in net assets from operations | |
$ | 9,669,514 | | |
$ | 8,412,278 | | |
$ | 25,991,443 | |
| Adjustments to reconcile net increase in net assets from operations to net cash provided by/(used in) operating activities: | |
| | | |
| | | |
| | |
| Purchases of investment securities | |
| (150,073,769 | ) | |
| (135,460,983 | ) | |
| (586,497,328 | ) |
| Payment-in-kind interest | |
| (60,699 | ) | |
| (55,951 | ) | |
| (196,228 | ) |
| Proceeds from disposition of investment securities | |
| 146,809,908 | | |
| 134,736,025 | | |
| 580,057,067 | |
| Net discounts (accreted)/premiums amortized | |
| (488,503 | ) | |
| (558,825 | ) | |
| (2,515,051 | ) |
| Net realized gains on: | |
| | | |
| | | |
| | |
| Investment securities and unfunded loan commitments | |
| (624,886 | ) | |
| (825,815 | ) | |
| (4,275,364 | ) |
| Net change in unrealized depreciation on: | |
| | | |
| | | |
| | |
| Investment securities | |
| 49,627 | | |
| 489,369 | | |
| 5,055,870 | |
| Net purchases of short term investment | |
| 1,848,850 | | |
| 1,461,105 | | |
| (316,884 | ) |
| Amortization of deferred financing costs | |
| – | | |
| – | | |
| 88,372 | |
| (Increase)/Decrease in assets: | |
| | | |
| | | |
| | |
| Interest receivable | |
| 184,651 | | |
| 210,695 | | |
| 970,409 | |
| Net unrealized appreciation on unfunded loan commitments | |
| 2,252 | | |
| 1,448 | | |
| 7,582 | |
| Prepaid expenses and other assets | |
| 3,557 | | |
| 2,706 | | |
| 29,247 | |
| Increase/(Decrease) in liabilities: | |
| | | |
| | | |
| | |
| Distributions payable on mandatory redeemable preferred shares | |
| – | | |
| – | | |
| (216,750 | ) |
| Interest due on loan facility | |
| 452,693 | | |
| (184,238 | ) | |
| (892,040 | ) |
| Accrued investment advisory fees payable | |
| (45,893 | ) | |
| 336,105 | | |
| (59,016 | ) |
| Accrued fund accounting and administration expense payable | |
| 78,135 | | |
| 68,294 | | |
| 246,950 | |
| Accrued trustees' fees payable | |
| 3,288 | | |
| 3,892 | | |
| 18,243 | |
| Other payables and accrued expenses | |
| 124,052 | | |
| 97,294 | | |
| 298,056 | |
| Net Cash Provided by/(Used in) Operating Activities | |
| 7,932,777 | | |
| 8,733,399 | | |
| 17,794,578 | |
| | |
| | | |
| | | |
| | |
| CASH FLOWS FROM FINANCING ACTIVITIES: | |
| | | |
| | | |
| | |
| Proceeds from leverage facility | |
| 1,000,000 | | |
| 2,000,000 | | |
| 50,500,000 | |
| Payments on leverage facility | |
| – | | |
| – | | |
| (42,000,000 | ) |
| Distributions paid - common shareholders - net of distributions reinvested | |
| (8,897,843 | ) | |
| (7,955,380 | ) | |
| (25,369,369 | ) |
| Net Cash Used in Financing Activities | |
| (7,897,843 | ) | |
| (5,955,380 | ) | |
| (16,869,369 | ) |
| | |
| | | |
| | | |
| | |
| Net Increase in Cash | |
| 34,934 | | |
| 2,778,019 | | |
| 925,209 | |
| Cash, beginning balance | |
$ | 4,472 | | |
$ | 401,746 | | |
$ | 557,627 | |
| Cash, ending balance | |
$ | 39,406 | | |
$ | 3,179,765 | | |
$ | 1,482,836 | |
| | |
| | | |
| | | |
| | |
| Supplemental disclosure of cash flow information: | |
| | | |
| | | |
| | |
| Interest paid on leverage facility during the period | |
$ | 2,575,226 | | |
$ | 2,820,415 | | |
$ | 9,986,061 | |
See
Notes to Financial Statements.
| Semi-Annual
Report | June 30, 2024 |
75 |
| Blackstone Senior Floating
Rate 2027 Term Fund |
Financial
Highlights |
For
a Share Outstanding Throughout the Periods Indicated
| | |
For the Six
Months Ended June 30, 2024
(Unaudited) | | |
For the
Year Ended
December 31, 2023 | | |
For the
Year Ended
December 31, 2022 | | |
For the
Year Ended
December 31, 2021 | |
| PER COMMON SHARE OPERATING PERFORMANCE: | |
| | |
| | |
| | |
| |
| Net asset value - beginning of period | |
$ | 14.63 | | |
$ | 14.00 | | |
$ | 16.21 | | |
$ | 15.88 | |
| INCOME/(LOSS) FROM INVESTMENT OPERATIONS: | |
| | | |
| | | |
| | | |
| | |
| Net investment income(a) | |
| 0.70 | | |
| 1.37 | | |
| 1.04 | | |
| 1.02 | |
| Net realized and unrealized gain/(loss) on investments, foreign currency transactions and unfunded loan commitments | |
| 0.04 | | |
| 0.70 | | |
| (2.39 | ) | |
| 0.30 | |
| Total Income/(Loss) from Investment Operations | |
| 0.74 | | |
| 2.07 | | |
| (1.35 | ) | |
| 1.32 | |
| | |
| | | |
| | | |
| | | |
| | |
| DISTRIBUTIONS TO COMMON SHAREHOLDERS: | |
| | | |
| | | |
| | | |
| | |
| From net investment income | |
| (0.57 | ) | |
| (1.44 | ) | |
| (0.86 | ) | |
| (0.99 | ) |
| Total Distributions to Common Shareholders | |
| (0.57 | ) | |
| (1.44 | ) | |
| (0.86 | ) | |
| (0.99 | ) |
| | |
| | | |
| | | |
| | | |
| | |
| Net asset value per common share - end of period | |
$ | 14.80 | | |
$ | 14.63 | | |
$ | 14.00 | | |
$ | 16.21 | |
| Market price per common share - end of period | |
$ | 14.01 | | |
$ | 13.35 | | |
$ | 12.43 | | |
$ | 17.17 | |
| | |
| | | |
| | | |
| | | |
| | |
| Total Investment Return - Net Asset Value(b) | |
| 5.29 | % | |
| 16.64 | % | |
| (8.01 | %) | |
| 8.57 | % |
| Total Investment Return - Market Price(b) | |
| 9.22 | % | |
| 19.88 | % | |
| (22.89 | %) | |
| 28.43 | % |
| | |
| | | |
| | | |
| | | |
| | |
| RATIOS AND SUPPLEMENTAL DATA: | |
| | | |
| | | |
| | | |
| | |
| Net assets attributable to common shares, end of period (000s) | |
$ | 192,580 | | |
$ | 190,325 | | |
$ | 182,140 | | |
$ | 219,387 | |
| Ratio of expenses to average net assets attributable to common shares | |
| 5.14 | %(c) | |
| 4.69 | % | |
| 3.18 | % | |
| 2.36 | % |
| Ratio of expenses to average managed assets(d) | |
| 3.50 | %(c) | |
| 3.28 | % | |
| 2.16 | % | |
| 1.60 | % |
| Ratio of net investment income to average net assets attributable to common shares | |
| 9.48 | %(c) | |
| 9.50 | % | |
| 6.95 | % | |
| 6.23 | % |
| Portfolio turnover rate | |
| 60 | %(e) | |
| 60 | % | |
| 75 | % | |
| 97 | % |
| | |
| | | |
| | | |
| | | |
| | |
| LEVERAGE FACILITY: | |
| | | |
| | | |
| | | |
| | |
| Aggregate principal amount, end of period (000s) | |
$ | 90,600 | | |
$ | 89,600 | | |
$ | 85,000 | | |
$ | 105,500 | |
| Average borrowings outstanding during the period (000s) | |
$ | 90,479 | | |
$ | 80,626 | | |
$ | 94,819 | | |
$ | 105,974 | |
| Asset coverage, end of period per $1,000(f) | |
$ | 3,126 | | |
$ | 3,124 | | |
$ | 3,143 | | |
$ | 3,079 | |
See
Notes to Financial Statements.
| 76 | www.blackstone-credit.com |
| Blackstone Senior Floating
Rate 2027 Term Fund |
Financial
Highlights |
For
a Share Outstanding Throughout the Periods Indicated
| | |
For the
Year Ended
December 31, 2020 (g) | | |
For the
Year Ended
December 31, 2019 | | |
For the
Year Ended
December 31, 2018 | | |
For the
Year Ended
December 31, 2017 | |
| PER COMMON SHARE OPERATING PERFORMANCE: | |
| | |
| | |
| | |
| |
| Net asset value - beginning of period | |
$ | 16.41 | | |
$ | 16.48 | | |
$ | 17.57 | | |
$ | 17.61 | |
| INCOME/(LOSS) FROM INVESTMENT OPERATIONS: | |
| | | |
| | | |
| | | |
| | |
| Net investment income(a) | |
| 1.08 | | |
| 1.31 | | |
| 1.32 | | |
| 1.26 | |
| Net realized and unrealized gain/(loss) on investments, foreign currency transactions and unfunded loan commitments | |
| (0.72 | ) | |
| (0.06 | ) | |
| (1.00 | ) | |
| (0.14 | ) |
| Total Income from Investment Operations | |
| 0.36 | | |
| 1.25 | | |
| 0.32 | | |
| 1.12 | |
| | |
| | | |
| | | |
| | | |
| | |
| DISTRIBUTIONS TO COMMON SHAREHOLDERS: | |
| | | |
| | | |
| | | |
| | |
| From net investment income | |
| (1.09 | ) | |
| (1.32 | ) | |
| (1.41 | ) | |
| (1.16 | ) |
| Total Distributions to Common Shareholders | |
| (1.09 | ) | |
| (1.32 | ) | |
| (1.41 | ) | |
| (1.16 | ) |
| | |
| | | |
| | | |
| | | |
| | |
| CAPITAL SHARE TRANSACTIONS: | |
| | | |
| | | |
| | | |
| | |
| Accretion to net asset value resulting from share repurchases | |
| 0.20 | | |
| – | | |
| – | | |
| – | |
| Total Capital Share Transactions | |
| 0.20 | | |
| – | | |
| – | | |
| – | |
| Net asset value per common share - end of period | |
$ | 15.88 | | |
$ | 16.41 | | |
$ | 16.48 | | |
$ | 17.57 | |
| Market price per common share - end of period | |
$ | 14.22 | | |
$ | 16.15 | | |
$ | 15.33 | | |
$ | 18.00 | |
| | |
| | | |
| | | |
| | | |
| | |
| Total Investment Return - Net Asset Value(b) | |
| 4.98 | % | |
| 7.92 | % | |
| 1.88 | % | |
| 6.67 | % |
| Total Investment Return - Market Price(b) | |
| (4.48 | %) | |
| 14.17 | % | |
| (7.49 | %) | |
| 6.44 | % |
| | |
| | | |
| | | |
| | | |
| | |
| RATIOS AND SUPPLEMENTAL DATA: | |
| | | |
| | | |
| | | |
| | |
| Net assets attributable to common shares, end of period (000s) | |
$ | 215,253 | | |
$ | 250,848 | | |
$ | 251,645 | | |
$ | 267,903 | |
| Ratio of expenses to average net assets attributable to common shares | |
| 2.75 | % | |
| 3.54 | % | |
| 3.35 | % | |
| 3.01 | % |
| Ratio of expenses to average managed assets(d) | |
| 1.87 | % | |
| 2.37 | % | |
| 2.25 | % | |
| 2.02 | % |
| Ratio of net investment income to average net assets attributable to common shares | |
| 7.19 | % | |
| 7.82 | % | |
| 7.49 | % | |
| 7.11 | % |
| Portfolio turnover rate | |
| 76 | % | |
| 40 | % | |
| 88 | % | |
| 135 | % |
| | |
| | | |
| | | |
| | | |
| | |
| LEVERAGE FACILITY: | |
| | | |
| | | |
| | | |
| | |
| Aggregate principal amount, end of period (000s) | |
$ | 100,000 | | |
$ | 123,500 | | |
$ | 124,000 | | |
$ | 132,000 | |
| Average borrowings outstanding during the period (000s) | |
$ | 104,521 | | |
$ | 125,408 | | |
$ | 132,067 | | |
$ | 132,323 | |
| Asset coverage, end of period per $1,000(f) | |
$ | 3,153 | | |
$ | 3,031 | | |
$ | 3,029 | | |
$ | 3,030 | |
See
Notes to Financial Statements.
| Semi-Annual
Report | June 30, 2024 |
77 |
| Blackstone Senior Floating
Rate 2027 Term Fund |
Financial
Highlights |
For
a Share Outstanding Throughout the Periods Indicated
| | |
For the
Year Ended
December 31, 2016 | |
|
For the
Year Ended
December 31, 2015 | |
|
For the
Year Ended
December 31, 2014 | |
| PER COMMON SHARE OPERATING PERFORMANCE: | |
| |
|
| |
|
| |
| Net asset value - beginning of period | |
$ | 15.96 | |
|
$ | 18.08 | |
|
$ | 19.27 | |
| INCOME/(LOSS) FROM INVESTMENT OPERATIONS: | |
| | |
|
| | |
|
| | |
| Net investment income(a) | |
| 1.24 | |
|
| 1.22 | |
|
| 0.92 | |
| Net realized and unrealized gain/(loss) on investments, foreign currency transactions and unfunded loan commitments | |
| 1.57 | |
|
| (2.17 | ) |
|
| (0.84 | ) |
| DISTRIBUTIONS TO PREFERRED SHAREHOLDERS: | |
| | |
|
| | |
|
| | |
| From net investment income(a) | |
| – | |
|
| – | |
|
| (0.06 | ) |
| From net realized gains | |
| – | |
|
| – | |
|
| – | |
| Total Income/(Loss) from Investment Operations | |
| 2.81 | |
|
| (0.95 | ) |
|
| 0.02 | |
| | |
| | |
|
| | |
|
| | |
| DISTRIBUTIONS TO COMMON SHAREHOLDERS: | |
| | |
|
| | |
|
| | |
| From net investment income | |
| (1.16 | ) |
|
| (1.17 | ) |
|
| (0.86 | ) |
| From net realized gains | |
| – | |
|
| – | |
|
| (0.08 | ) |
| From tax return of capital | |
| – | |
|
| – | |
|
| (0.27 | ) |
| Total Distributions to Common Shareholders | |
| (1.16 | ) |
|
| (1.17 | ) |
|
| (1.21 | ) |
| | |
| | |
|
| | |
|
| | |
| Net asset value per common share - end of period | |
$ | 17.61 | |
|
$ | 15.96 | |
|
$ | 18.08 | |
| Market price per common share - end of period | |
$ | 18.08 | |
|
$ | 14.85 | |
|
$ | 16.74 | |
| | |
| | |
|
| | |
|
| | |
| Total Investment Return - Net Asset Value(b) | |
| 18.44 | % |
|
| (5.19 | %) |
|
| 0.38 | % |
| Total Investment Return - Market Price(b) | |
| 30.70 | % |
|
| (4.72 | %) |
|
| (4.99 | %) |
| | |
| | |
|
| | |
|
| | |
| RATIOS AND SUPPLEMENTAL DATA: | |
| | |
|
| | |
|
| | |
| Net assets attributable to common shares, end of period (000s) | |
$ | 268,153 | |
|
$ | 242,874 | |
|
$ | 275,201 | |
| Ratio of expenses to average net assets attributable to common shares | |
| 2.59 | % |
|
| 2.48 | % |
|
| 3.02 | %(h) |
| Ratio
of expenses to average managed assets(d) | |
| 1.74 | % |
|
| 1.67 | % |
|
| 2.02 | %(h) |
| Ratio of net investment income to average net assets attributable to common shares | |
| 7.48 | % |
|
| 6.84 | % |
|
| 4.88 | %(h) |
| Portfolio turnover rate | |
| 99 | % |
|
| 65 | % |
|
| 66 | % |
| | |
| | |
|
| | |
|
| | |
| SENIOR SECURED NOTES: | |
| | |
|
| | |
|
| | |
| Aggregate principal amount, end of period (000s) | |
$ | N/A | |
|
$ | N/A | |
|
$ | – | (i) |
| Average borrowings outstanding during the period (000s) | |
$ | N/A | |
|
$ | N/A | |
|
$ | 96,000 | (i) |
| Asset coverage, end of period per $1,000 | |
$ | N/A | |
|
$ | N/A | |
|
$ | N/A | (i) |
| | |
| | |
|
| | |
|
| | |
| LEVERAGE FACILITY: | |
| | |
|
| | |
|
| | |
| Aggregate principal amount, end of period (000s) | |
$ | 131,000 | |
|
$ | 119,500 | |
|
$ | 133,000 | |
| Average borrowings outstanding during the period (000s) | |
$ | 122,782 | |
|
$ | 132,372 | |
|
$ | 137,412 | (j) |
| Asset coverage, end of period per $1,000(f) | |
$ | 3,047 | |
|
$ | 3,032 | |
|
$ | 3,069 | |
| (a) | Calculated
using average common shares outstanding. |
| (b) | Total
investment return is calculated assuming a purchase of common share at the opening on
the first day and a sale at closing on the last day of each period reported. Dividends
and distributions are assumed for purposes of this calculation to be reinvested at prices
obtained under the Fund's dividend reinvestment plan. Total investment returns does not
reflect sales load or brokerage commissions, if any, and are not annualized. |
| (d) | Average
managed assets represent net assets applicable to common shares plus principal value
of leverage. |
| (e) | Percentage
represents the results for the period and is not annualized. |
| (f) | Calculated
by subtracting the Fund's total liabilities (excluding the principal amount of the Leverage
Facility) from the Fund's total assets and dividing by the principal amount of the Leverage
Facility and then multiplying by $1,000. |
| (g) | Prior
to December 10, 2020 the Blackstone Senior Floating Rate 2027 Term Fund was known as
the Blackstone / GSO Senior Floating Rate Term Fund. |
| (h) | Ratios
do not reflect dividend payments to preferred shareholders. |
| (i) | On
October 8, 2014, BSL redeemed 100% of the senior secured notes at 100% of their principal
amount and entered into a new 364-day revolving credit facility. Average borrowings are
shown for the period January 1, 2014 through the redemption date. |
| (j) | Since
first borrowing was made on October 8, 2014. |
See
Notes to Financial Statements.
| 78 | www.blackstone-credit.com |
| Blackstone Long-Short Credit
Income Fund |
Financial
Highlights |
For
a Share Outstanding Throughout the Periods Indicated
| | |
For the Six
Months Ended
June 30, 2024
(Unaudited) | | |
For the
Year Ended
December 31, 2023 | | |
For the
Year Ended
December 31, 2022 | | |
For the
Year Ended
December 31, 2021 | |
| PER COMMON SHARE OPERATING PERFORMANCE: | |
| | |
| | |
| | |
| |
| Net asset value - beginning of period | |
$ | 13.13 | | |
$ | 12.55 | | |
$ | 15.22 | | |
$ | 14.94 | |
| INCOME/(LOSS) FROM INVESTMENT OPERATIONS: | |
| | | |
| | | |
| | | |
| | |
| Net investment income(a)(b) | |
| 0.64 | | |
| 1.26 | | |
| 1.06 | | |
| 1.06 | |
| Net realized and unrealized gain/(loss) on investments, foreign currency transactions and unfunded loan commitments | |
| 0.02 | | |
| 0.66 | | |
| (2.85 | ) | |
| 0.25 | |
| Total Income/(Loss) from Investment Operations | |
| 0.66 | | |
| 1.92 | | |
| (1.79 | ) | |
| 1.31 | |
| | |
| | | |
| | | |
| | | |
| | |
| DISTRIBUTIONS TO COMMON SHAREHOLDERS: | |
| | | |
| | | |
| | | |
| | |
| From net investment income | |
| (0.52 | ) | |
| (1.34 | ) | |
| (0.88 | ) | |
| (1.03 | ) |
| Total Distributions to Common Shareholders | |
| (0.52 | ) | |
| (1.34 | ) | |
| (0.88 | ) | |
| (1.03 | ) |
| | |
| | | |
| | | |
| | | |
| | |
| Net asset value per common share - end of period | |
$ | 13.27 | | |
$ | 13.13 | | |
$ | 12.55 | | |
$ | 15.22 | |
| Market price per common share - end of period | |
$ | 12.43 | | |
$ | 11.45 | | |
$ | 10.84 | | |
$ | 14.70 | |
| | |
| | | |
| | | |
| | | |
| | |
| Total Investment Return - Net Asset Value(c) | |
| 5.39 | % | |
| 17.64 | % | |
| (11.19 | %) | |
| 9.26 | % |
| Total Investment Return - Market Price(c) | |
| 13.21 | % | |
| 18.77 | % | |
| (20.58 | %) | |
| 17.48 | % |
| | |
| | | |
| | | |
| | | |
| | |
| RATIOS AND SUPPLEMENTAL DATA: | |
| | | |
| | | |
| | | |
| | |
| Net assets attributable to common shares, end of period (000s) | |
$ | 168,686 | | |
$ | 166,921 | | |
$ | 159,531 | | |
$ | 193,368 | |
| Ratio of expenses to average net assets attributable to common shares | |
| 4.87 | %(d) | |
| 5.24 | % | |
| 3.67 | % | |
| 2.69 | % |
| Ratio of expenses to average managed assets(e) | |
| 3.33 | %(d) | |
| 3.39 | % | |
| 2.24 | % | |
| 1.67 | % |
| Ratio of net investment income to average net assets attributable to common shares | |
| 9.61 | %(d) | |
| 9.77 | % | |
| 7.68 | % | |
| 6.89 | % |
| Portfolio turnover rate | |
| 61 | %(f) | |
| 88 | % | |
| 94 | % | |
| 90 | % |
| | |
| | | |
| | | |
| | | |
| | |
| MANDATORY REDEEMABLE PREFERRED SHARES: | |
| | | |
| | | |
| | | |
| | |
| Liquidation value, end of period, including dividends payable on Mandatory Redeemable Preferred Shares (000s) | |
$ | N/A | | |
$ | N/A | | |
$ | 20,125 | | |
$ | 20,128 | |
| Total shares outstanding (000s) | |
| – | | |
| – | | |
| 20 | | |
| 20 | |
| Asset coverage , end of period per $1,000(g) | |
$ | N/A | | |
$ | N/A | | |
$ | 2,550 | | |
$ | 2,626 | |
| Liquidation preference per share | |
$ | N/A | | |
$ | N/A | | |
$ | 1,000 | | |
$ | 1,000 | |
| | |
| | | |
| | | |
| | | |
| | |
| LEVERAGE FACILITY: | |
| | | |
| | | |
| | | |
| | |
| Aggregate principal amount, end of period (000s) | |
$ | 79,200 | | |
$ | 77,200 | | |
$ | 82,800 | | |
$ | 98,900 | |
| Average borrowings outstanding during the period (000s) | |
$ | 78,552 | | |
$ | 78,190 | | |
$ | 92,127 | | |
$ | 100,347 | |
| Asset coverage, end of period per $1,000(h) | |
$ | 3,130 | | |
$ | 3,162 | | |
$ | 3,170 | | |
$ | 3,157 | |
See
Notes to Financial Statements.
| Semi-Annual
Report | June 30, 2024 |
79 |
| Blackstone Long-Short Credit
Income Fund |
Financial
Highlights |
For
a Share Outstanding Throughout the Periods Indicated
| | |
For the
Year Ended
December 31, 2020 (i) | | |
For the
Year Ended
December 31, 2019 | | |
For the
Year Ended
December 31, 2018 | | |
For the
Year Ended
December 31, 2017 | |
| PER COMMON SHARE OPERATING PERFORMANCE: | |
| | |
| | |
| | |
| |
| Net asset value - beginning of period | |
$ | 15.74 | | |
$ | 15.62 | | |
$ | 17.09 | | |
$ | 16.94 | |
| INCOME/(LOSS) FROM INVESTMENT OPERATIONS: | |
| | | |
| | | |
| | | |
| | |
| Net investment income(a)(b) | |
| 1.18 | | |
| 1.46 | | |
| 1.46 | | |
| 1.34 | |
| Net realized and unrealized gain/(loss) on investments, foreign currency transactions and unfunded loan commitments | |
| (0.79 | ) | |
| 0.12 | | |
| (1.32 | ) | |
| 0.05 | |
| Total Income from Investment Operations | |
| 0.39 | | |
| 1.58 | | |
| 0.14 | | |
| 1.39 | |
| | |
| | | |
| | | |
| | | |
| | |
| DISTRIBUTIONS TO COMMON SHAREHOLDERS: | |
| | | |
| | | |
| | | |
| | |
| From net investment income | |
| (1.19 | ) | |
| (1.46 | ) | |
| (1.61 | ) | |
| (1.24 | ) |
| Total Distributions to Common Shareholders | |
| (1.19 | ) | |
| (1.46 | ) | |
| (1.61 | ) | |
| (1.24 | ) |
| | |
| | | |
| | | |
| | | |
| | |
| Net asset value per common share - end of period | |
$ | 14.94 | | |
$ | 15.74 | | |
$ | 15.62 | | |
$ | 17.09 | |
| Market price per common share - end of period | |
$ | 13.42 | | |
$ | 15.64 | | |
$ | 13.74 | | |
$ | 15.92 | |
| | |
| | | |
| | | |
| | | |
| | |
| Total Investment Return - Net Asset Value(c) | |
| 4.41 | % | |
| 10.73 | % | |
| 1.25 | % | |
| 8.85 | % |
| Total Investment Return - Market Price(c) | |
| (5.62 | %) | |
| 25.08 | % | |
| (4.40 | %) | |
| 7.90 | % |
| | |
| | | |
| | | |
| | | |
| | |
| RATIOS AND SUPPLEMENTAL DATA: | |
| | | |
| | | |
| | | |
| | |
| Net assets attributable to common shares, end of period (000s) | |
$ | 189,901 | | |
$ | 199,982 | | |
$ | 198,399 | | |
$ | 217,067 | |
| Ratio of expenses to average net assets attributable to common shares | |
| 3.08 | % | |
| 3.85 | % | |
| 3.73 | % | |
| 3.03 | % |
| Ratio of expenses to average managed assets(e) | |
| 1.89 | % | |
| 2.36 | % | |
| 2.31 | % | |
| 1.93 | % |
| Ratio of net investment income to average net assets attributable to common shares | |
| 8.28 | % | |
| 9.15 | % | |
| 8.52 | % | |
| 7.82 | % |
| Portfolio turnover rate | |
| 77 | % | |
| 40 | % | |
| 75 | % | |
| 126 | % |
| | |
| | | |
| | | |
| | | |
| | |
| MANDATORY REDEEMABLE PREFERRED SHARES: | |
| | | |
| | | |
| | | |
| | |
| Liquidation value, end of period, including dividends payable on Mandatory Redeemable Preferred Shares (000s) | |
$ | 20,128 | | |
$ | 20,128 | | |
$ | 20,122 | | |
$ | 20,121 | |
| Total shares outstanding (000s) | |
| 20 | | |
| 20 | | |
| 20 | | |
| 20 | |
| Asset coverage , end of period per $1,000(g) | |
$ | 2,638 | | |
$ | 2,562 | | |
$ | 2,556 | | |
$ | 2,644 | |
| Liquidation preference per share | |
$ | 1,000 | | |
$ | 1,000 | | |
$ | 1,000 | | |
$ | 1,000 | |
| | |
| | | |
| | | |
| | | |
| | |
| LEVERAGE FACILITY: | |
| | | |
| | | |
| | | |
| | |
| Aggregate principal amount, end of period (000s) | |
$ | 95,900 | | |
$ | 108,000 | | |
$ | 107,500 | | |
$ | 112,000 | |
| Average borrowings outstanding during the period (000s) | |
$ | 93,946 | | |
$ | 109,385 | | |
$ | 115,392 | | |
$ | 105,633 | |
| Asset coverage, end of period per $1,000(h) | |
$ | 3,189 | | |
$ | 3,037 | | |
$ | 3,032 | | |
$ | 3,117 | |
See
Notes to Financial Statements.
| 80 | www.blackstone-credit.com |
| Blackstone Long-Short Credit
Income Fund |
Financial
Highlights |
For
a Share Outstanding Throughout the Periods Indicated
| | |
For the
Year Ended
December 31, 2016 | | |
For the
Year Ended
December 31, 2015 | | |
For the
Year Ended
December 31, 2014 | |
| PER COMMON SHARE OPERATING PERFORMANCE: | |
| | |
| | |
| |
| Net asset value - beginning of period | |
$ | 15.37 | | |
$ | 17.82 | | |
$ | 19.11 | |
| INCOME/(LOSS) FROM INVESTMENT OPERATIONS: | |
| | | |
| | | |
| | |
| Net investment income(a)(b) | |
| 1.40 | | |
| 1.48 | | |
| 0.94 | |
| Net realized and unrealized gain/(loss) on investments, foreign currency transactions and unfunded loan commitments | |
| 1.60 | | |
| (2.66 | ) | |
| (1.03 | ) |
| Total Income/(Loss) from Investment Operations | |
| 3.00 | | |
| (1.18 | ) | |
| (0.09 | ) |
| | |
| | | |
| | | |
| | |
| DISTRIBUTIONS TO COMMON SHAREHOLDERS: | |
| | | |
| | | |
| | |
| From net investment income | |
| (1.43 | ) | |
| (1.27 | ) | |
| (0.96 | ) |
| From net realized gains | |
| – | | |
| – | | |
| (0.06 | ) |
| From tax return of capital | |
| – | | |
| – | | |
| (0.18 | ) |
| Total Distributions to Common Shareholders | |
| (1.43 | ) | |
| (1.27 | ) | |
| (1.20 | ) |
| | |
| | | |
| | | |
| | |
| Net asset value per common share - end of period | |
$ | 16.94 | | |
$ | 15.37 | | |
$ | 17.82 | |
| Market price per common share - end of period | |
$ | 15.92 | | |
$ | 13.48 | | |
$ | 15.53 | |
| | |
| | | |
| | | |
| | |
| Total Investment Return - Net Asset Value(c) | |
| 21.21 | % | |
| (6.04 | %) | |
| (0.06 | %) |
| Total Investment Return - Market Price(c) | |
| 29.89 | % | |
| (5.44 | %) | |
| (6.86 | %) |
| | |
| | | |
| | | |
| | |
| RATIOS AND SUPPLEMENTAL DATA: | |
| | | |
| | | |
| | |
| Net assets attributable to common shares, end of period (000s) | |
$ | 215,236 | | |
$ | 195,204 | | |
$ | 226,316 | |
| Ratio of expenses to average net assets attributable to common shares | |
| 2.58 | % | |
| 2.07 | % | |
| 1.85 | % |
| Ratio of expenses to average managed assets(e) | |
| 1.73 | % | |
| 1.43 | % | |
| 1.66 | % |
| Ratio of net investment income to average net assets attributable to common shares | |
| 8.67 | % | |
| 8.45 | % | |
| 4.99 | % |
| Portfolio turnover rate | |
| 103 | % | |
| 72 | % | |
| 66 | % |
| | |
| | | |
| | | |
| | |
| MANDATORY REDEEMABLE PREFERRED SHARES: | |
| | | |
| | | |
| | |
| Liquidation value, end of period, including
dividends payable on Mandatory Redeemable Preferred Shares (000s) | |
$ | 20,125 | | |
$ | N/A | | |
$ | N/A | |
| Total shares outstanding (000s) | |
| 20 | | |
| – | | |
| – | |
| Asset coverage , end of period per $1,000(g) | |
$ | 2,905 | | |
$ | N/A | | |
$ | N/A | |
| Liquidation preference per share | |
$ | 1,000 | | |
$ | N/A | | |
$ | N/A | |
| | |
| | | |
| | | |
| | |
| LEVERAGE FACILITY: | |
| | | |
| | | |
| | |
| Aggregate principal amount, end of period (000s) | |
$ | 93,000 | | |
$ | 96,000 | | |
$ | 73,000 | |
| Average borrowings outstanding during the period (000s) | |
$ | 93,684 | | |
$ | 100,261 | | |
$ | 66,827 | (j) |
| Asset coverage, end of period per $1,000(h) | |
$ | 3,314 | | |
$ | 3,033 | | |
$ | 4,100 | |
| (a) | Calculated
using average common shares outstanding. |
| (b) | Distributions
on the Company's MRPS are treated as an operating expense under GAAP and are included
in the calculation of net investment income. See Note 11 - Leverage. |
| (c) | Total
investment return is calculated assuming a purchase of common share at the opening on
the first day and a sale at closing on the last day of each period reported. Dividends
and distributions are assumed for purposes of this calculation to be reinvested at prices
obtained under the Fund's dividend reinvestment plan. Total investment returns does not
reflect sales load or brokerage commissions, if any, and are not annualized. |
| (e) | Average
managed assets represent net assets applicable to common shares plus principal value
of leverage. |
| (f) | Percentage
represents the results for the period and is not annualized. |
| (g) | Calculated
by subtracting the Fund’s total liabilities (excluding the liquidation value of
the Mandatory Redeemable Preferred Shares, including dividends payable on mandatory redeemable
preferred shares, and the principal amount of the Leverage Facility) from the Fund’s
total assets and dividing by the liquidation value of the Mandatory Redeemable Preferred
Shares and the principal amount of the Leverage Facility and then multiplying by $1,000.
On July 27, 2023, BGX redeemed all of its outstanding Series A mandatory redeemable preferred
shares at liquidation value in the amount of $20,000,000. |
See
Notes to Financial Statements.
| Semi-Annual
Report | June 30, 2024 |
81 |
| Blackstone Long-Short Credit
Income Fund |
Financial
Highlights |
For
a Share Outstanding Throughout the Periods Indicated
| (h) | Calculated
by subtracting the Fund's total liabilities (excluding Mandatory Redeemable Preferred Shares at liquidation value, including dividends
payable on mandatory redeemable preferred shares, and the principal amount of the Leverage Facility) from the Fund's total assets
and dividing by the principal amount of the Leverage Facility and then multiplying by $1,000. On July 27, 2023, BGX redeemed all
of its outstanding Series A mandatory redeemable preferred shares at liquidation value in the amount of $20,000,000. |
| (i) | Prior
to December 10, 2020 the Blackstone Long-Short Credit Income Fund was known as the Blackstone / GSO Long-Short Credit Income Fund. |
| (j) | Since
first borrowing was made on July 29, 2014. |
See
Notes to Financial Statements.
| 82 | www.blackstone-credit.com |
| Blackstone Strategic Credit
2027 Term Fund |
Financial
Highlights |
For
a Share Outstanding Throughout the Periods Indicated
| | |
For the Six
Months Ended
June 30, 2024
(Unaudited)
| | |
For the
Year Ended
December 31, 2023
| | |
For the
Year Ended
December 31, 2022
| | |
For the Year Ended
December 31, 2021
| | |
For the Year Ended
December 31, 2020 (a)
| |
| PER COMMON SHARE OPERATING PERFORMANCE: | |
| | |
| | |
| | |
| |
| Net asset value - beginning of period | |
$ | 12.66 | | |
$ | 12.06 | | |
$ | 14.44 | | |
$ | 14.19 | | |
$ | 15.25 | |
| INCOME/(LOSS) FROM INVESTMENT OPERATIONS: | |
| | | |
| | | |
| | | |
| | | |
| | |
| Net investment income(b)(c) | |
| 0.60 | | |
| 1.14 | | |
| 0.93 | | |
| 0.93 | | |
| 1.08 | |
| Net realized and
unrealized gain/(loss) on investments, foreign currency transactions and unfunded loan commitments | |
| (0.02 | ) | |
| 0.67 | | |
| (2.53 | ) | |
| 0.21 | | |
| (1.04 | ) |
| Total Income/(Loss) from Investment Operations | |
| 0.58 | | |
| 1.81 | | |
| (1.60 | ) | |
| 1.14 | | |
| 0.04 | |
| | |
| | | |
| | | |
| | | |
| | | |
| | |
| DISTRIBUTIONS TO COMMON SHAREHOLDERS: | |
| | | |
| | | |
| | | |
| | | |
| | |
| From net investment income | |
| (0.47 | ) | |
| (1.21 | ) | |
| (0.78 | ) | |
| (0.89 | ) | |
| (1.10 | ) |
| Total Distributions to Common Shareholders | |
| (0.47 | ) | |
| (1.21 | ) | |
| (0.78 | ) | |
| (0.89 | ) | |
| (1.10 | ) |
| | |
| | | |
| | | |
| | | |
| | | |
| | |
| Net asset value per common share - end of period | |
$ | 12.77 | | |
$ | 12.66 | | |
$ | 12.06 | | |
$ | 14.44 | | |
$ | 14.19 | |
| | |
| | | |
| | | |
| | | |
| | | |
| | |
| Market price per common share - end of period | |
$ | 11.89 | | |
$ | 11.32 | | |
$ | 10.58 | | |
$ | 13.49 | | |
$ | 12.48 | |
| | |
| | | |
| | | |
| | | |
| | | |
| | |
| Total Investment Return - Net Asset Value(d) | |
| 4.95 | % | |
| 17.10 | % | |
| (10.68 | %) | |
| 8.60 | % | |
| 2.03 | % |
| Total Investment Return - Market Price(d) | |
| 9.28 | % | |
| 19.36 | % | |
| (16.13 | %) | |
| 15.36 | % | |
| (4.83 | %) |
| | |
| | | |
| | | |
| | | |
| | | |
| | |
| RATIOS AND SUPPLEMENTAL DATA: | |
| | | |
| | | |
| | | |
| | | |
| | |
| Net assets attributable to common shares, end of period (000s) | |
$ | 570,286 | | |
$ | 565,465 | | |
$ | 538,860 | | |
$ | 645,050 | | |
$ | 633,741 | |
| Ratio of expenses to average
net assets attributable to common shares | |
| 5.91 | %(e) | |
| 5.70 | % | |
| 3.67 | % | |
| 2.78 | % | |
| 3.15 | % |
| Ratio of expenses to average managed assets(f) | |
| 3.72 | %(e) | |
| 3.65 | % | |
| 2.32 | % | |
| 1.77 | % | |
| 2.00 | % |
| Ratio of net investment income to average net assets attributable to common shares | |
| 9.43 | %(e) | |
| 9.22 | % | |
| 7.08 | % | |
| 6.36 | % | |
| 7.90 | % |
| Portfolio turnover rate | |
| 68 | %(g) | |
| 81 | % | |
| 81 | % | |
| 101 | % | |
| 77 | % |
| | |
| | | |
| | | |
| | | |
| | | |
| | |
| MANDATORY REDEEMABLE PREFERRED SHARES: | |
| | | |
| | | |
| | | |
| | | |
| | |
| Liquidation value, end of period, including dividends payable on Mandatory Redeemable Preferred Shares (000s) | |
$ | 44,763 | | |
$ | 44,891 | | |
$ | 45,281 | | |
$ | 45,287 | | |
$ | 45,287 | |
| Total shares outstanding (000s) | |
| 45 | | |
| 45 | | |
| 45 | | |
| 45 | | |
| 45 | |
| Asset coverage, end of period per $1,000(h) | |
$ | 2,697 | | |
$ | 2,726 | | |
$ | 2,715 | | |
$ | 2,749 | | |
$ | 2,790 | |
| Liquidation preference per share | |
$ | 1,000 | | |
$ | 1,000 | | |
$ | 1,000 | | |
$ | 1,000 | | |
$ | 1,000 | |
| | |
| | | |
| | | |
| | | |
| | | |
| | |
| LEVERAGE FACILITY: | |
| | | |
| | | |
| | | |
| | | |
| | |
| Aggregate principal amount, end of period (000s) | |
$ | 291,100 | | |
$ | 282,600 | | |
$ | 268,900 | | |
$ | 323,800 | | |
$ | 309,100 | |
| Average borrowings outstanding during the period (000s) | |
$ | 290,534 | | |
$ | 266,066 | | |
$ | 300,105 | | |
$ | 325,709 | | |
$ | 306,661 | |
| Asset coverage, end of period per $1,000(i) | |
$ | 3,114 | | |
$ | 3,160 | | |
$ | 3,172 | | |
$ | 3,131 | | |
$ | 3,196 | |
See
Notes to Financial Statements.
| Semi-Annual
Report | June 30, 2024 |
83 |
| Blackstone Strategic Credit
2027 Term Fund |
Financial
Highlights |
For
a Share Outstanding Throughout the Periods Indicated
| | |
For the
Year Ended
December 31, 2019 | |
| PER COMMON SHARE OPERATING PERFORMANCE: | |
| |
| Net asset value - beginning of period | |
$ | 15.30 | |
| INCOME/(LOSS) FROM INVESTMENT OPERATIONS: | |
| | |
| Net investment income(b)(c) | |
| 1.35 | |
| Net realized and unrealized loss on investments, foreign currency transactions and unfunded loan commitments | |
| (0.06 | ) |
| Total Income from Investment Operations | |
| 1.29 | |
| | |
| | |
| DISTRIBUTIONS TO COMMON SHAREHOLDERS: | |
| | |
| From net investment income | |
| (1.34 | ) |
| Total
Distributions to Common Shareholders | |
| (1.34 | ) |
| | |
| | |
| Net asset value per common share - end of period | |
$ | 15.25 | |
| Market price per common share - end of period | |
$ | 14.38 | |
| | |
| | |
| Total Investment Return - Net Asset Value(d) | |
| 9.29 | % |
| Total Investment Return - Market Price(d) | |
| 17.05 | % |
| | |
| | |
| RATIOS AND SUPPLEMENTAL DATA: | |
| | |
| Net assets attributable to common shares, end of period (000s) | |
$ | 681,312 | |
| Ratio of expenses to average net assets attributable to common shares | |
| 3.97 | % |
| Ratio of expenses to average managed assets(f) | |
| 2.50 | % |
| Ratio of net investment income to average net assets attributable to common shares | |
| 8.68 | % |
| Portfolio turnover rate | |
| 40 | % |
| | |
| | |
| MANDATORY REDEEMABLE PREFERRED SHARES: | |
| | |
| Liquidation value, end of period, including dividends payable on Mandatory Redeemable Preferred Shares (000s) | |
$ | 45,287 | |
| Total shares outstanding (000s) | |
| 45 | |
| Asset coverage, end of period per $1,000(h) | |
$ | 2,697 | |
| Liquidation preference per share | |
$ | 1,000 | |
| | |
| | |
| LEVERAGE FACILITY: | |
| | |
| Aggregate principal amount, end of period (000s) | |
$ | 356,500 | |
| Average borrowings outstanding during the period (000s) | |
$ | 363,945 | |
| Asset coverage, end of period per $1,000(i) | |
$ | 3,037 | |
| (a) | Prior
to December 10, 2020 the Blackstone Strategic Credit 2027 Term Fund was known as the
Blackstone / GSO Strategic Credit Fund. |
| (b) | Calculated
using average common shares outstanding. |
| (c) | Distributions
on the Company's MRPS are treated as an operating expense under GAAP and are included
in the calculation of net investment income. See Note 11 - Leverage. |
| (d) | Total
investment return is calculated assuming a purchase of common share at the opening on
the first day and a sale at closing on the last day of each period reported. Dividends
and distributions are assumed for purposes of this calculation to be reinvested at prices
obtained under the Fund's dividend reinvestment plan. Total investment returns does not
reflect sales load or brokerage commissions, if any, and are not annualized. |
See
Notes to Financial Statements.
| 84 | www.blackstone-credit.com |
| Blackstone Strategic Credit
2027 Term Fund |
Financial
Highlights |
For
a Share Outstanding Throughout the Periods Indicated
| (f) | Average
managed assets represent net assets applicable to common shares plus principal value
of leverage. |
| (g) | Percentage
represents the results for the period and is not annualized. |
| (h) | Calculated
by subtracting the Fund’s total liabilities (excluding the liquidation value of
the Mandatory Redeemable Preferred Shares, including dividends payable on mandatory redeemable
preferred shares, and the principal amount of the Leverage Facility) from the Fund’s
total assets and dividing by the liquidation value of the Mandatory Redeemable Preferred
Shares and the principal amount of the Leverage Facility and then multiplying by $1,000.
On July 25, 2023, BGB issued 45,000 4-year Series B mandatory redeemable preferred shares
with a liquidation value of $45,000,000. On July 27, 2023, BGB redeemed all of its outstanding
Series A mandatory redeemable preferred shares at liquidation value in the amount of
$45,000,000. |
| (i) | Calculated
by subtracting the Fund's total liabilities (excluding Mandatory Redeemable Preferred
Shares at liquidation value, including dividends payable on mandatory redeemable preferred
shares, and the principal amount of the Leverage Facility) from the Fund's total assets
and dividing by the principal amount of the Leverage Facility and then multiplying by
$1,000. On July 25, 2023, BGB issued 45,000 4-year Series B mandatory redeemable preferred
shares with a liquidation value of $45,000,000. On July 27, 2023, BGB redeemed all of
its outstanding Series A mandatory redeemable preferred shares at liquidation value in
the amount of $45,000,000. |
See
Notes to Financial Statements.
| Semi-Annual
Report | June 30, 2024 |
85 |
| Blackstone
Credit & Insurance Funds |
Notes
to Financial Statements |
June
30, 2024 (Unaudited)
NOTE
1. ORGANIZATION
Blackstone
Senior Floating Rate 2027 Term Fund (formerly known as Blackstone Senior Floating Rate Term Fund) (“BSL”), is a diversified,
closed-end management investment company. BSL was organized as a Delaware statutory trust on March 4, 2010. BSL was registered
under the Investment Company Act of 1940, as amended (the “1940 Act”), on March 5, 2010. BSL commenced operations
on May 26, 2010. Prior to that date, BSL had no operations other than matters relating to its organization and the sale and issuance
of 5,236 common shares of beneficial interest in BSL to Blackstone Liquid Credit Strategies LLC (the “Adviser”) at
a price of $19.10 per share. The Adviser serves as BSL’s investment adviser. BSL’s common shares are listed on the
New York Stock Exchange (the “Exchange”) and trade under the ticker symbol “BSL.”
Absent
shareholder approval to extend the term of BSL, BSL was initially scheduled to dissolve on or about May 31, 2020. Upon dissolution,
BSL will distribute substantially all of its net assets to shareholders, after making appropriate provision for any liabilities.
Pursuant to BSL’s Amended and Restated Agreement and Declaration of Trust, prior to the date of dissolution a majority of
BSL’s Board of Trustees (the “BSL Board”), with the approval of a majority of the shareholders entitled to vote
(as defined in the 1940 Act), may extend the life of BSL by a period of two years or such shorter time as may be determined. The
dissolution date of BSL may be extended an unlimited number of times. On March 31, 2017, BSL announced an extension of BSL’s
reinvestment period. The extension allows BSL to continue to reinvest proceeds generated by maturities, prepayments and sales
of investments until one year prior to BSL’s scheduled dissolution date. On November 17, 2017, BSL’s shareholders
approved extending the term of BSL by two years by changing BSL’s scheduled dissolution date from May 31, 2020 to May 31,
2022. On November 18, 2019, the BSL Board approved a proposal to amend BSL's charter to allow an extension of up to five years
in length (the “Charter Amendment”). The BSL Board also approved a proposal to extend the term of BSL by five years
by changing BSL's scheduled dissolution date from May 31, 2022 to May 31, 2027 (the “Term Extension”). The Charter
Amendment and the Term Extension were subject to shareholder approval, which was obtained at a special shareholder meeting held
on February 19, 2020.
On
January 26, 2022, the Securities and Exchange Commission (the "SEC") declared effective a registration statement filed
under the “shelf” registration process for BSL. Pursuant to the shelf registration, BSL may offer, from time to time,
in one or more offerings, up to $100,000,000 of common shares. These shares may be offered and sold to or through underwriters,
through dealers or agents that BSL designates from time to time, directly to purchasers, through at-the-market ("ATM")
offerings or through a combination of these methods. On February 1, 2022, BSL launched an ATM offering to sell up to $50,000,000
aggregate amount of its common shares. During the year ended December 31, 2022, BSL sold 2,004 common shares totaling $32,583,
net of offering costs of $87, pursuant to this shelf registration. For the period ended June 30, 2024, BSL did not sell any shares
pursuant to this shelf registration.
Blackstone
Long-Short Credit Income Fund (“BGX”) is a diversified, closed-end management investment company. BGX was organized
as a Delaware statutory trust on October 22, 2010. BGX was registered under the 1940 Act on October 26, 2010. BGX commenced operations
on January 27, 2011. Prior to that, BGX had no operations other than matters relating to its organization and the sale and issuance
of 5,236 common shares of beneficial interest in BGX to the Adviser at a price of $19.10 per share. The Adviser serves as the
investment adviser for BGX. BGX’s common shares are listed on the Exchange and trade under the ticker symbol “BGX.”
On
May 22, 2020, the SEC declared effective a registration statement filed under the “shelf” registration process for
BGX. Pursuant to the shelf registration, BGX may offer, from time to time, in one or more offerings, up to $100,000,000 of common
shares. These shares may be offered and sold to or through underwriters, through dealers or agents that BGX designates from time
to time, directly to purchasers, through ATM offerings or through a combination of these methods. On August 19, 2020, BGX launched
an ATM offering to sell up to $50,000,000 aggregate amount of its common shares. On July 30, 2021, the SEC declared effective
an updated shelf registration statement and BGX filed an updated prospectus supplement with respect to the ATM offering on August
19, 2021. As of June 30, 2024, BGX has not yet sold any shares pursuant to this shelf registration.
Blackstone
Strategic Credit 2027 Term Fund (formerly known as Blackstone Strategic Credit Fund) (“BGB” and, collectively with
BSL and BGX, the “Funds”) is a diversified, closed-end management investment company. BGB was organized as a Delaware
statutory trust on March 28, 2012. BGB was registered under the 1940 Act on April 6, 2012. BGB commenced operations on September
26, 2012. Prior to that, BGB had no operations other than matters relating to its organization and the sale and issuance of 5,236
common shares of beneficial interest in BGB to the Adviser at a price of $19.10 per share. The Adviser serves as the investment
adviser for BGB. BGB’s common shares are listed on the Exchange and trade under the ticker symbol “BGB.”
BGB
will dissolve on or about September 15, 2027, absent shareholder approval to extend such term. Upon dissolution, BGB will distribute
substantially all of its net assets to shareholders, after making appropriate provision for any liabilities. Pursuant to BGB’s
Amended and Restated Agreement and Declaration of Trust, prior to the date of dissolution a majority of BGB’s Board of Trustees
(the “BGB Board”), with the approval of a majority of the outstanding voting securities entitled to vote (as defined
in the 1940 Act), may extend the life of BGB. If approved, the dissolution date
of BGB may be extended by a period of two years or such shorter time as may be determined. The dissolution date of BGB may be
extended an unlimited number of times.
| 86 | www.blackstone-credit.com |
| Blackstone
Credit & Insurance Funds |
Notes
to Financial Statements |
June
30, 2024 (Unaudited)
The
Funds were previously classified as non-diversified investment companies for purposes of the 1940 Act. As a result of ongoing
operations, the Funds are now classified as diversified companies; BGX and BSL as of April 1, 2014 and BGB as of September 25,
2015. This means that with respect to 75% of each Fund’s total assets, no more than 5% of such Fund’s total assets
may be invested in any one issuer, excepting cash and cash items, U.S. government securities, and securities of other investment
companies. The Funds may not resume operating in a non-diversified manner without first obtaining shareholder approval in accordance
with the 1940 Act. The name changes of BSL and BGB became effective on March 6, 2023.
Investment
Objectives: BSL’s primary investment objective is to seek high current income, with a secondary objective to seek preservation
of capital, consistent with its primary goal of high current income. Under normal market conditions, at least 80% of BSL’s
Managed Assets (defined in Note 3) will be invested in senior secured, floating rate loans (“Senior Loans”).
BGX’s
primary investment objective is to provide current income, with a secondary objective of capital appreciation. BGX seeks to achieve
its investment objectives by employing a dynamic long-short strategy in a diversified portfolio of loans and fixed-income instruments
of predominantly U.S. corporate issuers, including first- and second-lien secured loans (“Secured Loans”) and high-yield
corporate debt securities of varying maturities. BGX’s short positions, either directly or through the use of derivatives,
may total up to 30% of such Fund’s net assets.
BGB’s
primary investment objective is to seek high current income, with a secondary objective to seek preservation of capital, consistent
with its primary goal of high current income. BGB will seek to achieve its investment objectives by investing primarily in a diversified
portfolio of loans and other fixed income instruments of predominantly U.S. corporate issuers, including first- and second-lien
secured loans (‘‘Senior Secured Loans’’) and high yield corporate bonds of varying maturities. Under normal
market conditions, at least 80% of BGB’s Managed Assets (defined in Note 3) will be invested in credit investments comprised
of corporate fixed income instruments and other investments (including derivatives) with similar economic characteristics.
Senior
Loans, Secured Loans and Senior Secured Loans are referred to collectively as “Loans” throughout the Notes to Financial
Statements.
NOTE
2. SIGNIFICANT ACCOUNTING POLICIES
Basis
of Presentation: The Funds' financial statements are prepared in accordance with accounting principles generally accepted
in the United States of America (“U.S. GAAP”) and are stated in U.S. dollars. Each Fund is considered an Investment
Company under U.S. GAAP and follows the accounting and reporting guidance applicable to investment companies in the Financial
Accounting Standards Board Accounting Standards Codification Topic 946.
The
preparation of financial statements requires management to make certain estimates and assumptions that affect the reported amounts
of assets and liabilities at the date of the financial statement. Actual results could differ from these estimates.
Portfolio
Valuation: Each Fund’s net asset value (“NAV”) is determined daily on each day that the Exchange is open
for business, as of the close of the regular trading session on the Exchange. Each Fund calculates NAV per share by subtracting
liabilities (including accrued expenses or dividends) from the total assets of such Fund (the value of the securities plus cash
or other assets, including interest accrued but not yet received) and dividing the result by the total number of outstanding common
shares of such Fund.
Loans
are primarily valued by using a composite loan price from a nationally recognized loan pricing service. The methodology used by
the Funds’ nationally recognized loan pricing provider for composite loan prices is to value loans at the mean of the bid
and ask prices from one or more brokers or dealers. Collateralized Loan Obligation securities (“CLOs”) are valued
at the price provided by a nationally recognized pricing service. The prices provided by the nationally recognized pricing service
are typically based on the evaluated mid-price of each of the CLOs. Corporate bonds and convertible bonds, other than short-term
investments, are valued at the price provided by a nationally recognized pricing service. The prices provided by the nationally
recognized pricing service are typically based on the mean of bid and ask prices for each corporate bond security. In determining
the value of a particular investment, pricing services may use certain information with respect to transactions in such investments,
quotations from dealers, pricing matrices, market transactions in comparable investments, various relationships observed in the
market between investments and calculated yield measures based on valuation technology commonly employed in the market for such
investments. Equity securities for which market quotations are available are generally valued at the last sale price or official
closing price on the primary market or exchange on which they trade. Futures contracts, if any, are ordinarily valued at the last
sales price on the securities or commodities exchange on which they are traded. Written and purchased options, if any, are ordinarily
valued at the closing price on the securities or commodities exchange on which they are traded. Open-end investment companies
are generally valued at their closing net asset values as reported on each business day. To the extent current market quotations
are not readily available, short-term debt investments, if any, having a remaining maturity of 60 days or less when purchased
would be valued at cost adjusted for amortization of premiums and accretion of discounts.
| Semi-Annual
Report | June 30, 2024 |
87 |
| Blackstone
Credit & Insurance Funds |
Notes
to Financial Statements |
June
30, 2024 (Unaudited)
In
accordance with Rule 2a-5 under the 1940 Act, the Funds’ Board of Trustees (the “Board”) has designated the
Adviser as the valuation designee to perform fair value determinations related to each Fund’s investments, subject to the
Board’s oversight and periodic reporting requirements.
Any
investments and other assets for which such current market quotations are not readily available are valued at fair value (“Fair
Valued Assets”) as determined in good faith by a committee of the Adviser (“Fair Valued Asset Committee”) under
procedures established by, and under the general supervision and responsibility of, the Funds’ Board. Such methods may include,
but are not limited to, the use of a market comparable and/or income approach methodologies. A Fair Valued Asset Committee meeting
may be called at any time by any member of the Fair Valued Asset Committee. The pricing of all Fair Valued Assets and determinations
thereof shall be reported by the Adviser as the valuation designee to the Board at each regularly scheduled quarterly meeting.
The Funds have procedures to identify and investigate potentially stale or missing prices for investments which are valued using
a nationally recognized pricing service, exchange price or broker-dealer quotations. After performing such procedures, any prices
which are deemed to be stale are reviewed by the Fair Valued Asset Committee and an alternative pricing source is determined.
Various
inputs are used to determine the value of the Funds’ investments. Observable inputs are inputs that reflect the assumptions
market participants would use in pricing the asset or liability developed based on market data obtained from sources independent
of the reporting entity. Unobservable inputs are inputs that reflect the reporting entity’s own assumptions about the assumptions
market participants would use in pricing the asset or liability developed based on the best information available in the circumstances.
The three-tier hierarchy of inputs is summarized in the three broad levels listed below.
Level
1— Unadjusted quoted prices in active markets for identical investments at the measurement date.
Level
2— Significant observable inputs (including quoted prices for similar investments, interest rates, prepayment speeds, credit
risk, etc.).
Level 3— Significant unobservable inputs (including the Funds’ own assumptions in determining the fair
value of investments).
The
categorization of a value determined for investments and other financial instruments is based on the pricing transparency of the
investment and other financial instrument and does not necessarily correspond to the Funds’ perceived risk of investing
in those securities. Investments measured and reported at fair value are classified and disclosed in one of the following levels
within the fair value hierarchy based on the lowest level of input that is significant to the fair value measurement.
| 88 | www.blackstone-credit.com |
| Blackstone
Credit & Insurance Funds |
Notes
to Financial Statements |
June
30, 2024 (Unaudited)
The
following tables summarize valuation of the Funds’ investments under the fair value hierarchy levels as of June 30, 2024:
Blackstone
Senior Floating Rate 2027 Term Fund
| | |
| | |
| | |
| | |
| |
| Investments in Securities at Fair Value* | |
Level 1 - Quoted Prices | | |
Level 2 - Significant
Observable Inputs | | |
Level 3 - Significant
Unobservable Inputs | | |
Total | |
| Floating Rate Loan Interests | |
| | | |
| | | |
| | | |
| | |
| Aerospace & Defense | |
$ | – | | |
$ | 8,110,726 | | |
$ | 551,326 | | |
$ | 8,662,052 | |
| Building Products | |
| – | | |
| 6,702,593 | | |
| 262,910 | | |
| 6,965,503 | |
| Commercial Services & Supplies | |
| – | | |
| 12,476,552 | | |
| 1,655,816 | | |
| 14,132,368 | |
| Diversified Consumer Services | |
| – | | |
| 6,071,523 | | |
| 4,624 | | |
| 6,076,147 | |
| Diversified REITs | |
| – | | |
| 464,839 | | |
| 262,815 | | |
| 727,654 | |
| Health Care Technology | |
| – | | |
| 4,305,565 | | |
| 1,197,014 | | |
| 5,502,579 | |
| Insurance | |
| – | | |
| 5,424,538 | | |
| 879,275 | | |
| 6,303,813 | |
| Interactive Media & Services | |
| – | | |
| – | | |
| 1,319,128 | | |
| 1,319,128 | |
| IT Services | |
| – | | |
| 9,492,969 | | |
| 1,613,222 | | |
| 11,106,191 | |
| Leisure Products | |
| – | | |
| – | | |
| 155,087 | | |
| 155,087 | |
| Pharmaceuticals | |
| – | | |
| 1,373,535 | | |
| 1,191,693 | | |
| 2,565,228 | |
| Professional Services | |
| – | | |
| 22,757,704 | | |
| 1,285,843 | | |
| 24,043,547 | |
| Real Estate Management & Development | |
| – | | |
| – | | |
| 1,378,724 | | |
| 1,378,724 | |
| Software | |
| – | | |
| 33,935,038 | | |
| 1,203,495 | | |
| 35,138,533 | |
| Specialty Retail | |
| – | | |
| 2,071,692 | | |
| 1,368,815 | | |
| 3,440,507 | |
| Trading Companies & Distributors | |
| – | | |
| 8,892,138 | | |
| 177,413 | | |
| 9,069,551 | |
| Other | |
| – | | |
| 132,614,328 | | |
| – | | |
| 132,614,328 | |
| Collateralized Loan Obligation Securities | |
| | | |
| | | |
| | | |
| | |
| Consumer Finance | |
| – | | |
| – | | |
| 475,028 | | |
| 475,028 | |
| Financial Services | |
| – | | |
| – | | |
| 14,601,355 | | |
| 14,601,355 | |
| Corporate Bonds | |
| – | | |
| 6,164,687 | | |
| – | | |
| 6,164,687 | |
| Common Stock | |
| | | |
| | | |
| | | |
| | |
| Health Care Equipment & Supplies | |
| – | | |
| – | | |
| 90,204 | | |
| 90,204 | |
| Health Care Providers & Services | |
| – | | |
| 288,485 | | |
| – | | |
| 288,485 | |
| Short-Term Investments | |
| 6,369,627 | | |
| – | | |
| – | | |
| 6,369,627 | |
| Total | |
$ | 6,369,627 | | |
$ | 261,146,912 | | |
$ | 29,673,787 | | |
$ | 297,190,326 | |
| | |
| | | |
| | | |
| | | |
| | |
| Other Financial Instruments | |
| | | |
| | | |
| | | |
| | |
| Assets | |
| | | |
| | | |
| | | |
| | |
| Net Unrealized
Appreciation on Unfunded Loan Commitments | |
| – | | |
| 1,668 | | |
| 1,383 | | |
| 3,051 | |
| Total | |
| – | | |
| 1,668 | | |
| 1,383 | | |
| 3,051 | |
The
Fund may hold assets and/or liabilities in which the fair value approximates the carrying amount for financial statement purposes..
As of June 30, 2024, the Fund's outstanding borrowings of $90,600,000 under its Leverage Facility are categorized as Level 2 within
the fair value hierarchy.
| Semi-Annual
Report | June 30, 2024 |
89 |
| Blackstone
Credit & Insurance Funds |
Notes
to Financial Statements |
June
30, 2024 (Unaudited)
Blackstone
Long-Short Credit Income Fund
| Investments in Securities at Fair Value* | |
Level 1 - Quoted Prices | | |
Level 2 - Significant
Observable Inputs | | |
Level 3 - Significant
Unobservable Inputs | | |
Total | |
| Floating Rate Loan Interests | |
| | | |
| | | |
| | | |
| | |
| Aerospace & Defense | |
$ | – | | |
$ | 7,210,603 | | |
$ | 484,160 | | |
$ | 7,694,763 | |
| Building Products | |
| – | | |
| 6,050,879 | | |
| 231,717 | | |
| 6,282,596 | |
| Commercial Services & Supplies | |
| – | | |
| 9,972,853 | | |
| 1,551,774 | | |
| 11,524,627 | |
| Diversified Consumer Services | |
| – | | |
| 5,424,256 | | |
| 4,094 | | |
| 5,428,350 | |
| Diversified REITs | |
| – | | |
| 399,449 | | |
| 229,929 | | |
| 629,378 | |
| Electrical Equipment | |
| – | | |
| – | | |
| 1,002,500 | | |
| 1,002,500 | |
| Health Care Technology | |
| – | | |
| 3,367,153 | | |
| 1,005,447 | | |
| 4,372,600 | |
| Insurance | |
| – | | |
| 4,470,664 | | |
| 1,046,732 | | |
| 5,517,396 | |
| Interactive Media & Services | |
| – | | |
| – | | |
| 609,577 | | |
| 609,577 | |
| IT Services | |
| – | | |
| 6,150,052 | | |
| 1,445,468 | | |
| 7,595,520 | |
| Pharmaceuticals | |
| – | | |
| 1,358,130 | | |
| 1,135,651 | | |
| 2,493,781 | |
| Professional Services | |
| – | | |
| 17,173,361 | | |
| 1,132,739 | | |
| 18,306,100 | |
| Real Estate Management & Development | |
| – | | |
| – | | |
| 1,087,572 | | |
| 1,087,572 | |
| Software | |
| – | | |
| 25,811,060 | | |
| 1,047,355 | | |
| 26,858,415 | |
| Specialty Retail | |
| – | | |
| 2,505,691 | | |
| 1,215,172 | | |
| 3,720,863 | |
| Trading Companies & Distributors | |
| – | | |
| 5,278,802 | | |
| 155,689 | | |
| 5,434,491 | |
| Other | |
| – | | |
| 111,158,569 | | |
| – | | |
| 111,158,569 | |
| Collateralized Loan Obligation Securities | |
| | | |
| | | |
| | | |
| | |
| Consumer Finance | |
| – | | |
| – | | |
| 491,383 | | |
| 491,383 | |
| Financial Services | |
| – | | |
| – | | |
| 11,803,868 | | |
| 11,803,868 | |
| Corporate Bonds | |
| – | | |
| 21,345,574 | | |
| – | | |
| 21,345,574 | |
| Common Stock | |
| | | |
| | | |
| | | |
| | |
| Health Care Equipment & Supplies | |
| – | | |
| – | | |
| 123,615 | | |
| 123,615 | |
| Health Care Providers & Services | |
| – | | |
| 236,027 | | |
| – | | |
| 236,027 | |
| Short Term Investments | |
| 4,969,233 | | |
| – | | |
| – | | |
| 4,969,233 | |
| Total | |
$ | 4,969,233 | | |
$ | 227,913,123 | | |
$ | 25,804,442 | | |
$ | 258,686,798 | |
| | |
| | | |
| | | |
| | | |
| | |
| Other Financial Instruments | |
| | | |
| | | |
| | | |
| | |
| Assets | |
| | | |
| | | |
| | | |
| | |
| Net
Unrealized Appreciation on Unfunded Loan Commitments | |
| – | | |
| 1,562 | | |
| 1,318 | | |
| 2,880 | |
| Total | |
| – | | |
| 1,562 | | |
| 1,318 | | |
| 2,880 | |
The
Fund may hold assets and/or liabilities in which the fair value approximates the carrying amount for financial statement purposes.
As of June 30, 2024, the Fund's outstanding borrowings of $79,200,000 under its Leverage Facility are categorized as Level 2 within
the fair value hierarchy.
| 90 | www.blackstone-credit.com |
| Blackstone
Credit & Insurance Funds |
Notes
to Financial Statements |
June
30, 2024 (Unaudited)
Blackstone
Strategic Credit 2027 Term Fund
| Investments in Securities at Fair Value* | |
Level 1 - Quoted Prices | | |
Level 2 - Significant
Observable Inputs | | |
Level 3 - Significant
Unobservable Inputs | | |
Total | |
| Floating Rate Loan Interests | |
| | | |
| | | |
| | | |
| | |
| Aerospace & Defense | |
$ | – | | |
$ | 22,486,501 | | |
$ | 1,763,125 | | |
$ | 24,249,626 | |
| Building Products | |
| – | | |
| 21,418,301 | | |
| 842,203 | | |
| 22,260,504 | |
| Commercial Services & Supplies | |
| – | | |
| 35,254,591 | | |
| 3,167,976 | | |
| 38,422,567 | |
| Diversified Consumer Services | |
| – | | |
| 20,040,668 | | |
| 13,535 | | |
| 20,054,203 | |
| Diversified REITs | |
| – | | |
| 1,320,597 | | |
| 843,254 | | |
| 2,163,851 | |
| Electrical Equipment | |
| – | | |
| 1,718,617 | | |
| 4,010,000 | | |
| 5,728,617 | |
| Health Care Technology | |
| – | | |
| 11,879,436 | | |
| 3,219,366 | | |
| 15,098,802 | |
| Insurance | |
| – | | |
| 14,954,755 | | |
| 2,513,011 | | |
| 17,467,766 | |
| Interactive Media & Services | |
| – | | |
| – | | |
| 1,963,396 | | |
| 1,963,396 | |
| IT Services | |
| – | | |
| 23,530,411 | | |
| 5,127,290 | | |
| 28,657,701 | |
| Leisure Products | |
| – | | |
| – | | |
| 440,599 | | |
| 440,599 | |
| Pharmaceuticals | |
| – | | |
| 5,074,300 | | |
| 3,746,572 | | |
| 8,820,872 | |
| Professional Services | |
| – | | |
| 65,425,955 | | |
| 3,938,606 | | |
| 69,364,561 | |
| Real Estate Management & Development | |
| – | | |
| – | | |
| 5,670,717 | | |
| 5,670,717 | |
| Software | |
| – | | |
| 88,377,370 | | |
| 3,736,054 | | |
| 92,113,424 | |
| Specialty Retail | |
| – | | |
| 8,460,460 | | |
| 4,399,761 | | |
| 12,860,221 | |
| Trading Companies & Distributors | |
| – | | |
| 25,131,791 | | |
| 503,273 | | |
| 25,635,064 | |
| Other | |
| – | | |
| 391,810,868 | | |
| – | | |
| 391,810,868 | |
| Corporate Bonds | |
| – | | |
| 143,849,181 | | |
| – | | |
| 143,849,181 | |
| Common Stock | |
| | | |
| | | |
| | | |
| | |
| Energy Equipment & Services | |
| – | | |
| 146,372 | | |
| 1,106,625 | | |
| 1,252,997 | |
| Health Care Equipment & Supplies | |
| – | | |
| – | | |
| 394,136 | | |
| 394,136 | |
| Health Care Providers & Services | |
| – | | |
| 786,768 | | |
| – | | |
| 786,768 | |
| Warrants | |
| | | |
| | | |
| | | |
| | |
| Energy Equipment & Services | |
| – | | |
| – | | |
| 3,182 | | |
| 3,182 | |
| Short Term Investments | |
| 16,628,490 | | |
| – | | |
| – | | |
| 16,628,490 | |
| Total | |
$ | 16,628,490 | | |
$ | 881,666,942 | | |
$ | 47,402,681 | | |
$ | 945,698,113 | |
| | |
| | | |
| | | |
| | | |
| | |
| Other Financial Instruments | |
| | | |
| | | |
| | | |
| | |
| Assets | |
| | | |
| | | |
| | | |
| | |
| Net Unrealized
Appreciation on Unfunded Loan Commitments | |
| – | | |
| 4,622 | | |
| 1,236 | | |
| 5,858 | |
| Total | |
| – | | |
| 4,622 | | |
| 1,236 | | |
| 5,858 | |
| * | Refer to each Fund's Portfolio of Investments for a listing
of securities by type. |
The
Fund may hold assets and/or liabilities in which the fair value approximates the carrying amount for financial statement purposes.
As of June 30, 2024, the Fund's outstanding borrowings of $291,100,000 under its Leverage Facility are categorized as Level 2
within the fair value hierarchy.
| Semi-Annual
Report | June 30, 2024 |
91 |
| Blackstone
Credit & Insurance Funds |
Notes
to Financial Statements |
June
30, 2024 (Unaudited)
The
changes of the fair value of investments for which the Funds have used significant unobservable (Level 3) inputs to determine
the fair value are as follows:
| Blackstone Senior Floating Rate 2027 Term Fund | |
Floating Rate
Loan Interests | | |
Collateralized Loan
Obligation Securities | | |
Common
Stock | | |
Unfunded Loan
Commitments | | |
Total | |
| Balance as of December 31, 2023 | |
$ | 9,566,894 | | |
$ | 13,259,309 | | |
$ | 247,274 | | |
$ | 1,036 | | |
$ | 23,074,513 | |
| Accrued discount/ premium | |
| 3,396 | | |
| 3,274 | | |
| – | | |
| – | | |
| 6,670 | |
| Realized Gain/(Loss) | |
| 25,898 | | |
| (4,585 | ) | |
| – | | |
| – | | |
| 21,313 | |
| Change in Unrealized Appreciation/(Depreciation) | |
| 553,402 | | |
| 313,500 | | |
| 41,213 | | |
| 347 | | |
| 908,462 | |
| Purchases(1) | |
| 11,094,439 | | |
| 2,000,300 | | |
| – | | |
| – | | |
| 13,094,739 | |
| Sales Proceeds(2) | |
| (8,012,385 | ) | |
| (495,415 | ) | |
| (1 | ) | |
| – | | |
| (8,507,801 | ) |
| Transfer into Level 3 | |
| 2,498,083 | | |
| – | | |
| 90,204 | | |
| – | | |
| 2,588,287 | |
| Transfer out of Level 3 | |
| (1,222,527 | ) | |
| – | | |
| (288,486 | ) | |
| – | | |
| (1,511,013 | ) |
| Balance as of June 30, 2024 | |
$ | 14,507,200 | | |
$ | 15,076,383 | | |
$ | 90,204 | | |
$ | 1,383 | | |
$ | 29,675,170 | |
| Net change in unrealized
appreciation/(depreciation) included in the Statements of Operations attributable to Level 3 investments held at June 30,
2024 | |
$ | 499,923 | | |
$ | 308,227 | | |
$ | 66,150 | | |
$ | 1,383 | | |
$ | 875,733 | |
| Blackstone Long-Short Credit Income Fund | |
|
Floating Rate Loan Interests |
|
|
Collateralized Loan
Obligation Securities | | |
Common
Stock | | |
Unfunded Loan
Commitments | | |
Total | |
| Balance as of December 31, 2023 | |
$ | 7,867,628 | | |
$ | 12,768,682 | | |
$ | 202,309 | | |
$ | 973 | | |
$ | 20,839,592 | |
| Accrued discount/ premium | |
| 2,870 | | |
| 5,049 | | |
| – | | |
| – | | |
| 7,919 | |
| Realized Gain/(Loss) | |
| 29,366 | | |
| 4,782 | | |
| – | | |
| – | | |
| 34,148 | |
| Change in Unrealized Appreciation/(Depreciation) | |
| 486,238 | | |
| 262,468 | | |
| 33,718 | | |
| 345 | | |
| 782,769 | |
| Purchases | |
| 10,740,333 | | |
| – | | |
| – | | |
| – | | |
| 10,740,333 | |
| Sales Proceeds | |
| (6,584,175 | ) | |
| (745,730 | ) | |
| – | | |
| – | | |
| (7,329,905 | ) |
| Transfer into Level 3 | |
| 1,727,929 | | |
| – | | |
| 123,615 | | |
| – | | |
| 1,851,544 | |
| Transfer out of Level 3 | |
| (884,613 | ) | |
| – | | |
| (236,027 | ) | |
| – | | |
| (1,120,640 | ) |
| Balance as of June 30, 2024 | |
$ | 13,385,576 | | |
$ | 12,295,251 | | |
$ | 123,615 | | |
$ | 1,318 | | |
$ | 25,805,760 | |
| Net change in unrealized appreciation/(depreciation) included in the
Statements of Operations attributable to Level 3 investments held at June 30, 2024 | |
$ | 445,739 | | |
$ | 267,095 | | |
$ | 90,651 | | |
$ | 1,318 | | |
$ | 804,803 | |
| Blackstone Strategic Credit 2027 Term Fund | |
Floating Rate
Loan Interests | | |
Common
Stock | | |
Warrants | | |
Unfunded Loan
Commitments | | |
Total | |
| Balance as of December 31, 2023 | |
$ | 21,296,184 | | |
$ | 1,780,998 | | |
$ | 3,182 | | |
$ | 2,034 | | |
$ | 23,082,398 | |
| Accrued discount/ premium | |
| 9,117 | | |
| – | | |
| – | | |
| – | | |
| 9,117 | |
| Realized Gain/(Loss) | |
| 84,465 | | |
| – | | |
| – | | |
| – | | |
| 84,465 | |
| Change in Unrealized Appreciation/(Depreciation) | |
| 1,488,008 | | |
| 112,395 | | |
| – | | |
| (798 | ) | |
| 1,599,605 | |
| Purchases(1) | |
| 41,146,293 | | |
| – | | |
| – | | |
| – | | |
| 41,146,293 | |
| Sales Proceeds(2) | |
| (21,166,342 | ) | |
| – | | |
| – | | |
| – | | |
| (21,166,342 | ) |
| Transfer into Level 3 | |
| 5,672,765 | | |
| 394,136 | | |
| – | | |
| – | | |
| 6,066,901 | |
| Transfer out of Level 3 | |
| (2,631,752 | ) | |
| (786,786 | ) | |
| – | | |
| – | | |
| (3,418,520 | ) |
| Balance as of June 30, 2024 | |
$ | 45,898,738 | | |
$ | 1,500,761 | | |
$ | 3,182 | | |
$ | 1,236 | | |
$ | 47,403,917 | |
| Net change in unrealized appreciation/(depreciation) included in the
Statements of Operations attributable to Level 3 investments held at June 30, 2024 | |
$ | 1,493,299 | | |
$ | 289,033 | | |
$ | – | | |
$ | 1,236 | | |
$ | 1,783,568 | |
| (1) | Purchases
include all purchases of securities and securities received in corporate actions. |
| (2) | Sales
Proceeds include all sales of securities, maturities, paydowns and securities tendered
in corporate actions. |
| 92 | www.blackstone-credit.com |
| Blackstone
Credit & Insurance Funds |
Notes
to Financial Statements |
June
30, 2024 (Unaudited)
Securities
were transferred from Level 2 to Level 3 because of a lack of observable market data due to decrease in market activity and information
for these securities. Other securities were transferred from Level 3 to Level 2 as observable inputs were available for purposes
of valuing those assets.
Information
about Level 3 fair value measurements as of June 30, 2024:
| Blackstone Senior Floating Rate 2027 Term
Fund | |
Fair Value | | |
Valuation Technique | |
Unobservable
Input(s) | |
Value/Rate
(Weighted Average) | |
| Floating Rate Loan Interests | |
$ | 14,507,200 | | |
Third Party Vendor Pricing Services | |
Broker Quotes | |
| N/A | |
| Collateralized Loan Obligation Securities | |
| 15,076,383 | | |
Third Party Vendor Pricing Services | |
Broker Quotes | |
| N/A | |
| Common Stock | |
| 90,204 | | |
Third Party Vendor Pricing Services | |
Broker Quotes | |
| N/A | |
| Unfunded Loan Commitments | |
| 1,383 | | |
Third Party Vendor Pricing Services | |
Broker Quote | |
| N/A | |
| Blackstone Long-Short Credit Income Fund | |
Fair Value | | |
Valuation Technique | |
Unobservable
Input(s) | |
Value/Rate
(Weighted Average) |
| Floating Rate Loan Interests | |
$ | 13,385,576 | | |
Third Party Vendor Pricing Services | |
Broker Quotes | |
N/A |
| Collateralized Loan Obligation Securities | |
| 12,295,251 | | |
Third Party Vendor Pricing Services | |
Broker Quotes | |
N/A |
| Common Stock | |
| 123,615 | | |
Third Party Vendor Pricing Services | |
Broker Quotes | |
N/A |
| Unfunded Loan Commitments | |
| 1,318 | | |
Third Party Vendor Pricing Services | |
Broker Quotes | |
N/A |
| | |
| | |
| |
| |
| |
| Blackstone Strategic Credit 2027 Term Fund | |
Fair Value | | |
Valuation Technique | |
Unobservable
Input(s) | |
Value/Rate
(Weighted Average) | |
| Floating Rate Loan Interests | |
$ | 45,898,738 | | |
Third Party Vendor Pricing Services | |
Broker Quotes | |
| N/A | |
| Common Stock | |
| – | | |
Performance Multiple Methodology | |
EBITDA Multiple | |
| 7.38x | |
| | |
| 1,500,761 | | |
Third Party Vendor Pricing Services | |
Broker Quotes | |
| N/A | |
| Warrants | |
| 3,182 | | |
Third Party Vendor Pricing Services | |
Broker Quotes | |
| N/A | |
| Unfunded Loan Commitments | |
| 1,236 | | |
Third Party Vendor Pricing Services | |
Broker Quotes | |
| N/A | |
A
change to the unobservable input at the reporting date would result in a significant change to the value of the investment as
follows:
| Unobservable
Input |
Impact
to Value if Input Increases |
Impact
to Value if Input Decreases |
| EBITDA Multiple |
Increase |
Decrease |
| Broker Quotes |
Increase |
Decrease |
Securities
Transactions and Investment Income: Securities transactions are recorded on trade date for financial reporting purposes and
amounts payable or receivable for trades not settled at the time of period end are reflected as liabilities and assets, respectively.
Interest income is recognized on an accrual basis from the date of settlement. Accretion of discount and amortization of premium,
which are included in interest income, are accreted or amortized daily using the accrual basis interest method. Dividend income
is recorded on the ex-dividend date. Realized gains and losses from securities transactions and foreign currency transactions,
if any, are recorded on the basis of identified cost and stated separately in the Statements of Operations.
When
the Funds sell a floating rate loan interest, they may pay an agency fee. The Funds earn facility and other fees on floating rate
loan interests, and facility fees are typically amortized to income over the term of the loan. Consent and amendment fees are
also recorded to income as earned.
Federal
Income Taxes: It is the policy of the Funds to continue to qualify as regulated investment companies by complying with the
requirements of Subchapter M of the Internal Revenue Code of 1986, as amended. For the period ended June 30, 2024, Management
has analyzed the tax positions taken by the Funds and has concluded that no income tax provisions are required.
Income
distributions and capital gain distributions, if any, are determined in accordance with income tax regulations, which may differ
from GAAP. These differences are primarily due to differing treatments of income and gains on various investment securities held
by the Funds, including differences in the timing of recognition or income, losses, and/or gains, and differing characterization
of distributions made by the Funds as a whole.
As
of and during the period ended June 30, 2024, the Funds did not incur a liability arising from any unrecognized tax benefits.
The Funds file U.S. federal, state, and local tax returns as required. The Funds’ tax returns are subject to examination
by the relevant tax authorities until expiration of the applicable statute of limitations, which is generally three years after
the filing of the tax return for federal purposes and four years after the filing of most state and local returns for state and
local purposes. Tax returns for any open years have not required and as such not incorporated any uncertain tax positions that
result in a provision for income taxes.
| Semi-Annual
Report | June 30, 2024 |
93 |
| Blackstone
Credit & Insurance Funds |
Notes
to Financial Statements |
June
30, 2024 (Unaudited)
Distributions
to Shareholders: The Funds make monthly cash distributions of all or a portion of their net investment income to common shareholders.
The Funds will distribute to common shareholders at least annually all or substantially all of their net investment income determined
after the payment of dividends and/or interest, if any, owed with respect to any outstanding preferred shares and/or borrowings.
The Funds intend to pay any capital gain distributions at least annually, if any. The Funds utilize a "dynamic" distribution
strategy that is based on the net investment income earned by the Funds. The Funds declare a set of monthly distributions each
quarter in amounts closely tied to the Funds' recent average monthly net investment income. As a result, the monthly distribution
amounts for the Funds typically vary when compared quarter over quarter. A distribution may be treated as paid by December 31
of any calendar year if such a distribution is declared by the Fund in October, November or December with a record date in such
a month and is paid by the Fund prior to January 31 of the following calendar year. Such distributions may be taxable to shareholders
in the calendar year in which the distributions are declared, rather than taxable to shareholders in the calendar year in which
the distributions are paid.
Offering
Costs: Offering costs incurred in connection with BSL’s shelf registration statement, through June 30, 2024, are approximately
$358,525. The Statement of Assets and Liabilities reflects the current offering costs of $358,525 as prepaid offering cost. These
offering costs will be charged to paid-in-capital upon the issuance of shares. Any remaining deferred offering costs at the end
of the shelf offering period will be charged to expense and costs incurred to keep the shelf registration current are expensed
as incurred.
Offering
costs incurred in connection with BGX's shelf registration statement, through June 30, 2024, are approximately $557,435. The Statement
of Assets and Liabilities reflects the current offering costs of $446,647 as deferred offering costs, of which $379,142 will be
charged to paid-in-capital upon the issuance of shares. Any remaining deferred offering costs at the end of the shelf offering
period will be charged to expense and costs incurred to keep the shelf registration current are expensed as incurred.
The
estimates and assumptions underlying the Funds' financial statements are based on the information available as of June 30, 2024.
The estimates and assumptions include judgments about financial market and economic conditions which have changed, and may continue
to change, over time.
NOTE
3. MANAGEMENT FEES, ADMINISTRATION FEES, AND OTHER AGREEMENTS
Management
Fees: The Adviser, a wholly-owned subsidiary of Blackstone Alternative Credit Advisors LP (collectively with its affiliates
in the credit, asset-based finance and insurance asset management business unit of Blackstone Inc., “Blackstone Credit &
Insurance”), is a registered investment adviser and is responsible for the day-to-day management of, and providing administrative
and compliance oversight services to, the Funds.
For
BSL, the Adviser receives a monthly fee at the annual rate of 0.90% of the average daily value of BSL’s total assets (including
any assets attributable to any leverage used) minus the sum of BSL’s accrued liabilities (other than Fund liabilities incurred
for any leverage) (“BSL Managed Assets”). Effective November 17, 2017, the Adviser agreed to reduce a portion of the
previous management fee (“Reduced Management Fee”), from an annual rate of 1.00% to 0.90% of BSL’s Managed Assets,
in connection with the extension of BSL’s term through May 31, 2022. Due to the approval of the extension of the BSL term
to May 31, 2027, the Reduced Management Fee will continue through BSL’s dissolution date. If BSL’s term is extended
again by shareholders beyond May 31, 2027, the Reduced Management Fee will be assessed at that time. For BGX, the Adviser receives
a monthly fee at the annual rate of 1.20% of the average daily value of BGX’s net assets (total assets of BGX minus liabilities,
including accrued expenses or dividends). For BGB, the Adviser receives a monthly fee at the annual rate of 1.00% of the average
daily value of BGB’s total assets (including any assets attributable to any leverage used) minus the sum of BGB's accrued
liabilities (other than Fund liabilities incurred for any leverage) ("BGB Managed Assets").
For
the period ended June 30, 2024, management fees are included on the Statement of Operations. As of June 30, 2024, accrued payables
relating to management fees are included on the Statement of Assets and Liabilities.
Trustee
Fees: Effective January 1, 2024, the Funds and Blackstone Floating Rate Enhanced Income Fund (collectively the "Blackstone
Credit & Insurance Funds") agreed to pay a retainer fee of $155,000 per annum to each Trustee who is not a director,
officer, employee, or affiliate of Blackstone Credit & Insurance or ALPS Fund Services, Inc. (“ALPS”). The Chairman
of the Audit Committee and the Chairman of the Nominating and Governance Committee also agreed to receive a retainer fee of $12,000
per annum and the Lead Independent Trustee agreed to receive a retainer fee of $16,000 per annum from the Blackstone Credit &
Insurance Funds.
The
Board implemented a Trustee Emeritus program (the “Program”) in November 2021. A Trustee Emeritus appointed under
the Program will receive compensation equal to 10% of his or her retainer for serving as a Trustee as of the date on which the
Board appoints such person as Trustee Emeritus. The term of service of a Trustee Emeritus expires twelve months from the date
of the Trustee’s retirement from the Board.
Fund
Accounting and Administration Fees: ALPS serves as administrator to the Funds. Under the administration agreement, ALPS is
responsible for calculating the NAV of the common shares and generally managing the administrative affairs of the Funds. For BSL
and BGB, ALPS receives a monthly fee based on the average daily value of each fund’s respective Managed Assets, plus out-of-pocket
expenses. For BGX, ALPS receives a monthly
fee based on the average daily value of the fund’s net assets, plus out-of-pocket expenses. ALPS is not considered an affiliate
of the Funds, as defined under the 1940 Act.
| 94 | www.blackstone-credit.com |
| Blackstone
Credit & Insurance Funds |
Notes
to Financial Statements |
June
30, 2024 (Unaudited)
Custodian
and Transfer Agent: The Bank of New York Mellon serves as the Funds’ custodian. Computershare Inc. (“Computershare”)
serves as the Funds’ transfer agent. The Bank of New York Mellon and Computershare are not considered affiliates of the
Funds as defined under the 1940 Act.
NOTE
4. SECURITIES TRANSACTIONS
Investment
transactions for the period ended June 30, 2024, excluding temporary short-term investments, were as follows:
| | |
Cost of Investments | | |
Proceeds from | |
| Fund | |
Purchased | | |
Investments Sold | |
| Blackstone Senior Floating Rate 2027 Term Fund | |
$ | 178,142,678 | | |
$ | 171,493,445 | |
| Blackstone Long-Short Credit Income Fund | |
| 157,977,677 | | |
| 153,620,956 | |
| Blackstone Strategic Credit 2027 Term Fund | |
| 644,853,981 | | |
| 627,638,463 | |
NOTE
5. RELATED PARTY TRANSACTIONS
The
Adviser is a related party of the Funds. Fee arrangements with related parties are disclosed in Note 3 and amounts incurred are
disclosed in the Statements of Operations.
During
the period ended June 30, 2024, none of the Funds engaged in cross trades with an affiliate pursuant to Rule 17a-7 under the 1940
Act.
Blackstone
Holdings Finance Co. L.L.C ("FINCO"), an affiliate of the Adviser, pays expenses on behalf of the Funds from time to
time. The Funds reimburse FINCO for such expenses paid on behalf of the Funds. FINCO does not charge any fees for providing such
services. The amounts of $275,191, $215,053 and $384,275 for BSL, BGX, and BGB, respectively, as of the period ended June 30,
2024, is recorded as other payables and accrued expenses on the Funds' Statements of Assets and Liabilities.
Blackstone
Securities Partners L.P. (“BSP”), an affiliate of BSL and of the Adviser, serves as the Distributor for BSL’s
ATM offering of common shares of beneficial interest (“BSL Common Shares”) under a distribution agreement with BSL
(the “Distribution Agreement”). Pursuant to the Distribution Agreement, BSL compensates BSP with respect to the sale
of BSL Common Shares in the ATM offering at a commission rate of 1.00% of the gross proceeds of the sale of BSL Common Shares.
Additionally, BSP entered into a sub-placement agent agreement with UBS Securities LLC (the “Sub-Placement Agent”)
and of the commission rate of 1.00%, BSP will compensate the Sub-Placement Agent at a rate of 0.80% of the gross proceeds of the
sale of BSL's Common Shares sold through the Sub-Placement Agent. For the period ended June 30, 2024, BSL did not sell any shares,
pursuant to this shelf registration and $0 gross proceeds were rebated by BSP back to BSL.
| Semi-Annual
Report | June 30, 2024 |
95 |
| Blackstone
Credit & Insurance Funds |
Notes
to Financial Statements |
June
30, 2024 (Unaudited)
NOTE
6. CAPITAL
| The Funds have authorized an unlimited number of $0.001 par value common shares. |
| |
| Transactions in shares were as follows: |
| |
| | |
For the Six | | |
| |
| | |
Months Ended | | |
For the | |
| | |
June 30, 2024 | | |
Year Ended | |
| Blackstone Senior Floating Rate 2027 Term Fund | |
(Unaudited) | | |
December 31, 2023 | |
| Common shares outstanding - beginning of period | |
| 13,008,542 | | |
| 13,008,542 | |
| Common shares issued as reinvestment of dividends | |
| – | | |
| – | |
| Common shares outstanding - end of period | |
| 13,008,542 | | |
| 13,008,542 | |
| | |
For the Six | | |
| |
| | |
Months Ended | | |
For the | |
| | |
June 30, 2024 | | |
Year Ended | |
| Blackstone Long-Short Credit Income Fund | |
(Unaudited) | | |
December 31, 2023 | |
| Common shares outstanding - beginning of period | |
| 12,708,275 | | |
| 12,708,275 | |
| Common shares issued as reinvestment of dividends | |
| – | | |
| – | |
| Common shares outstanding - end of period | |
| 12,708,275 | | |
| 12,708,275 | |
| | |
For the Six | | |
| |
| | |
Months Ended | | |
For the | |
| | |
June 30, 2024 | | |
Year Ended | |
| Blackstone Strategic Credit 2027 Term Fund | |
(Unaudited) | | |
December 31, 2023 | |
| Common shares outstanding - beginning of period | |
| 44,664,382 | | |
| 44,664,382 | |
| Common shares issued as reinvestment of dividends | |
| – | | |
| – | |
| Common shares outstanding - end of period | |
| 44,664,382 | | |
| 44,664,382 | |
NOTE 7. LOANS AND OTHER INVESTMENTS
BSL
defines “Senior Loans” as first lien senior secured, floating rate loans that are made to U.S. and, to a limited extent,
non-U.S. corporations, partnerships and other business entities (“Borrowers”), which operate in various industries
and geographical regions. BGX includes first and second lien secured, floating rate loans in its definition of “Secured
Loans.” Under normal market conditions, at least 80% of BSL’s Managed Assets (defined below) will be invested in Senior
Loans and 70% of BGX’s Managed Assets (defined below) will be invested in Secured Loans. BSL defines "Managed Assets"
as total assets (including any assets attributable to any leverage used) minus the sum of BSL's accrued liabilities (other than
liabilities related to the principal amount of leverage). BGX defines its managed assets as total assets (including any assets
attributable to any leverage used) minus the sum of BGX’s accrued liabilities (other than liabilities related to the principal
amount of leverage). BGB defines “Managed Assets” as total assets (including "effective leverage” (meaning
leverage incurred through total return swaps, securities lending arrangements, credit default swaps or other derivative transactions)
and “traditional leverage” (meaning borrowing money or issuing preferred shares (but will not issue auction rate preferred
shares), debt securities or commercial paper, or enter into similar transactions)). Under normal market conditions, at least 80%
of BGB's Managed Assets will be invested in credit investments comprised of corporate fixed income instruments and other investments
(including derivatives) with similar economic characteristics. At June 30, 2024, 93.32% of BSL’s Managed Assets were held
in Senior Loans, 88.64% of BGX's Managed Assets were held in Secured Loans, and 102.31% of BGB’s Managed Assets were held
in corporate fixed income instruments including Senior Secured Loans.
Senior
secured loans hold a senior position in the capital structure of a business entity, are secured with specific collateral and have
a claim on the assets and/or stock of the Borrower that is senior to that held by unsecured creditors, subordinated debt holders
and stockholders of the Borrower.
Loans
often require prepayments from Borrowers’ excess cash flows or permit the Borrowers to repay at their election. The degree
to which Borrowers repay, whether as a contractual requirement or at their election, cannot be predicted with accuracy. As a result,
the actual remaining maturity may be substantially less than the stated maturities shown. However, floating rate loans typically
have an expected average life of two to four years. Floating rate loans typically have rates of interest which are re-determined
periodically, either daily, monthly, quarterly or semi-annually by reference to a floating base lending rate, primarily the London
Interbank Offered Rate (“LIBOR”) and the Secured Overnight Financing Rate (“SOFR”) (subject to the LIBOR
transition as described below and in Principal Risks—LIBOR Risk”), plus a premium or credit spread.
| 96 | www.blackstone-credit.com |
| Blackstone
Credit & Insurance Funds |
Notes
to Financial Statements |
June
30, 2024 (Unaudited)
The
United Kingdom's Financial Conduct Authority announced a phase out of LIBOR in 2017. Although many LIBOR rates ceased to be published
or were no longer representative of the underlying market they sought to measure after December 31, 2021, a selection of widely
used U.S. dollar LIBOR rates were published through June 30, 2023 in order to assist with the transition. Further, on March 15,
2022, the Consolidated Appropriations Act of 2022, which includes the Adjustable Interest Rate (LIBOR) Act, was signed into law
in the United States. This legislation establishes a uniform benchmark replacement process for financial contracts that mature
after June 30, 2023 that do not contain clearly defined or practicable fallback provisions. The U.S. Federal Reserve System, in
conjunction with the Alternative Reference Rates Committee, a steering committee comprised of large U.S. financial institutions,
has begun publishing SOFR, which is their preferred alternative rate for U.S. dollar LIBOR, and which is a new index calculated
by short-term repurchase agreements, backed by Treasury securities. Given the inherent differences between LIBOR and SOFR, or
any other alternative benchmark rate that may be established, there remains uncertainty regarding the continued transition away
from LIBOR and the nature of any replacement rate. Proposals for alternative reference rates for other currencies have also been
announced or have already begun publication. Markets are in the process of developing in response to these new rates, and there
has been no global consensus as to an alternative rate. There could be significant operational challenges which could affect the
Funds’ performance for the continued transition away from LIBOR. The Funds and our portfolio companies and/or obligors may
need to amend or restructure our existing LIBOR-based debt instruments and any related hedging arrangements, depending on the
applicable LIBOR tenor. Such amendments and restructurings may be difficult, costly and time consuming. The Funds may invest,
or remain invested, in floating rate loans and investment securities whose interest rates are indexed to LIBOR.
Loans
are subject to the risk of payment defaults of scheduled interest or principal. Such non-payment could result in a reduction of
income, a reduction in the value of the investment and a potential decrease in the NAV of any of the Funds. Risk of loss of income
is generally higher for subordinated unsecured loans or debt, which are not backed by a security interest in any specific collateral.
There can be no assurance that the liquidation of any collateral securing a Loan would satisfy the Borrower’s obligation
to the applicable Fund in the event of non-payment of scheduled interest or principal payments, or that such collateral could
be readily liquidated.
Second
lien loans generally are subject to similar risks as those associated with investments in first lien loans except that such loans
are subordinated in payment and/or lower in lien priority to first lien holders. In the event of default on a second lien loan,
the first priority lien holder has first claim to the underlying collateral of the loan. Second lien loans are subject to the
additional risk that the cash flow of the Borrower and property securing the loan or debt, if any, may be insufficient to meet
scheduled payments after giving effect to the senior obligations of the Borrower. At June 30, 2024, BSL, BGX and BGB had invested
$4,951,586, $4,384,563, and $14,954,487, respectively, in second lien secured loans. Second lien secured loans are considered
Secured Loans for BGX and Senior Secured Loans for BGB, but are not considered Senior Loans for BSL.
Loans
can be rated below investment grade or may also be unrated. As a result, the risks associated with Loans may be similar to the
risks of other below investment grade securities, although they are senior and secured in contrast to other below investment grade
securities, which are often subordinated or unsecured. The Funds typically invest in Loans rated below investment grade, which
are considered speculative because of the credit risk of the Borrowers. Such companies are more likely than investment grade issuers
to default on their payments of interest and principal owed to the Funds, and such defaults could reduce NAV and income distributions.
The amount of public information available with respect to below investment grade loans will generally be less extensive than
that available for registered or exchange-listed securities. In evaluating the creditworthiness of Borrowers, the Adviser will
consider, and may rely in part on, analyses performed by others. The Adviser’s established best execution procedures and
guidelines require trades to be placed for execution only with broker-dealer counterparties approved by the Counterparty Committee
of the Adviser. The factors considered by the Counterparty Committee when selecting and approving brokers and dealers include,
but are not limited to: (i) quality, accuracy, and timeliness of execution, (ii) review of the reputation, financial strength
and stability of the financial institution, (iii) willingness and ability of the counterparty to commit capital, (iv) ongoing
reliability and (v) access to underwritten offerings and secondary markets. The Counterparty Committee regularly reviews each
broker-dealer counterparty based on the foregoing factors.
The
Funds may acquire Loans through assignments or participations. The Funds typically acquire these Loans through assignment, and
if a Fund acquires a Loan through participation, it will seek to elevate a participation interest into an assignment as soon as
practicably possible. The purchaser of an assignment typically succeeds to all the rights and obligations of the assigning institution
and becomes a lender under the credit agreement with respect to the debt obligation. A participation typically results in a contractual
relationship only with the institution participating out the interest, not with the Borrower. Sellers of participations typically
include banks, broker-dealers, other financial institutions and lending institutions. The Adviser has adopted best execution procedures
and guidelines which seek to mitigate credit and counterparty risk in the atypical situation when the Funds must acquire a Loan
through a participation.
BSL
and BGX have invested in CLO securities. A CLO is a financing entity (generally called a Special Purpose Vehicle (“SPV”)),
created to reapportion the risk and return characteristics of a pool of assets. While the assets underlying a CLO are typically
Secured Loans, the assets may also include (i) unsecured loans, (ii) debt securities that are rated below investment grade, and
(iii) equity securities incidental to investments in Secured Loans. When investing in CLOs, each fund will not invest in equity
tranches, which are the lowest tranche. However, each fund may invest in lower tranches of CLO debt securities, which typically
experience a lower recovery, greater risk of loss or deferral or non-payment of interest than more senior debt tranches of the
CLO. In addition, each Fund intends to invest in CLOs consisting primarily of individual Secured Loans of Borrowers and not repackaged
CLO obligations from other high risk pools. The underlying Secured Loans purchased by CLOs are generally performing at the time
of purchase but may
become non-performing, distressed or defaulted. CLOs with underlying assets of non-performing, distressed or defaulted loans are
not contemplated to comprise a significant portion of each Fund’s investments in CLOs. The key feature of the CLO structure
is the prioritization of the cash flows from a pool of debt securities among the several classes of the CLO. The SPV is a company
founded solely for the purpose of securitizing payment claims arising out of this diversified asset pool. On this basis, marketable
securities are issued by the SPV which, due to the diversification of the underlying risk, generally represent a lower level of
risk than the original assets. The redemption of the securities issued by the SPV typically takes place on a date earlier than
legal maturity from refinancing of the senior debt tranches.
| Semi-Annual
Report | June 30, 2024 |
97 |
| Blackstone
Credit & Insurance Funds |
Notes
to Financial Statements |
June
30, 2024 (Unaudited)
NOTE
8. GENERAL COMMITMENTS AND CONTINGENCIES
As
of June 30, 2024, the Funds had unfunded loan commitments outstanding, which could be extended at the option of the borrower,
as detailed below:
| | |
Blackstone Senior Floating | | |
Blackstone Long-Short | | |
Blackstone Strategic | |
| | |
Rate 2027 Term Fund | | |
Credit Income Fund | | |
Credit 2027 Term Fund | |
| Borrower | |
Par Value | | |
Fair Value | | |
Par Value | | |
Fair Value | | |
Par Value | | |
Fair Value | |
| Action Environmental Group, Inc., First Lien | |
| | | |
| | | |
| | | |
| | | |
| | | |
| | |
| Term Loan | |
$ | 146,612 | | |
$ | 147,712 | | |
$ | 144,346 | | |
$ | 145,428 | | |
$ | 164,817 | | |
$ | 166,054 | |
| Ryan LLC., First Lien Term Loan | |
| 52,063 | | |
| 52,343 | | |
| 44,444 | | |
| 44,683 | | |
| 147,302 | | |
| 148,093 | |
| Touchdown Acquirer Inc aka TenCate DDTL 1L | |
| 87,950 | | |
| 88,473 | | |
| 75,745 | | |
| 76,195 | | |
| 250,209 | | |
| 251,696 | |
| Groundworks LLC, First Lien Term Loan | |
| 94,772 | | |
| 94,831 | | |
| 104,642 | | |
| 104,707 | | |
| 226,555 | | |
| 226,696 | |
| Epicor Software Corp, First Lien Term Loan | |
| 42,902 | | |
| 43,134 | | |
| 37,661 | | |
| 37,866 | | |
| 137,765 | | |
| 138,511 | |
| Total | |
$ | 424,300 | | |
$ | 426,493 | | |
$ | 406,838 | | |
$ | 408,879 | | |
$ | 926,648 | | |
$ | 931,050 | |
Unfunded
loan commitments are marked to market on the relevant day of the valuation in accordance with the Funds’ valuation policies.
Any related unrealized appreciation/(depreciation) on unfunded loan commitments is recorded on the Statements of Assets and Liabilities
and the Statements of Operations. For the period ended June 30, 2024, BSL, BGX, and BGB recorded a net decrease in unrealized
appreciation on unfunded loan commitments totaling $2,252, $1,448, and $7,852, respectively.
NOTE
9. CREDIT DEFAULT SWAPS
BGX
may enter into over-the-counter (“OTC”) and/or centrally cleared credit default swap contracts and may also use credit
default swaps to express a negative credit view on a loan or other investment. If BGX purchases protection under a credit default
swap and no credit event occurs on the reference obligation, BGX will have made a series of periodic payments and recover nothing
of monetary value. However, if a credit event occurs on the reference obligation, BGX (if the buyer of protection) will receive
the full notional value of the reference obligation through a cash payment in exchange for the reference obligation or alternatively,
a cash payment representing the difference between the expected recovery rate and the full notional value.
The
periodic swap payments received or made by BGX are recorded in the Statements of Operations as realized gains or losses, respectively.
Any upfront fees paid are recorded as assets and any upfront fees received are recorded as liabilities and amortized over the
term of the swap. Swaps are marked-to-market daily and changes in value, including the accrual of periodic amounts of interest,
are recorded as unrealized appreciation (depreciation) and shown on BGX’s Statement of Operations. When the swap is terminated,
BGX will record a realized gain or loss equal to the difference between the proceeds from (or cost of) the closing transaction
and BGX’s basis in the contract, if any. Generally, the basis of the contracts is the unamortized premium received or paid.
International
Swaps and Derivatives Association, Inc. Master Agreements (“ISDA Master Agreements”) govern OTC financial derivative
transactions entered into by a Fund and those counterparties. The ISDA Master Agreements maintain provisions for general obligations,
representations, agreements, collateral and events of default or termination. Events of termination include conditions that may
entitle counterparties to elect to terminate early and cause settlement of all outstanding transactions under the applicable ISDA
Master Agreement. Any election to terminate early could be material to the financial statements.
| 98 | www.blackstone-credit.com |
| Blackstone
Credit & Insurance Funds |
Notes
to Financial Statements |
June
30, 2024 (Unaudited)
Swap
transactions involve, to varying degrees, elements of interest rate, credit and market risk in excess of the amounts recognized
in the Statements of Assets and Liabilities. Such risks involve the possibility that there will be no liquid market for these
agreements, that the counterparty to the agreements may default on its obligation to perform or disagree as to the meaning of
the contractual terms in the agreements, and that there may be unfavorable changes in interest rates and/or market values associated
with these transactions. The Adviser selects only those counterparties that it believes are credit-worthy.
During
the period ended June 30, 2024, BGX did not enter into any credit default swaps.
NOTE
10. LEVERAGE
On
July 27, 2016, BGX and BGB issued 7-year Mandatory Redeemable Preferred Shares (the “Series A MRPS”). BGX issued 20,000
Series A MRPS with a total liquidation value of $20,000,000 and BGB issued 45,000 Series A MRPS with a total liquidation value
of $45,000,000. As of February 11, 2021, the Series A MRPS of BGB and BGX were rated “AA” by Fitch Ratings. On February
12, 2021, Fitch Ratings downgraded the ratings on both BGB’s Series A MRPS and BGX’s Series A MRPS to “A”.
The downgrades were driven by changes to Fitch Ratings’ rating criteria for closed-end funds, rather than by any fundamental
changes to the Funds’ credit profiles. The dividend rate on the Funds’ Series A MRPS would have increased if the credit
rating for the relevant Fund were downgraded below “A” by Fitch Ratings or the equivalent rating of other nationally
recognized statistical ratings organizations. BGB and BGX used the proceeds of the offerings to make additional investments for
their portfolios. The final redemption date of the Series A MRPS was July 27, 2023, and on that date, BGB and BGX redeemed all
of their outstanding Series A MRPS at liquidation value in the amount of $45,000,000 and $20,000,000, respectively. Prior to redemption,
BGB and BGX made quarterly dividend payments on the Series A MRPS at an annual dividend rate of 3.61%. On July 25, 2023 BGB issued
45,000 4-year mandatory redeemable preferred shares (the “Series B MRPS”) with a par value of $0.001 per share and
a total liquidation value of $45,000,000. As of July 25, 2023, the Series B MRPS were rated “A” by Fitch Ratings.
The Series B MRPS are redeemable on July 25, 2027, and pay quarterly distributions at an annual dividend rate of 6.60%. The dividend
rate on the Fund's Series B MRPS will increase if the Fund's credit rating is downgraded below "A" by Fitch Ratings
or the equivalent rating of other nationally recognized statistical ratings organizations. BGB used substantially all of the proceeds
of the offering to fund the redemption payment for the Series A MRPS. Due to the terms of the Series B MRPS, face value approximates
fair value at June 30, 2024. This fair value is based on Level 2 inputs under the three-tier fair valuation hierarchy (see Note
2).
In
connection with BGB and BGX’s issuance of Series A MRPS, certain costs were incurred by BGB and BGX and have been recorded
net against the outstanding liability. These costs were amortized over the period beginning July 27, 2016 (day of issuance) through
July 27, 2023, the final redemption date. In connection with BGB's issuance of Series B MRPS, certain costs were incurred by BGB
and have been recorded net against the outstanding liability. These costs are being amortized over the period beginning July 25,
2023 (day of issuance) through July 25, 2027 (final redemption date) and are shown on BGB’s Statements of Operations under
amortization of deferred financing costs.
Except
for matters which do not require the vote of holders of Series B MRPS under the 1940 Act and except as otherwise provided in BGB’s
Declaration of Trust, Bylaws, or the applicable Securities Purchase Agreement or as otherwise required by applicable law, each
holder of Series B MRPS shall be entitled to one vote for each Series B MRPS held on each matter submitted to a vote of shareholders
of the Fund, and the holders of outstanding preferred shares and common shares shall vote together as a single class on all matters
submitted to shareholders; provided, however, that the holders of outstanding preferred shares shall be entitled, as a class,
to the exclusion of the holders of shares of all other classes of beneficial interest of the Fund, to elect two Trustees of the
applicable Fund at all times.
Each
Fund has entered into a separate Credit Agreement (each, an “Agreement”) with a lender to borrow money pursuant to
a two-year revolving line of credit (“Leverage Facility”) for BSL, BGX and BGB.
BSL
entered into an agreement dated October 8, 2014, as amended on October 7, 2015, October 5, 2016, and October 4, 2017, and
as further amended and restated on June 20, 2018 and as further amended and restated on October 4, 2019 and as amended on October
2, 2020, October 1, 2021, November 29, 2021, September 30, 2022 and September 29, 2023 to borrow up to a limit of $100 million,
with $34 million for tranche A loans ("BSL Tranche A Loans") and $66 million for tranche B loans ("BSL Tranche
B Loans").
BGX
entered into an agreement dated July 29, 2014, as amended on January 26, 2015, July 28, 2015, July 26, 2016, July 25, 2017,
January 8, 2018 and February 23, 2018 and as further amended and restated on June 20, 2018, and as further amended and restated
on July 25, 2019 and as amended on July 23, 2020, July 26, 2021, November 29, 2021, July 21, 2022 and July 20, 2023, to borrow
up to a limit of $100 million, with $34 million for tranche A loans (“BGX Tranche A Loans”) and $66 million for tranche
B loans (“BGX Tranche B Loans”).
BGB
entered into an agreement dated December 21, 2012, as amended on December 20, 2013, December 19, 2014, December 18, 2015,
July 26, 2016, December 16, 2016, December 20, 2017, as amended and restated on June 20, 2018, as amended on December 4, 2018
and as further amended and restated on January 11, 2019, as further amended on January 10, 2020, January 8, 2021, September 30,
2021, December 31, 2021 and December 30, 2022,
and as further amended and restated on December 29, 2023, to borrow up to a limit of $300 million, with $105 million for tranche
A loans (“BGB Tranche A Loans” and collectively with BGX Tranche A Loans and BSL Tranche A Loans, the “Tranche
A Loans”) and $195 million for tranche B loans (“BGB Tranche B Loans” and collectively with BGX Tranche B Loans
and BSL Tranche B Loans, the “Tranche B Loans”).
| Semi-Annual
Report | June 30, 2024 |
99 |
| Blackstone
Credit & Insurance Funds |
Notes
to Financial Statements |
June
30, 2024 (Unaudited)
Borrowings
under each Agreement are secured by the assets of each Fund.
Interest
on BSL's Leverage Facility is charged at a rate of 1.00% above adjusted term Secured Overnight Financing Rate
(“SOFR”) with respect to BSL Tranche A Loans, 1.30% above adjusted term SOFR for one (1) month interest period
BSL Tranche B Loans and 1.20% above adjusted term SOFR for three (3) month interest period BSL Tranche B Loans, with adjusted
term SOFR measured for the period commencing on the date of the making of such Loan at adjusted term SOFR (or the last date
upon which any other Loan was converted to, or continued as, such Loan at adjusted term SOFR) and ending on the numerically
corresponding day in the calendar month that is one (1), or three (3) months thereafter, as the Fund may elect, or such other
periods as the lender may agree in its sole and absolute discretion.
Interest
on BGB’s Leverage Facility is charged at a rate of 1.00% above adjusted term SOFR with respect to BGB Tranche A Loans, 1.30%
above adjusted term SOFR for one (1) month interest period BGB Tranche B Loans and 1.20% above adjusted term SOFR for three (3)
month interest period BGB Tranche B Loans, with adjusted term SOFR measured for the period commencing on the date of the making
of such Loan at adjusted term SOFR (or the last date upon which any other Loan was converted to, or continued as, such Loan at
adjusted term SOFR) and ending on the numerically corresponding day in the calendar month that is one (1) or three (3) months
thereafter, as the Fund may elect, or such other periods as the lender may agree in its sole and absolute discretion.
Interest
on BGX's Leverage Facility is charged at a rate of 1.00% above adjusted term SOFR with respect to BGX Tranche A Loans, 1.30% above
adjusted term SOFR for one (1) month interest period BGX Tranche B Loans and 1.20% above adjusted term SOFR for three (3) month
interest period BGX Tranche B Loans, with adjusted term SOFR measured for the period commencing on the date of the making of such
Loan at adjusted term SOFR (or the last date upon which any other Loan was converted to, or continued as, such Loan to at adjusted
term SOFR) and ending on the numerically corresponding day in the calendar month that is one (1) or three (3) months thereafter,
as the Fund may elect, or such other periods as the lender may agree in its sole and absolute discretion.
Under
the terms of the applicable Agreement, each Fund must pay a commitment fee on any undrawn amounts. The commitment fee payable
in BSL, BGB and BGX, for each of Tranche A and Tranche B Loans is 0.15% on the undrawn amounts when drawn amounts exceed 75% of
the borrowing limit and 0.25% on the undrawn amounts at any other time. Interest and fees are generally payable at the end of
the respective interest period. Each Fund may elect to extend the applicable Agreement for a further period with the consent of
the lending bank. At June 30, 2024, BSL, BGX, and BGB had borrowings outstanding under their respective Leverage Facility of $90,600,000,
$79,200,000, and $291,100,000, at an interest rate of 6.47%, 6.48%, and 5.59%, respectively. Due to the short term nature of each
Agreement, face value approximates fair value at June 30, 2024. This fair value is based on Level 2 inputs under the three-tier
fair valuation hierarchy (see Note 2). For the period ended June 30, 2024, the average borrowings under BSL’s, BGX’s
and BGB’s Leverage Facility and the weighted average interest rates were $90,479,121 and 6.59%, $78,551,648 and 6.57%, and
$290,534,066 and 6.18%, respectively. During the period ended June 30, 2024, BSL, BGX and BGB incurred $16,203, $26,649, and $4,859,
respectively, for commitment fees on undrawn amounts, which is included under Interest on leverage facility on the Statements
of Operations.
Under
each Agreement and governing document of the Series B MRPS, each Fund has agreed to certain covenants and additional investment
limitations while the leverage is outstanding. Each Fund agreed to maintain asset coverage of three times over borrowings, and
BGB has agreed to maintain 225% asset coverage over borrowings plus Series B MRPS. Compliance with the investment restrictions
and calculations are performed by the Funds’ custodian, The Bank of New York Mellon.
The
use of borrowings to leverage the common shares of the Funds may create risks. Changes in the value of the Funds’ portfolios,
including securities bought with the proceeds of leverage, are borne entirely by the holders of common shares of the Funds. All
costs and expenses related to any form of leverage used by the Funds are borne entirely by common shareholders. If there is a
net decrease or increase in the value of the Funds’ investment portfolios, the leverage may decrease or increase, as the
case may be, the NAV per common share to a greater extent than if the Funds did not utilize leverage. During periods when BSL
and BGB are using leverage, the fees paid to the Adviser for advisory services and to ALPS for administrative services are higher
than if BSL and BGB did not use leverage because the fees paid are calculated on the basis of BSL and BGB’s Managed Assets,
which include the assets purchased through leverage. As of June 30, 2024, BSL’s, BGX’s, and BGB’s leverage represented
31.99%, 31.95%, and 37.08% of each Fund’s Managed Assets, respectively. The leverage amount in BGB includes 4.96% of Managed
Assets attributable to the Series B MRPS.
| 100 | www.blackstone-credit.com |
| Blackstone
Credit & Insurance Funds |
Notes
to Financial Statements |
June
30, 2024 (Unaudited)
NOTE
11. INCOME TAX
Ordinary
income, which as determined on a tax basis includes net short-term capital gains, if any, is allocated to common stockholders
after the consideration of any payments due on outstanding term preferred shares. To the extent that the amount distributed to
common stockholders exceeds the amount of available ordinary income these distributions may be treated as a return of capital
on a tax basis. Additionally, to the extent that the amount distributed on any outstanding term preferred shares exceeds the amount
of available ordinary income, these distributions may also be treated as a return of capital on a tax basis.
Amounts
paid from net long-term capital gains of the Funds, if any, will be designated as such by the Funds and are determined after the
consideration of any payments due on outstanding preferred shares.
The
Funds may make certain adjustments to the classification of net assets as a result of significant permanent book-to-tax differences,
which include differences in the book and tax basis of certain assets and liabilities, and non-deductible federal taxes or losses,
among other items. These differences may be charged or credited to paid-in capital and distributable earnings as a result. For
the year ended December 31, 2023 permanent differences were as follows
| | |
Increase/(Decrease) | | |
Increase/(Decrease) | |
| Fund | |
Paid-in capital | | |
Total Distributable Earnings | |
| Blackstone Senior Floating Rate 2027 Term Fund | |
$ | (35,451 | ) | |
$ | 35,451 | |
| Blackstone Long-Short Credit Income Fund | |
$ | (27,380 | ) | |
$ | 27,380 | |
| Blackstone Strategic Credit 2027 Term Fund | |
$ | (203,128 | ) | |
$ | 203,128 | |
The
tax character of distributions paid by the Funds during the fiscal year ended December 31, 2023 was as follows:
| | |
Blackstone
Senior Floating | | |
Blackstone
Long-Short Credit | | |
Blackstone
Strategic Credit | |
| 2023 | |
Rate
2027 Term Fund | | |
Income
Fund | | |
2027
Term Fund | |
| Distributions
Paid From: | |
| | | |
| | | |
| | |
| Ordinary
Income | |
$ | 18,680,266 | | |
$ | 17,458,482 | (a) | |
$ | 56,227,196 | (a) |
| Total | |
$ | 18,680,266 | | |
$ | 17,458,482 | | |
$ | 56,227,196 | |
| (a) | Distributions
paid include common shares and mandatory redeemable preferred shares. |
Under
the Regulated Investment Company Modernization Act of 2010, net capital losses recognized by the Fund may get carried forward
indefinitely, and retain their character as short-term and/or long-term losses. Any such losses will be deemed to arise on the
first day of the next taxable year. Losses for the year ended December 31, 2023, and as such are deemed to arise on the first
day of the year ended December 31, 2024, were as follows:
| Fund | |
Short Term | | |
Long Term | |
| Blackstone Senior Floating Rate 2027 Term Fund | |
$ | 4,272,583 | | |
$ | 57,701,462 | |
| Blackstone Long-Short Credit Income Fund | |
$ | 7,037,018 | | |
$ | 58,729,389 | |
| Blackstone Strategic Credit 2027 Term Fund | |
$ | 22,565,487 | | |
$ | 236,614,593 | |
At
December 31, 2023, the components of distributable earnings on a tax basis for the Funds were as follows:
| | |
Blackstone Senior Floating | | |
Blackstone Long-Short Credit | | |
Blackstone Strategic Credit | |
| | |
Rate 2027 Term Fund | | |
Income Fund | | |
2027 Term Fund | |
| Undistributed ordinary income | |
$ | 155,795 | | |
$ | – | | |
$ | 229,988 | |
| Accumulated capital losses | |
| (61,974,045 | ) | |
| (65,766,407 | ) | |
| (259,180,080 | ) |
| Unrealized appreciation/(depreciation) | |
| (5,074,436 | ) | |
| (4,057,943 | ) | |
| (15,132,893 | ) |
| Other Cumulative effect of timing differences | |
| – | | |
| (83,994 | ) | |
| – | |
| Total | |
$ | (66,892,686 | ) | |
$ | (69,908,344 | ) | |
$ | (274,082,985 | ) |
| Semi-Annual
Report | June 30, 2024 |
101 |
| Blackstone
Credit & Insurance Funds |
Notes
to Financial Statements |
June
30, 2024 (Unaudited)
The
amount of net tax unrealized appreciation/(depreciation) and the tax cost of investment securities at June 30, 2024, calculated
using book/tax differences as of the most recently ended fiscal year, December 31, 2023, were as follows:
| | |
Blackstone Senior Floating | | |
Blackstone Long-Short Credit | | |
Blackstone Strategic Credit | |
| | |
Rate 2027 Term Fund | | |
Income Fund | | |
2027 Term Fund | |
| Cost of investments for income tax purposes | |
$ | 302,314,389 | | |
$ | 263,234,110 | | |
$ | 965,886,874 | |
| Gross appreciation (excess of value over tax cost) | |
$ | 2,523,222 | | |
$ | 2,479,394 | | |
$ | 9,872,623 | |
| Gross depreciation (excess of tax cost over value) | |
| (7,647,285 | ) | |
| (7,026,706 | ) | |
| (30,061,384 | ) |
| Net unrealized depreciation | |
$ | (5,124,063 | ) | |
$ | (4,547,312 | ) | |
$ | (20,188,761 | ) |
NOTE
12. RECENT ACCOUNTING PRONOUNCEMENT
In
March 2020, the FASB issued ASU No. 2020-04, “Reference Rate Reform (Topic 848),” which provides optional expedients
and exceptions for applying GAAP to contracts, hedging relationships, and other transactions affected by reference rate reform
if certain criteria are met. The amendments apply only to contracts, hedging relationships, and other transactions that reference
LIBOR or another reference rate expected to be discontinued because of reference rate reform. In January 2021, the FASB issued
ASU No. 2021-01, Reference Rate Reform (Topic 848), which expanded the scope of Topic 848 to include derivative instruments impacted
by discounting transition. In December 2022, FASB issued Accounting Standards Update No. 2022-06, "Deferral of the Sunset
Date of Topic 848" ("ASU 2022-06). ASU 2022-06 defers the sunset date of Topic 848 to December 31, 2024, to permit entities
to apply the guidance in Topic 848 through an 18-month period after the cessation date of USD LIBOR, which occurred on June 30,
2023. Management does not expect ASU No. 2022-06 to have a material impact on the financial statements.
In
June 2022, FASB issued Accounting Standards Update No. 2022-03, "Fair Value Measurement of Equity Securities Subject to Contractual
Sale Restrictions" ("ASU 2022-03"). ASU 2022-03 clarifies the guidance in ASC 820, related to the measurement of
the fair value of an equity security subject to contractual sale restrictions, where it eliminates the ability to apply a discount
to the fair value of these securities, and introduces disclosure requirements related to such equity securities. The guidance
is effective for fiscal years, and interim periods within those fiscal years, beginning after December 15, 2023, and allows for
early adoption. Management is currently evaluating the impact of applying this update.
NOTE
13. INDEMNIFICATIONS
Under
each Fund's organizational documents, its officers and Trustees may be indemnified against certain liabilities and expenses arising
out of the performance of their duties to the respective Fund. Additionally, in the normal course of business, each Fund enters
into agreements with service providers that may contain indemnification clauses. Under such agreements, underwriters and agents
may be entitled to indemnification by a Fund against certain civil liabilities, including liabilities under the Securities Act
of 1933, or to contribution for payments the underwriters or agents may be required to make. Each Fund's maximum exposure under
these agreements is unknown as this would involve future claims that may be made against the respective Fund that have not yet
occurred.
NOTE
14. SUBSEQUENT EVENTS
In
preparing these financial statements, the Funds’ management has evaluated events and transactions for potential recognition
or disclosure through the date the financial statements were issued.
Shareholder
Distributions for BSL: On June 11, 2024, a monthly distribution of $0.114 per share was declared to common shareholders, payable
on July 31, 2024, to common shareholders of record on July 24, 2024. On June 11, 2024, a monthly distribution of $0.114 per share
was declared to common shareholders, payable on August 30, 2024 to common shareholders of record on August 23, 2024.
Shareholder
Distributions for BGX: On June 11, 2024, a monthly distribution of $0.105 per share was declared to common shareholders, payable
on July 31, 2024, to common shareholders of record on July 24, 2024. On June 11, 2024, a monthly distribution of $0.105 per share
was declared to common shareholders, payable on August 30, 2024 to common shareholders of record on August 23, 2024.
Shareholder
Distributions for BGB: On June 11, 2024, a monthly distribution of $0.101 per share was declared to common shareholders, payable
on July 31, 2024, to common shareholders of record on July 24, 2024. On June 11, 2024, a monthly distribution of $0.101 per share
was declared to common shareholders, payable on August 30, 2024 to common shareholders of record on August 23, 2024.
| 102 | www.blackstone-credit.com |
| Blackstone
Credit & Insurance Funds |
Summary of Dividend Reinvestment Plan |
June
30, 2024 (Unaudited)
Pursuant
to the Funds’ Dividend Reinvestment Plan (the “DRIP”), shareholders whose shares are registered in their own
name may “opt-in” to the plan and elect to reinvest all or a portion of their distributions in common
shares by providing the required enrollment notice to Computershare, the DRIP administrator. Shareholders whose shares are held
in the name of a broker or other nominee may have distributions reinvested only if such a service is provided by the broker or
the nominee or if the broker or the nominee permits participation in the DRIP. Shareholders whose shares are held in the name
of a broker or other nominee should contact the broker or nominee for details. A shareholder may terminate participation in the
DRIP at any time by notifying the DRIP administrator before the record date of the next distribution through the Internet, by
telephone or in writing. All distributions to shareholders who do not participate in the DRIP, or have elected to terminate their
participation in the DRIP, will be paid by check mailed directly to the record holder by or under the direction of the DRIP administrator
when the Board declares a distribution.
When
the Funds declare a distribution, shareholders who are participants in the applicable DRIP receive the equivalent of the amount
of the distribution in common shares. If you participate in the DRIP, the number of common shares of the Funds that you will receive
will be determined as follows:
(1)
If the market price of the common shares plus any brokerage commissions on the payable date (or, if the payable date is not a
New York Stock Exchange trading day, the immediately preceding trading day) for determining shareholders eligible to receive the
relevant distribution (the ‘‘determination date’’) is equal to or exceeds 98% of the NAV per common share,
the Fund will issue new common shares at a price equal to the greater of:
| (a) | 98%
of the NAV per share at the close of trading on the New York Stock Exchange on the determination date or |
| (b) | 95%
of the market price per common share on the determination date. |
(2)
If 98% of the NAV per common share exceeds the market price of the common shares plus any brokerage commissions on the determination
date, the DRIP administrator will receive the distribution in cash and will buy common shares in the open market, on the New York
Stock Exchange or elsewhere, for your account as soon as practicable commencing on the trading day following the determination
date and terminating no later than the earlier of (a) 30 days after the distribution payment date, or (b) the record date for
the next succeeding distribution to be made to the shareholders; except when necessary to comply with applicable provisions of
the federal securities laws. If during this period: (i) the market price plus any brokerage commissions rises so that it equals
or exceeds 98% of the NAV per common share at the close of trading on the New York Stock Exchange on the determination date before
the DRIP administrator has completed the open market purchases or (ii) the DRIP administrator is unable to invest the full amount
eligible to be reinvested in open market purchases, the DRIP administrator will cease purchasing common shares in the open market
and the Fund will issue the remaining common shares at a price per share equal to the greater of (a) 98% of the NAV per share
at the close of trading on the New York Stock Exchange on the determination date or (b) 95% of the then current market price per
share.
The
DRIP administrator maintains all shareholder accounts in the dividend reinvestment plan and furnishes written confirmations of
all transactions in the account, including information needed by shareholders for personal and tax records. Common shares in the
account of each DRIP participant are held by the DRIP administrator in non-certificated form in the name of the participant, and
each shareholder’s proxy includes shares purchased pursuant to the DRIP.
There
is no charge to participants for reinvesting regular distributions and capital gains distributions. The fees of the DRIP administrator
for handling the reinvestment of regular distributions and capital gains distributions are included in the fee to be paid by us
to our transfer agent. There are no brokerage charges with respect to shares issued directly by us as a result of regular distributions
or capital gains distributions payable either in shares or in cash. However, each participant bears a pro rata share of brokerage
commissions incurred with respect to the DRIP administrator’s open market purchases in connection with the reinvestment
of such distributions. Shareholders that opt-in to the DRIP will add to their investment through dollar cost averaging. Because
all dividends and distributions paid to such shareholder will be automatically reinvested in additional common shares, the average
cost of such shareholder’s common shares will decrease over time. Dollar cost averaging is a technique for lowering the
average cost per share over time if the Fund’s NAV declines. While dollar cost averaging has definite advantages, it cannot
assure profit or protect against loss in declining markets.
The
automatic reinvestment of such dividends or distributions does not relieve participants of any income tax that may be payable
on such dividends or distributions.
You
may obtain additional information by contacting the DRIP administrator at the following address: Computershare, Attn: Sales Dept.,
P.O. Box 358035, Pittsburgh, PA 15252.
| Semi-Annual
Report | June 30, 2024 |
103 |
| Blackstone
Credit & Insurance Funds |
Additional Information |
June
30, 2024 (Unaudited)
Portfolio
Information: The Funds file their complete schedules of portfolio holdings with the Securities and Exchange Commission (the
“SEC”) for the first and third quarters of each fiscal year as an exhibit on Form N-PORT within 60 days after the
end of the Funds’ fiscal quarter. The Funds' portfolio holdings information for the third month of each fiscal quarter on
Form N-PORT is available (1) on the Funds’ website located at www.blackstone-credit.com or (2) on the SEC’s website
at http://www.sec.gov. Holdings and allocations shown on any Form N-PORT are as of the date indicated in the filing and may not
be representative of future investments. Holdings and allocations should not be considered research or investment advice and should
not be relied upon in making investment decisions.
Proxy
Information: The policies and procedures used to determine how to vote proxies relating to securities held by the Funds
are available (1) without charge, upon request, by calling 1-877-876-1121, (2) on the Funds’ website located at
www.blackstone-credit.com, and (3) on the SEC’s website at http://www.sec.gov. Information regarding how the Funds
voted proxies relating to portfolio securities during the most recent twelve-month period ended June 30 is available on Form
N-PX by August 31 of each year (1) without charge, upon request, by calling 1-877-876-1121, (2) on the Funds’ website
located www.blackstone-credit.com, and (3) on the SEC’s website at http://www.sec.gov.
Senior
Officer Code of Ethics: The Funds file a copy of their code of ethics that applies to the Funds’ principal executive
officer, principal financial officer or controller, or persons performing similar functions, with the SEC as an exhibit to each
annual report on Form N-CSR. This will be available on the SEC’s website at http://www.sec.gov.
BSL
Annual Meeting of Shareholders - Voting Results
On
April 17, 2024, BSL held a special meeting of shareholders to consider the proposals set forth below. The following votes were
recorded:
Proposal
1: The election of Thomas W. Jasper as Class I Trustee of BSL, term to expire at the 2027 annual shareholder meeting (only common
shareholders vote).
| |
Number
of Shares |
%
of Shares Voted |
| Affirmative |
10,490,677 |
96.21% |
| Withheld |
412,776 |
3.79% |
| Total |
10,903,453 |
100.00% |
Proposal
2: The election of Gary S. Schpero as Class I Trustee of BSL, term to expire at the 2027 annual shareholder meeting (only common
shareholders vote).
| |
Number
of Shares |
%
of Shares Voted |
| Affirmative |
10,402,946 |
95.41% |
| Withheld |
500,507 |
4.59% |
| Total |
10,903,453 |
100.00% |
BGX
Annual Meeting of Shareholders - Voting Results
On
April 17, 2024, BGX held a special meeting of shareholders to consider the proposals set forth below. The following votes were
recorded:
Proposal
1: The election of Thomas W. Jasper as Class III Trustee of BGX, term to expire at the 2027 annual shareholder meeting (only common
shareholders vote).
| |
Number
of Shares |
%
of Shares Voted |
| Affirmative |
9,171,957 |
96.63% |
| Withheld |
319,307 |
3.37% |
| Total |
9,491,264 |
100.00% |
Proposal
2: The election of Gary S. Schpero as Class III Trustee of BGX, term to expire at the 2027 annual shareholder meeting (only common
shareholders vote).
| |
Number
of Shares |
%
of Shares Voted |
| Affirmative |
8,829,874 |
93.03% |
| Withheld |
661,390 |
6.97% |
| Total |
9,491,264 |
100.00% |
| 104 |
www.blackstone-credit.com |
| Blackstone
Credit & Insurance Funds |
Additional Information |
June
30, 2024 (Unaudited)
BGB
Annual Meeting of Shareholders - Voting Results
On
April 17, 2024, BGB held a special meeting of shareholders to consider the proposals set forth below. The following votes were
recorded:
Proposal
1: The election of Thomas W. Jasper as Class II Trustee of BGB, term to expire at the 2027 annual shareholder meeting (only preferred
shareholders vote).
| |
Number
of Shares |
%
of Shares Voted |
| Affirmative |
45,000 |
100.00% |
| Withheld |
0 |
0.00% |
| Total |
45,000 |
100.00% |
Proposal
2: The election of Gary S. Schpero as Class II Trustee of BGB, term to expire at the 2027 annual shareholder meeting (common and
preferred shareholders vote).
| |
Number
of Shares |
%
of Shares Voted |
| Affirmative |
29,718,300 |
77.16% |
| Withheld |
8,798,501 |
22.84% |
| Total |
38,516,801 |
100.00% |
| Semi-Annual
Report | June 30, 2024 |
105 |
| Blackstone
Credit & Insurance Funds |
Privacy
Procedures |
June
30, 2024 (Unaudited)
This
privacy policy sets forth the Adviser’s policies with respect to nonpublic personal information of individual investors,
shareholders, prospective investors and former investors of investment funds managed by the Adviser. These policies apply to individuals
only and are subject to change.
Rev May 2024
| FACTS |
WHAT DO BLACKSTONE REGISTERED FUNDS DO WITH YOUR PERSONAL INFORMATION? |
| Why? |
Financial companies choose how they share your personal information. Federal law gives consumers the right to limit some but not all sharing. Federal law also requires us to tell you how we collect, share, and protect your personal information. Please read this notice carefully to understand what we do. |
| What? |
The types of personal information we collect and share depend on the
product or service you have with us. This information can include:
● Social Security number and income
● Assets
and investment experience
● Risk
tolerance and transaction history |
| How? |
All financial companies need to share customers’ personal information to run their everyday business. In the section below, we list the reasons financial companies can share their customers’ personal information; the reasons Blackstone Registered Funds (as defined below) choose to share; and whether you can limit this sharing. |
| Reasons we can share your personal information |
Do Blackstone
Registered Funds share? |
Can you limit this sharing? |
| For our everyday business purposes – such as to process your transactions, maintain your account(s), respond to court orders and legal investigations, or report to credit bureaus |
Yes |
No |
| For our marketing purposes – to offer our products and services to you |
Yes |
No |
| For joint marketing with other financial companies |
No |
We don't share |
| For our affiliates' everyday business purposes – information about your transactions and experiences |
No |
We don't share |
| For our affiliates' everyday business purposes – information about your creditworthiness |
No |
We don't share |
| For our affiliates to market to you |
No |
We don't share |
| For nonaffiliates to market to you |
No |
We don't share |
| Questions? |
Email us at GLB.privacy@blackstone.com |
| Who We Are |
|
| Who is providing this notice? |
Blackstone Registered Funds consists of Blackstone Alternative Investment Funds, on
behalf of its series Blackstone Alternative Multi-Strategy Fund, Blackstone Senior
Floating Rate 2027 Term Fund, Blackstone Long-Short Credit Income Fund, Blackstone
Strategic Credit 2027 Term Fund, and Blackstone Floating Rate Enhanced Income Fund,
Blackstone Private Credit Fund, and Blackstone Secured Lending Fund. |
| 106 |
www.blackstone-credit.com |
| Blackstone Credit & Insurance
Funds |
Privacy
Procedures |
June
30, 2024 (Unaudited)
| What We Do |
|
| How do Blackstone Registered Funds protect my personal information? |
To protect your personal information from unauthorized access and use, we use security measures that comply with federal law. These measures include computer safeguards and secured files and buildings. |
|
How do Blackstone Registered Funds
collect my personal information? |
We collect your personal information, for example, when you:
● open
an account or give us your income information
● provide
employment information or give us your contact information
● tell
us about your investment or retirement portfolio
We also collect your personal information from others, such as credit
bureaus, affiliates, or other companies. |
| Why can't I limit all sharing? |
Federal law gives you the right to limit only:
● sharing for affiliates’ everyday business purposes—information about your
creditworthiness
● affiliates
from using your information to market to you sharing for nonaffiliates to market to you State laws and individual companies
may give you additional rights to limit sharing.
See below for more on your rights under state law. |
| What happens when I limit sharing for an account I hold jointly with someone else? |
Your choices will apply to everyone on your account — unless you tell us otherwise. |
| Definitions |
|
| Affiliates |
Companies related by common ownership or control. They can be financial
and nonfinancial companies.
● Our affiliates include entities with a Blackstone name and certain other
financial companies. |
| Nonaffiliates |
Companies not related by common ownership or control. They can be financial
and nonfinancial companies.
● Blackstone
Registered Funds do not share with nonaffiliates so they can market to you. |
| Joint marketing |
A formal agreement between nonaffiliated financial companies that together
market financial products or services to you.
● Our
joint marketing partners include financial services companies. |
| Other Important Information |
California
Residents — In accordance with California law, we will not share information we collect about California residents with
nonaffiliates except as permitted by law, such as with the consent of the customer or to service the customer’s accounts.
We will also limit the sharing of information about you with our affiliates to the extent required by applicable California law.
Vermont
Residents — In accordance with Vermont law, we will not share information we collect about Vermont residents with nonaffiliates
except as permitted by law, such as with the consent of the customer or to service the customer’s accounts. We will not
share creditworthiness information about Vermont residents among Blackstone Registered Funds’ affiliates except with the
authorization or consent of the Vermont resident.
If
you have any questions or comments about this Privacy Notice, or if you would like us to update information we have about you
or your preferences, please email us at PrivacyQueries@Blackstone.com or access our web form www.blackstone.com/privacy.
You
may also write to:
Blackstone
Inc.
Attn:
Legal & Compliance
345
Park Avenue
New
York, NY 10154
| Semi-Annual Report | June
30, 2024 |
107 |
| Blackstone Credit &
Insurance Funds |
Privacy Procedures |
June
30, 2024 (Unaudited)
INVESTOR
DATA PRIVACY NOTICE
Why
are you seeing this notice?
| ● | You
may need to provide Personal Data to us as part of your investment into a fund or other investment vehicle (as applicable, the
Fund) managed or advised by investment advisers or management companies that are subsidiaries of The Blackstone Group Inc.
or its affiliates (and, where applicable, the general partner of the relevant Fund) (collectively, Blackstone). |
| ● | We
want you to understand how and why we use, store and otherwise process your Personal Data when you deal with us or our relevant
affiliates (including under applicable data protection laws). If this notice (the Data Privacy Notice) has been made available
to you, you may have certain rights with respect to your Personal Data under applicable data protection laws (including as described
in this Data Privacy Notice). |
| ● | “Personal
Data” has the meaning given to it under data protection laws that apply to our processing of your personal information,
and includes any information relating to an identified or identifiable individual (such as name, address, date of birth, personal
identification numbers, sensitive personal information, and economic information). |
| ● | We
ask that investors promptly provide the information contained in this Data Privacy Notice to any individuals whose Personal Data
they provide to the Fund or its affiliates in connection with ‘know your client’ / anti-money laundering requests
or otherwise. |
Please
read the information below carefully. It explains how and why Personal Data is processed by us.
Who is providing this notice?
Blackstone
is committed to protecting and respecting your privacy. Blackstone is a global financial services firm with offices, branches,
operations and entities globally, including as described at this link: https://privacy.blackstone.com/visitors-online-privacy-notice/#appendixA
| ● | For
transparency, the Blackstone entities on whose behalf this privacy statement is made are: (i) the Fund; and (ii) where applicable,
the Blackstone general partner, manager and/or investment adviser of the relevant Fund, in each case, with which you contract,
transact or otherwise share Personal Data (together, the Fund Parties). |
| ● | Where
we use the terms “we”, “us” and “our” in this Data Privacy Notice, we
are referring to the Fund and the Fund Parties. |
| ● | Please
consult your subscription documents, private placement memorandum or other offering documentation provided to you by or on behalf
of the Fund Parties which will further specify the entities and contact details of the Fund Parties relevant to our relationship
with you. |
| ● | We
welcome investors and their representatives to contact us if they have any queries with respect to the Fund Parties (in particular,
which Fund Parties are relevant to their relationship with Blackstone). If you have any queries, please see the ‘Contact
Us’ section. |
When you provide us with your Personal Data, each Fund
Party that decides how and why Personal Data is processed acts as a “data controller”. In simple terms, this
means that the Fund Party makes certain decisions on how to use and protect your Personal Data – but only to the extent
that we have informed you about the use or are otherwise permitted by law.
Where
your Personal Data is processed by an entity controlled by, or under common control with, the Blackstone entity/ies managing a
Fund for its own purposes, this entity will also be a data controller.
What
personal data do we collect about you?
The
types of Personal Data that we collect and share depends on the product or service you have with us and the nature of your investment.
The Personal Data we collect about you may include:
| ● | Contact
information, such as name, e-mail and postal address, and phone number; |
| ● | Demographic
information, such as date and country of birth, gender, country of residence, nationality, and citizenship; |
| ● | Government-issued
identification numbers provided in connection with a subscription to Funds, such as Social Security number, driver’s license
number, passport number, national identification number, and tax identification number; |
| ● | Professional
or employment-related information, such as the name of your employer or the organization you represent and your position; |
| ● | Financial
information, such as information related to your transactions with us or others, bank account details (e.g., account and routing
number), financial account history, information concerning the source of funds used for investments, and details regarding your
investment history (e.g., types and amounts of investments) assets, income, and financial returns and positions; |
| 108 |
www.blackstone-credit.com |
| Blackstone
Credit & Insurance Funds |
Privacy
Procedures |
June
30, 2024 (Unaudited)
| ● | Information
related to background checks (e.g., “know your client”, anti-money laundering and sanctions checks) and any information
related to applicable restrictions on your investments, such as political exposure or sanctions; |
| ● | Information
collected in the context of monitoring and surveillance where permitted or required by applicable law, including recordings of
telephone and video calls and CCTV; and |
| ● | Other
information you or the organization you represent choose to provide, such as through eligibility questionnaires and ongoing investor
relations communications. |
We
may combine Personal Data that you provide to us with Personal Data that we collect from you, or about you from other sources,
in some circumstances. This will include Personal Data collected in an online or offline context.
Where
do we obtain your personal data?
We
collect Personal Data about you from a number of sources, including:
| WHAT |
HOW |
| Personal
data that you give us |
●
From the forms and any associated documentation that you complete when
subscribing for an investment, shares, interests, and/or opening an account with us.
This can include information about your name, address, date of birth, passport details
or other national identifier, driving license, your national insurance or Social Security
number and income, employment information and details about your investment or retirement
portfolio(s), and financial-related data (such as returns and financial positions)
●
When you provide it to us in correspondence and conversations, including electronic communications such as e-mail
and telephone calls
●
When you make transactions with respect to the Fund
●
When you interact with our online platforms and websites (such as bxaccess.com)
●
When you purchase securities from us and/or tell us where to send money
●
From cookies, web beacons, and similar interactions when you or your devices access our sites
●
When we need to identify you and/or complete necessary security checks, where you visit one of our buildings or
attend meetings. This can include form of ID, and your image for CCTV purposes. |
| Personal
data that we obtain from others |
We
obtain Personal Data from:
●
Publicly available and accessible directories and sources
●
Bankruptcy registers
●
Tax authorities, including those that are based outside the territory in which you are located or domiciled, including
the Cayman Islands, the United Kingdom (UK) and the European Economic Area (EEA), if you are subject to tax in another jurisdiction
●
Governmental and competent regulatory authorities to whom we have regulatory obligations
●
Credit agencies
●
Fraud prevention and detection agencies / organizations
●
Transaction counterparties |
| Semi-Annual Report | June
30, 2024 |
109 |
| Blackstone Credit & Insurance
Funds |
Privacy
Procedures |
June
30, 2024 (Unaudited)
Why
do we process your personal data?
We
may process your Personal Data for the following reasons:
| WHY |
HOW |
| Contract |
It is necessary to perform our contract with you to:
● Administer,
manage and set up your investor account(s) to allow you to purchase your holding (of shares or interests) in our Funds
● Meet
the resulting contractual obligations we have to you
● Facilitate
the continuation or termination of the contractual relationship between you and the Fund
● Facilitate
the transfer of funds, and administering and facilitating any other transaction, between you and the Fund |
| Compliance with law |
It is necessary for compliance with an applicable legal or regulatory
obligation to which we are subject, in order to:
● Undertake
our client and investor due diligence, and on-boarding checks
● Carry
out verification, “know your client”, terrorist financing, sanctions, and anti-money laundering checks
● Verify
the identity and addresses of our investors (and, if applicable, their beneficial owners)
● Comply
with requests from regulatory, governmental, tax and law enforcement authorities
● Carry
out surveillance and investigations
● Carry
out audit checks
● Maintain
statutory registers
● Prevent
and detect fraud
● Comply
with sanctions requirements |
| 110 |
www.blackstone-credit.com |
| Blackstone Credit & Insurance
Funds |
Privacy
Procedures |
June
30, 2024 (Unaudited)
| Legitimate Interests |
For our legitimate interests or those of a third party (such
as a transaction counterparty or lender) to:
● Manage and administer your holding in any Funds in which you are invested,
and any related accounts on an ongoing basis
● Assess
and process any applications or requests made by you
● Open,
maintain or close accounts in connection with your investment in, or withdrawal from, the Fund scheme
● Send
updates, information and notices or otherwise correspond with you in connection with your investment in the Fund scheme
● Address
or investigate any complaints, claims, proceedings or disputes
● Provide
you with, and inform you about, our investment products and services
● Monitor and improve our relationships with investors
● Comply
with applicable prudential and regulatory obligations, including anti-money laundering, sanctions and “know your client” checks
● Assist
our transaction counterparties to comply with their regulatory and legal obligations (including anti-money laundering, “know your
client”, terrorist financing, and sanctions checks)
● Manage
our risk and operations
● Comply
with our accounting and tax-reporting requirements
● Comply with our audit requirements
● Assist
with internal compliance with our policies and processes
● Ensure appropriate group management and governance
● Keep
our internal records
● Prepare
reports on incidents/accidents
● Protect
our business against fraud, breach of confidence, theft of proprietary materials, and other financial or business crimes (to the extent
that this is not required of us by law)
● Analyze
and manage commercial risks
● Seek
professional advice, including legal advice
● Enable
any actual or proposed assignee or transferee, participant or nsub-participant of the partnership’s or Fund vehicles’ rights
or obligations to evaluate proposed transactions
● Facilitate
business asset transactions involving the Fund partnership or Fund-related vehicles
● Monitor communications to/from us using our systems
● Protect
the security and integrity of our information technology systems
● Protect
the security and safety of our buildings and locations where we operate
● Operate,
run and schedule online meetings, webinars and conferences (for example, using Zoom and other online meeting platforms)
● Manage
our financing arrangements with our financiers and financing transaction counterparties, including payment providers, intermediaries,
and correspondent / agent banks
● Monitor
the operation of Fund distribution platforms, where these are operated by third parties or service providers
We only rely on these interests where we have considered that, on balance,
the legitimate interests are not overridden by your interests, fundamental rights or freedoms. |
Monitoring
as described in ‘Legitimate Interests’ above
We
monitor communications where the law requires us to do so. We will also monitor where we are required to do so to comply with
regulatory rules and practices and, where we are permitted to do so, to protect our business and the security of our systems.
| Semi-Annual Report | June
30, 2024 |
111 |
| Blackstone Credit &
Insurance Funds |
Privacy Procedures |
June
30, 2024 (Unaudited)
Who
we share your personal data with
We
may share your Personal Data as follows:
| Who |
Why |
| Fund Associates |
We share your Personal Data with our associates, related
parties and members of our group. This is:
● To
manage our relationship with you
● For
the legitimate interests of a third party in carrying out anti-money laundering, ‘know your
client’, and other compliance checks required of them under applicable laws and regulations
● For
the purposes set out in this Data Privacy Notice |
|
Fund
Managers, Depositories, Administrators, Custodians, Distributors,
Investment Advisers |
● Delivering
the services you require
● Managing
your investment
● Supporting
and administering investment-related activities
● Complying
with applicable investment, anti-money laundering and other laws and regulations |
| Tax Authorities |
● To
comply with applicable laws and regulations
● Where
required or requested by tax authorities in the territory in which you are located or domiciled (in particular, Cayman Island or UK/EEA
tax authorities) who, in turn, may share your Personal Data with foreign tax authorities
● Where
required or requested by foreign tax authorities, including outside of the territory in which you are located or domiciled (including
outside the Cayman Islands or UK/EEA) |
| Service Providers |
● Delivering
and facilitating the services needed to support our business relationship with you (including cloud services)
● Supporting
and administering investment-related activities
● Where
disclosure to the service provider is considered necessary to support Blackstone with the purposes described in section 5 of this Data
Privacy Notice |
| Financing Counterparties, Lenders, Correspondent and Agent Banks |
● Assisting
these transaction counterparties with regulatory checks, such as ‘know your client’, and anti-money
laundering procedures
● Sourcing
credit for Fund-related entities in the course of our transactions and fund life cycles |
| Our Lawyers, Auditors and other Professional Advisers |
● Providing
you with investment-related services
● To
comply with applicable legal and regulatory requirements
● Supporting
Blackstone with the purposes described in section 5 of this Data Privacy Notice |
In
exceptional circumstances, we will share your Personal Data with:
| ● | Competent
regulatory, prosecuting and other governmental agencies or litigation counterparties, in a country or territory; and |
| ● | Other
organizations and agencies – where we are required to do so by law. |
| 112 |
www.blackstone-credit.com |
| Blackstone Credit & Insurance
Funds |
Privacy
Procedures |
June
30, 2024 (Unaudited)
Do
you have to provide us with this personal data?
Where
we collect Personal Data from you, we will indicate if:
| ● | Provision
of the Personal Data is necessary for our compliance with a legal obligation; or |
| ● | It
is purely voluntary and there are no implications for you if you do not wish to provide us with it. |
Unless
otherwise indicated, you should assume that we require the Personal Data for business and/or compliance purposes.
Some
of the Personal Data that we request is necessary for us to perform our contract with you and if you do not wish to provide us
with this Personal Data, it will affect our ability to provide our services to you and manage your investment.
Sending
your personal data internationally
We
may transfer your Personal Data between different countries to recipients in countries other than the country in which the information
was originally collected (including to our affiliates and group members, members of the Fund’s partnership, transaction
counterparties, and third-party service providers). Where you are based in the UK, the EU, or another country which imposes data
transfer restrictions outside of its territory, this includes transfers outside of the UK and the European Economic Area (“EEA”)
or that geographical area, to those countries in which our affiliates, group members, service providers and business partners
operate. Those countries may not have the same data protection laws as the country in which you initially provided the information.
Where
we transfer Personal Data outside of the UK, the EEA, or other territories subject to data transfer restrictions to other members
of our group, our service providers or another third party recipient, we will ensure that our arrangements with them are governed
by data transfer agreements or appropriate safeguards, designed to ensure that your Personal Data is protected as required under
applicable data protection law (including, where appropriate, under an agreement on terms approved for this purpose by the European
Commission or by obtaining your consent).
Please
contact us if you would like to know more about these agreements or receive a copy of them. Please see the ‘Contact Us’
section for details.
Consent
– and your right to withdraw it
Except
as may otherwise be required by local law, we do not generally rely on obtaining your consent to process your Personal Data. In
particular, we do not generally rely on obtaining your consent where our processing of your Personal Data is subject only to the
data protection laws of the UK/EEA (in these circumstances we will usually rely on another legal basis more appropriate in the
circumstances, including those set out in “Why do we process your Personal Data?” above). If we do rely on consent
for processing of your Personal Data, you have the right to withdraw this consent at any time. Please contact us or send us an
e-mail at PrivacyQueries@Blackstone.com at any time if you wish to do so.
Where
required by applicable law, we will obtain your consent for the processing of your Personal Data for direct marketing purposes.
If you do receive direct marketing communications from us (for example, by post, e-mail, fax or telephone), you may opt-out by
clicking the link in the relevant communication, completing the forms provided to you (where relevant), or by contacting us (see
the ‘Contact Us’ section for details).
Retention
and deletion of your personal data
We
keep your Personal Data for as long as it is required by us for our legitimate business purposes, to perform our contractual obligations
or, where longer, such longer period as is required or permitted by law or regulatory obligations which apply to us. We will generally:
| ● | Retain
Personal Data about you throughout the life cycle of any investment you are involved in; and |
| ● | Retain
some Personal Data after your relationship with us ends. |
As
a general principle, we do not retain your Personal Data for longer than we need it. We will usually delete your Personal Data
(at the latest) after you cease to be an investor in any fund and there is no longer any legal / regulatory requirement, or business
purpose, for retaining your Personal Data.
| Semi-Annual Report | June
30, 2024 |
113 |
| Blackstone Credit & Insurance
Funds |
Privacy
Procedures |
June
30, 2024 (Unaudited)
Your
rights
You
may, subject to certain limitations, have data protection rights depending on the data protection laws that apply to our processing
of your Personal Data, including the right to:
| ● | Access
your Personal Data |
| ● | Restrict
the use of your Personal Data in certain circumstances |
| ● | Have incomplete
or inaccurate Personal Data corrected |
| ● | Ask
us to stop processing your Personal Data |
| ● | Require
us to delete your Personal Data in some limited circumstances |
You
also have the right in some circumstances to request us to “port” your Personal Data in a portable, re-usable format
to other organizations (where this is possible).
We
review and verify requests to protect your Personal Data, and will action data protection requests fairly and in accordance with
applicable data protection laws and principles.
If
you wish to exercise any of these rights, please see the ‘Contact Us’ section for details.
Concerns
or queries
We
take your concerns very seriously. We encourage you to bring to our attention any concerns you have about our processing of your
Personal Data. This Data Privacy Notice was drafted with simplicity and clarity in mind. We are, of course, happy to provide any
further information or explanation needed. Please see the ‘Contact Us’ section for details.
Please
also contact us via any of the contact methods listed below if you have a disability and require an alternative format of this
Data Privacy Notice.
If
you want to make a complaint, you can also contact the body regulating data protection in your country, where you live or work,
or the location where the data protection issue arose. In particular:
| Country |
Supervisory
Authority |
| Cayman
Islands |
Cayman
Islands Ombudsman (available at: https://ombudsman.ky) |
| European Union |
A
list of the EU data protection authorities and contact details is available by clicking this link:
http://ec.europa.eu/newsroom/article29/item-detail.cfm?item_id=612080 |
| United
Kingdom |
Information
Commissioner’s Office (available at: https://ico.org.uk/global/contact-us/) |
| 114 |
www.blackstone-credit.com |
| Blackstone Credit & Insurance
Funds |
Privacy
Procedures |
June
30, 2024 (Unaudited)
Contact
us
Please
contact us if you have any questions about this Data Privacy Notice or the Personal Data we hold about you.
Contact us by e-mail
or access our web form by e-mailing PrivacyQueries@Blackstone.com.
Contact
us in writing using this address:
| Address |
For
EU/UK related queries:
40
Berkeley Square, London, W1J 5AL, United Kingdom
All
other queries:
345
Park Avenue, New York, NY 10154 |
A
list of country specific addresses and contacts for locations where we operate is available at
https://privacy.blackstone.com/visitors-online-privacy-notice/#appendixA
Changes
to this data privacy notice
We
keep this Data Privacy Notice under regular review. Please check regularly for any updates at our investor portal (www.bxaccess.com).
| Semi-Annual Report | June
30, 2024 |
115 |
| Blackstone
Credit & Insurance Funds |
Approval
of Investment Advisory Agreement |
June
30, 2024 (Unaudited)
The
Investment Company Act of 1940, as amended (the “1940 Act”), requires that the Board of Trustees (collectively, the
“Board”) of each of Blackstone Senior Floating Rate Term 2027 Term Fund (“BSL”), Blackstone Long-Short
Credit Income Fund (“BGX”), and Blackstone Strategic Credit 2027 Term Fund (“BGB,” and together with BSL
and BGX, the “Funds” and each a “Fund”), including a majority of its members who are not considered to
be “interested persons” under the 1940 Act (the “Independent Trustees”) voting separately, approve on
an annual basis the continuation of the Fund’s investment advisory agreement (each, an “Agreement” and collectively,
the “Agreements”) with the Fund’s investment adviser, Blackstone Liquid Credit Strategies LLC (the “Adviser”).
At a joint meeting (the “Contract Renewal Meeting”) held in person on May 30, 2024, the Board, including the Independent
Trustees, considered, and unanimously approved, the continuation of each Agreement for an additional one-year term. To assist
in its consideration, prior to the Contract Renewal Meeting, the Independent Trustees, through their Independent Legal Counsel
(“Independent Counsel”) had requested, received and considered a variety of information, including information provided
in response to a supplemental request (together with the information provided at the Contract Renewal Meeting, the “Contract
Renewal Information”) about the Adviser, as well as the advisory arrangements for the Funds, certain portions of which are
discussed below. In preparation for the Contract Renewal Meeting, the Independent Trustees met in person in a private session
with their Independent Counsel (the “Review Session”) prior to the Contract Renewal Meeting to review the Contract
Renewal Information. No representatives of the Funds, the Adviser, or Fund management were present at the Review Session. In addition
to the Contract Renewal Information, the Board received performance and other information since each Fund’s inception related
to the services the Adviser renders to each Fund. The Board’s evaluation took into account such information and also reflected
the knowledge and familiarity gained as members of the Board with respect to the investment advisory and other services the Adviser
provides to each Fund under that Fund’s Agreement.
Board
Approval of the Continuation of the Agreements
In
its deliberations regarding renewal of each Agreement, the Board, including the Independent Trustees, considered various factors,
including those set forth below.
Nature,
Extent and Quality of the Services Provided to the Funds under the Agreements
The
Board received and considered Contract Renewal Information regarding the nature, extent and quality of services the Adviser provides
to the Funds under the Agreements. Specifically, the Board took into account the fact that the Adviser has a large and knowledgeable
investment team, with one of the largest credit teams in the United States and globally, and has expanded its team and resources.
The Adviser also reviewed with the Board its investment process, as well as its infrastructure and operational teams that serve
the Funds.
The
Board also reviewed Contract Renewal Information regarding the Adviser’s compliance policies and procedures established
pursuant to the 1940 Act and considered the compliance record for the Adviser and each Fund during the previous year and since
its inception.
The
Board reviewed the qualifications, backgrounds and responsibilities of the Funds’ senior personnel and the portfolio management
team primarily responsible for the day-to-day portfolio management of each Fund. The Board also considered, based on its knowledge
of the Adviser and its affiliates, the Contract Renewal Information and the Board’s discussions with the Adviser at the
Contract Renewal Meeting, the general reputation and investment performance records of the Adviser and certain of its affiliates
and the financial resources of the corporate parent of the Adviser, Blackstone Inc., available to support the Adviser’s
activities in respect of the Funds.
The
Board considered the responsibilities of the Adviser under each Fund’s Agreement, including the Adviser’s coordination
and oversight of the services other unaffiliated parties provided to the Fund.
In
reaching its determinations regarding continuation of each Fund’s Agreement, the Board took into account that the Funds’
shareholders, in pursuing their investment goals and objectives, likely considered the reputation and the investment style, philosophy
and strategy of the Adviser, as well as the resources available to the Adviser, in purchasing their shares.
Fund
Performance
Among
other things, the Board received and considered information and analyses (the “Broadridge Performance Information”)
comparing the performance of each Fund with a group of funds (the “Peer Group”) selected by Broadridge Financial Solutions
(“Broadridge”), an independent provider of investment company data, primarily from the Morningstar US Bank Loan Closed-End
Fund classification (the “Morningstar Classification of Bank Loan”), which consists of 27 closed-end funds. Broadridge
selected the Peer Group funds primarily from the Morningstar Classification of Bank Loan to be as comparable as possible to the
Funds based upon its consideration of the constituent funds’ investment style, share class characterization, and assets.
The Board was provided with a description of the methodology Broadridge used to select each Fund’s Peer Group. On May 15,
2024, each of the members of the Board participated in a video conference call with Broadridge regarding the Broadridge Performance
Information, including its peer grouping methodology and reporting format. Representatives of the Adviser also participated in
that call. The Board noted Broadridge’s view that the relatively limited number of closed-end funds compared to the open-end
fund universe creates limitations on peer grouping as compared to certain open-end funds.
| 116 |
www.blackstone-credit.com |
| Blackstone
Credit & Insurance Funds |
Approval
of Investment Advisory Agreement |
June
30, 2024 (Unaudited)
The
Peer Group for BSL consisted of eight funds, including BSL, for each of the 1-, 3-, 5- and 10-year periods ended March 31, 2024
(such periods being hereinafter called the “1- year period”, the “3- year period”, the “5- year
period” and the “10- year period,” respectively) with an emphasis on strategies that have high net historical
portfolio allocations to bank loans. The Peer Groups for BGX and BGB were the same, which consisted of nine funds, including both
BGX and BGB, for each of the 1-, 3-, 5- year and 10-year periods. The Peer Group for BGX and BGB included funds with historical
portfolio allocations to bank loans higher than 20% and allocations to high-yield bonds. Most Peer Group funds, similar to BGX
and BGB, had a majority of their assets allocated to bank loans, while one Peer Group fund had less than 50% of their assets allocated
to bank loans. Broadridge included funds from outside the Morningstar Classification of Bank Loan with portfolio allocations to
bank loans higher than 20% in the Peer Group for BGX and BGB. The Board noted that it had received and discussed with the Adviser
information at periodic intervals since each Fund’s inception comparing such Fund’s performance against its benchmarks
and its Peer Group funds at that time. The Board also noted that it also had received the return volatility and Sharpe ratio (a
measure of risk-weighted return) of each Fund relative to its Peer Group funds. The performance discussion below focuses on the
comparison of the Funds’ performance relative to the respective Peer Group, rather than to the broader Morningstar Classification
of Bank Loan.
BSL
The
Broadridge Performance Information comparing BSL’s performance to that of its Peer Group based on net asset value
(“NAV”) per share showed, among other things, that BSL’s returns, measured on a gross return basis, ranked
third out of eight among its Peer Group funds for the 1-year period; ranked fourth among its Peer Group funds for the 3-year
period; ranked second among its Peer Group funds for the 5-year period; and ranked second among its Peer Group funds for the
10- year period.1 BSL’s returns, measured on a net return basis ranked third among its Peer Group funds for
the 1-year period; ranked seventh among its Peer Group funds for the 3-year period; ranked fourth among its Peer Group funds
for the 5-year period; and ranked fifth among its Peer Group funds for the 10-year period. Whether measured on a gross or net
return basis, BSL’s returns were higher than the Peer Group median performance for the 1- and 5-year periods, and
BSL’s gross returns were higher than the Peer Group median performance for each of the 1-, 3-, 5- and 10-year periods,
but were lower than the Peer Group median performance with respect to net returns for each of the 3- and 10-year periods. The
Board also considered BSL’s performance relative to its benchmark and in absolute terms. The Broadridge Performance
Information showed that, measured on a gross and net return basis, BSL outperformed its benchmark for each of the 1- and
10-year periods. The Broadridge Performance Information noted that on an annualized trailing, gross return basis, BSL’s
1-, 3-, 5- and 10-year returns outperformed its Peer Group median, classification median and benchmark. On a gross return
basis, BSL’s Sharpe ratio ranked third, fourth, fourth and fifth among its Peer Group funds, respectively, for the 1-,
3-, 5- and 10-year periods. On a net return basis, BSL’s Sharpe ratio ranked second, seventh, sixth and seventh,
respectively, among its Peer Group funds for the 1-, 3-, 5- and 10-year periods.
BGX
The
Broadridge Performance Information comparing BGX’s performance to that of the Peer Group based on NAV per share showed,
among other things, that BGX’s returns, measured on a gross return basis, ranked sixth out of nine among its Peer Group
funds for the 1-year period; ranked eighth among its Peer Group funds for the 3-year period; and ranked fourth among its Peer
Group funds for the 5- and 10-year periods. BGX’s returns, measured on a net return basis, ranked fifth among its Peer Group
funds for the 1-year period; ranked eighth among its Peer Group funds for the 3-year period; ranked seventh among its Peer Group
funds for the 5-year period; and ranked sixth among its Peer Group funds for the 10-year period. The Fund’s gross returns
were higher than the Peer Group median return for the 5- and 10-year periods, while the Fund’s gross returns were lower
than the Peer Group median return for the 1- and 3-year periods. The Fund’s net returns were higher than the Peer Group
median return for the 1-year period, while the Fund’s net returns were lower than the Peer Group median return for the 3-,
5- and 10-year periods. The Board also considered BGX’s performance relative to its benchmark and in absolute terms. The
Broadridge Performance Information noted that BGX on a gross return basis outperformed its Peer Group and classification medians
and benchmark for each of the 5-, and 10-year periods. On a gross return basis, BGX’s Sharpe ratio ranked fourth, seventh,
seventh and seventh among its Peer Group funds, respectively, for the 1-, 3-, 5- and 10- year periods. On a net return basis,
BGX’s Sharpe ratio ranked seventh, seventh, eighth and eighth, respectively, among its Peer Group funds for the 1-, 3-,
5- and 10- year periods.
BGB
The
Broadridge Performance Information comparing BGB’s performance to that of the Peer Group based on NAV per share
showed, among other things, that BGB’s returns, measured on a gross return basis, ranked fourth out of nine among its
Peer Group funds for the 1-year period; ranked sixth among its Peer Group funds for the 3- and 10-year periods; and ranked
seventh among its Peer Group funds for the 5-year period. BGB’s returns, measured on a net return basis, ranked sixth
among its Peer Group funds for the 1-year period and ranked last among its Peer Group funds for the each of the 3-, 5- and
10- year periods. The Fund’s returns on both a gross and net return basis were lower than the Peer Group median
performance for each of the 3-, 5- and 10-year periods, and the Fund’s gross returns were higher than the Peer Group
median return in the 1-year period, but the Fund’s net returns were below the Peer Group median return for the 1-year
period. The Board also considered BGB’s performance relative to its benchmark and in absolute terms. The Broadridge
Performance Information showed that on a gross return basis, BGB’s Sharpe ratio ranked seventh, sixth, eighth and
eighth among its Peer Group funds, respectively, for the 1-, 3-, 5- and 10-year periods. On a net return basis, BGB’s
Sharpe ratio ranked last among the Peer Group funds for each of the 1-, 3-, 5- and 10-year periods.
| 1 | First
in these performance rankings represents the fund with the best returns in the Peer Group,
and last in these performance rankings represents the fund with the worst returns in
the Peer Group, whether measured on a gross or net return basis. |
| Semi-Annual
Report | June 30, 2024 |
117 |
| Blackstone
Credit & Insurance Funds |
Approval
of Investment Advisory Agreement |
June
30, 2024 (Unaudited)
In
assessing Fund performance, the Adviser noted that the small number and varying investment strategies of funds in the Peer Groups
for BSL, BGX and BGB made meaningful performance comparisons challenging. Broadridge itself noted that the relatively limited
number of closed-end funds compared to open-end funds poses particular challenges for peer grouping. The Adviser also noted the
particular limitations of the BGX and BGB Peer Groups, highlighting the wide range of investment strategies employed and returns
achieved by funds in those Peer Groups (relative to the BSL Peer Group). In addition to the Broadridge Performance Information,
the Board considered information provided by the Adviser regarding the Funds and the Morningstar Classification of Bank Loan and
their respective Peer Groups as to differences in each Fund’s portfolio composition by asset class, credit rating, investment
size, and other relevant metrics.
The
Board also took into account the credit review and other processes employed by the Adviser in managing the Funds’ investment
portfolios, including that the Adviser utilizes a highly disciplined and repeatable investment approach with respect to the Funds.
Based on its review and considering other relevant factors, including those noted above, the Board concluded that the Funds’
performance was acceptable.
Management
Fees and Expenses
The
Board reviewed and considered the investment advisory fee (the “Advisory Fee”) payable by each Fund to the Adviser
under its respective Agreement in light of the nature, extent and overall quality of the investment advisory and other services
the Adviser provides to such Fund.
Additionally,
the Board received and considered information and analyses that Broadridge prepared (the “Broadridge Expense Information”),
comparing, among other things, the Advisory Fee for each Fund and each Fund’s overall expenses with corresponding information
contained in the Morningstar Classification of Bank Loan and each Fund’s Peer Group. The comparison was based upon information
as of the constituent funds’ latest fiscal years. The discussion below focuses on the Funds’ expenses relative to
their respective Peer Groups, rather than to the broader Morningstar Classification of Bank Loan.
BSL
The
eight funds in BSL’s Peer Group had average common share net assets ranging from $106.33 million to $751.03 million. Five
of the other funds in the Peer Group were larger than BSL and two were smaller. The Broadridge Expense Information—which
compared BSL’s actual total expenses to the Peer Group—showed, among other things, that the Fund’s actual Advisory
Fee (i.e., giving effect to any voluntary fee waivers implemented by the Adviser with respect to the Fund and by the managers
of the other Peer Group funds) as compared on the basis of common share net assets, ranked sixth among the eight funds in the
Peer Group and was higher (i.e., worse) than the Peer Group median for that expense component. The Board noted that BSL’s
actual advisory fee was closer to the average for managers with smaller fixed income retail platforms. The Fund’s actual
total expenses, compared on the basis of common share net assets, ranked seventh among the funds in the Peer Group and were lower
than the Peer Group median for that expense component.
BGX
The
nine funds in BGX’s Peer Group (which was the same as BGB’s Peer Group and included BGB) had average common share
net assets ranging from $124.00 million to $751.03 million. Seven of the other funds in the Peer Group were larger than BGX and
one was smaller. The Broadridge Expense Information—which compared BGX’s actual total expenses to those of the Fund’s
Peer Group—showed, among other things, that the Fund’s actual Advisory Fee as compared on the basis of common share
net assets, ranked fourth among the funds in the Peer Group and was lower (i.e., better) than the Peer Group median for that expense
component. The Fund’s actual total expenses, compared on the basis of common share net assets, tied for fifth in rank among
the funds in the Peer Group and were higher than the Peer Group median for that expense component.
BGB
The
nine funds in BGB’s Peer Group (which was the same as BGX’s Peer Group and included BGX) had average common share
net assets ranging from $124.00 million to $751.03 million. One of the other funds in the Peer Group was larger than BGB and seven
were smaller. The Broadridge Expense Information—which compared BGB’s actual total expenses to those of the Fund’s
Peer Group—showed, among other things, that the Fund’s actual Advisory Fee as compared on the basis of common share
net assets, ranked seventh among the funds in the Peer Group and was higher (i.e., worse) than the Peer Group median for that
expense component. The Board noted that BGB’s actual advisory fee was closer to the average for managers with smaller fixed
income retail platforms. The Fund’s actual total expenses, compared on the basis of common share net assets, tied for sixth
in rank among the funds in the Peer Group and were higher than the Peer Group median for that expense component.
| 118 |
www.blackstone-credit.com |
| Blackstone
Credit & Insurance Funds |
Approval
of Investment Advisory Agreement |
June
30, 2024 (Unaudited)
The
Board took into account that Broadridge Expense Information indicated that the gross expense ratios of BSL, BGX and BGB increased
year-over-year. The Board also noted that the allocation of non- compensation expenses to the Funds increased year-over-year,
while the allocation of compensation expenses to the Funds decreased year-over-year.
In
its evaluation of the Advisory Fee and the Broadridge Expense Information for each Fund, the Board took into account the complexity
of each Fund’s investment program and the credit review and other processes the Adviser employs in managing the Funds’
investment portfolios, including how the Adviser’s standing and reputation in the leveraged finance market and the strength
of its trading and middle office and risk management support teams is beneficial to the Funds. The Board noted that the Advisory
Fee for each of BSL, BGX and BGB were slightly lower year-over-year. The Board further noted that the relatively limited number
of closed-end funds compared to the open-end fund universe makes concise peer grouping comparisons challenging. The Board considered
the Adviser’s belief that in making such peer comparisons, smaller funds, such as BSL and BGX, may be disadvantaged versus
larger funds that have greater opportunities for economies of scale.
The
Board also considered Contract Renewal Information regarding fees (including sub-advisory fees) charged by the Adviser to other
U.S. clients investing primarily in an asset class similar to that of the Funds, including, where applicable, institutional commingled
funds and exchange-traded funds. The Board was advised that the base fees paid by such institutional and other clients generally
are lower, and may be significantly lower, than the Advisory Fee for any one Fund. The Contract Renewal Information discussed
the significant differences in scope of services provided to the Funds as compared to these other clients, noting that the Funds
are subject to heightened regulatory requirements relative to institutional clients; that the Funds require additional resources
for administration; and that the Adviser manages the leverage arrangements of the Funds and coordinates and oversees the provision
of services to the Funds by other fund service providers. The Board considered the fee comparisons in light of the different services
provided in managing these other types of clients and funds.
Taking
all of the above into consideration, the Board determined that the Advisory Fee for each Fund was reasonable in light of the nature,
extent and overall quality of the investment advisory and other services provided to such Fund under its Agreement.
Profitability
The
Board, as part of the Contract Renewal Information, received an analysis of the profitability to the Adviser and its affiliates
in providing services to each Fund for each of the past two fiscal years, as well as a description of the methodology by which
the Adviser calculates that profitability and any changes in the methodology since the prior year. In addition, the Board received
Contract Renewal Information with respect to the Adviser’s revenue and cost allocation methodologies it used in preparing
such profitability data. The Board agreed that the Adviser’s profitability in providing investment advisory and other services
to each Fund was not excessive in light of the nature, extent and overall quality of such services.
Economies
of Scale
The
Board received Contract Renewal Information concerning whether the Adviser would realize economies of scale if the Funds’
assets grow. The Board noted that BGB currently does not have any plans to seek additional assets beyond maintaining its dividend
reinvestment plan; therefore, any significant growth in its assets generally will occur through appreciation in the value of the
Fund’s investment portfolio, rather than sales of additional shares in the Fund. The Board further noted that BGX and BSL
were currently in the same circumstance, except that either could engage in an at-the-market offering to raise additional capital.
The Board determined that for each Fund, to the extent economies of scale may be realized by the Adviser, the benefits of such
economies of scale would be shared with the Fund and its shareholders as the Fund grows.
Other
Benefits to the Adviser
The
Board considered other benefits the Adviser and its affiliates receive as a result of the Adviser’s relationship with each
of the Funds and did not regard such benefits as excessive.
*
* * * *
In
light of all of the foregoing and other relevant factors, the Board determined that, under the circumstances, continuation of
each Fund’s Agreement would be in the interests of the Fund and its shareholders and unanimously voted to continue the Agreement
for a period of one additional year.
The
Board did not identify any single factor it reviewed as being the principal factor in determining whether to approve continuation
of each Agreement for the next year, and each Board member attributed different weights to the various factors. The Independent
Trustees were advised by their Independent Counsel throughout the process. Prior to the Review Session and the Contract Renewal
Meeting, the Independent Trustees received a memorandum as to their responsibilities from their Independent Counsel. Prior to
voting, the Independent Trustees discussed the proposed continuation of the Agreements in a private session with their Independent
Counsel at which no representatives of the Adviser or Fund management were present.
| Semi-Annual
Report | June 30, 2024 |
119 |
| Blackstone
Credit & Insurance Funds |
Trustees
& Officers |
June
30, 2024 (Unaudited)
The
overall management of the business and affairs of the Funds, including oversight of the Adviser, is vested in the Board. The Board
is classified into three classes—Class I, Class II and Class III—as nearly equal in number as reasonably possible,
with the Trustees in each class to hold office until their successors are elected and qualified. At each succeeding annual meeting
of shareholders, the successors to the class of Trustees whose terms expire at that meeting shall be elected to hold office for
terms expiring at the later of the annual meeting of shareholders held in the third year following the year of their election
or the election and qualification of their successors. The Funds’ executive officers were appointed by the Board to hold
office until removed or replaced by the Board or until their respective successors are duly elected and qualified.
Below
is a list of the Trustees and officers of the Funds and their present positions and principal occupations during the past five
years. The business address of the Funds, the Adviser, the Trustees and the Funds’ officers is 345 Park Avenue, 31st Floor,
New York, NY 10154, unless specified otherwise below. The SAI includes additional information about the board members and is available,
without charge, upon request. Shareholders may call (888) 756-8443 or email BlackstoneShareholderRelations@Blackstone.com to request
the SAI.
NON-INTERESTED
TRUSTEES
|
|
|
|
|
|
| Name,
Address and Year of Birth(1) |
Position(s)
Held with the Funds |
Term
of Office and Length of Time Served |
Principal
Occupation(s) During the Past Five Years |
Number
of Portfolios in Fund Complex(2) Overseen by Trustee |
Other
Directorships Held by the Trustee During the Past Five Years |
Jane
M. Siebels
Birth
Year: 1960 |
Lead
Independent Trustee and member of Audit and Nominating and Governance Committees |
Trustee
Since:
BSL:
November 2021
BGX:
November 2021
BGB:
November 2021
Term
Expires:
BSL:
2026
BGX:
2026
BGB:
2026 |
Ms.
Siebels was formerly a Consultant at Per4M and advises a small global equity hedge fund. Currently, she is the CEO of Homer
Technology. Prior to 2019, she was CEO and CIO of Amber Asset Management, f/k/a Green Cay Asset Management. |
4 |
Scotia
Bank (Bahamas); Scotia Bank International (Bahamas); Scotia Trust (Bahamas); First Trust Bank (Bahamas); Global Innovation
Fund; Amber Asset Management (until 2019) |
Edward
H. D'Alelio
Birth
Year: 1952 |
Trustee
Member of Audit and Nominating and Governance Committees |
Trustee
Since:
BSL:
April 2010
BGX:
November 2010
BGB:
May 2012
Term
Expires:
BSL:
2026
BGX:
2026
BGB:
2026 |
Mr.
D'Alelio was formerly a Managing Director and CIO for Fixed Income at Putnam Investments, Boston where he retired in 2002.
He currently is an Executive in Residence with the School of Management, Univ. of Mass Boston. |
4 |
Owl
Rock Capital Corp. business development companies (“BDCs”) (7 portfolios overseen in Fund Complex) |
Thomas
W. Jasper
Birth
Year: 1948 |
Trustee,
Chairman of Audit Committee and member of Nominating and Governance Committee |
Trustee
Since:
BSL:
April 2010
BGX:
November 2010
BGB:
May 2012
Term
Expires:
BSL:
2027
BGX:
2027
BGB:
2027 |
Mr.
Jasper is the Managing Partner of Manursing Partners LLC, a consulting firm. |
4 |
Sisecam
Resources LP (formerly, Ciner Resources LP) (master limited partnership) (until 2023) |
Gary
S. Schpero
Birth
Year: 1953 |
Trustee,
Chairman of Nominating and Governance Committee and member of Audit Committee |
Trustee
Since:
BSL:
May 2012
BGX:
May 2012
BGB:
May 2012
Term
Expires:
BSL:
2027
BGX:
2027
BGB:
2027 |
Mr.
Schpero is retired. Prior to January 2000, he was a partner at the law firm of Simpson Thacher & Bartlett LLP where he
served as managing partner of the Investment Management and Investment Company Practice Group. |
4 |
EQ
Advisors Trust; 1290 Funds |
| 120 |
www.blackstone-credit.com |
| Blackstone
Credit & Insurance Funds |
Trustees
& Officers |
June
30, 2024 (Unaudited)
INTERESTED
TRUSTEE(3)
| Name,
Address and Year of Birth(1) |
Position(s)
Held with the Funds |
Term
of Office and Length of Time Served |
Principal
Occupation(s) During the Past Five Years |
Number
of Portfolios in Fund Complex(2) Overseen by Trustee |
Other
Directorships Held by the Trustee During the Past Five Years |
Robert
Zable (4)
Birth
Year: 1972 |
Chairman
of the Board, President, Chief Executive Officer, Trustee |
Trustee
Since:
BSL:
January 2024
BGX:
January 2024
BGB:
January 2024
Term
Expires:
BSL:
2025
BGX:
2025
BGB:
2025 |
Mr.
Zable is the Global Head of Liquid Credit Strategies within Blackstone Credit and Insurance. In his role, Mr. Zable oversees
the firm's liquid credit activities, including CLO management, CLO investing, senior loans, multi-asset credit, investment
grade and high yield bonds. Prior to joining Blackstone Credit in 2007, Mr. Zable began his career at JP Morgan Securities
Inc., where he focused on leveraged finance in New York and London. |
4 |
None |
| Semi-Annual Report | June
30, 2024 |
121 |
| Blackstone
Credit & Insurance Funds |
Trustees
& Officers |
June
30, 2024 (Unaudited)
OFFICERS
| Name,
Address and Year of Birth(1) |
Position(s)
Held with the Funds |
Term
of Office and Length of Time Served |
Principal
Occupation During the Past Five Years |
Robert
Zable (4)
Birth
Year: 1972 |
Chairman
of the Board, President, Chief Executive Officer, Trustee |
Officer
Since:
BSL:
September 2015
BGX:
September 2015
BGB:
September 2015 |
Mr.
Zable is the Global Head of Liquid Credit Strategies within Blackstone Credit and Insurance. In his role, Mr. Zable oversees
the firm's liquid credit activities, including CLO management, CLO investing, senior loans, multi-asset credit, investment
grade and high yield bonds. Prior to joining Blackstone Credit in 2007, Mr. Zable began his career at JP Morgan Securities
Inc., where he focused on leveraged finance in New York and London. |
Gregory
Roppa
Birth
Year: 1976 |
Chief
Financial Officer and Treasurer |
Officer
Since:
BSL:
March 2022
BGX:
March 2022
BGB:
March 2022
Term
of Office:
Indefinite |
Mr.
Roppa is a Managing Director in the Global Fund Finance group of Blackstone, where he focuses on the accounting and financial
reporting for certain entities within Blackstone Credit & Insurance, and Real Estate businesses. Before joining Blackstone
in 2019, Mr. Roppa was the Director of Operations and Fund Accounting for Clinton Group Inc., an alternative asset management
firm. |
Robert
Post
Birth
Year: 1989 |
Executive
Vice President and Assistant Secretary |
Officer
Since:
BSL:
January 2024
BGX:
January 2024
BGB:
January 2024
Term
of Office:
Indefinite |
Mr.
Post is a Managing Director and the Head of U.S. CLO Management for Blackstone Credit & Insurance. Mr. Post is also a
Portfolio Manager of the U.S. closed-end funds. Before joining Blackstone in 2017, Mr. Post was a Junior Portfolio Manager
at BlackRock, where his responsibilities included various leveraged loan and high yield mandates. |
Marisa
Beeney
Birth
Year: 1970 |
Chief
Legal Officer and Secretary |
Officer
Since:
BSL:
April 2010
BGX:
November 2010
BGB:
May 2012
Term
of Office:
Indefinite |
Ms.
Beeney is a Senior Managing Director and General Counsel of Blackstone Credit & Insurance. Before joining Blackstone,
she was with the finance group of DLA Piper. |
William
Renahan
Birth
Year: 1969 |
Chief
Compliance Officer |
Officer
Since:
BSL:
September 2022
BGX:
September 2022
BGB:
September 2022
Term
of Office:
Indefinite |
Mr.
Renahan is a Managing Director in the Legal and Compliance group of Blackstone. Before joining Blackstone in 2022, he was
a Senior Managing Director and Chief Compliance Officer at Duff & Phelps Investment Management. |
Valerie
Naratil
Birth
Year: 1988 |
Public
Relations Officer |
Officer
Since:
BSL:
February 2021
BGX:
February 2021
BGB:
February 2021
Term
of Office:
Indefinite |
Ms.
Naratil is a Managing Director and a member of the Product Management team within Blackstone Credit & Insurance’s
Liquid Credit Strategies business. Before joining Blackstone Credit & Insurance in 2014, Ms. Naratil worked at UBS Investment
Bank, advising corporate clients across the Healthcare industry. |
| (1) | The
address of each Trustee/Nominee and Officer, unless otherwise noted, is Blackstone Alternative
Credit Advisors LP, 345 Park Avenue, 31st Floor, New York, NY 10154. |
| (2) | The
“Fund Complex” consists of the Blackstone Credit & Insurance Closed-End
Funds, Blackstone Secured Lending Fund, Blackstone Private Credit Fund, and Blackstone
Alternative Multi-Strategy Fund. |
| (3) | "Interested
person" of the Funds as defined in Section 2(a)(19) of the 1940 Act. Mr. Zable is
an interested person due to his employment with the Adviser. |
| (4) | Effective
December 31, 2023, Daniel H. Smith resigned from his positions as Trustee and Chairman
of the Board and as President and Chief Executive Officer of the Funds, and effective
January 1, 2024, the Board appointed Robert Zable to these positions. Also effective
December 31, 2023, Mr. Zable resigned from his positions as Executive Vice President
and Assistant Secretary of the Funds, and effective January 1, 2024, the Board appointed
Robert Post to these positions. |
| 122 |
www.blackstone-credit.com |
Page
Intentionally Left Blank
Not
applicable to this Report.
| Item 3. | Audit Committee Financial Expert. |
Not
applicable to this Report.
| Item 4. | Principal Accountant Fees and Services. |
Not
applicable to this Report.
| Item 5. |
Audit Committee of Listed Registrants. |
Not
applicable to this Report.
| (a) | Schedule
of Investments in securities of unaffiliated issuers as of the close of the reporting
period is included as part of the Report to Stockholders filed under Item 1(a) of this
Form N-CSR. |
| Item 7. |
Financial Statements and Financial Highlights for Open-End Management Investment Companies. |
Not
applicable to registrant.
| Item 8. |
Changes in and Disagreements with Accountants for
Open-End Management Investment Companies. |
Not
applicable to registrant.
| Item 9. |
Proxy Disclosures for Open-End Management Investment
Companies. |
Not
applicable to registrant.
| Item 10. |
Remuneration Paid to Directors, Officers, and Others
of Open-End Management Investment Companies. |
Not
applicable to registrant.
| Item 11. |
Statement Regarding Basis for Approval of Investment
Advisory Contract. |
See
Approval of Investment Advisory Agreement in Item 1(a).
Item
12. Disclosure of Proxy Voting Policies and Procedures for Closed-End Management Investment Companies.
Not
applicable to this Report.
Item
13. Portfolio Managers of Closed-End Management Investment Companies.
| (a) | Not
applicable to this Report. |
| (b) | As
of the date of this filing, there have been no changes in any of the portfolio managers
identified in the most recent annual report on Form N-CSR. |
Item
14. Purchases of Equity Securities by Closed-End Management Investment Company and Affiliated Purchasers.
None.
Item 15. Submission of Matters to a Vote of Security Holders.
There
have been no material changes to the procedures by which shareholders may recommend nominees to the registrant’s Board of
Trustees, where those changes were implemented after the registrant last provided disclosure in response to the requirements of
Item 407(c)(2)(iv) of Regulation S-K, or this Item.
Item
16. Controls and Procedures.
| (a) | The
registrant’s principal executive officer and principal financial officer have concluded
that the registrant’s disclosure controls and procedures (as defined in Rule 30a-3(c)
under the 1940 Act) are effective as of a date within 90 days of the filing date of this
Report, based on the evaluation of these controls and procedures required by Rule 30a-3(b)
under the 1940 Act and Rules 13a-15(b) or 15d-15(b) under the Securities Exchange Act
of 1934, as amended. |
| (b) | There
was no change in the registrant’s internal control over financial reporting (as
defined in Rule 30a-3(d) under the 1940 Act) that occurred during the period covered
by this Report that has materially affected, or is reasonably likely to materially affect,
the registrant’s internal control over financial reporting. |
Item
17. Disclosure of Securities Lending Activities for Closed-End Management Investment Companies.
| (a) | The
registrant did not engage in securities lending activities during its most recent fiscal
year. |
| (b) | The
registrant did not engage in any securities lending activity and no services were provided
by the securities lending agent to the registrant during its most recent fiscal year. |
Item
18. Recovery of Erroneously Awarded Compensation.
Item
19. Exhibits.
(a)(1)
Not applicable to this Report.
(a)(2)
Not applicable to this Report.
(a)(3) The certifications required by Rule 30a-2(a) under the 1940 Act, and Section 302 of the Sarbanes-Oxley Act of 2002 are attached hereto as Exhibit 99.Cert.
(a)(4)
Not applicable.
(a)(5)
Not applicable.
(b) The certifications by the registrant’s principal executive officer and principal financial officer, as required by Rule 30a-2(b) under the 1940 Act, and Section 906 of the Sarbanes-Oxley Act of 2002 are attached hereto as Exhibit 99.906Cert.
(c) Disclosure pursuant to Section 13(r) of the Securities Exchange Act of 1934, as amended, is attached hereto as Exhibit EX-99.IRANNOTICE.
SIGNATURES
Pursuant
to the requirements of the Securities Exchange Act of 1934 and the Investment Company Act of 1940, the Registrant has duly caused
this report to be signed on its behalf by the undersigned, thereunto duly authorized.
| Blackstone Strategic Credit 2027 Term Fund |
|
| |
|
|
| By: |
/s/ Robert Zable |
|
| |
Robert Zable (Principal Executive Officer) |
|
| |
President and Chief Executive Officer |
|
| |
|
|
| Date: |
September 6, 2024 |
|
| |
|
|
| By: |
/s/ Gregory Roppa |
|
| |
Gregory Roppa (Principal Financial Officer) |
|
| |
Treasurer and Chief Financial Officer |
|
| |
|
|
| Date: |
September 6, 2024 |
|
Pursuant
to the requirements of the Securities Exchange Act of 1934 and the Investment Company Act of 1940, this
report has been signed below by the following persons on behalf of the Registrant and in the capacities and on the dates indicated.
| Blackstone Strategic Credit 2027 Term Fund |
|
| |
|
|
| By: |
/s/ Robert Zable |
|
| |
Robert Zable (Principal Executive Officer) |
|
| |
President and Chief Executive Officer |
|
| |
|
|
| Date: |
September 6, 2024 |
|
| |
|
|
| By: |
/s/ Gregory Roppa |
|
| |
Gregory Roppa (Principal Financial Officer) |
|
| |
Treasurer and Chief Financial Officer |
|
| |
|
|
| Date: |
September 6, 2024 |
|
Exhibit
99.Cert
I,
Robert Zable, President and Chief Executive Officer of Blackstone Strategic Credit 2027 Term Fund (the “Registrant”),
certify that:
| 1. | I
have reviewed this report on Form N-CSR of the Registrant; |
| 2. | Based
on my knowledge, this report does not contain any untrue statement of a material fact
or omit to state a material fact necessary to make the statements made, in light of the
circumstances under which such statements were made, not misleading with respect to the
period covered by this report; |
| 3. | Based
on my knowledge, the financial statements, and other financial information included in
this report, fairly present in all material respects the financial condition, results
of operations, changes in net assets, and cash flows (if the financial statements are
required to include a statement of cash flows) of the Registrant as of, and for, the
periods presented in this report; |
| 4. | The
Registrant’s other certifying officer and I are responsible for establishing and
maintaining disclosure controls and procedures (as defined in Rule 30a-3(c) under the
Investment Company Act of 1940) and internal control over financial reporting (as defined
in Rule 30a-3(d) under the Investment Company Act of 1940) for the Registrant and have: |
| a. | Designed
such disclosure controls and procedures, or caused such disclosure controls and procedures
to be designed under our supervision, to ensure that material information relating to
the Registrant, including its consolidated subsidiaries, is made known to us by others
within those entities, particularly during the period in which this report is being prepared; |
| b. | Designed
such internal control over financial reporting, or caused such internal control over
financial reporting to be designed under our supervision, to provide reasonable assurance
regarding the reliability of financial reporting and the preparation of financial statements
for external purposes in accordance with generally accepted accounting principles; |
| c. | Evaluated
the effectiveness of the Registrant’s disclosure controls and procedures and presented
in this report our conclusions about the effectiveness of the disclosure controls and
procedures, as of a date within 90 days prior to the filing date of this report based
on such evaluation; and |
| d. | Disclosed
in this report any change in the Registrant’s internal control over financial reporting
that occurred during the period covered by this report that has materially affected,
or is reasonably likely to materially affect, the Registrant’s internal control
over financial reporting; and |
| 5. | The
Registrant’s other certifying officer and I have disclosed to the Registrant’s
auditors and the audit committee of the Registrant’s board of directors (or persons
performing the equivalent functions): |
| a. | All
significant deficiencies and material weaknesses in the design or operation of internal
control over financial reporting which are reasonably likely to adversely affect the
Registrant’s ability to record, process, summarize, and report financial information;
and |
| b. | Any
fraud, whether or not material, that involves management or other employees who have
a significant role in the Registrant’s internal control over financial reporting. |
| By: |
/s/ Robert
Zable |
|
| |
Robert Zable (Principal Executive Officer) |
|
| |
President and Chief Executive Officer |
|
| |
|
|
| Date: |
September 6, 2024 |
|
I,
Gregory Roppa, Treasurer and Chief Financial Officer of Blackstone Strategic Credit 2027 Term Fund (the “Registrant”),
certify that:
| 1. | I
have reviewed this report on Form N-CSR of the Registrant; |
| 2. | Based
on my knowledge, this report does not contain any untrue statement of a material fact
or omit to state a material fact necessary to make the statements made, in light of the
circumstances under which such statements were made, not misleading with respect to the
period covered by this report; |
| 3. | Based
on my knowledge, the financial statements, and other financial information included in
this report, fairly present in all material respects the financial condition, results
of operations, changes in net assets, and cash flows (if the financial statements are
required to include a statement of cash flows) of the Registrant as of, and for, the
periods presented in this report; |
| 4. | The
Registrant’s other certifying officer and I are responsible for establishing and
maintaining disclosure controls and procedures (as defined in Rule 30a-3(c) under the
Investment Company Act of 1940) and internal control over financial reporting (as defined
in Rule 30a-3(d) under the Investment Company Act of 1940) for the Registrant and have: |
| a. | Designed
such disclosure controls and procedures, or caused such disclosure controls and procedures
to be designed under our supervision, to ensure that material information relating to
the Registrant, including its consolidated subsidiaries, is made known to us by others
within those entities, particularly during the period in which this report is being prepared; |
| b. | Designed
such internal control over financial reporting, or caused such internal control over
financial reporting to be designed under our supervision, to provide reasonable assurance
regarding the reliability of financial reporting and the preparation of financial statements
for external purposes in accordance with generally accepted accounting principles; |
| c. | Evaluated
the effectiveness of the Registrant’s disclosure controls and procedures and presented
in this report our conclusions about the effectiveness of the disclosure controls and
procedures, as of a date within 90 days prior to the filing date of this report based
on such evaluation; and |
| d. | Disclosed
in this report any change in the Registrant’s internal control over financial reporting
that occurred during the period covered by this report that has materially affected,
or is reasonably likely to materially affect, the Registrant’s internal control
over financial reporting; and |
| 5. | The
Registrant’s other certifying officer and I have disclosed to the Registrant’s
auditors and the audit committee of the Registrant’s board of directors (or persons
performing the equivalent functions): |
| a. | All
significant deficiencies and material weaknesses in the design or operation of internal
control over financial reporting which are reasonably likely
to adversely affect the Registrant’s ability to record, process, summarize, and
report financial information; and |
| b. | Any
fraud, whether or not material, that involves management or other employees who have
a significant role in the Registrant’s internal control over financial reporting. |
| By: |
/s/ Gregory
Roppa |
|
| |
Gregory Roppa (Principal Financial Officer) |
|
| |
Treasurer and Chief Financial Officer |
|
| |
|
|
| Date: |
September 6, 2024 |
|
Exhibit
99.906Cert
This
certification is furnished pursuant to Section 906 of the Sarbanes-Oxley Act of 2002, 18 U.S.C. § 1350, and accompanies
the report on Form N-CSR for the period ended June 30, 2024 (the “Report”) of Blackstone Strategic Credit 2027 Term Fund (the “Registrant”).
I,
Robert Zable, the President and Chief Executive Officer of the Registrant, certify that, to my knowledge:
| (i) | the
Report fully complies with the requirements of Section 13(a) or Section 15(d), as
applicable, of the Securities Exchange Act of 1934 (15 U.S.C. 78m or 78o(d)); and |
| (ii) | the
information contained in the Report fairly presents, in all material respects, the financial
condition and results of operations of the Registrant. |
| Dated: | September 6, 2024 |
|
| | |
|
| By: | /s/
Robert Zable |
|
| | Robert
Zable (Principal Executive Officer) |
|
| | President
and Chief Executive Officer |
|
This
certification is furnished pursuant to Section 906 of the Sarbanes-Oxley Act of 2002, 18 U.S.C. § 1350, and accompanies
the report on Form N-CSR for the period ended June 30, 2024 (the “Report”) of Blackstone Strategic Credit 2027 Term Fund (the “Registrant”).
I,
Gregory Roppa, the Treasurer and Chief Financial Officer of the Registrant, certify that, to my knowledge:
| (i) | the
Report fully complies with the requirements of Section 13(a) or Section 15(d), as
applicable of the Securities Exchange Act of 1934 (15 U.S.C. 78m or 78o(d)); and |
| (ii) | the
information contained in the Report fairly presents, in all material respects, the financial
condition and results of operations of the Registrant. |
| Dated: |
September 6, 2024 |
|
| |
|
|
| By: |
/s/ Gregory Roppa |
|
| |
Gregory Roppa (Principal Financial Officer) |
|
| |
Treasurer and Chief Financial Officer |
|
EX-99.IRANNOTICE
Iran-Related
Activities Disclosure
Disclosure
Pursuant to Section 219 of the Iran Threat Reduction and Syria Human Rights Act and Section 13(r) of the Securities Exchange Act
of 1934
Section
219 of the Iran Threat Reduction and Syria Human Rights Act of 2012 and Section 13(r) of the Securities Exchange Act of 1934 (the
“Exchange Act”) require an issuer to disclose in its annual and quarterly reports whether it or any of its affiliates
have knowingly engaged in specified activities or transactions relating to Iran. Blackstone Strategic Credit 2027 Term Fund (the
“Fund”) is required to include certain disclosures in its periodic reports if the Fund or any of its
“affiliates” (as defined in Rule 12b-2 under the Exchange Act) knowingly engaged in certain specified activities,
transactions or dealings relating to Iran or with certain individuals or entities targeted by United States’ economic
sanctions during the period covered by the report. Disclosure is generally required even where the activities, transactions or
dealings were conducted in compliance with applicable law. Neither Blackstone Alternative Credit Advisors LP nor any of its
controlled affiliates or subsidiaries knowingly engaged in any of the specified activities relating to Iran or otherwise engaged in
any activities associated with Iran during the reporting period. However, because the SEC defines the term “affiliate”
broadly, it includes any person or entity that is under common control with the Fund as well as any entity that controls the Fund or
is controlled by the Fund.
Blackstone
Inc. (“Blackstone”), which may be considered the Fund’s affiliate, included the disclosure reproduced below
in its Annual Report on Form 10-K for the fiscal year ended December 31, 2023. The Fund has not independently verified or participated
in preparation of this disclosure:
“Mundys
S.p.A. (formerly “Atlantia S.p.A.”) provided the disclosure reproduced below in connection with activities during
the fiscal year ended December 31, 2023. We have not independently verified or participated in the preparation of this disclosure.
‘Disclosure
pursuant to Section 13(r) of the Securities Exchange Act of 1934. Funds affiliated with Blackstone first invested in Mundys S.p.A.
on November 18, 2022 in connection with the voluntary public tender offer by Schema Alfa S.p.A. for all of the shares of Mundys
S.p.A., pursuant to which such funds obtained a minority non-controlling interest in Mundys S.p.A. Mundys S.p.A. owns and controls
Aeroporti di Roma S.p.A. (“ADR”), an operator of airports in Italy including Leonardo da Vinci-Fiumicino Airport.
Iran Air has historically operated periodic flights to and from Leonardo da Vinci-Fiumicino Airport as authorized, from time to
time, by an aviation-related bilateral agreement between Italy and Iran, scheduled in compliance with European Regulation 95/93,
and approved by the Italian Civil Aviation Authority. ADR, as airport operator, is under a mandatory obligation to provide airport
services to all air carriers (including Iran Air) authorized by the applicable Italian authority. The relevant turnover attributable
to these activities (whose consideration is calculated on the basis of general tariffs determined by such independent Italian
authority) in the fiscal year ended December 31, 2023 was less than €210,000. Mundys S.p.A. does not track profits specifically
attributable to these activities.’”
Blackstone
also included the disclosure reproduced below in its Form 10-Q for the quarter ended March 31, 2024. The Fund has not independently
verified or participated in preparation of this disclosure:
“Mundys
S.p.A. (formerly “Atlantia S.p.A.”) provided the disclosure reproduced below in connection with activities during
the quarter ended March 31, 2024. We have not independently verified or participated in the preparation of this disclosure.
‘Disclosure
pursuant to Section 13(r) of the Securities Exchange Act of 1934. Funds affiliated with Blackstone first invested in Mundys S.p.A.
on November 18, 2022 in connection with the voluntary public tender offer by Schema Alfa S.p.A. for all of the shares of Mundys
S.p.A., pursuant to which such funds obtained a minority non-controlling interest in Mundys S.p.A. Mundys S.p.A. owns and controls
Aeroporti di Roma S.p.A. (“ADR”), an operator of airports in Italy including Leonardo da Vinci-Fiumicino Airport.
Iran Air has historically operated periodic flights to and from Leonardo da Vinci-Fiumicino Airport as authorized, from time to
time, by an aviation-related bilateral agreement between Italy and Iran, scheduled in compliance with European Regulation 95/93,
and approved by the Italian Civil Aviation Authority. ADR, as airport operator, is under a mandatory obligation to provide airport
services to all air carriers (including Iran Air) authorized by the applicable Italian authority. The relevant turnover attributable
to these activities (whose consideration is calculated on the basis of general tariffs determined by such independent Italian
authority) in the quarter ended March 31, 2024 was less than €70,000. Mundys S.p.A. does not track profits specifically attributable
to these activities.’”
Blackstone
also included the disclosure reproduced below in its Form 10-Q for the quarter ended June 30, 2024. The Fund has not independently
verified or participated in preparation of this disclosure:
“Mundys
S.p.A. (formerly “Atlantia S.p.A.”) provided the disclosure reproduced below in connection with activities during
the quarter ended June 30, 2024. We have not independently verified or participated in the preparation of this disclosure.
‘Disclosure
pursuant to Section 13(r) of the Securities Exchange Act of 1934. Funds affiliated with Blackstone first invested in Mundys S.p.A.
on November 18, 2022 in connection with the voluntary public tender offer by Schema Alfa S.p.A. for all of the shares of Mundys
S.p.A., pursuant to which such funds obtained a minority non-controlling interest in Mundys S.p.A. Mundys S.p.A. owns and controls
Aeroporti di Roma S.p.A. (“ADR”), an operator of airports in Italy including Leonardo da Vinci-Fiumicino Airport.
Iran Air has historically operated periodic flights to and from Leonardo da Vinci-Fiumicino Airport as authorized, from time to
time, by an aviation-related bilateral agreement between Italy and Iran, scheduled in compliance with European Regulation 95/93,
and approved by the Italian Civil Aviation Authority. ADR, as airport operator, is under a mandatory obligation to provide airport
services to all air carriers (including Iran Air) authorized by the applicable Italian authority. The relevant turnover attributable
to these activities (whose consideration is calculated on the basis of general tariffs determined by such independent Italian
authority) in the quarter ended June 30, 2024 was less than €50,000. Mundys S.p.A. does not track profits specifically attributable
to these activities.’”
v3.24.2.u1
N-2
|
6 Months Ended |
|
Jun. 30, 2024
$ / shares
shares
|
|---|
| Prospectus [Line Items] |
|
| Document Period End Date |
Jun. 30, 2024
|
| Cover [Abstract] |
|
| Entity Central Index Key |
0001546429
|
| Amendment Flag |
false
|
| Entity Inv Company Type |
N-2
|
| Document Type |
N-CSRS
|
| Entity Registrant Name |
Blackstone
Strategic Credit 2027 Term Fund
|
| General Description of Registrant [Abstract] |
|
| Investment Objectives and Practices [Text Block] |
BGB’s
primary investment objective is to seek high current income, with a secondary objective to seek preservation of capital, consistent
with its primary goal of high current income. BGB will seek to achieve its investment objectives by investing primarily in a diversified
portfolio of loans and other fixed income instruments of predominantly U.S. corporate issuers, including first- and second-lien
secured loans (‘‘Senior Secured Loans’’) and high yield corporate bonds of varying maturities. Under normal
market conditions, at least 80% of BGB’s Managed Assets (defined in Note 3) will be invested in credit investments comprised
of corporate fixed income instruments and other investments (including derivatives) with similar economic characteristics.
Senior
Loans, Secured Loans and Senior Secured Loans are referred to collectively as “Loans” throughout the Notes to Financial
Statements.
|
| Share Price | $ / shares |
$ 12.77
|
| NAV Per Share | $ / shares |
$ 11.89
|
| Preferred Shares [Member] |
|
| Capital Stock, Long-Term Debt, and Other Securities [Abstract] |
|
| Outstanding Security, Title [Text Block] |
preferred shares
|
| Outstanding Security, Authorized [Shares] | shares |
45,000
|
| Common Shares [Member] |
|
| Capital Stock, Long-Term Debt, and Other Securities [Abstract] |
|
| Outstanding Security, Title [Text Block] |
COMMON SHARES
|
| Outstanding Security, Authorized [Shares] | shares |
44,664,382
|
| X |
- ReferencesReference 1: http://www.xbrl.org/2003/role/presentationRef
-Publisher SEC
-Name Form N-2
-Section Item 10
| Name: |
cef_CapitalStockLongTermDebtAndOtherSecuritiesAbstract |
| Namespace Prefix: |
cef_ |
| Data Type: |
xbrli:stringItemType |
| Balance Type: |
na |
| Period Type: |
duration |
|
| X |
- ReferencesReference 1: http://www.xbrl.org/2003/role/presentationRef
-Publisher SEC
-Name Form N-2
-Section Item 8
| Name: |
cef_GeneralDescriptionOfRegistrantAbstract |
| Namespace Prefix: |
cef_ |
| Data Type: |
xbrli:stringItemType |
| Balance Type: |
na |
| Period Type: |
duration |
|
| X |
- ReferencesReference 1: http://www.xbrl.org/2003/role/presentationRef
-Publisher SEC
-Name Form N-2
-Section Item 8
-Subsection 2
-Paragraph b, d
| Name: |
cef_InvestmentObjectivesAndPracticesTextBlock |
| Namespace Prefix: |
cef_ |
| Data Type: |
dtr-types:textBlockItemType |
| Balance Type: |
na |
| Period Type: |
duration |
|
| X |
- ReferencesReference 1: http://www.xbrl.org/2003/role/presentationRef
-Publisher SEC
-Name Form N-2
-Section Item 10
-Subsection 5
-Paragraph 2
| Name: |
cef_OutstandingSecurityAuthorizedShares |
| Namespace Prefix: |
cef_ |
| Data Type: |
xbrli:sharesItemType |
| Balance Type: |
na |
| Period Type: |
duration |
|
| X |
- ReferencesReference 1: http://www.xbrl.org/2003/role/presentationRef
-Publisher SEC
-Name Form N-2
-Section Item 10
-Subsection 5
-Paragraph 1
| Name: |
cef_OutstandingSecurityTitleTextBlock |
| Namespace Prefix: |
cef_ |
| Data Type: |
dtr-types:textBlockItemType |
| Balance Type: |
na |
| Period Type: |
duration |
|
| X |
- ReferencesReference 1: http://www.xbrl.org/2003/role/presentationRef
-Publisher SEC
-Name Form N-2
| Name: |
cef_ProspectusLineItems |
| Namespace Prefix: |
cef_ |
| Data Type: |
xbrli:stringItemType |
| Balance Type: |
na |
| Period Type: |
duration |
|
| X |
- DefinitionBoolean flag that is true when the XBRL content amends previously-filed or accepted submission.
| Name: |
dei_AmendmentFlag |
| Namespace Prefix: |
dei_ |
| Data Type: |
xbrli:booleanItemType |
| Balance Type: |
na |
| Period Type: |
duration |
|
| X |
- DefinitionFor the EDGAR submission types of Form 8-K: the date of the report, the date of the earliest event reported; for the EDGAR submission types of Form N-1A: the filing date; for all other submission types: the end of the reporting or transition period. The format of the date is YYYY-MM-DD.
| Name: |
dei_DocumentPeriodEndDate |
| Namespace Prefix: |
dei_ |
| Data Type: |
xbrli:dateItemType |
| Balance Type: |
na |
| Period Type: |
duration |
|
| X |
- DefinitionThe type of document being provided (such as 10-K, 10-Q, 485BPOS, etc). The document type is limited to the same value as the supporting SEC submission type, or the word 'Other'.
| Name: |
dei_DocumentType |
| Namespace Prefix: |
dei_ |
| Data Type: |
dei:submissionTypeItemType |
| Balance Type: |
na |
| Period Type: |
duration |
|
| X |
- DefinitionA unique 10-digit SEC-issued value to identify entities that have filed disclosures with the SEC. It is commonly abbreviated as CIK. Reference 1: http://www.xbrl.org/2003/role/presentationRef
-Publisher SEC
-Name Exchange Act
-Number 240
-Section 12
-Subsection b-2
| Name: |
dei_EntityCentralIndexKey |
| Namespace Prefix: |
dei_ |
| Data Type: |
dei:centralIndexKeyItemType |
| Balance Type: |
na |
| Period Type: |
duration |
|
| X |
- DefinitionOne of: N-1A (Mutual Fund), N-1 (Open-End Separate Account with No Variable Annuities), N-2 (Closed-End Investment Company), N-3 (Separate Account Registered as Open-End Management Investment Company), N-4 (Variable Annuity UIT Separate Account), N-5 (Small Business Investment Company), N-6 (Variable Life UIT Separate Account), S-1 or S-3 (Face Amount Certificate Company), S-6 (UIT, Non-Insurance Product). Reference 1: http://www.xbrl.org/2003/role/presentationRef
-Publisher SEC
-Name Regulation S-T
-Number 232
-Section 313
| Name: |
dei_EntityInvCompanyType |
| Namespace Prefix: |
dei_ |
| Data Type: |
dei:invCompanyType |
| Balance Type: |
na |
| Period Type: |
duration |
|
| X |
- DefinitionThe exact name of the entity filing the report as specified in its charter, which is required by forms filed with the SEC. Reference 1: http://www.xbrl.org/2003/role/presentationRef
-Publisher SEC
-Name Exchange Act
-Number 240
-Section 12
-Subsection b-2
| Name: |
dei_EntityRegistrantName |
| Namespace Prefix: |
dei_ |
| Data Type: |
xbrli:normalizedStringItemType |
| Balance Type: |
na |
| Period Type: |
duration |
|
| X |
- DefinitionNet asset value per share or per unit of investments in certain entities that calculate net asset value per share. Includes, but is not limited to, by unit, membership interest, or other ownership interest. Investment includes, but is not limited to, investment in certain hedge funds, venture capital funds, private equity funds, real estate partnerships or funds. Excludes fair value disclosure. Reference 1: http://fasb.org/us-gaap/role/ref/legacyRef
-Name Accounting Standards Codification
-Section 35
-Paragraph 54B
-SubTopic 10
-Topic 820
-Publisher FASB
-URI https://asc.fasb.org//1943274/2147482134/820-10-35-54B
Reference 2: http://fasb.org/us-gaap/role/ref/legacyRef
-Name Accounting Standards Codification
-Section 35
-Paragraph 59
-SubTopic 10
-Topic 820
-Publisher FASB
-URI https://asc.fasb.org//1943274/2147482134/820-10-35-59
Reference 3: http://fasb.org/us-gaap/role/ref/legacyRef
-Name Accounting Standards Codification
-Section 50
-Paragraph 6A
-SubTopic 10
-Topic 820
-Publisher FASB
-URI https://asc.fasb.org//1943274/2147482106/820-10-50-6A
Reference 4: http://www.xbrl.org/2003/role/exampleRef
-Topic 946
-SubTopic 830
-Name Accounting Standards Codification
-Section 55
-Paragraph 12
-Publisher FASB
-URI https://asc.fasb.org//1943274/2147480167/946-830-55-12
Reference 5: http://www.xbrl.org/2003/role/disclosureRef
-Topic 946
-SubTopic 210
-Name Accounting Standards Codification
-Section 45
-Paragraph 4
-Publisher FASB
-URI https://asc.fasb.org//1943274/2147480555/946-210-45-4
Reference 6: http://www.xbrl.org/2003/role/disclosureRef
-Topic 946
-SubTopic 205
-Name Accounting Standards Codification
-Section 50
-Paragraph 7
-Subparagraph (a)
-Publisher FASB
-URI https://asc.fasb.org//1943274/2147480737/946-205-50-7
Reference 7: http://www.xbrl.org/2003/role/disclosureRef
-Topic 946
-SubTopic 205
-Name Accounting Standards Codification
-Section 50
-Paragraph 7
-Subparagraph (h)
-Publisher FASB
-URI https://asc.fasb.org//1943274/2147480737/946-205-50-7
Reference 8: http://www.xbrl.org/2003/role/disclosureRef
-Topic 946
-SubTopic 505
-Name Accounting Standards Codification
-Section 50
-Paragraph 1
-Publisher FASB
-URI https://asc.fasb.org//1943274/2147481004/946-505-50-1
Reference 9: http://www.xbrl.org/2003/role/disclosureRef
-Topic 946
-SubTopic 210
-Name Accounting Standards Codification
-Section S99
-Paragraph 1
-Subparagraph (SX 210.6-04(19))
-Publisher FASB
-URI https://asc.fasb.org//1943274/2147479617/946-210-S99-1
Reference 10: http://www.xbrl.org/2003/role/disclosureRef
-Topic 946
-SubTopic 210
-Name Accounting Standards Codification
-Section S99
-Paragraph 2
-Subparagraph (SX 210.6-05(4))
-Publisher FASB
-URI https://asc.fasb.org//1943274/2147479617/946-210-S99-2
| Name: |
us-gaap_NetAssetValuePerShare |
| Namespace Prefix: |
us-gaap_ |
| Data Type: |
dtr-types:perShareItemType |
| Balance Type: |
na |
| Period Type: |
instant |
|
| X |
- DefinitionPrice of a single share of a number of saleable stocks of a company.
| Name: |
us-gaap_SharePrice |
| Namespace Prefix: |
us-gaap_ |
| Data Type: |
dtr-types:perShareItemType |
| Balance Type: |
na |
| Period Type: |
instant |
|
| X |
- Details
| Name: |
us-gaap_StatementClassOfStockAxis=bgb_PreferredSharesMember |
| Namespace Prefix: |
|
| Data Type: |
na |
| Balance Type: |
|
| Period Type: |
|
|
| X |
- Details
| Name: |
us-gaap_StatementClassOfStockAxis=bgb_CommonSharesMember |
| Namespace Prefix: |
|
| Data Type: |
na |
| Balance Type: |
|
| Period Type: |
|
|
Blackstone Strategic Cre... (NYSE:BGB)
Historical Stock Chart
From Aug 2024 to Sep 2024

Blackstone Strategic Cre... (NYSE:BGB)
Historical Stock Chart
From Sep 2023 to Sep 2024
