false
0001464790
0001464790
2023-12-13
2023-12-13
0001464790
RILY:CommonStockParValue0.0001PerShareMember
2023-12-13
2023-12-13
0001464790
RILY:DepositarySharesEachRepresenting11000thinterestina6.875Member
2023-12-13
2023-12-13
0001464790
RILY:DepositarySharesEachRepresenting11000thfractionalinterestina7.375Member
2023-12-13
2023-12-13
0001464790
RILY:Sec6.75SeniorNotesDue2024Member
2023-12-13
2023-12-13
0001464790
RILY:Sec6.375SeniorNotesDue2025Member
2023-12-13
2023-12-13
0001464790
RILY:Sec5.00SeniorNotesDue2026Member
2023-12-13
2023-12-13
0001464790
RILY:Sec5.50SeniorNotesDue2026Member
2023-12-13
2023-12-13
0001464790
RILY:Sec6.50SeniorNotesDue2026Member
2023-12-13
2023-12-13
0001464790
RILY:Sec5.25SeniorNotesDue2028Member
2023-12-13
2023-12-13
0001464790
RILY:Sec6.00SeniorNotesDue2028Member
2023-12-13
2023-12-13
iso4217:USD
xbrli:shares
iso4217:USD
xbrli:shares
UNITED
STATES
SECURITIES AND EXCHANGE COMMISSION
Washington, D.C. 20549
FORM 8-K
CURRENT REPORT
Pursuant to Section 13 OR 15(d) of The Securities Exchange Act of
1934
Date of Report (Date of earliest event reported): December 13, 2023
B. RILEY FINANCIAL, INC.
(Exact name of registrant
as specified in its charter)
| Delaware |
|
001-37503 |
|
27-0223495 |
(State or other jurisdiction
of incorporation) |
|
(Commission File Number) |
|
(IRS Employer
Identification No.) |
11100 Santa Monica Blvd.,
Suite 800
Los Angeles, CA 90025
310-966-1444
(Address, Including Zip Code, and Telephone Number, Including
Area Code, of Registrant’s Principal Executive Offices)
Securities registered pursuant to Section 12(b)
of the Act:
| Title of each class |
|
Trading Symbol(s) |
|
Name
of each exchange on which registered |
| Common Stock, par value $0.0001 per share |
|
RILY |
|
Nasdaq Global Market |
| Depositary
Shares (each representing a 1/1000th interest in a 6.875%
Series A Cumulative Perpetual Preferred Share, par value $0.0001 per share) |
|
RILYP |
|
Nasdaq Global Market |
| Depositary
Shares, each representing a 1/1000th fractional interest in a 7.375% share of Series B Cumulative
Perpetual Preferred Stock |
|
RILYL |
|
Nasdaq Global Market |
| 6.75% Senior Notes due 2024 |
|
RILYO |
|
Nasdaq Global Market |
| 6.375% Senior Notes due 2025 |
|
RILYM |
|
Nasdaq Global Market |
| 5.00% Senior Notes due 2026 |
|
RILYG |
|
Nasdaq Global Market |
| 5.50% Senior Notes due 2026 |
|
RILYK |
|
Nasdaq Global Market |
| 6.50% Senior Notes due 2026 |
|
RILYN |
|
Nasdaq Global Market |
| 5.25% Senior Notes due 2028 |
|
RILYZ |
|
Nasdaq Global Market |
| 6.00% Senior Notes due 2028 |
|
RILYT |
|
Nasdaq Global Market |
Not Applicable
(Former name or former address, if changed since
last report)
Check the appropriate box below if the Form 8-K filing is intended
to simultaneously satisfy the filing obligation of the registrant under any of the following provisions:
| ☐ | Written communications pursuant to Rule 425 under the Securities Act (17 CFR 230.425) |
| ☐ | Soliciting material pursuant to Rule 14a-12 under the Exchange Act (17 CFR 240.14a-12) |
| ☐ | Pre-commencement communications pursuant to Rule 14d-2(b) under the Exchange Act (17 CFR 240.14d-2(b)) |
| ☐ | Pre-commencement communications pursuant to Rule 13e-4(c) under the Exchange Act (17 CFR 240.13e-4(c)) |
Indicate by check mark whether the registrant is an emerging growth
company as defined in Rule 405 of the Securities Act of 1933 (§230.405 of this chapter) or Rule 12b-2 of the Securities Exchange
Act of 1934 (§240.12b-2 of this chapter).
Emerging growth company ☐
If an emerging growth company, indicate by check mark if the registrant
has elected not to use the extended transition period for complying with any new or revised financial accounting standards provided pursuant
to Section 13(a) of the Exchange Act. ☐
Item 7.01. Regulation FD Disclosure.
On December 13, 2023, B.
Riley Financial, Inc. (the “Company”) held its previously announced Analyst and Investor Day. The slides used in
conjunction with the presentation are attached hereto as Exhibit 99.1 to this Current Report on Form 8-K.
The information set forth
in this Current Report, including Exhibit 99.1 attached hereto, is being furnished and shall not be deemed “filed”
for purposes of Section 18 of the Securities Exchange Act of 1934, as amended (the “Exchange Act”), or otherwise subject to
the liabilities of such section. The information in this Current Report, including Exhibit 99.1 attached hereto, shall not be
incorporated by reference into any filing under the Securities Act of 1933, as amended, or the Exchange Act, except as expressly set forth
by specific reference in such a filing to this Current Report.
Item 9.01. Financial Statements and Exhibits.
(d) Exhibits
SIGNATURES
Pursuant to the requirements of the Securities Exchange Act of 1934,
the Registrant has duly caused this report to be signed on its behalf by the undersigned hereunto duly authorized.
| |
B. Riley Financial, Inc. |
| |
|
|
| |
By: |
/s/ Phillip J. Ahn |
| |
Name: |
Phillip J. Ahn |
| |
Title: |
Chief Financial Officer and Chief Operating Officer |
Date:
December 13, 2023
2
Exhibit 99.1

1 Investor Overview D e c e m b e r 1 3 , 2 0 23

Forward - looking Statements Statements made in this presentation that are not descriptions of historical facts are forward - looking statements that are based on management’s current expectations and assumptions and are subject to risks and uncertainties . If such risks or uncertainties materialize or such assumptions prove incorrect, our business, operating results, financial condition, and stock price could be materially negatively affected . You should not place undue reliance on such forward - looking statements, which are based on the information currently available to us and speak only as of the date of this press release . Such forward - looking statements include, but are not limited to, statements regarding our excitement and the expected growth of our business segments . Factors that could cause such actual results to differ materially from those contemplated or implied by such forward - looking statements include, without limitation, the risks described from time to time in B . Riley Financial, Inc . ’s periodic filings with the SEC, including, without limitation, the risks described in B . Riley Financial, Inc . ’s Annual Report on Form 10 - K for the year ended December 31 , 2022 under the captions “Risk Factors” and “Management's Discussion and Analysis of Financial Condition and Results of Operations” (as applicable) and our Quarterly Reports on Form 10 - Q for the quarters ended March 31 , 2023 , June 30 , 2023 and September 30 , 2023 . These factors should be considered carefully, and readers are cautioned not to place undue reliance on such forward - looking statements . These factors should be considered carefully, and readers are cautioned not to place undue reliance on such forward - looking statements . All information is current as of the date this presentation is published, and B . Riley Financial undertakes no duty to update this information . This presentation does not constitute an offer to sell or the solicitation of an offer to buy any securities . Any offers, solicitations or offers to buy, or any sales of securities will be made in accordance with the registration requirements of the Securities Act of 1933 , as amended . Use of Non - GAAP Financial Measures 2 Certain of the information set forth herein, including operating revenues, adjusted EBITDA, operating adjusted EBITDA, and investment adjusted EBITDA, may be considered non - GAAP financial measures . B . Riley Financial believes this information is useful to investors because it provides a basis for measuring the Company's available capital resources, the operating performance of its business and its revenues and cash flow, (i) excluding in the case of operating revenues, trading income (loss) and fair value adjustments on loans, (ii) excluding in the case of adjusted EBITDA, net interest expense, provisions for or benefit from income taxes, depreciation, amortization, fair value adjustment, restructuring charge, gain on extinguishment of loans, impairment of trade names, stock - based compensation and transaction and other expenses, (iii) excluding in the case of operating adjusted EBITDA, aforementioned adjustments for adjusted EBITDA, as well as trading income (loss) and fair value adjustments on loans, realized and unrealized gains (losses) on investments, and other investment related expenses, and (iv) in the case of investment adjusted EBITDA this includes trading income (loss) and fair value adjustments on loans and realized and unrealized gains (losses) on investments, net of other investment related expenses, that would normally be included in the most directly comparable measures calculated and presented in accordance with Generally Accepted Accounting Principles ("GAAP") . In the Capital Markets segment, non - GAAP measures also include operating adjusted EBITDA, FI Spread, and CEF income, which is comprised of operating adjusted EBITDA plus revenue and expenses from Fixed Income and Committed Equity Facilities (CEF) . In addition, the Company's management uses these non - GAAP financial measures along with the most directly comparable GAAP financial measures in evaluating the Company's operating performance, capital resources and cash flow . Non - GAAP financial measures should not be considered in isolation from, or as a substitute for, financial information presented in compliance with GAAP, and non - financial measures as reported by the Company may not be comparable to similarly titled amounts reported by other companies . Reconciliation of non - GAAP measures included herein to their most directly comparable GAAP measures can be found in the appendices to this presentation and on B . Riley Financial, Inc . ’s website at https : //ir . brileyfin . com/

Welcome and Agenda 27 - Year Track Record of Doing Right for Our Clients & Investors 1. Diverse & Integrated Platform of Operating Businesses 2. Proprietary Approach to Investing Across the Middle Market 3. WHAT YOU’LL HEAR TODAY 3

01 B. RILEY FINANCIAL AT - A - GLANCE
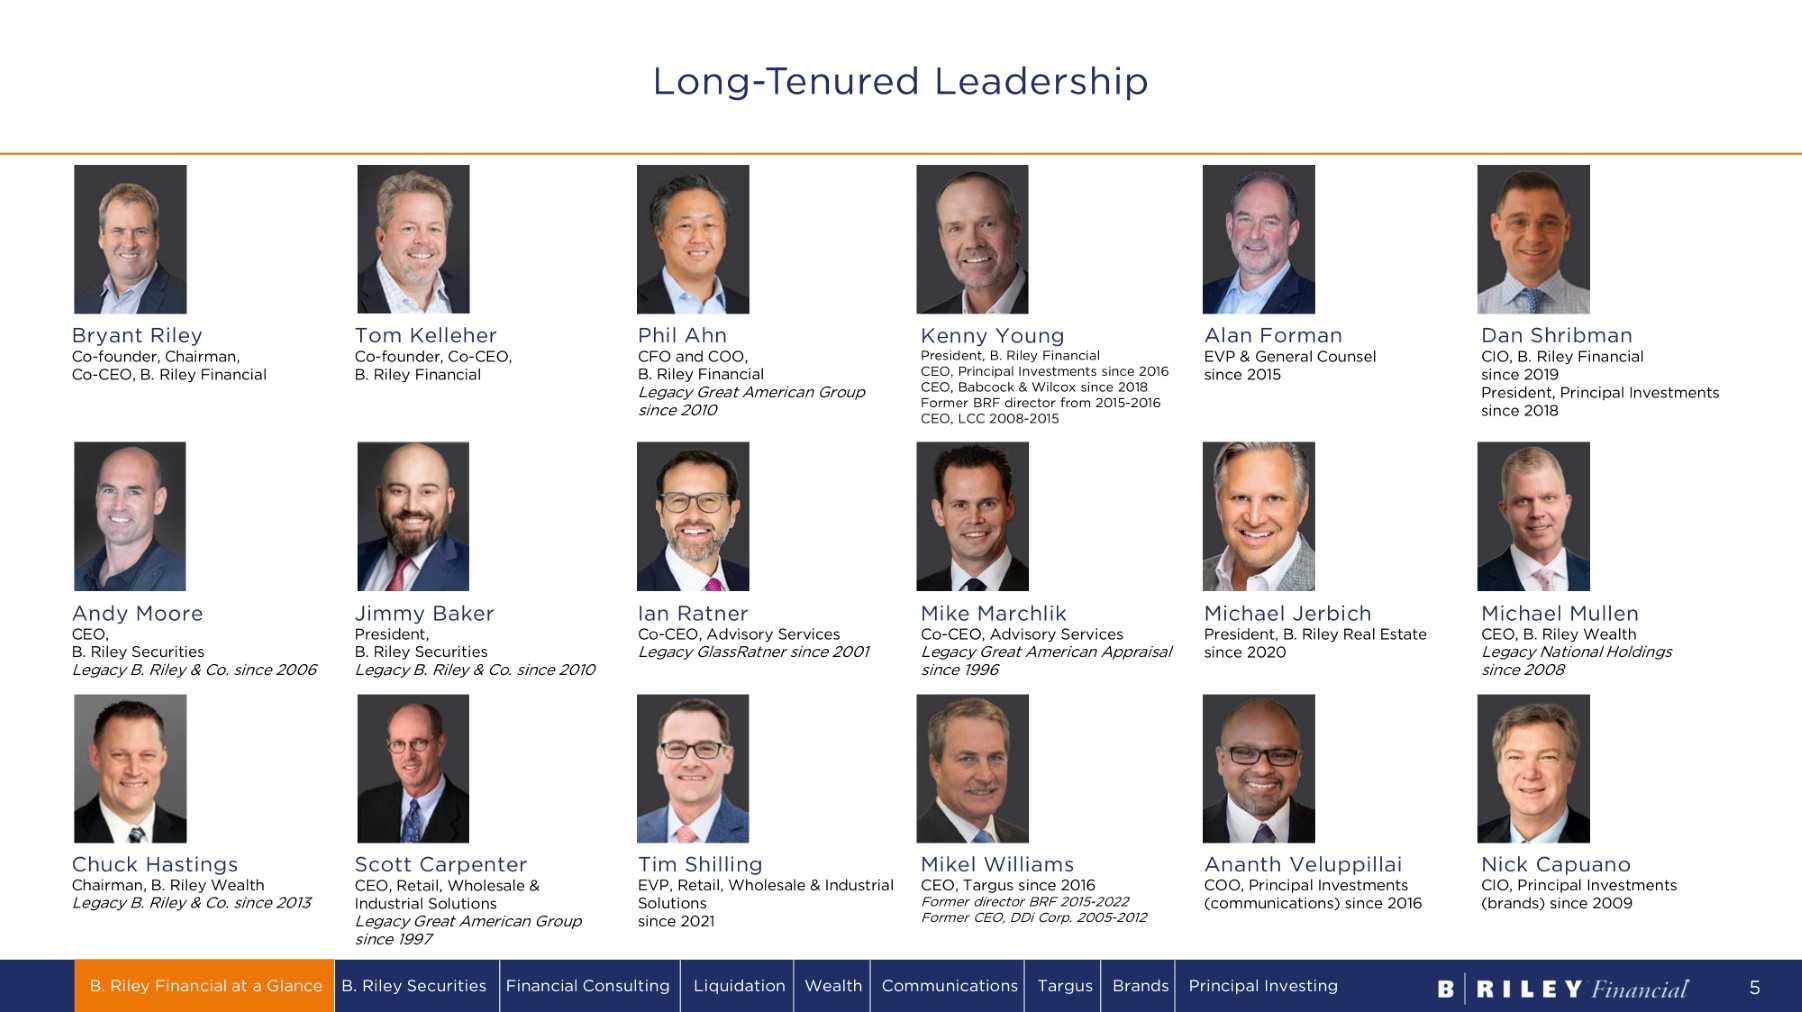
Bryant Riley Co - founder, Chairman, Co - CEO, B. Riley Financial Tom Kelleher C o - f oun d e r , C o - C E O , B. Riley Financial Phil Ahn CFO and COO, B. Riley Financial Legacy Great American Group since 2010 Dan Shribman CIO, B. Riley Financial since 2019 President, Principal Investments since 2018 Andy Moore CEO, B. Riley Securities Legacy B. Riley & Co. since 2006 Jimmy Baker President, B. Riley Securities Legacy B. Riley & Co. since 2010 Ian Ratner Co - CEO, Advisory Services Legacy GlassRatner since 2001 Mike Marchlik Co - CEO, Advisory Services Legacy Great American Appraisal since 1996 Mikel Williams CEO, Targus since 2016 Former director BRF 2015 - 2022 Former CEO, DDi Corp. 2005 - 2012 Nick Capuano CIO, Principal Investments (brands) since 2009 Kenny Young President, B. Riley Financial CEO, Principal Investments since 2016 CEO, Babcock & Wilcox since 2018 Former BRF director from 2015 - 2016 CEO, LCC 2008 - 2015 Ananth Veluppillai COO, Principal Investments (communications) since 2016 Michael Mullen CEO, B. Riley Wealth Legacy National Holdings since 2008 Scott Carpenter CEO, Retail, Wholesale & Industrial Solutions Legacy Great American Group since 1997 Chuck Hastings Chairman, B. Riley Wealth Legacy B. Riley & Co. since 2013 Alan Forman EVP & General Counsel since 2015 Long - Tenured Leadership Michael Jerbich President, B. Riley Real Estate since 2020 Tim Shilling EVP, Retail, Wholesale & Industrial Solutions since 2021 B. Riley Financial at a Glance B. Riley Securities Financial Consulting Liquidation Wealth Communications Targus Brands Principal Investing 5
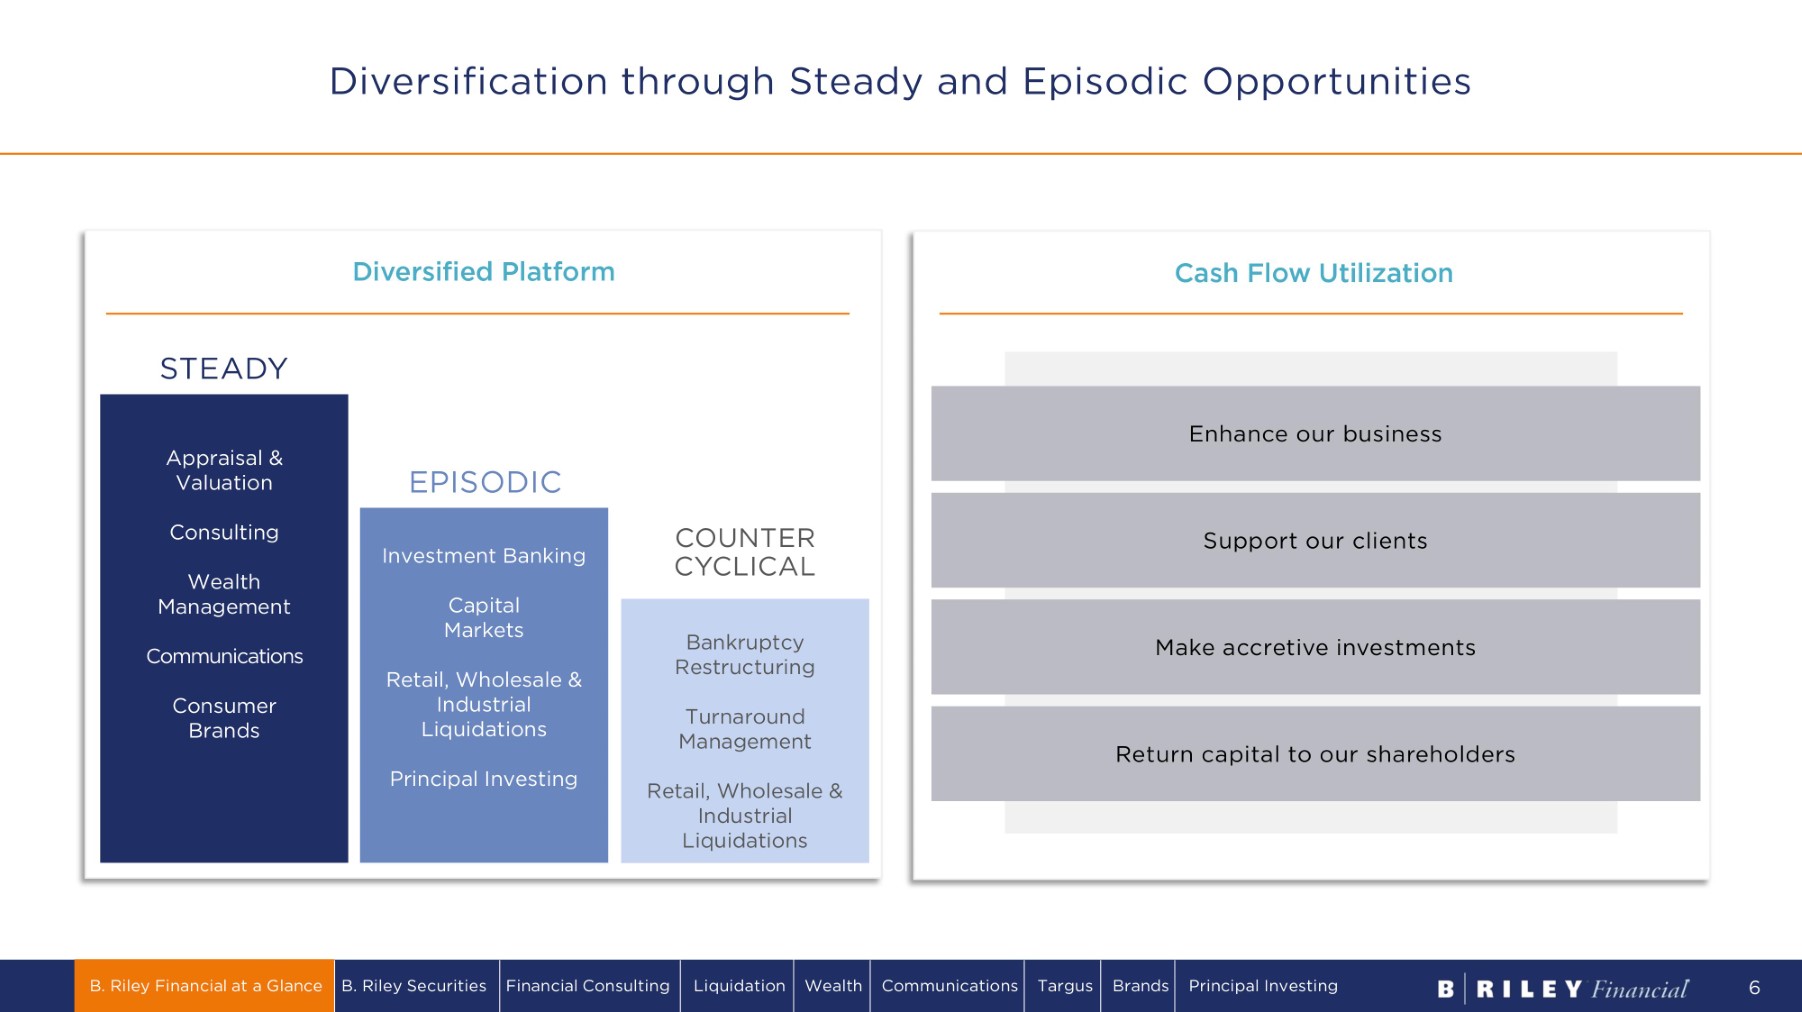
Diversification through Steady and Episodic Opportunities Diversified Platform S TEA D Y EPISODIC C O U N T E R C Y CL I CA L Appraisal & Valuation C o n s u lti n g Wealth M a n a g emen t Investment Banking Capital M ark e t s Communications Retail, Wholesale & Consumer Industrial Brands Liquidations Principal Investing Bankruptcy R e s tr u c t u r i n g Turnaround M a n a g emen t Retail, Wholesale & Industrial Liquidations Support our clients Make accretive investments Cash Flow Utilization Enhance our business Return capital to our shareholders B. Riley Financial at a Glance B. Riley Securities Financial Consulting Liquidation Wealth Communications Targus Brands Principal Investing 6
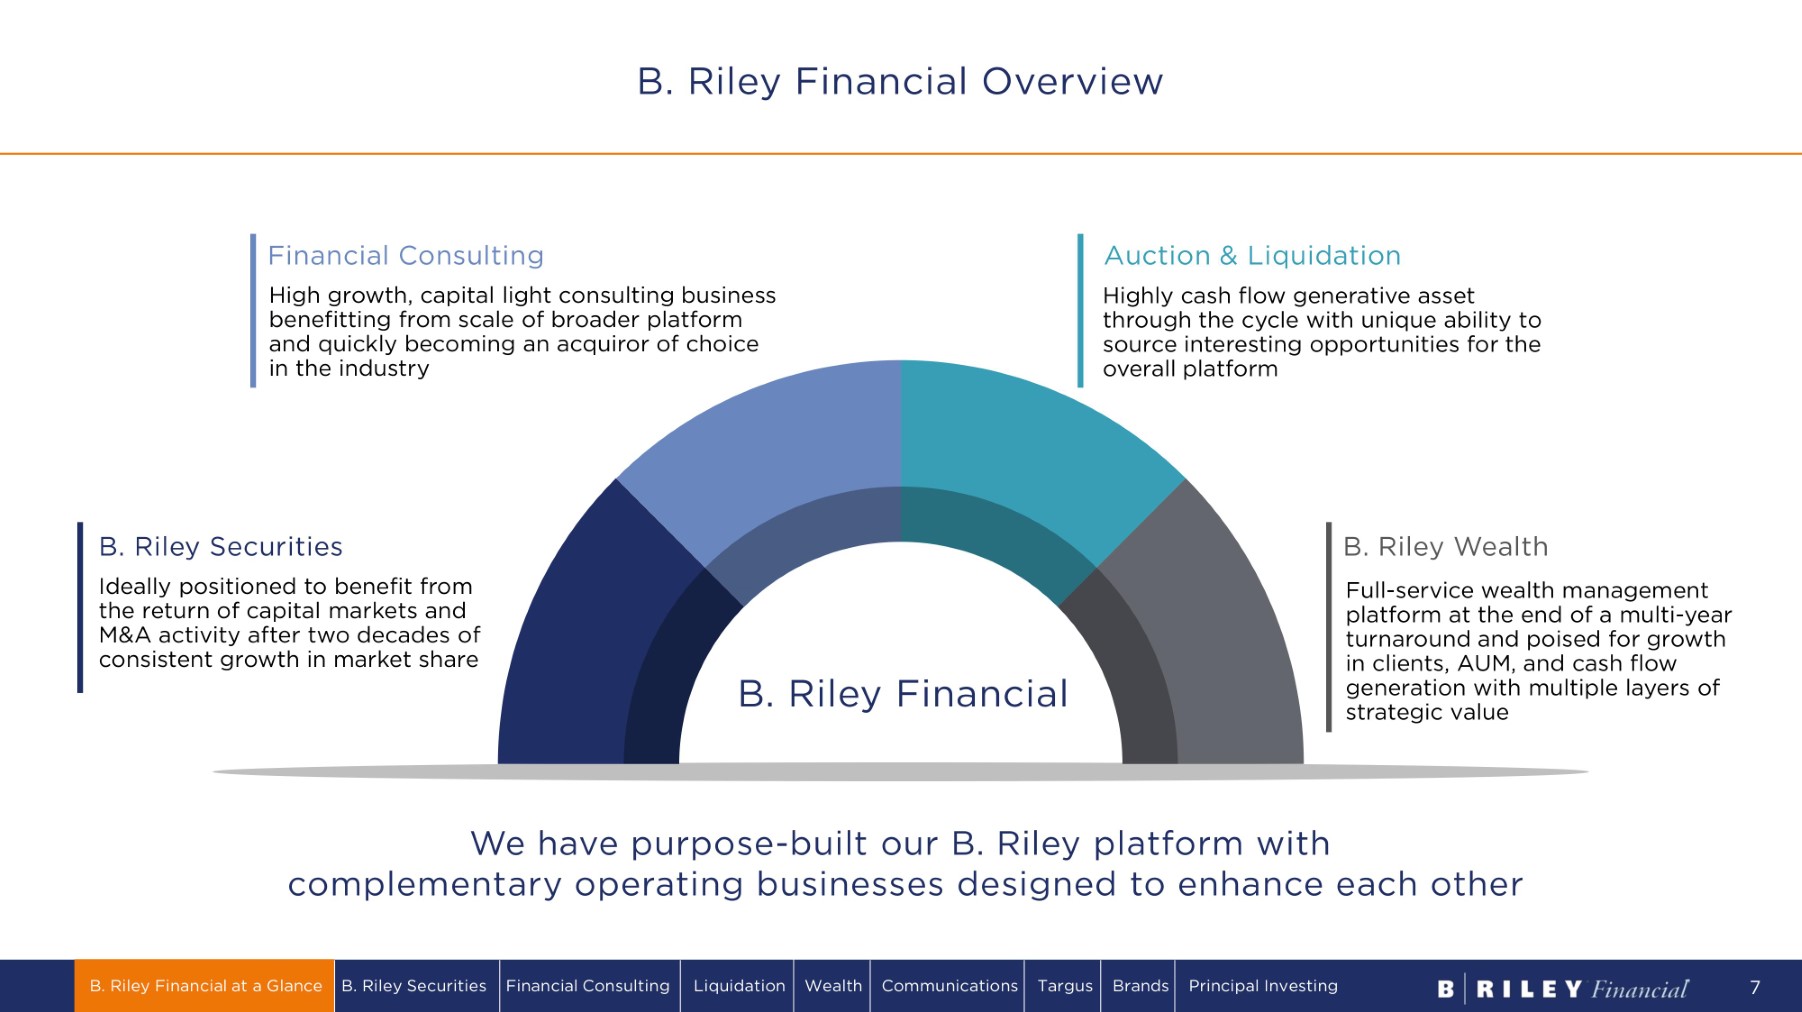
B. Riley Financial Overview We have purpose - built our B. Riley platform with complementary operating businesses designed to enhance each other B. Riley Wealth Full - service wealth management platform at the end of a multi - year turnaround and poised for growth in clients, AUM, and cash flow generation with multiple layers of strategic value B. Riley Securities Ideally positioned to benefit from the return of capital markets and M&A activity after two decades of consistent growth in market share Financial Consulting High growth, capital light consulting business benefitting from scale of broader platform and quickly becoming an acquiror of choice in the industry B. Riley Financial Auction & Liquidation Highly cash flow generative asset through the cycle with unique ability to source interesting opportunities for the overall platform B. Riley Financial at a Glance B. Riley Securities Financial Consulting Liquidation Wealth Communications Targus Brands Principal Investing 7

B. Riley Financial Overview (continued) B. Riley opportunistically employs its balance sheet as an active investor across public and private markets Brands Cash flow generative assets purchased at low multiples with potential upside on continued increases in the value of the IP Communications Our first non - financial services take - private – United Online in 2016 – began with the thesis of buying highly cash flow generative, predictable revenue at a low multiple to complement other more episodic business lines. Our communications vertical has expanded through four additional acquisitions, generating significant cash flow on limited capital investment Targus Acquired in 2022 with the view that its through - cycle stability, market position, and strong cash flow characteristics supplement B. Riley’s cash - generating communications and brand investments B. Riley Financial at a Glance B. Riley Securities Financial Consulting Liquidation Wealth Communications Targus Brands Principal Investing 8 Principal Investing
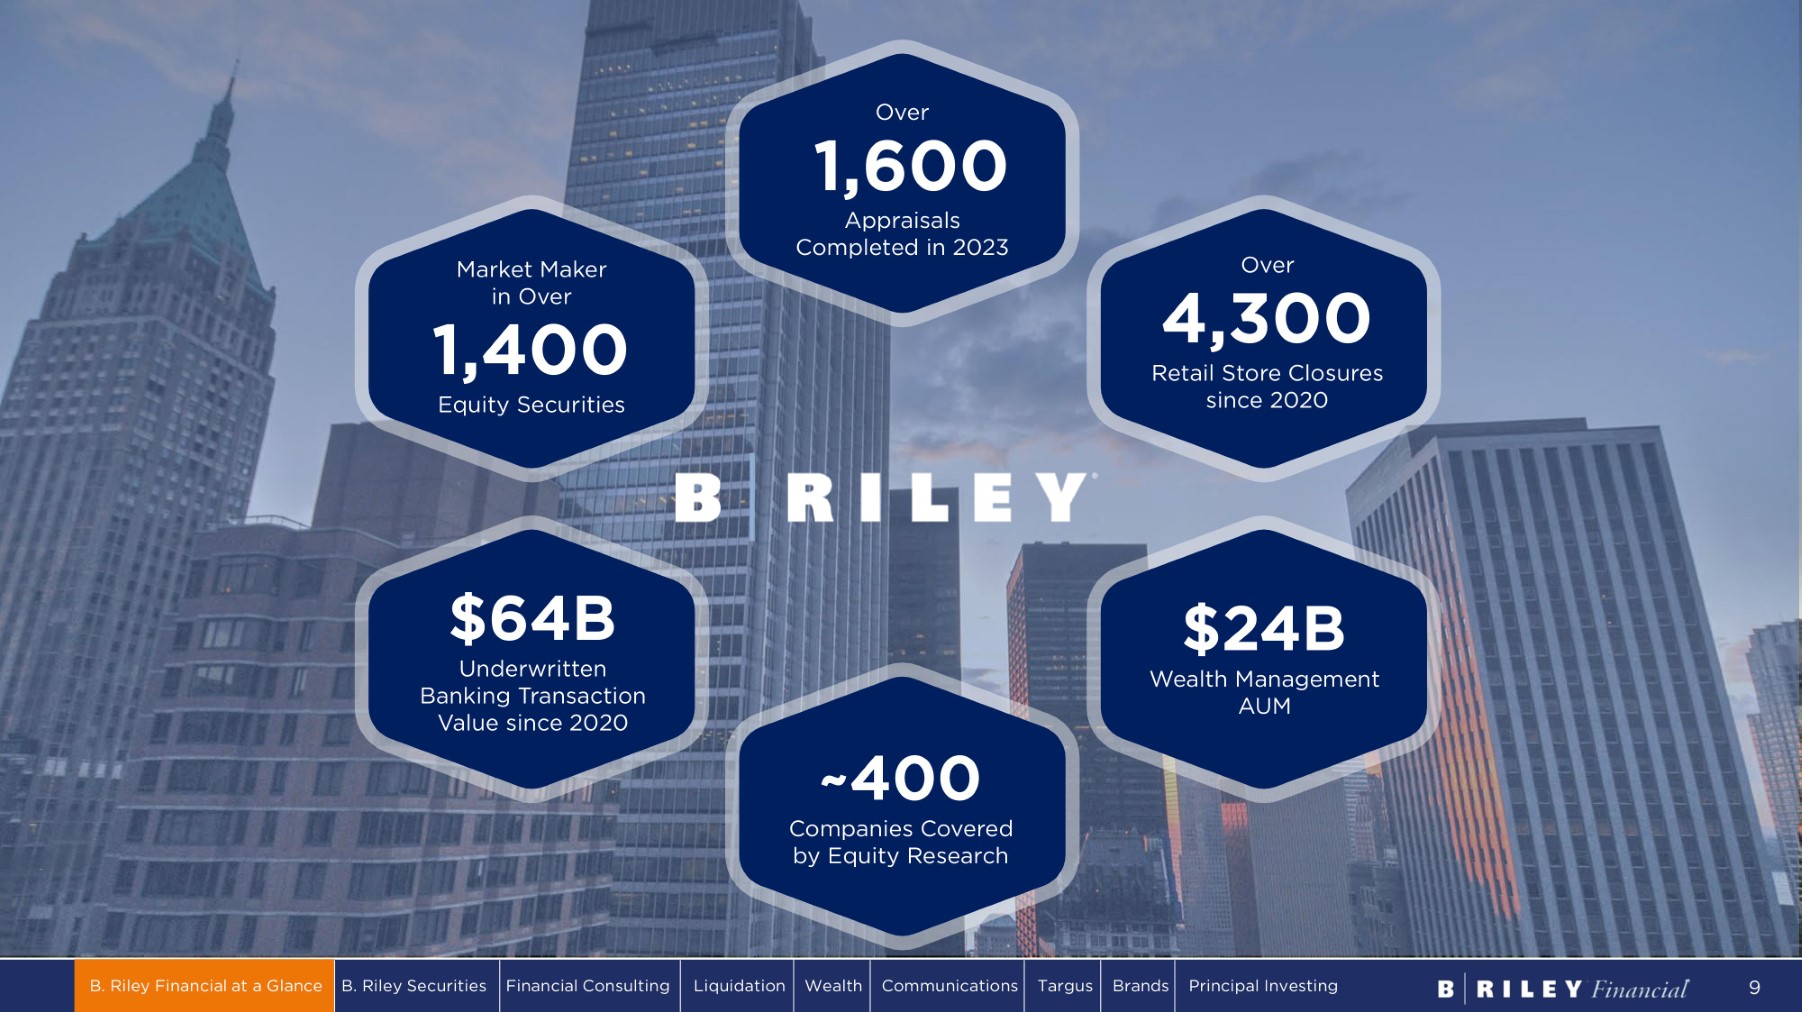
Market Maker in Over 1,400 Equity Securities O v e r 1,600 Appraisals Completed in 2023 Over 4,300 Retail Store Closures since 2020 $64B Underwritten Banking Transaction Value since 2020 $24B Wealth Management AUM ~400 Companies Covered by Equity Research B. Riley Financial at a Glance B. Riley Securities Financial Consulting Liquidation Wealth Communications Targus Brands Principal Investing 9

02 B. RILEY SECURITIES

Advisory Purpose - built to help our clients outperform throughout market cycles M&A Representation Private Markets Advisory Restructuring Advisory Brokerage B. Riley Financial at a Glance B. Riley Securities Financial Consulting Liquidation Wealth Communications Targus Brands Principal Investing 11 Institutional Sales & Trading Research Corporate Access Securities Lending Capital Markets Equity Capital Markets Debt Capital Markets

Expanding B. Riley Securities’ (“BRS”) Capabilities ▪ Established M&A advisory capabilities ▪ Completed first underwritten transaction ▪ Meaningfully grew retail network via acquisition of National Holdings ▪ Expanded investor universe through establishment of Financial Sponsor Group ▪ Added venture - stage capital raising capability via establishment of B. Riley Venture Capital to expand merchant banking framework ▪ Expanded M&A capabilities via FocalPoint acquisition ▪ Added talented leadership & execution staff ▪ Diversified existing Capital Markets business & expanded Private Markets capabilities Founded research - focused small - cap platform ▪ Led proliferation of $25 par market across industry sectors ▪ Created differentiated Committed Equity Facility (“CEF”) product ▪ Established Restructuring capabilities ▪ Expanded Capital Markets capabilities, including ATMs, & enhanced industry coverage via FBR & Co. acquisition ▪ Acquired retail network via Wunderlich acquisition 2023 + 2022 2021 2020 2016 - 2017 2006 - 2010 1997 Built a comprehensive, differentiated platform that addresses the full spectrum of client needs B. Riley Financial at a Glance B. Riley Securities Financial Consulting Liquidation Wealth Communications Targus Brands Principal Investing 12 ▪ Leverage positions of market leadership ▪ Deepen industry vertical expertise ▪ Broaden geographic presence ▪ Expand private credit capabilities
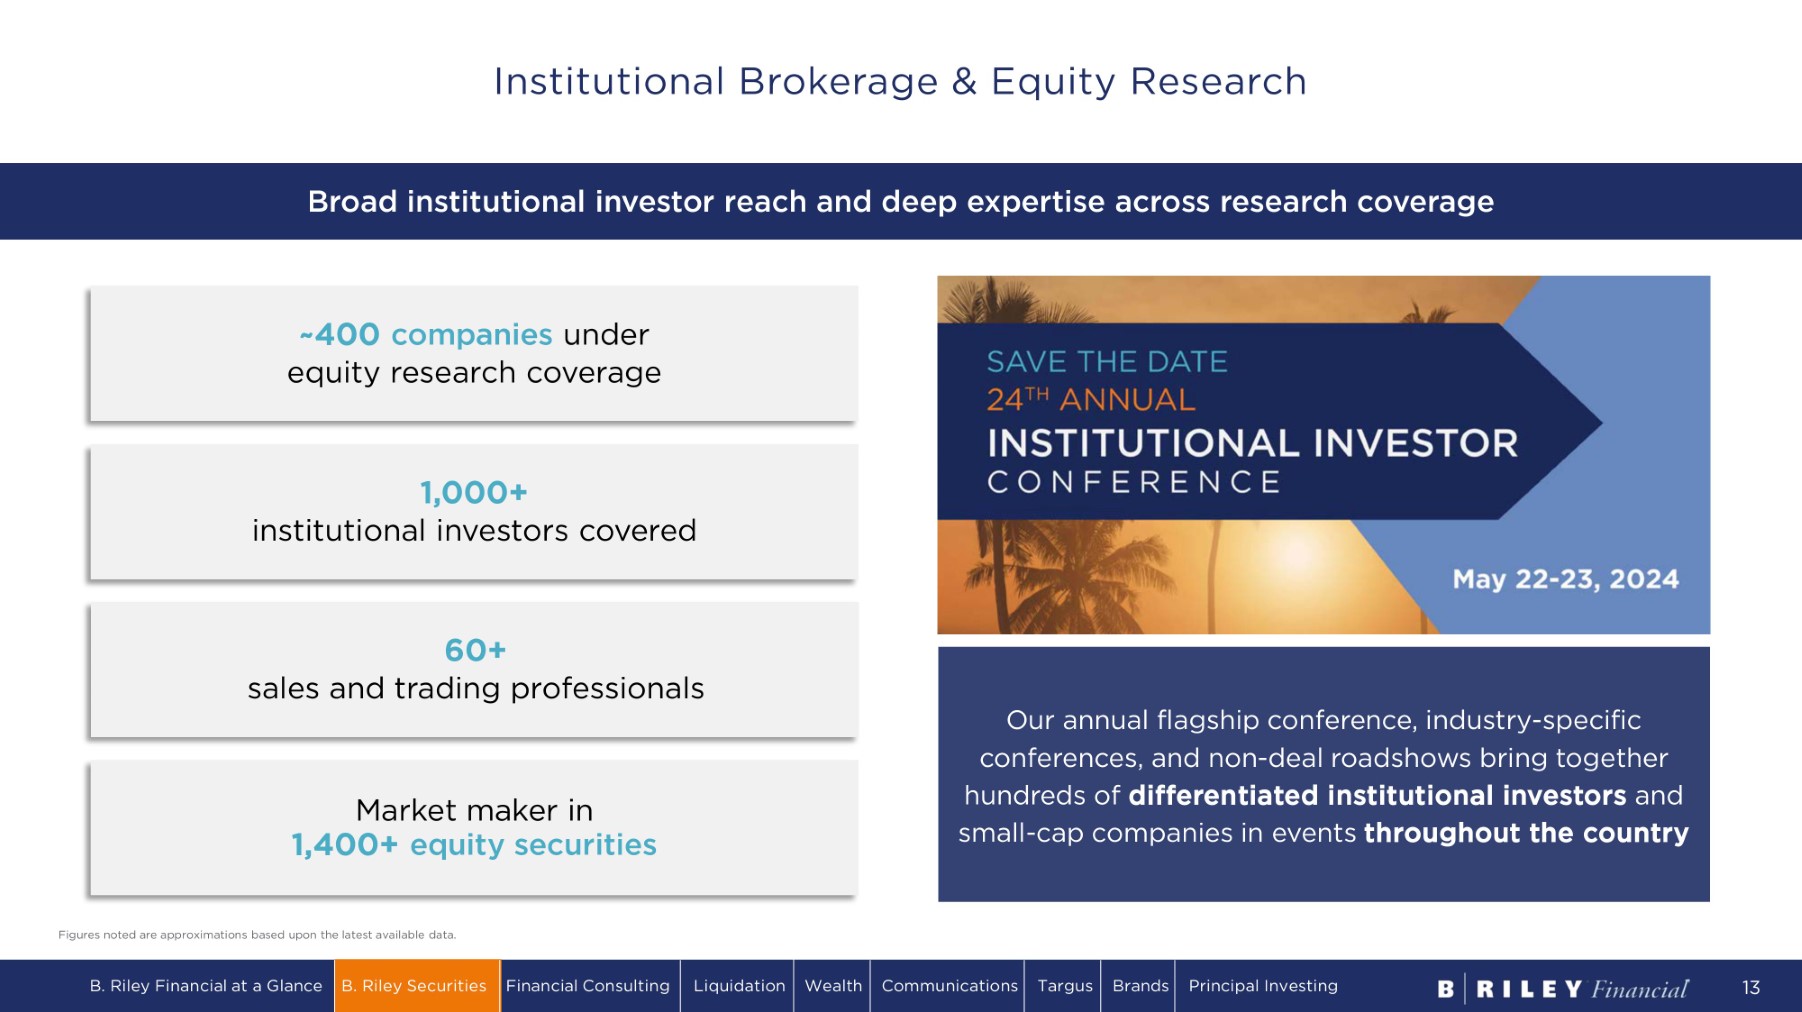
Broad institutional investor reach and deep expertise across research coverage ~400 companies under equity research coverage 1,000+ institutional investors covered Market maker in 1,400+ equity securities Our annual flagship conference, industry - specific conferences, and non - deal roadshows bring together hundreds of differentiated institutional investors and small - cap companies in events throughout the country Figures noted are approximations based upon the latest available data. 60+ sales and trading professionals Institutional Brokerage & Equity Research B. Riley Financial at a Glance B. Riley Securities Financial Consulting Liquidation Wealth Communications Targus Brands Principal Investing 13

Equity Capital Markets | Debt Capital Markets Trailing 3 Years By the Numbers (1) Total transaction value = cumulative deal value (bookrun, lead managed, and co - managed transactions) (2) Cumulative led transaction deal value (public IPO, FO, and convert offerings) ~$64B in total underwritten transaction value (1) #2 Sales Agent in at - the - market offerings (4) Led 30+ private debt transactions, raising ~$3.0B Led 30+ unsecured notes and preferred equity offerings, raising $3.0B+ Led 70+ IPO and FO transactions, raising $7.0B+ (2) #1 Small - Cap Underwriter Outside “Bulge Bracket” Firms (3) Leading Middle - Market Platform (3) Source: Dealogic. Pricing Date 10/1/2020 – 9/30/2023, Deal Type = IPO, FO, Rank Eligible. SEC registered. Exchange Nationality = USA. Market Cap. $100MM - $1.5B. Deal Price >= $1.00. Excludes SPAC IPOs and Healthcare transactions. (4) Based on number of ATMs filed. 300+ ATMs over time span B. Riley Financial at a Glance B. Riley Securities Financial Consulting Liquidation Wealth Communications Targus Brands Principal Investing 14
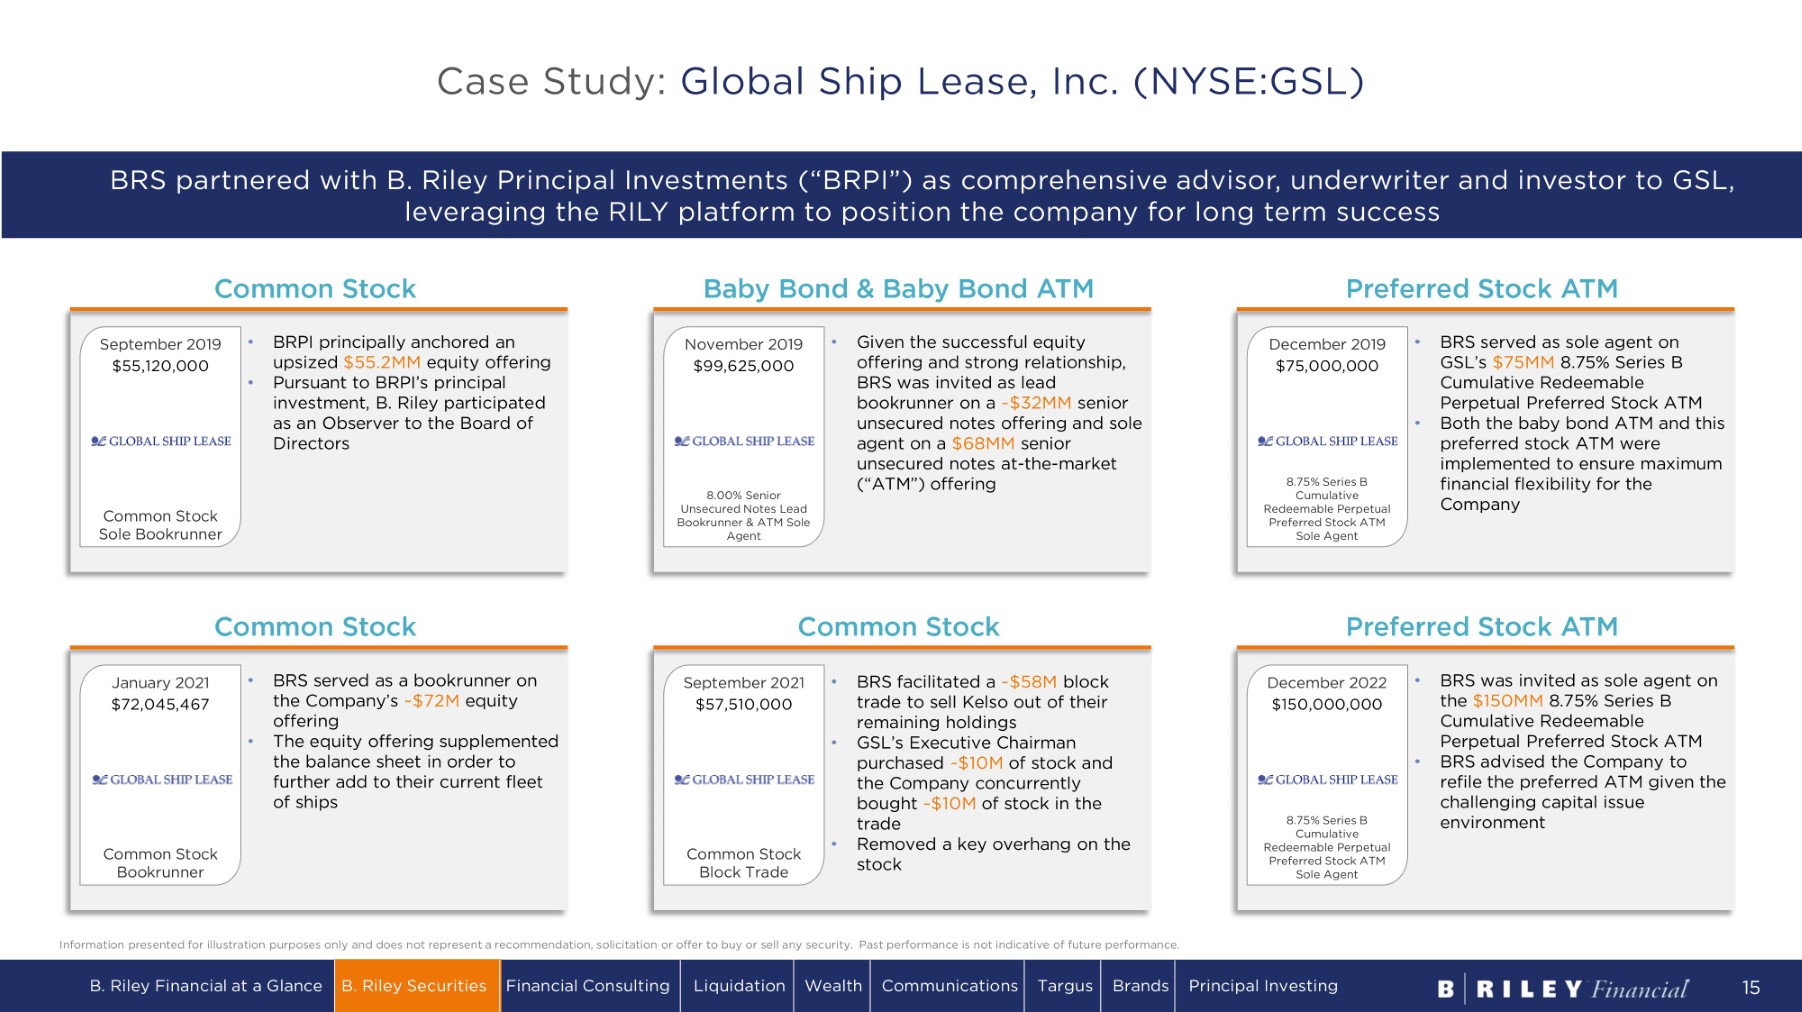
Information presented for illustration purposes only and does not represent a recommendation, solicitation or offer to buy or sell any security. Past performance is not indicative of future performance. Case Study: Global Ship Lease, Inc. (NYSE:GSL) BRPI principally anchored an upsized $55.2MM equity offering • Pursuant to BRPI’s principal investment, B. Riley participated as an Observer to the Board of Directors September 2019 • $55,120,000 Common Stock S o le B ook r unn e r • BRS served as a bookrunner on the Company’s ~$72M equity offering • The equity offering supplemented the balance sheet in order to further add to their current fleet of ships C o m m on S t oc k J a nu a r y 2 0 21 $72,045,467 C o m m o n S t ock Bookrunner BRS facilitated a ~ $ 58 M block trade to sell Kelso out of their remaining holdings • GSL’s Executive Chairman purchased ~$10M of stock and the Company concurrently bought ~$10M of stock in the trade • Removed a key overhang on the stock C o m m on S t oc k S e p t e m b e r 2 0 2 1 • $57,510,000 C o m m o n S t ock Block Trade Given the successful equity offering and strong relationship, BRS was invited as lead bookrunner on a ~$32MM senior unsecured notes offering and sole agent on a $68MM senior unsecured notes at - the - market (“ATM”) offering November 2019 • $99,625,000 8.00% Senior Unsecured Notes Lead Bookrunner & ATM Sole Agent BRS was invited as sole agent on the $150MM 8.75% Series B Cumulative Redeemable Perpetual Preferred Stock ATM • BRS advised the Company to refile the preferred ATM given the challenging capital issue environment Preferred Stock ATM December 2022 • $150,000,000 8.75% Series B Cumulative R e d ee m a b l e P e r p e t u a l Preferred Stock ATM Sole Agent BRS served as sole agent on GSL’s $75MM 8.75% Series B Cumulative Redeemable Perpetual Preferred Stock ATM • Both the baby bond ATM and this preferred stock ATM were implemented to ensure maximum financial flexibility for the Company BRS partnered with B. Riley Principal Investments (“BRPI”) as comprehensive advisor, underwriter and investor to GSL, leveraging the RILY platform to position the company for long term success Common Stock Baby Bond & Baby Bond ATM Preferred Stock ATM December 2019 • $75,000,000 8.75% Series B Cumulative R e d ee m a b l e P e r p e t u a l Preferred Stock ATM Sole Agent B. Riley Financial at a Glance B. Riley Securities Financial Consulting Liquidation Wealth Communications Targus Brands Principal Investing 1 5

Creating a Diversified, Comprehensive Platform • M&A advisory • Equity capital markets • Research coverage • Share buybacks • Corporate access • ATMs & CEFs • Debt capital markets • SPAC IPO & advisory • Fixed income • Restructuring & r e c a p i t a li z a t i o ns • Private markets T e c hn ol o g y, Media & Telecom C o ns u m e r Ge n e r a li s t • M&A advisory • Burgeoning equity capital markets • Small - cap research coverage • Share buybacks • Co r p o r a t e a cc e ss 2015 Capabilities 2023 Capabilities ~40 Senior P r o d u c e r s (1) (1) Producers include investment banking calling officers, sales traders and publishing research analysts Bu s i n e ss Services Business & F i n a n c i a l Services B. Riley Financial at a Glance B. Riley Securities Financial Consulting Liquidation Wealth Communications Targus Brands Principal Investing 16 D i v e r s i f ie d Industrials Energy & Natural Resources Healthcare Real E s t a te G e n e r a li s t Technology, Media & Telecom C on s u m e r >130 Senior P r o d u c e r s (1)
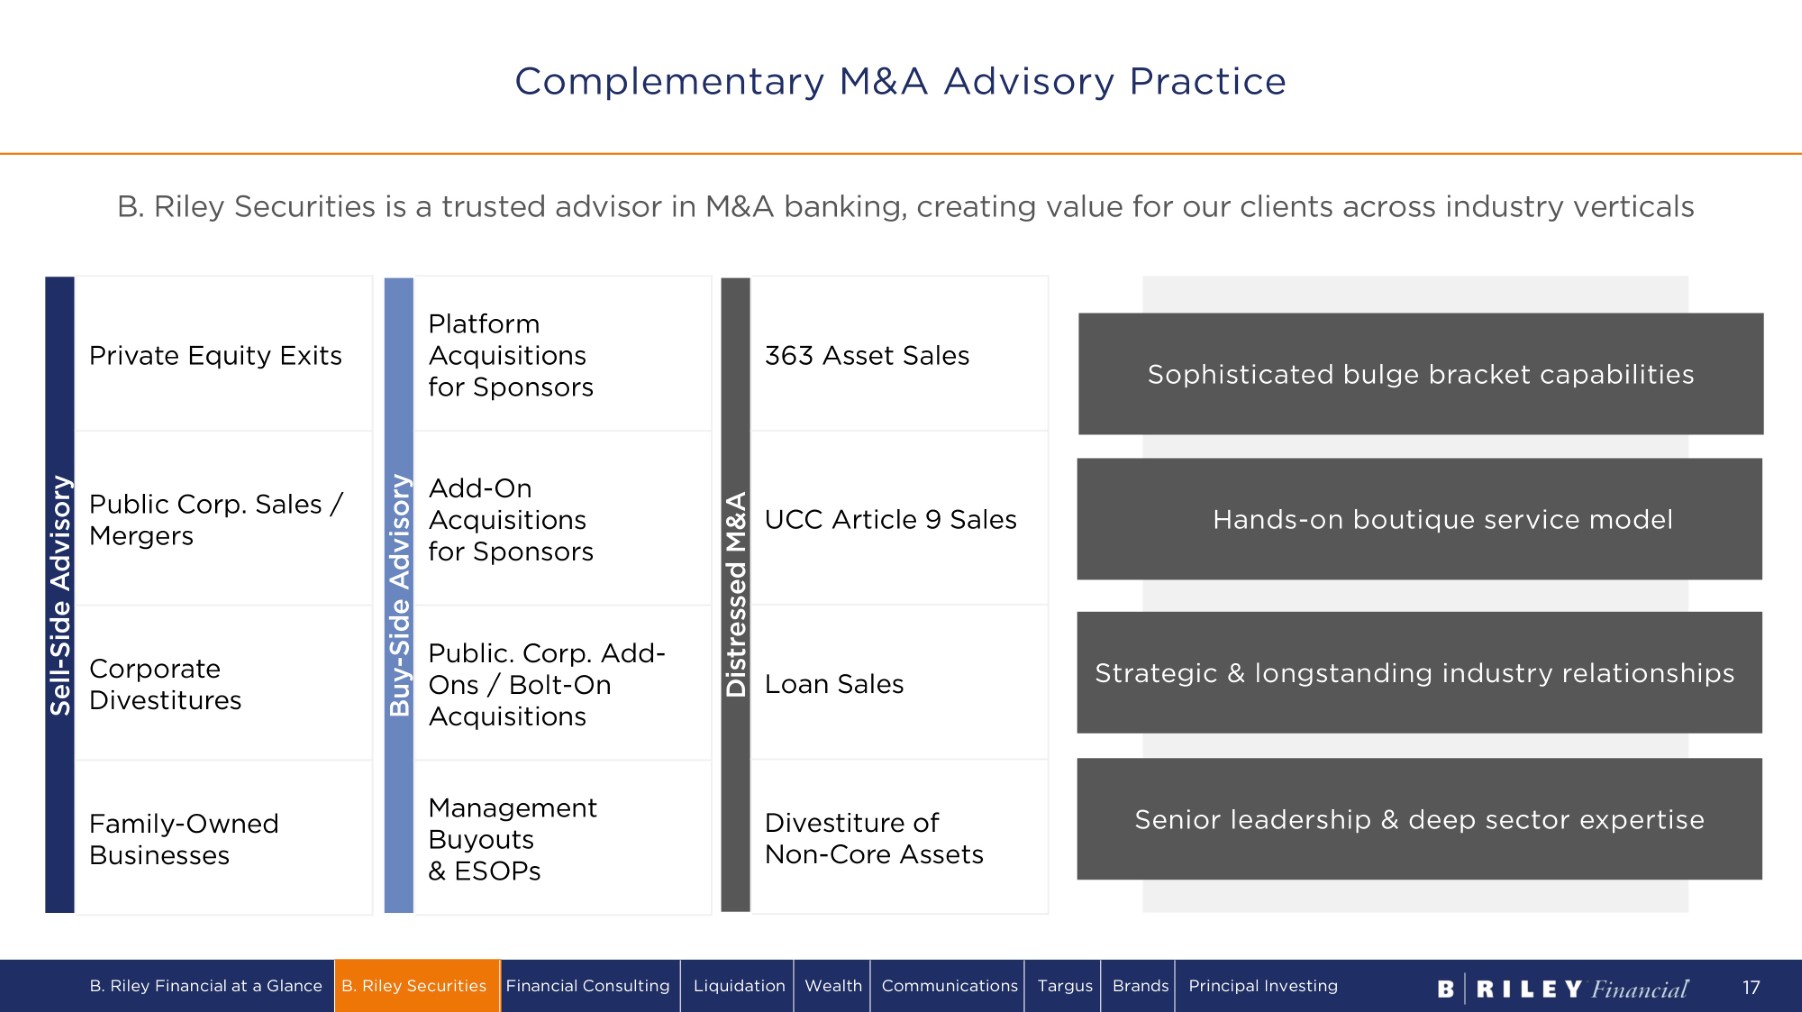
B. Riley Securities is a trusted advisor in M&A banking, creating value for our clients across industry verticals Private Equity Exits Sell - Side Advisory Public Corp. Sales / Mergers Corporate D i v e s t i tu r es F a m il y - O w n e d Businesses 363 Asset Sales Distressed M&A Platform Acquisitions for Sponsors Buy - Side Advisory UCC Article 9 Sales Add - On Acquisitions for Sponsors Loan Sales Public. Corp. Add - Ons / Bolt - On Acquisitions Divestiture of Non - Core Assets M a n ag emen t Buyouts & ESOPs Hands - on boutique service model Strategic & longstanding industry relationships Senior leadership & deep sector expertise Sophisticated bulge bracket capabilities Complementary M&A Advisory Practice B. Riley Financial at a Glance B. Riley Securities Financial Consulting Liquidation Wealth Communications Targus Brands Principal Investing 17

B. Riley Securities is uniquely positioned to solve complex capital needs across the entire capital structure Diverse transactional experience Longstanding relationships with key capital providers Innovative, creative & flexible private capital solutions Seamless & efficient facilitation of transactions Robust Private Markets Capabilities Growth Equity / Pre - IPO Private P la c ements Refinancings / Recaps T r a n s act i on T y p es Turnaround / Bridge Loans L e v e r ag ed Buyouts M a n ag emen t Buyouts A c q u i s i t io n Financing Restructurings inc. Plans of Reorganization B. Riley Financial at a Glance B. Riley Securities Financial Consulting Liquidation Wealth Communications Targus Brands Principal Investing 18 M e zz a n i ne Debt Asset Based Loans Security Types Private C o n v ert i bl e Debt Senior Secured Term Loans Private P r e f er r ed Stock Second Lien Loans Exit Financing DIP Financing

Top Small Cap Underwriters Trailing 3 - Year 2019 (1) % Lead No. $MM Bookrunner Rank 69% 143 $7 , 711 . 1 Morgan Stanley 1 40% 134 $5,509.0 JPMorgan 2 39% 101 $4,628.8 Goldman Sachs 3 29% 104 $4 ,2 11 . 7 Citi 4 33% 97 $3,171.9 BofA Securities 5 32% 93 $3,065.0 Barclays 6 34% 91 $ 3, 0 3 4 . 7 UBS 7 28% 144 $2,854.2 Stifel 8 40% 62 $2,687.8 Credit Suisse 9 24% 104 $2,118.2 Piper Sandler 10 28% 112 $1 ,9 71 . 8 R aym on d J ames 11 6% 77 $1,682.0 RBC Capital Markets 12 12% 60 $1,607.6 Deutsche Bank 13 20% 56 $1 , 544 . 5 J e f fe r i es LL C 14 14% 44 $1 , 10 8.4 Wells Fargo 15 19% 105 $977.7 B Riley Securities 16 16% 38 $ 9 05 . 1 Wells Fargo 17 21% 47 $857.8 Stephens 18 9% 54 $7 9 5 . 1 Robert W Baird & Co 19 11% 62 $7 68.3 William Blair 20 Top Small Cap Underwriters Trailing 3 - Year 2021 (1) % Lead No. $MM Bookrunner Rank 57% 98 $4 , 740 . 1 Morgan Stanley 1 51% 90 $4 , 4 26.2 JPMorgan 2 34% 94 $3,868.5 BofA Securities 3 45% 73 $3,824.8 Goldman Sachs 4 36% 64 $2,678.8 Citi 5 35% 63 $ 2, 4 36.5 Credit Suisse 6 40% 96 $ 2 , 2 03 . 3 B Riley Securities 7 38% 61 $2,134.8 J e f fe r i es LL C 8 21% 109 $2,065.7 Stifel 9 28% 60 $1,982.4 Barclays 10 28% 54 $1,350.1 Wells Fargo 11 17% 84 $1,290.1 R aym on d J ames 12 10% 58 $1 , 0 58.0 William Blair 13 16% 37 $ 9 04 . 0 RBC Capital Markets 14 7% 41 $ 8 55 . 7 UBS 15 25% 84 $ 8 0 9.5 Roth Capital Partners 16 39% 41 $ 8 07 . 5 Oppenheimer 17 10% 29 $7 36. 7 Deutsche Bank 18 18% 39 $705.3 BMO Capital Markets 19 7% 55 $ 68 5 .0 JMP Securities LLC 20 Top Small Cap Underwriters Trailing 3 - Year 3Q23 (1) % Lead No. $MM Bookrunner Rank 60% 63 $3,452.5 JPMorgan 1 45% 76 $3,014.7 BofA Securities 2 51% 63 $2,725.8 Morgan Stanley 3 44% 50 $2,309.3 Goldman Sachs 4 44% 81 $2,216.7 B Riley Securities 5 35% 57 $1,888.4 J e f fe r i es LL C 6 18% 83 $1,574.6 Stifel 7 28% 39 $1,443.6 Barclays 8 31% 45 $1,222.1 Citi 9 15% 40 $870.8 William Blair 10 22% 37 $852.1 Wells Fargo 11 15% 53 $739.8 R aym on d J ames 12 18% 33 $729.5 RBC Capital Markets 13 30% 20 $614.7 Credit Suisse 14 30% 30 $611.6 BMO Capital Markets 15 37% 30 $593.6 Oppenheimer 16 21% 67 $592.9 Roth Capital Partners 17 14% 42 $582.9 Piper Sandler 18 7% 28 $581.1 UBS 19 21% 28 $559.8 TD Securities 20 BRS ranks in the top 5 of small - cap un d e r w r i t e r s since 2022 ( 1 ) (1) Source: Dealogic. Representative of trailing 3 - year underwritten offerings as of 12/31/19, 12/31/21 and 9/30/23, respectively. Deal Type = IPO, FO, Rank Eligible. SEC registered. Exchange Nationality = USA. Market Cap. $100MM - $1.5B. Deal Price >= $1.00. Excludes SPAC IPOs and Healthcare transactions. BRS breaks into the top 20 small - cap underwriters in 2019 (1) Market Share Ascent in Equity Capital Markets B. Riley Financial at a Glance B. Riley Securities Financial Consulting Liquidation Wealth Communications Targus Brands Principal Investing 19
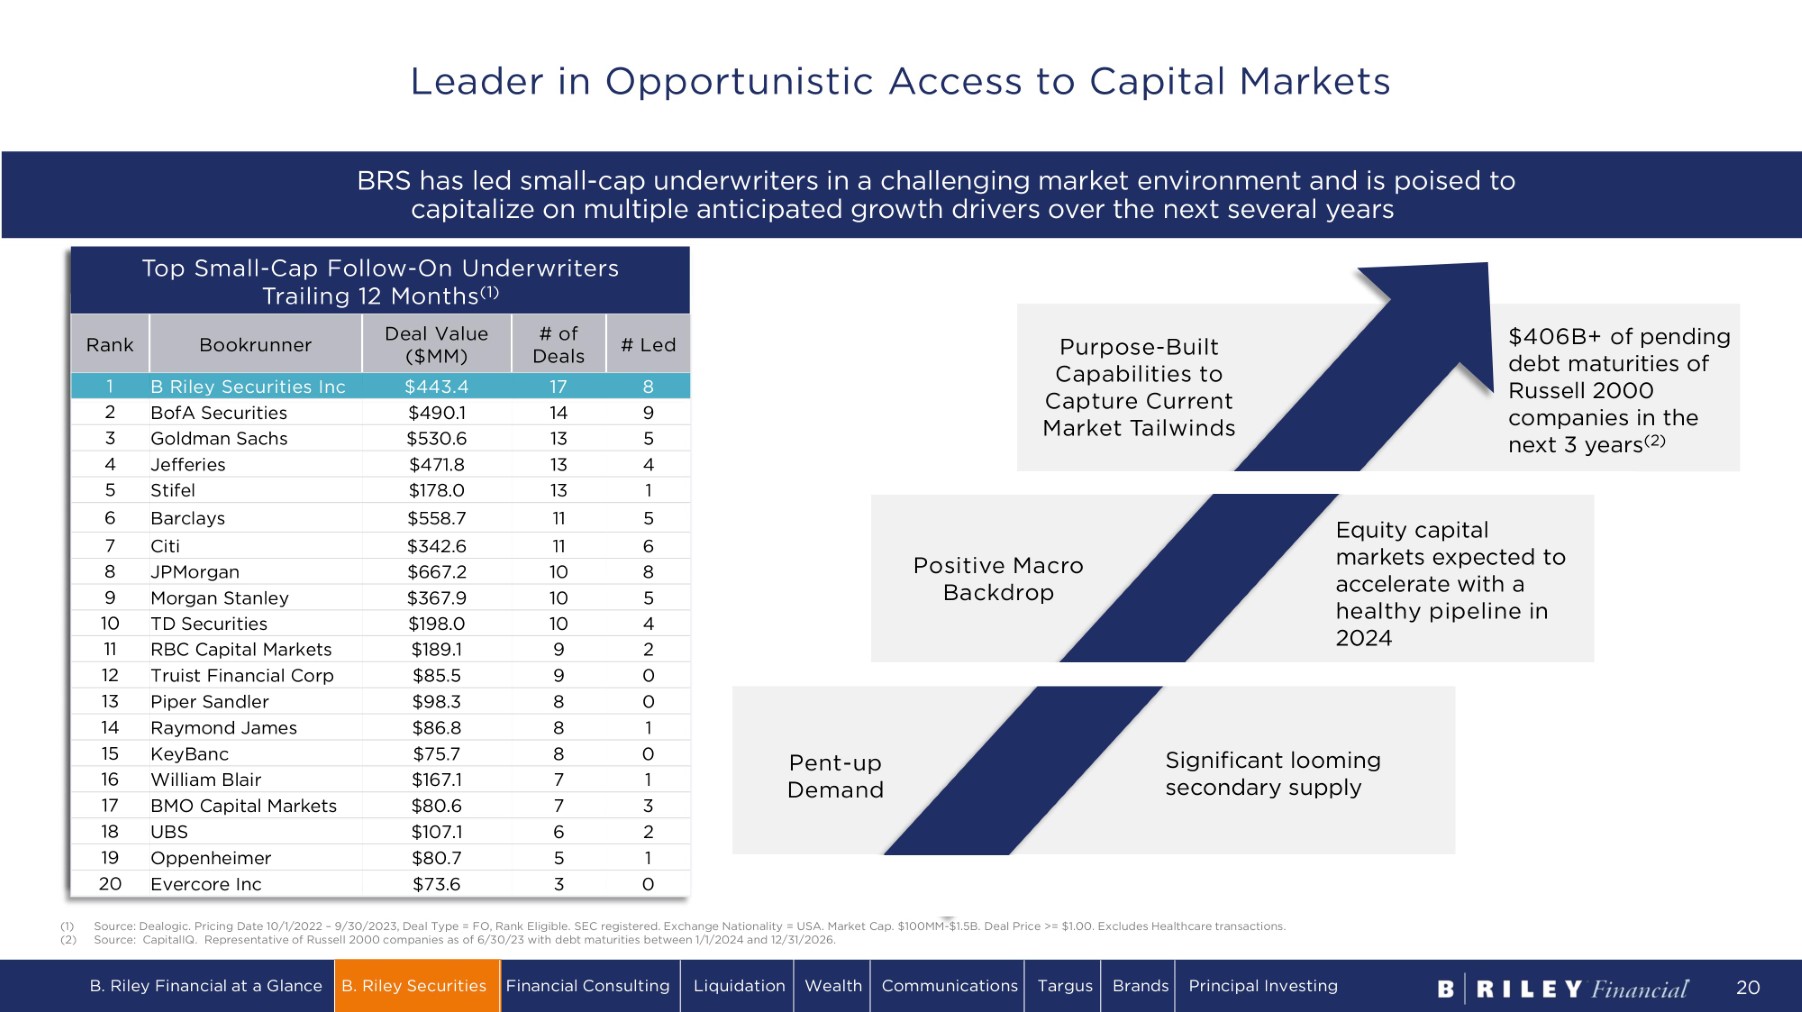
Top Small - Cap Underwriters Trailing 12 Months (1) R ank B oo k r un ne r Deal Value ($MM) # of D e a l s # Led 1 B Riley Securities $ 44 3 . 4 17 8 2 S t if el $ 2 8 0 . 3 16 1 3 BofA Securities $ 51 3. 5 15 9 4 Roth Capital Partners $8 6. 7 15 2 5 Goldman Sachs $ 6 0 4 . 0 14 5 6 B ar c lay s $ 66 0 . 2 1 3 5 7 J ef f er ies $ 4 7 1.8 1 3 4 8 C i t i $ 3 76 . 8 12 6 9 J P M o r g a n $74 0 . 6 11 8 10 Raymond James $ 16 2. 3 11 1 11 Truist Financial Corp $ 111. 6 11 0 12 Morgan Stanley $ 3 67. 9 1 0 5 13 RBC Capital Markets $ 2 0 2. 9 1 0 2 14 T D C owe n $ 19 8 . 0 1 0 4 15 Piper Sandler $ 11 0 . 6 9 0 16 BMO Capital Markets $8 7. 6 8 3 17 K ey B an c $ 7 5 . 7 8 0 18 William Blair $ 16 7 . 1 7 1 19 U B S $ 1 0 7 . 1 6 2 20 O pp en h ei m er $80 . 7 5 1 Purpose - Built Capabilities to Capture Current Market Tailwinds Pent - up Dem a n d Positive Macro Backdrop $406B+ of pending debt maturities of Russell 2000 companies in the next 3 years (2) Significant looming secondary supply Equity capital markets expected to accelerate with a healthy pipeline in 2024 Leader in Opportunistic Access to Capital Markets BRS has led small - cap underwriters in a challenging market environment and is poised to capitalize on multiple anticipated growth drivers over the next several years (1) Source: Dealogic. Pricing Date 10/1/2022 – 9/30/2023, Deal Type = FO, Rank Eligible. SEC registered. Exchange Nationality = USA. Market Cap. $100MM - $1.5B. Deal Price >= $1.00. Excludes Healthcare transactions. (2) Source: CapitalIQ. Representative of Russell 2000 companies as of 6/30/23 with debt maturities between 1/1/2024 and 12/31/2026. BofA Securities B. Riley Financial at a Glance B. Riley Securities Financial Consulting Liquidation Wealth Communications Targus Brands Principal Investing 20 $ 4 9 0 . 1 14 9 Top Small - Cap Follow - On Underwriters Trailing 12 Months (1) # Led # of D ea l s Deal Value ($MM) Bookrunner Rank 8 17 $443.4 B Riley Securities Inc 1 2 5 13 $530.6 Goldman Sachs 3 4 13 $471.8 Jefferies 4 1 13 $178.0 Stifel 5 5 11 $558.7 Barclays 6 6 11 $342.6 Citi 7 8 10 $667.2 JPMorgan 8 5 10 $367.9 Morgan Stanley 9 4 10 $198.0 TD Securities 10 2 9 $189.1 RBC Capital Markets 11 0 9 $85.5 Truist Financial Corp 12 0 8 $98.3 Piper Sandler 13 1 8 $86.8 Raymond James 14 0 8 $75.7 KeyBanc 15 1 7 $167.1 William Blair 16 3 7 $80.6 BMO Capital Markets 17 2 6 $107.1 UBS 18 1 5 $80.7 Oppenheimer 19 0 3 $73.6 Evercore Inc 20
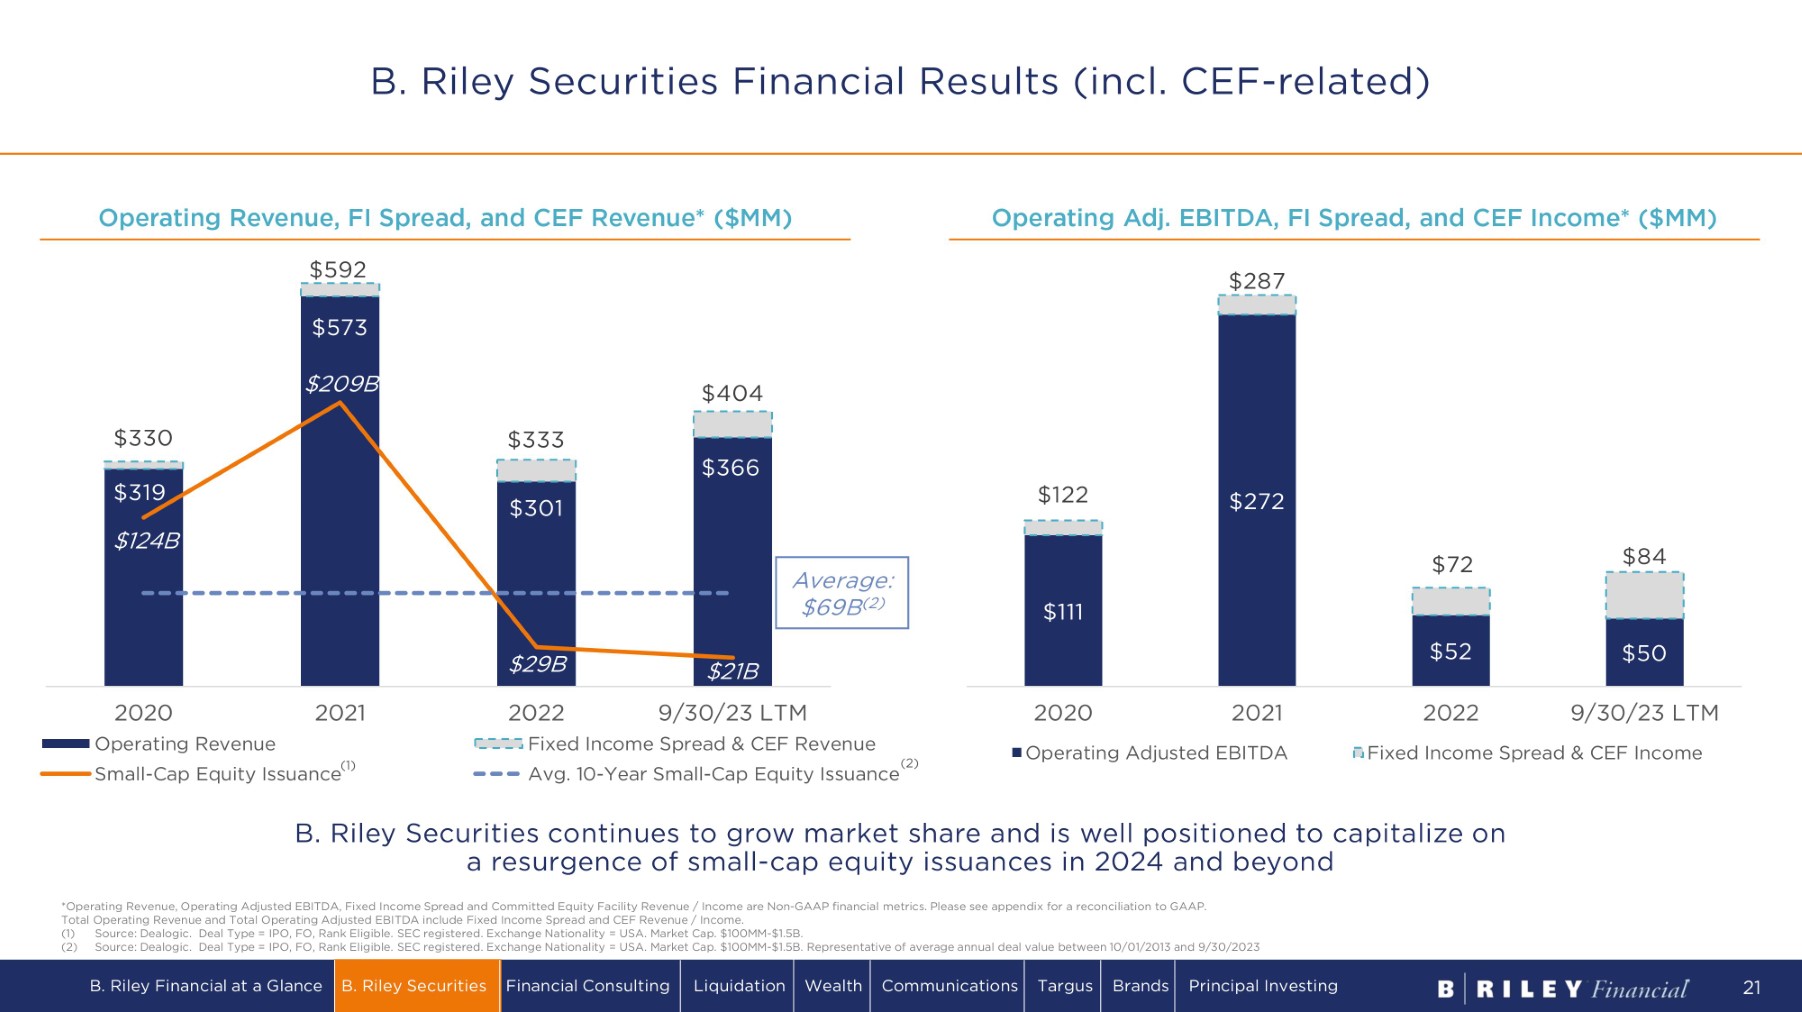
Operating Revenue, FI Spread, and CEF Revenue* ($MM) Operating Adj. EBITDA, FI Spread, and CEF Income* ($MM) *Operating Revenue, Operating Adjusted EBITDA, Fixed Income Spread and Committed Equity Facility Revenue / Income are Non - GAAP financial metrics. Please see appendix for a reconciliation to GAAP. Total Operating Revenue and Total Operating Adjusted EBITDA include Fixed Income Spread and CEF Revenue / Income. (1) Source: Dealogic. Deal Type = IPO, FO, Rank Eligible. SEC registered. Exchange Nationality = USA. Market Cap. $100MM - $1.5B. (2) Source: Dealogic. Deal Type = IPO, FO, Rank Eligible. SEC registered. Exchange Nationality = USA. Market Cap. $100MM - $1.5B. Representative of average annual deal value between 10/01/2013 and 9/30/2023 B. Riley Securities continues to grow market share and is well positioned to capitalize on a resurgence of small - cap equity issuances in 2024 and beyond $ 3 1 9 $301 $366 $ 330 $ 592 $ 333 $ 4 0 4 $ 1 2 4 B $573 $ 2 0 9 B $29B $21B 2022 9/30/23 LTM Fixed Income Spread & CEF Revenue 2020 2021 Operating Revenue Small - Cap Equity Issuance (1) Avg. 10 - Year Small - Cap Equity Issuance (2) $111 $272 $ 52 $ 5 0 $ 1 2 2 $ 287 $72 $ 8 4 2020 2021 Operating Adjusted EBITDA 2022 9/30/23 LTM Fixed Income Spread & CEF Income Average: $69B (2) B. Riley Securities Financial Results (incl. CEF - related) B. Riley Financial at a Glance B. Riley Securities Financial Consulting Liquidation Wealth Communications Targus Brands Principal Investing 21

03 FINANCIAL CONSULTING

Appraisal & Valuation C o m p li a n c e , Risk & Resilience Forensic Accounting & Litigation Support R e s t r u c t u r i ng & Turnaround Management Operations M a n a g e m e nt T r an s a c t i on Support (including QoE) Interim M a n a g e m e nt & Executive Search Real Estate ▪ Provide clients a full continuum of specialty financial advisory services and solutions ▪ Unprecedented combination of highly specialized capabilities and seasoned professionals with deep industry expertise ▪ Trusted partner to attorneys, lenders, private equity sponsors, and companies, helping to resolve critical matters at all stages of a company's business life cycle o National go - to firm for valuation and appraisal services for the asset - based lending community o Forensic accounting and litigation support for bet - the - company, big ticket litigation o Restructuring and turnaround services for complex and high - profile matters from Wall Street to Main Street ▪ Immense opportunity for continued organic growth within the consulting service practice and broader B. Riley Financial Primary Service Lines Bringing Clarity to Complex Business Challenges Financial Consulting Overview B. Riley Financial at a Glance B. Riley Securities Financial Consulting Liquidation Wealth Communications Targus Brands Principal Investing 23
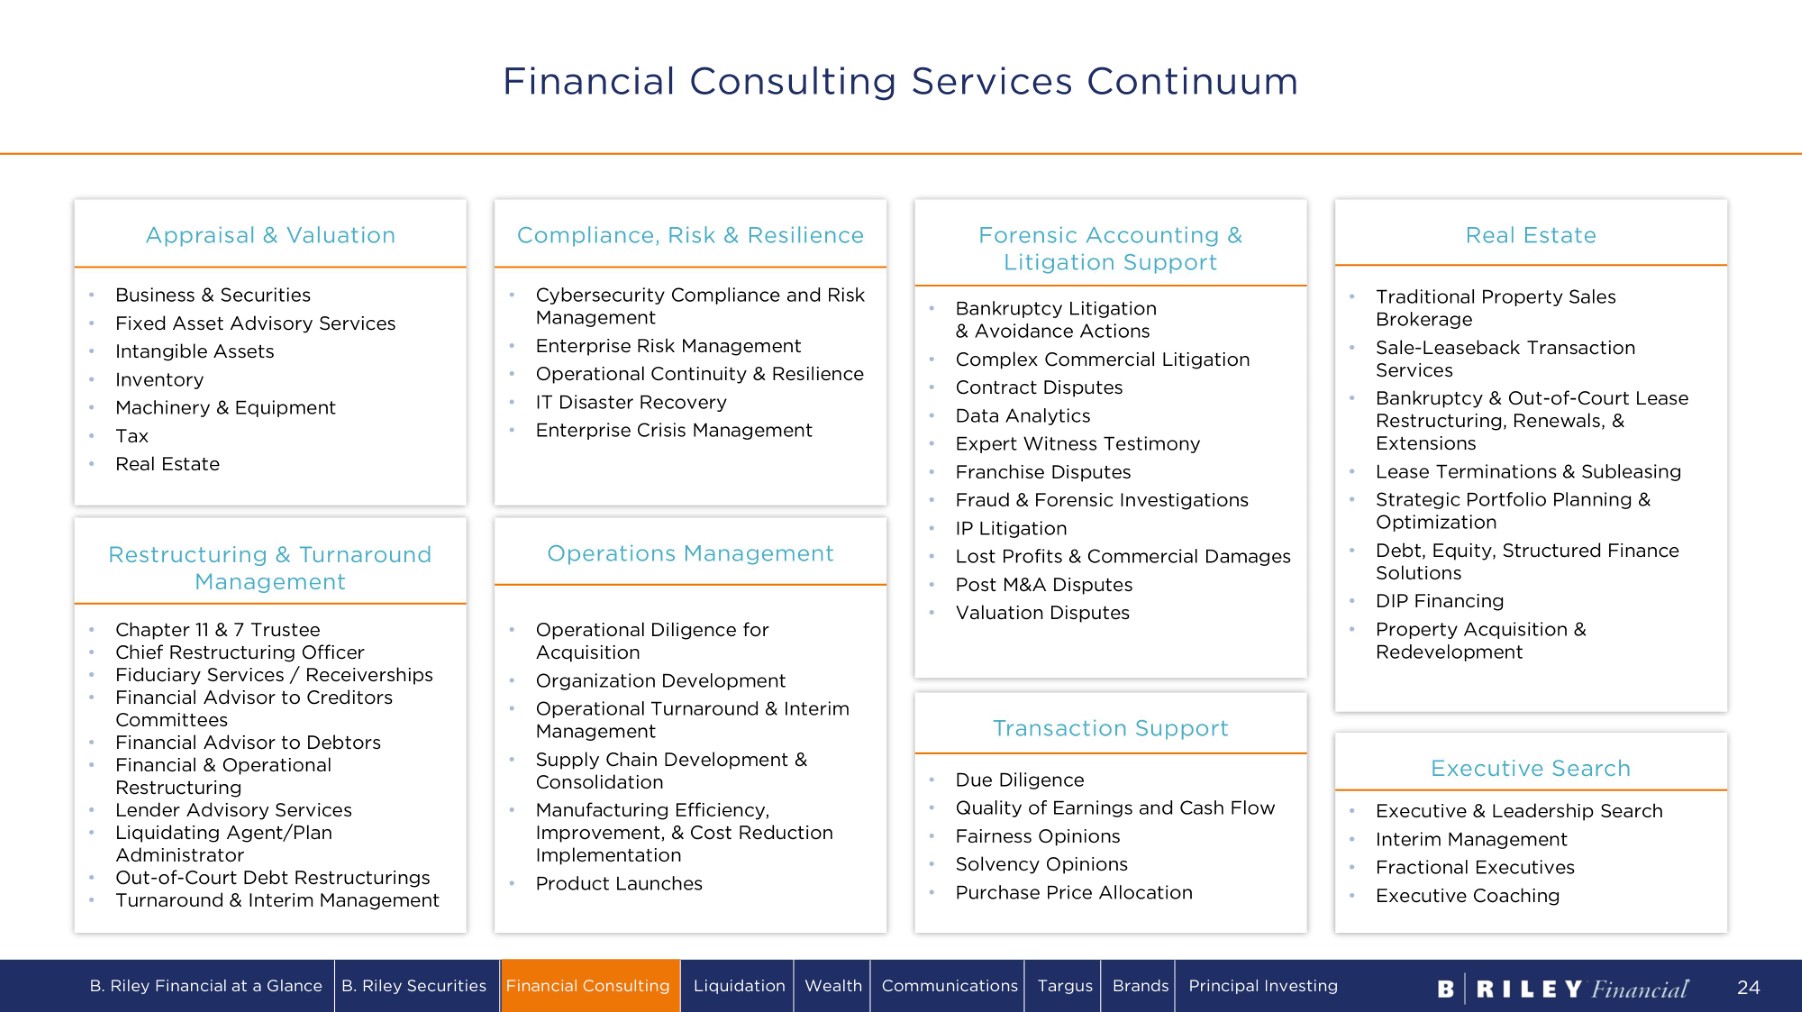
Financial Consulting Services Continuum • Business & Securities • Fixed Asset Advisory Services • Intangible Assets • Inventory • Machinery & Equipment • Tax • Real Estate Appraisal & Valuation • C h ap t e r 11 & 7 T r u s t e e • Chief Restructuring Officer • Fiduciary Services / Receiverships • Financial Advisor to Creditors Committees • Financial Advisor to Debtors • Financial & Operational Restructuring • Lender Advisory Services • Liquidating Agent/Plan Administrator • Out - of - Court Debt Restructurings • Turnaround & Interim Management Restructuring & Turnaround Management • Cybersecurity Compliance and Risk Management • Enterprise Risk Management • Operational Continuity & Resilience • IT Disaster Recovery • Enterprise Crisis Management Compliance, Risk & Resilience • Operational Diligence for Acquisition • Organization Development • Operational Turnaround & Interim Management • Supply Chain Development & Consolidation • Manufacturing Efficiency, Improvement, & Cost Reduction Implementation • Product Launches Operations Management • Bankruptcy Litigation & Avoidance Actions • Complex Commercial Litigation • Contract Disputes • Data Analytics • Expert Witness Testimony • Franchise Disputes • Fraud & Forensic Investigations • IP Litigation • Lost Profits & Commercial Damages • Post M&A Disputes • Valuation Disputes Forensic Accounting & Litigation Support • Due Diligence • Quality of Earnings and Cash Flow • Fairness Opinions • Solvency Opinions • Purchase Price Allocation Transaction Support • Executive & Leadership Search • Interim Management • Fractional Executives • Executive Coaching Executive Search • Traditional Property Sales Brokerage • Sale - Leaseback Transaction Services • Bankruptcy & Out - of - Court Lease Restructuring, Renewals, & Extensions • Lease Terminations & Subleasing • Strategic Portfolio Planning & Optimization • Debt, Equity, Structured Finance Solutions • DIP Financing • Property Acquisition & Redevelopment Real Estate B. Riley Financial at a Glance B. Riley Securities Financial Consulting Liquidation Wealth Communications Targus Brands Principal Investing 24

Platform Built through Organic and Inorganic Growth Acquired GlassRatner, a leading national financial advisory services firm focused on Bankruptcy & Turnaround Management, Forensic Accounting and Litigation Support, and Financial Due Diligence ▪ Acquired corporate division of Farber, establishing foothold in Canadian restructuring market and adding Executive Search practice ▪ Acquired Anderson Bauman Tourtellot Vos (ABTV), expanding market leadership in Southeast/N. Carolina ▪ Acquired Crawford & Winiarski (C&W), expanding forensic consulting in Detroit/Midwest Acquired Appraisal Division through merger with Great American Group ▪ Formed dedicated Real Estate brokerage and advisory division, focused on distressed real estate ▪ Added Alderney Advisors, an Automotive Restructuring firm, establishing a Detroit restructuring office ▪ Added Operations Management practice through acquisition of Anchor Resource Management ▪ Established Mexico presence; enhanced LatAm, xBorder, and South Florida practices ▪ Established Compliance, Risk, & Resilience consulting practice in 2021 ▪ Achieved record revenue in the Appraisal Division in 2022 2024+ 2023 2020 - 2022 2018 2014 Immense opportunity for continued organic growth within the consulting service practice and the larger B. Riley Financial platform B. Riley Financial at a Glance B. Riley Securities Financial Consulting Liquidation Wealth Communications Targus Brands Principal Investing 25 ▪ Expand Interim Management & Executive Search ▪ Strong Corporate Bankruptcy Outlook ▪ Continue to Deepen Industry Vertical Expertise

APRIL 2023 Financial Advisor to the Official Committee of Unsecured Creditors 429 - Bed Long Island Continuing Care Retirement Community MAY 2023 Chief Restructuring Officer Multi - Location Indoor Vertical Farming Grower/Distributor MAY 2023 Financial Advisor to the Official Committee of Unsecured Creditors Healthcare Technology Company Providing Online Prescriptions and Medical Services For Women JULY 2023 Chief Restructuring Officer Real Estate Development JULY 2023 Chief Restructuring Officer Burger King Franchisee (93 Restaurants) AUGUST 2023 Debtor’s Exclusive Real Estate Advisor $65M Bankruptcy Sale 15 - Property Portfolio (626.5 AC / ~5.0M SF) MARCH 2022 Financial Advisor to the Debtor 495 Unit Houston - Based Continuing Care Retirement Community APRIL 2022 Financial Advisor to Company Construction Equipment Rental and Sales MAY 2022 Chief Restructuring Officer Ti e r 1 Aut o m o t i ve , Aer o s p a ce and DOD Supplier DECEMBER 2022 Financial Advisor to the Respirator Committee 3M Subsidiary Involved in Mass Tort Litigation Related to Defective Products FEBRUARY 2023 Financial Advisor to Debtor Retail Energy Provider MARCH 2023 Chief Restructuring Officer Two 45 Unit Assisted Living Memory Care Facilities OCTOBER 2021 Financial Advisor to Senior Secured Creditor Multi - Site Grain Elevator with Soybean Crush OCTOBER 2021 Chief Restructuring Officer Sale of Tahoe Joe’s Steak Houses OCTOBER 2021 Financial Advisor to the Company in Connection with a Sale to Quikrete, Inc. Leading Manufacturer of Concrete Blocks and Masonry Supplies in the Southwest DECEMBER 2021 Chief Restructuring Officer Equipment Sales and Rental DECEMBER 2021 Chief Liquidating Officer Tier 2 Automotive Supplier JANUARY 2022 Financial and Operations Advisor Ti e r 1 Aut o m o t i v e S u ppli er Leading Restructuring Advisor – Representative Assignments B. Riley Financial at a Glance B. Riley Securities Financial Consulting Liquidation Wealth Communications Targus Brands Principal Investing 26
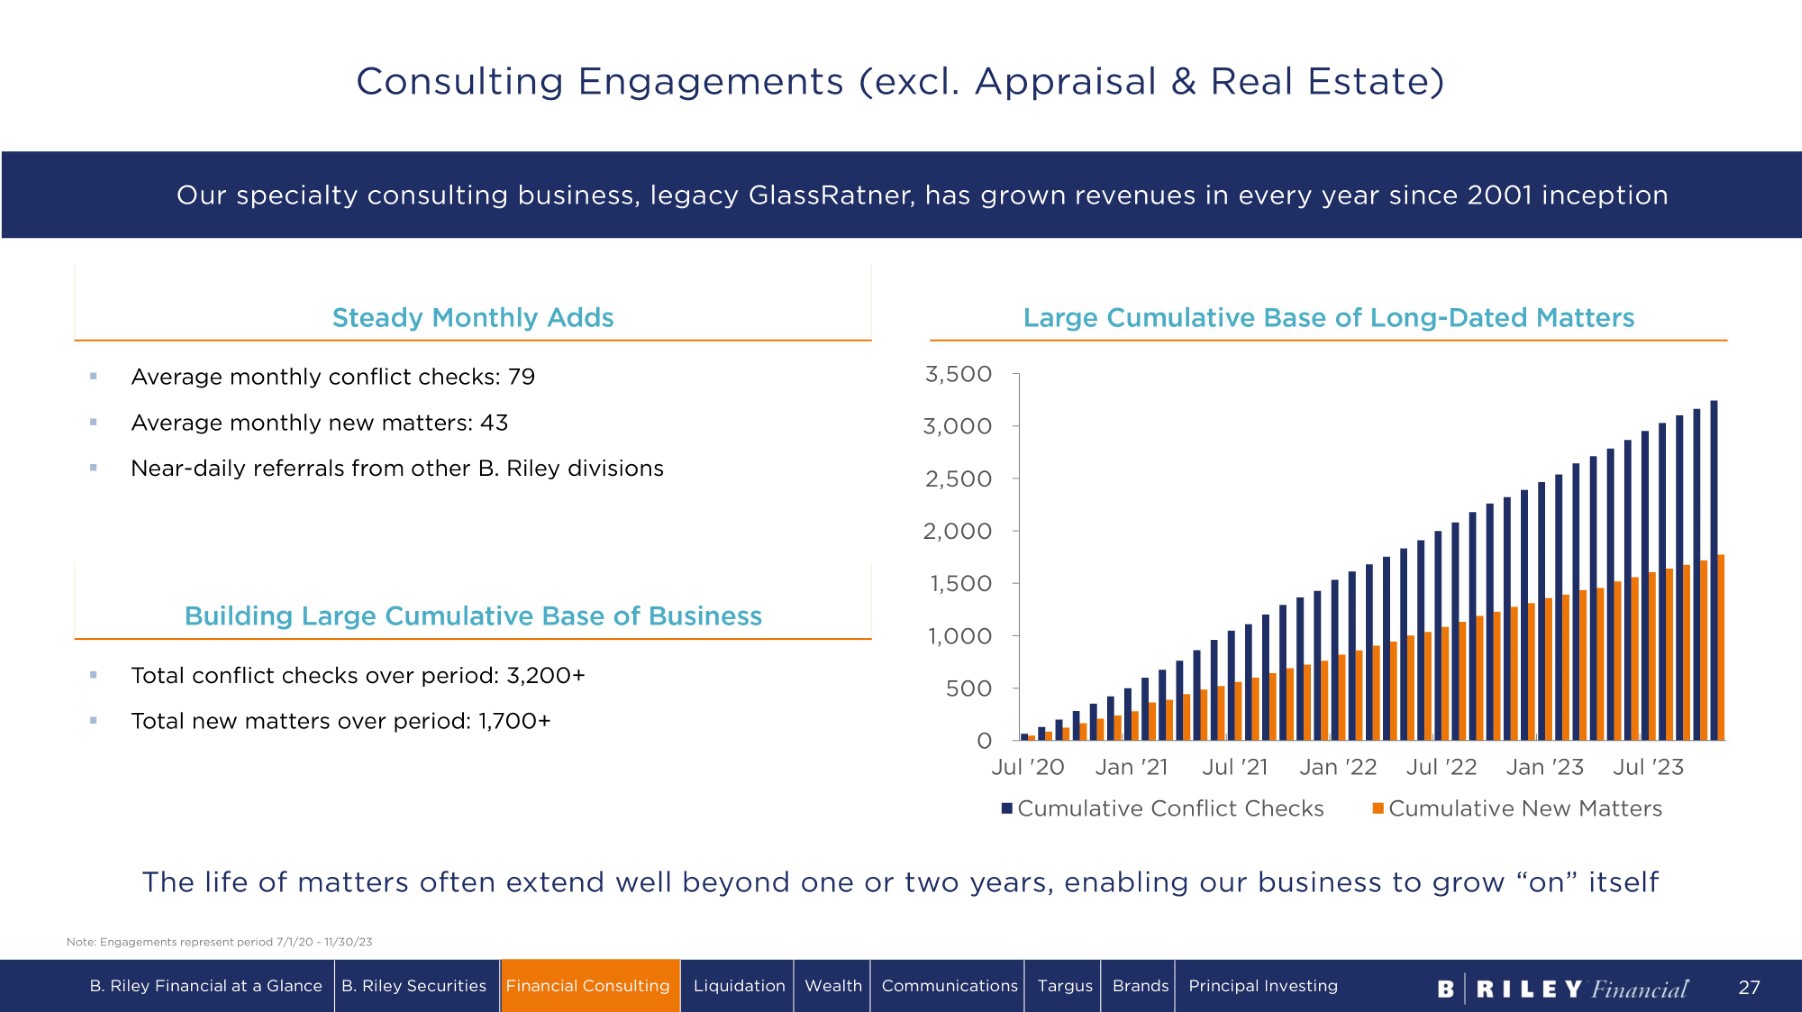
Steady Monthly Adds Large Cumulative Base of Long - Dated Matters Note: Engagements represent period 7/1/20 - 11/30/23 0 Jul '20 Jan '21 Jul '21 5 00 1 ,000 2 ,000 1 ,5 00 2 ,5 00 3 ,0 0 0 3 ,5 00 Jan '22 Jul '22 Jan '23 Jul '23 Cumulative Conflict Checks Cumulative New Matters The life of matters often extend well beyond one or two years, enabling our business to grow “on” itself ▪ Average monthly conflict checks: 79 ▪ Average monthly new matters: 43 ▪ Near - daily referrals from other B. Riley divisions ▪ Total conflict checks over period: 3,200+ ▪ Total new matters over period: 1,700+ Building Large Cumulative Base of Business Our specialty consulting business, legacy GlassRatner, has grown revenues in every year since 2001 inception B. Riley Financial at a Glance B. Riley Securities Financial Consulting Liquidation Wealth Communications Targus Brands Principal Investing 27 Consulting Engagements (excl. Appraisal & Real Estate)
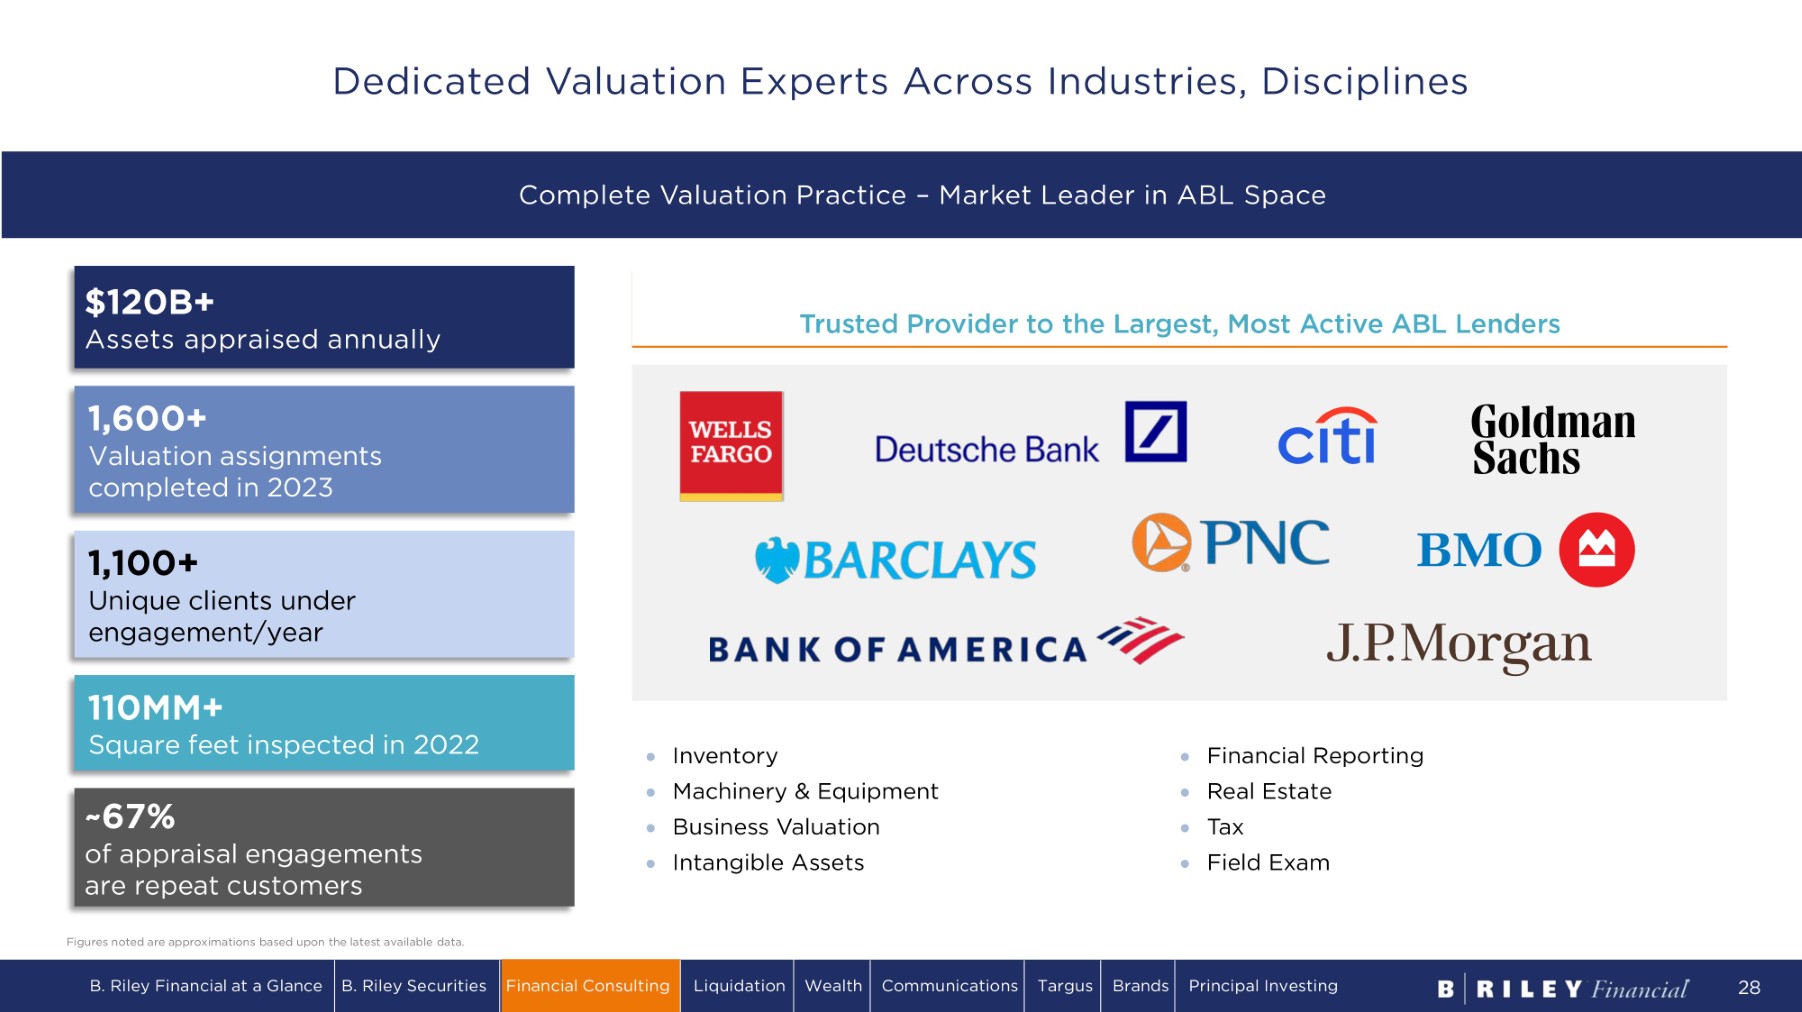
Inventory Machinery & Equipment Business Valuation Intangible Assets Financial Reporting Real Estate Tax Field Exam ~67% of appraisal engagements are repeat customers 1,100+ Unique clients under engagement/year 1,600+ Valuation assignments completed in 2023 110MM+ Square feet inspected in 2022 $120B+ Assets appraised annually Figures noted are approximations based upon the latest available data. Trusted Provider to the Largest, Most Active ABL Lenders Complete Valuation Practice – Market Leader in ABL Space B. Riley Financial at a Glance B. Riley Securities Financial Consulting Liquidation Wealth Communications Targus Brands Principal Investing 28 Dedicated Valuation Experts Across Industries, Disciplines

• One - stop shop for clients, bundling appraisals with services across the B. Riley platform, including financial restructuring, operational improvement, liquidation services, and investment banking • Deep roster of long - tenured industry experts, allowing for true specialization • Trusted provider to blue chip client base on their largest, most critical deals • Engine and beneficiary of near - daily business referrals within the B. Riley ecosystem • Non - cyclical demand for appraisal services drives steady financial performance • Poised to capitalize on current long - term market trends toward direct - and asset - based lending • Supplementing core inventory and machinery appraisal business with expanded capabilities in field exams and corporate valuation services, including business valuation, financial reporting, intangible assets, and real estate valuation Market Leadership in Appraisal Services Drives Steady, Predictable Cash Flows Appraisal Business Highlights B. Riley Financial at a Glance B. Riley Securities Financial Consulting Liquidation Wealth Communications Targus Brands Principal Investing 29

▪ Formed in 2020 in relation to asset disposition assignments and opportunities ▪ Services a broad range of clients and provides our platform with internal real estate expertise ▪ Expanded into property sales & dispositions, sale - leasebacks, lease restructuring, acquisitions, debt capital markets, and real estate advisory, executing on progressively larger engagements since inception ▪ To date has realized/under LOI $2.0B+ in property sales/financing and generated $250MM+ in client lease savings AUGUST 2023 UNITED FURNITURE (UFI) Debtor’s Exclusive Real Estate Advisor $65MM Bankruptcy Sale 15 - Property Portfolio (626.5 AC / ~5.0M SF) AUGUST 2023 RUMBLEON Real Estate Advisor to the Company $49MM Sale - Leaseback 8 - Dealership Portfolio (23.4 Acres / ~208,000 SF) AUGUST 2022 BADCOCK FURNITURE Real Estate Advisor to the Company $268MM Sale - Leaseback 42 - Property Portfolio Retail / DC / Office AUGUST 2022 VVF, LTD. Real Estate Advisor to the Company Manufacturing Portfolio Sale - Leaseback Two Facilities / 1.1MM SF JANUARY 2021 JCPENNEY Debtor’s Exclusive Real Estate Advisor Lease Portfolio Restructuring & Sales 400+ Department Store Portfolio $160MM in Lease Savings Secured DECEMBER 2021 MIDTOWN APARTMENTS Debtor’s Exclusive Real Estate Advisor $104MM Bankruptcy Sale 310 - Unit Student Housing Development Diversified Real Estate Advisory Practice B. Riley Financial at a Glance B. Riley Securities Financial Consulting Liquidation Wealth Communications Targus Brands Principal Investing 30
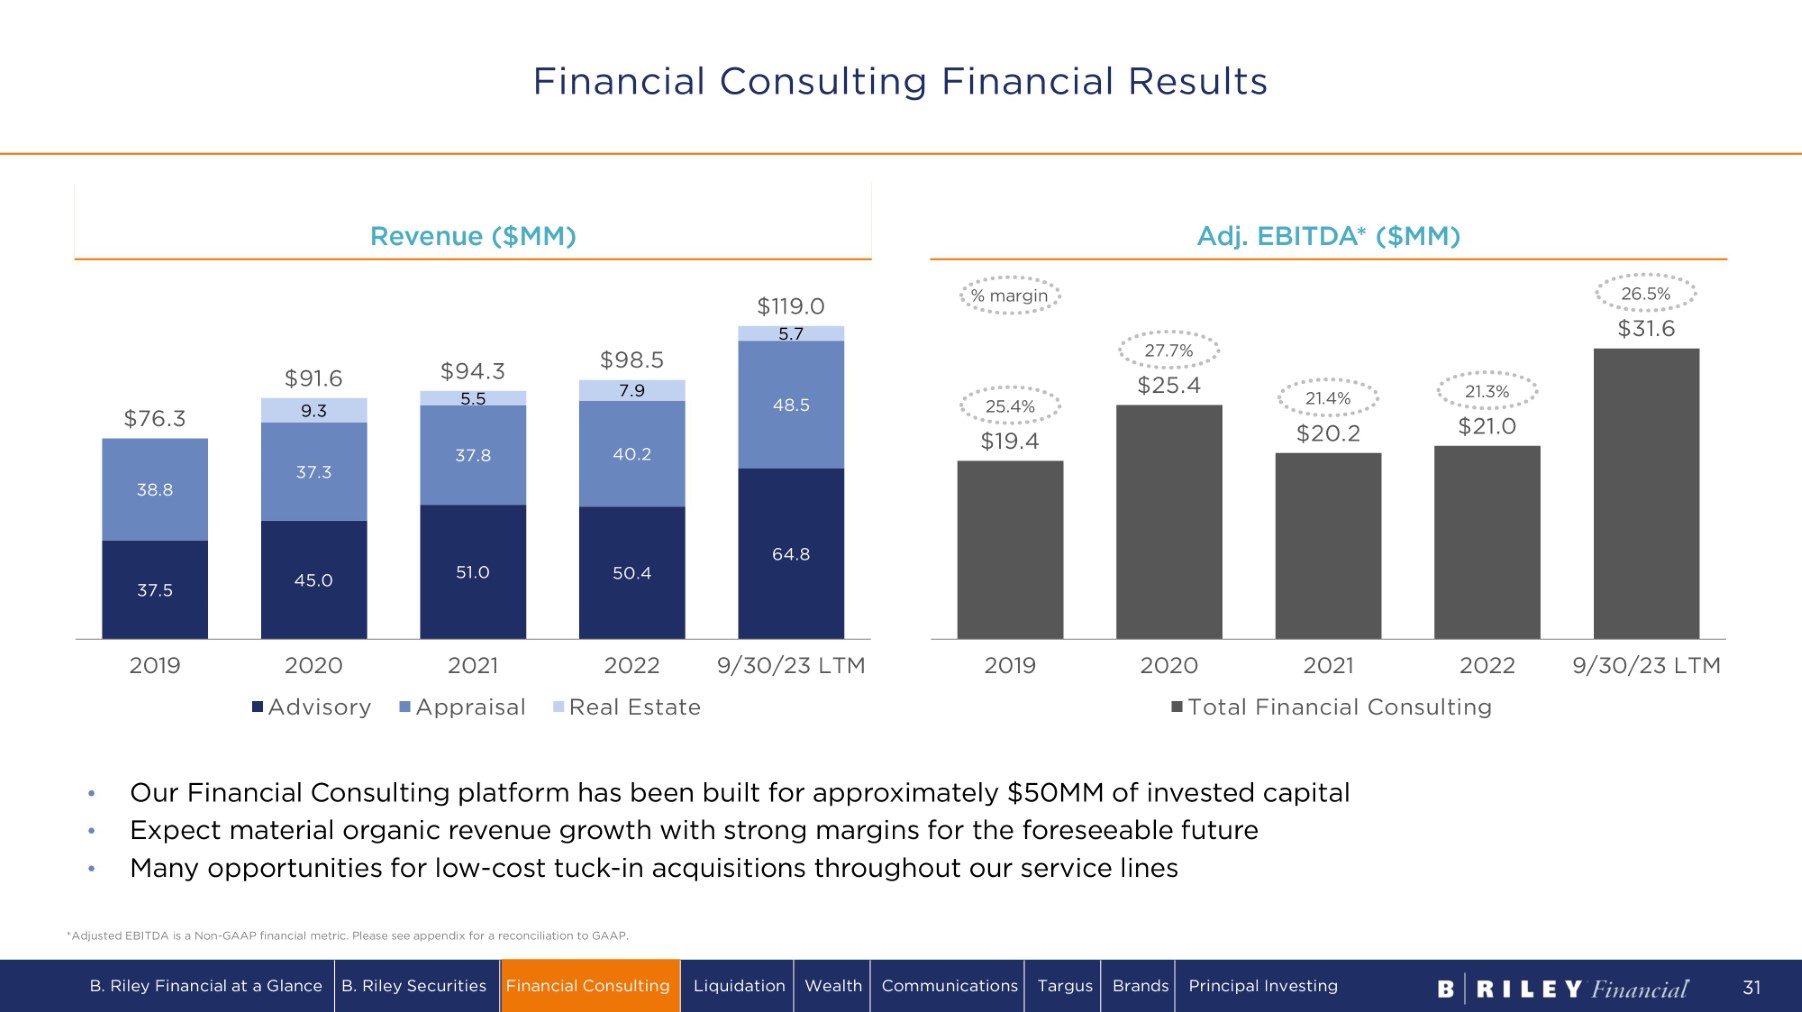
$ 1 9 . 4 $ 2 5 . 4 $ 2 0 . 2 $ 2 1 .0 2 0 1 9 9/30/23 LTM 2 0 20 2 0 21 2 0 22 Total Financial Consulting R e v e n u e ( $ MM) A d j . E B I T D A * ( $ MM ) • Our Financial Consulting platform has been built for approximately $50MM of invested capital • Expect material organic revenue growth with strong margins for the foreseeable future • Many opportunities for low - cost tuck - in acquisitions throughout our service lines *Adjusted EBITDA is a Non - GAAP financial metric. Please see appendix for a reconciliation to GAAP. 2 7 . 7 % 2 1 .4 % 2 1 . 3 % 26.5% $ 3 1 . 6 % m a r g i n 37.5 45.0 5 1 .0 5 0 .4 64.8 38.8 37.3 37.8 40.2 48.5 9.3 5 .5 7.9 5.7 $ 7 6 . 3 $ 9 1 . 6 $ 9 4 . 3 $9 8 . 5 $119.0 2 0 1 9 2020 A d v i s o r y 2021 Appraisal 2022 Real Estate 9/30/23 LTM 25 . 4 % Financial Consulting Financial Results B. Riley Financial at a Glance B. Riley Securities Financial Consulting Liquidation Wealth Communications Targus Brands Principal Investing 31

04 AUCTION AND LIQUIDATION
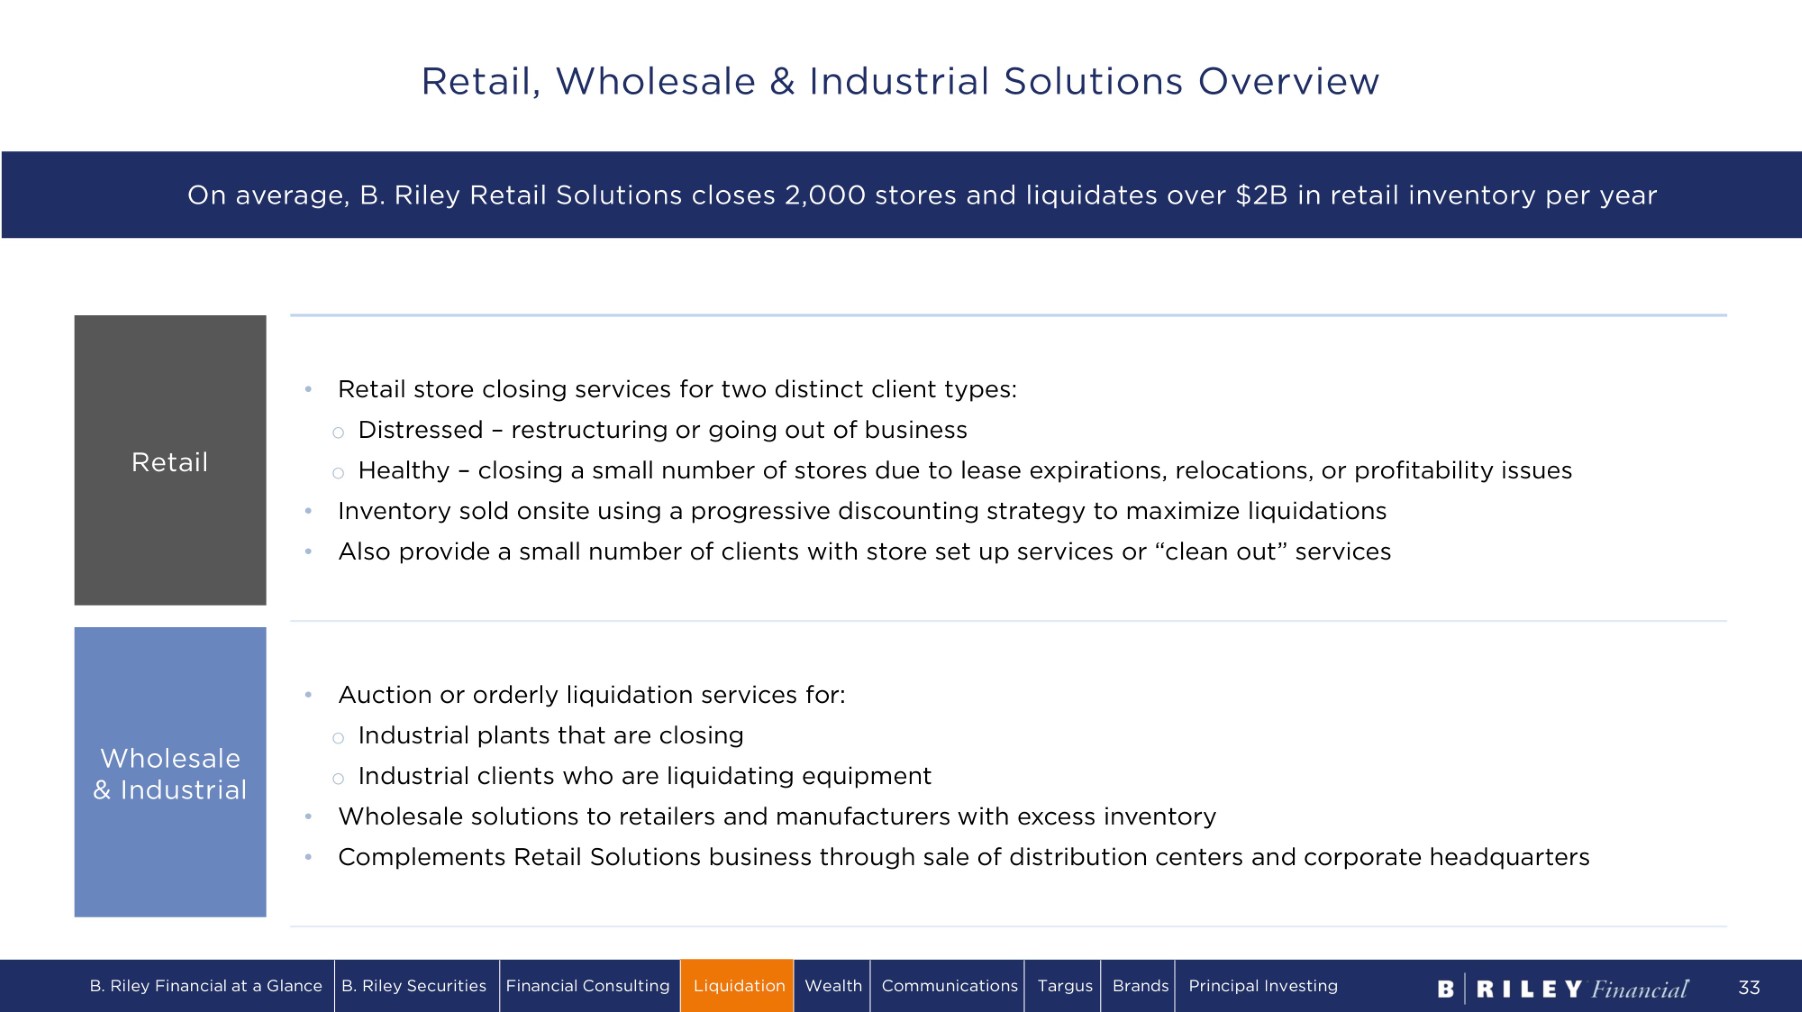
• Retail store closing services for two distinct client types: o Distressed – restructuring or going out of business o Healthy – closing a small number of stores due to lease expirations, relocations, or profitability issues • Inventory sold onsite using a progressive discounting strategy to maximize liquidations • Also provide a small number of clients with store set up services or “clean out” services • Auction or orderly liquidation services for: o Industrial plants that are closing o Industrial clients who are liquidating equipment • Wholesale solutions to retailers and manufacturers with excess inventory • Complements Retail Solutions business through sale of distribution centers and corporate headquarters Retail Wholesale & Industrial On average, B. Riley Retail Solutions closes 2,000 stores and liquidates over $2B in retail inventory per year B. Riley Financial at a Glance B. Riley Securities Financial Consulting Liquidation Wealth Communications Targus Brands Principal Investing 33 Retail, Wholesale & Industrial Solutions Overview
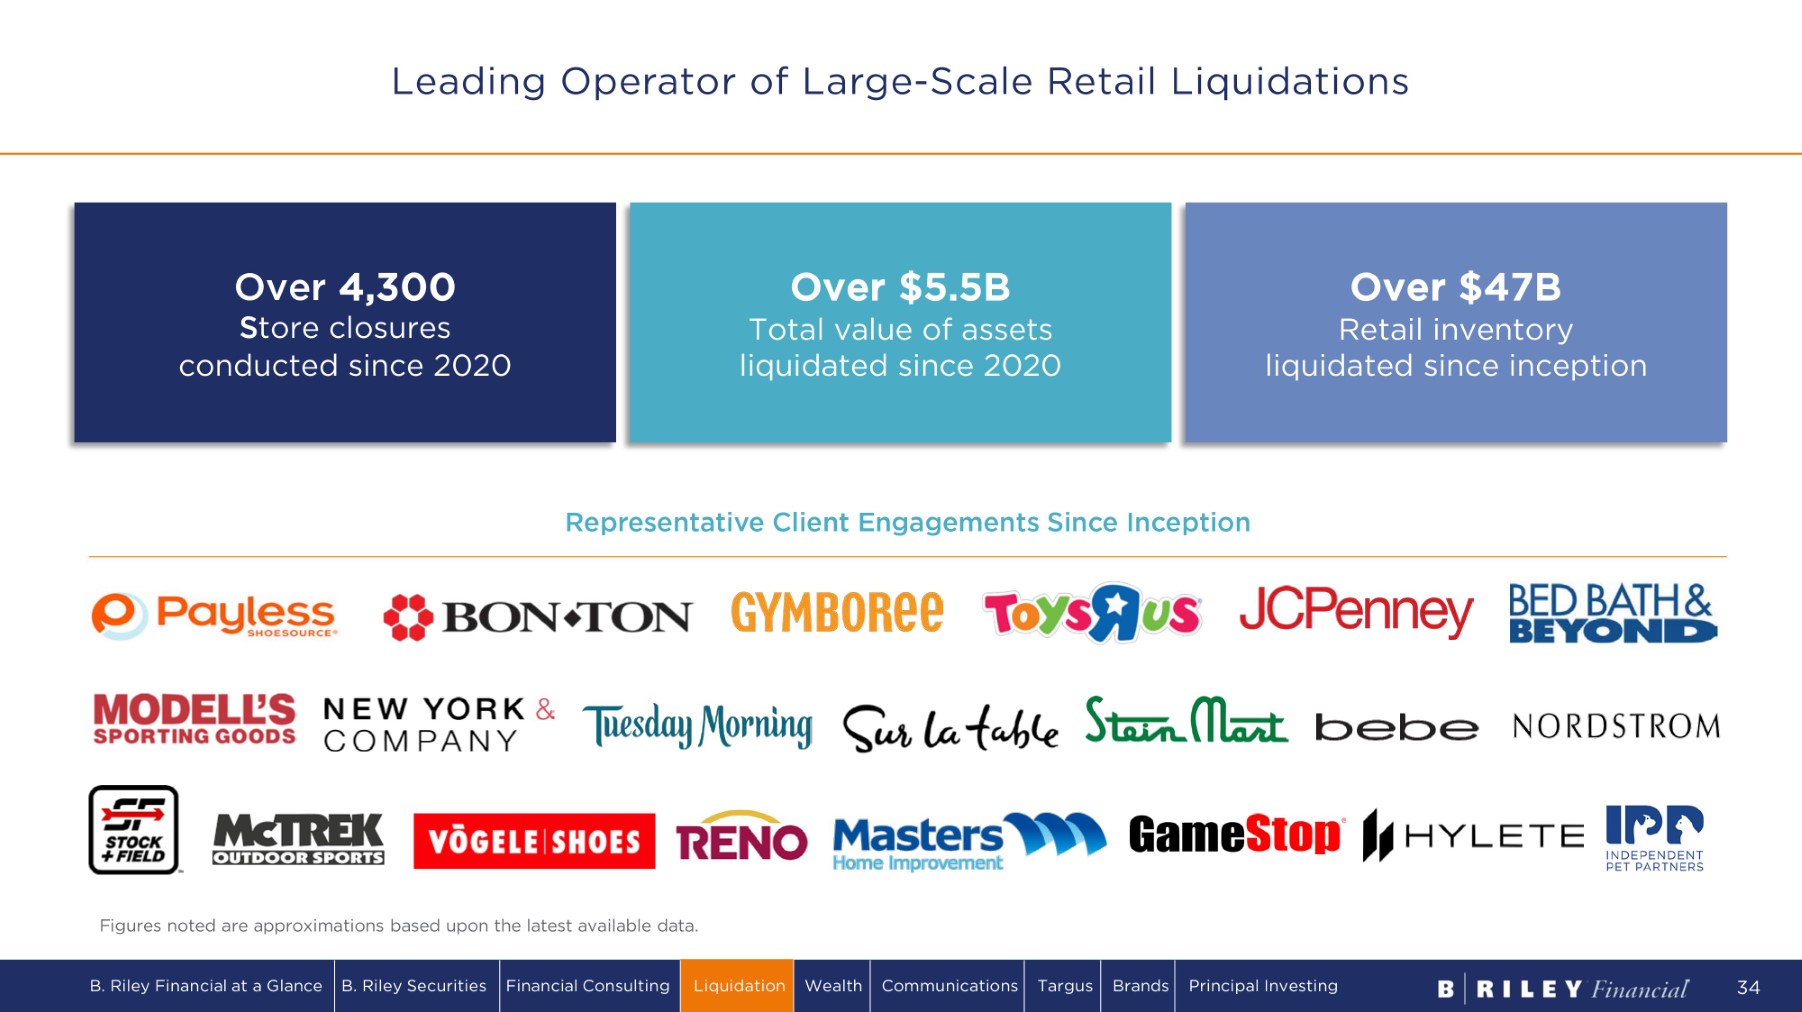
Representative Client Engagements Since Inception Figures noted are approximations based upon the latest available data. Over $5.5B Total value of assets liquidated since 2020 Over 4,300 S tore closures conducted since 2020 Over $47B Retail inventory liquidated since inception Leading Operator of Large - Scale Retail Liquidations B. Riley Financial at a Glance B. Riley Securities Financial Consulting Liquidation Wealth Communications Targus Brands Principal Investing 34
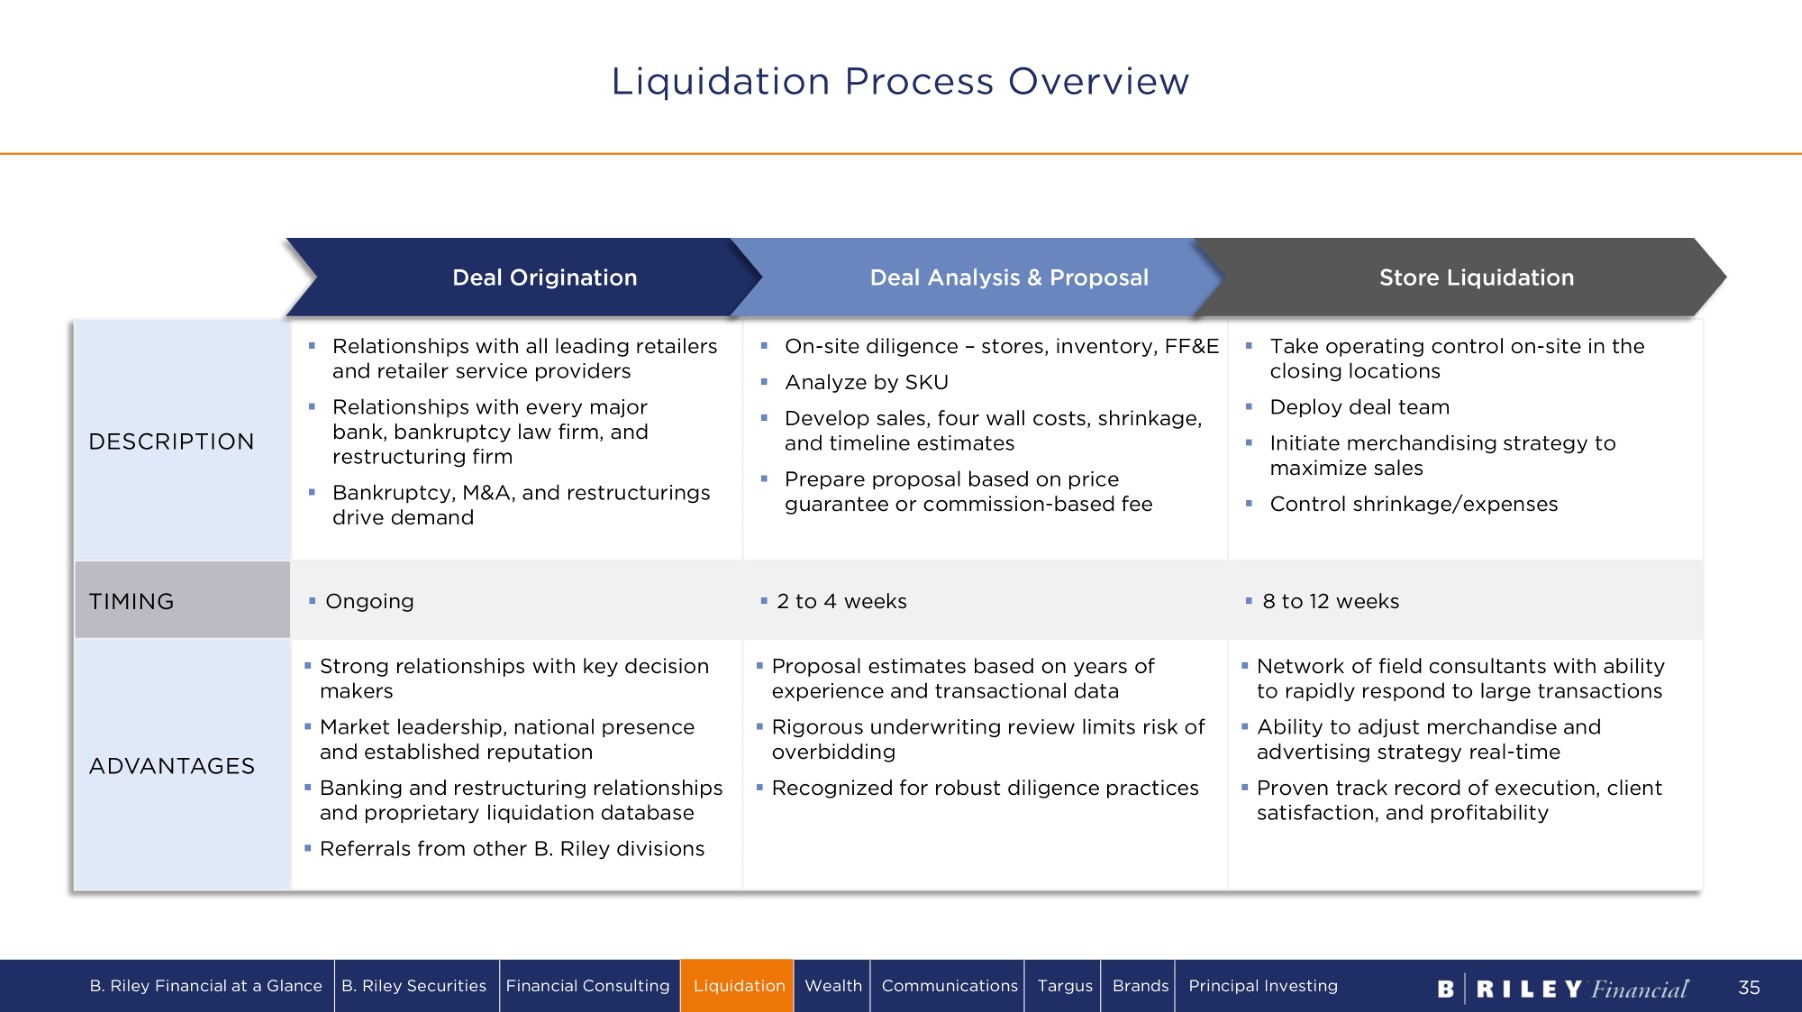
▪ Take operating control on - site in the closing locations ▪ Deploy deal team ▪ Initiate merchandising strategy to maximize sales ▪ Control shrinkage/expenses ▪ On - site diligence – stores, inventory, FF&E ▪ Analyze by SKU ▪ Develop sales, four wall costs, shrinkage, and timeline estimates ▪ Prepare proposal based on price guarantee or commission - based fee ▪ Relationships with all leading retailers and retailer service providers ▪ Relationships with every major bank, bankruptcy law firm, and restructuring firm ▪ Bankruptcy, M&A, and restructurings drive demand DESCRIPTION ▪ 8 t o 12 w ee k s ▪ 2 to 4 weeks ▪ Ongoing TIMING ▪ Network of field consultants with ability to rapidly respond to large transactions ▪ Ability to adjust merchandise and advertising strategy real - time ▪ Proven track record of execution, client satisfaction, and profitability ▪ Proposal estimates based on years of experience and transactional data ▪ Rigorous underwriting review limits risk of overbidding ▪ Recognized for robust diligence practices ▪ Strong relationships with key decision makers ▪ Market leadership, national presence and established reputation ▪ Banking and restructuring relationships and proprietary liquidation database ▪ Referrals from other B. Riley divisions ADVANTAGES De a l O r i gi na ti o n De a l Ana l y si s & P r o po sa l S t o r e L i qui da ti o n Liquidation Process Overview B. Riley Financial at a Glance B. Riley Securities Financial Consulting Liquidation Wealth Communications Targus Brands Principal Investing 35
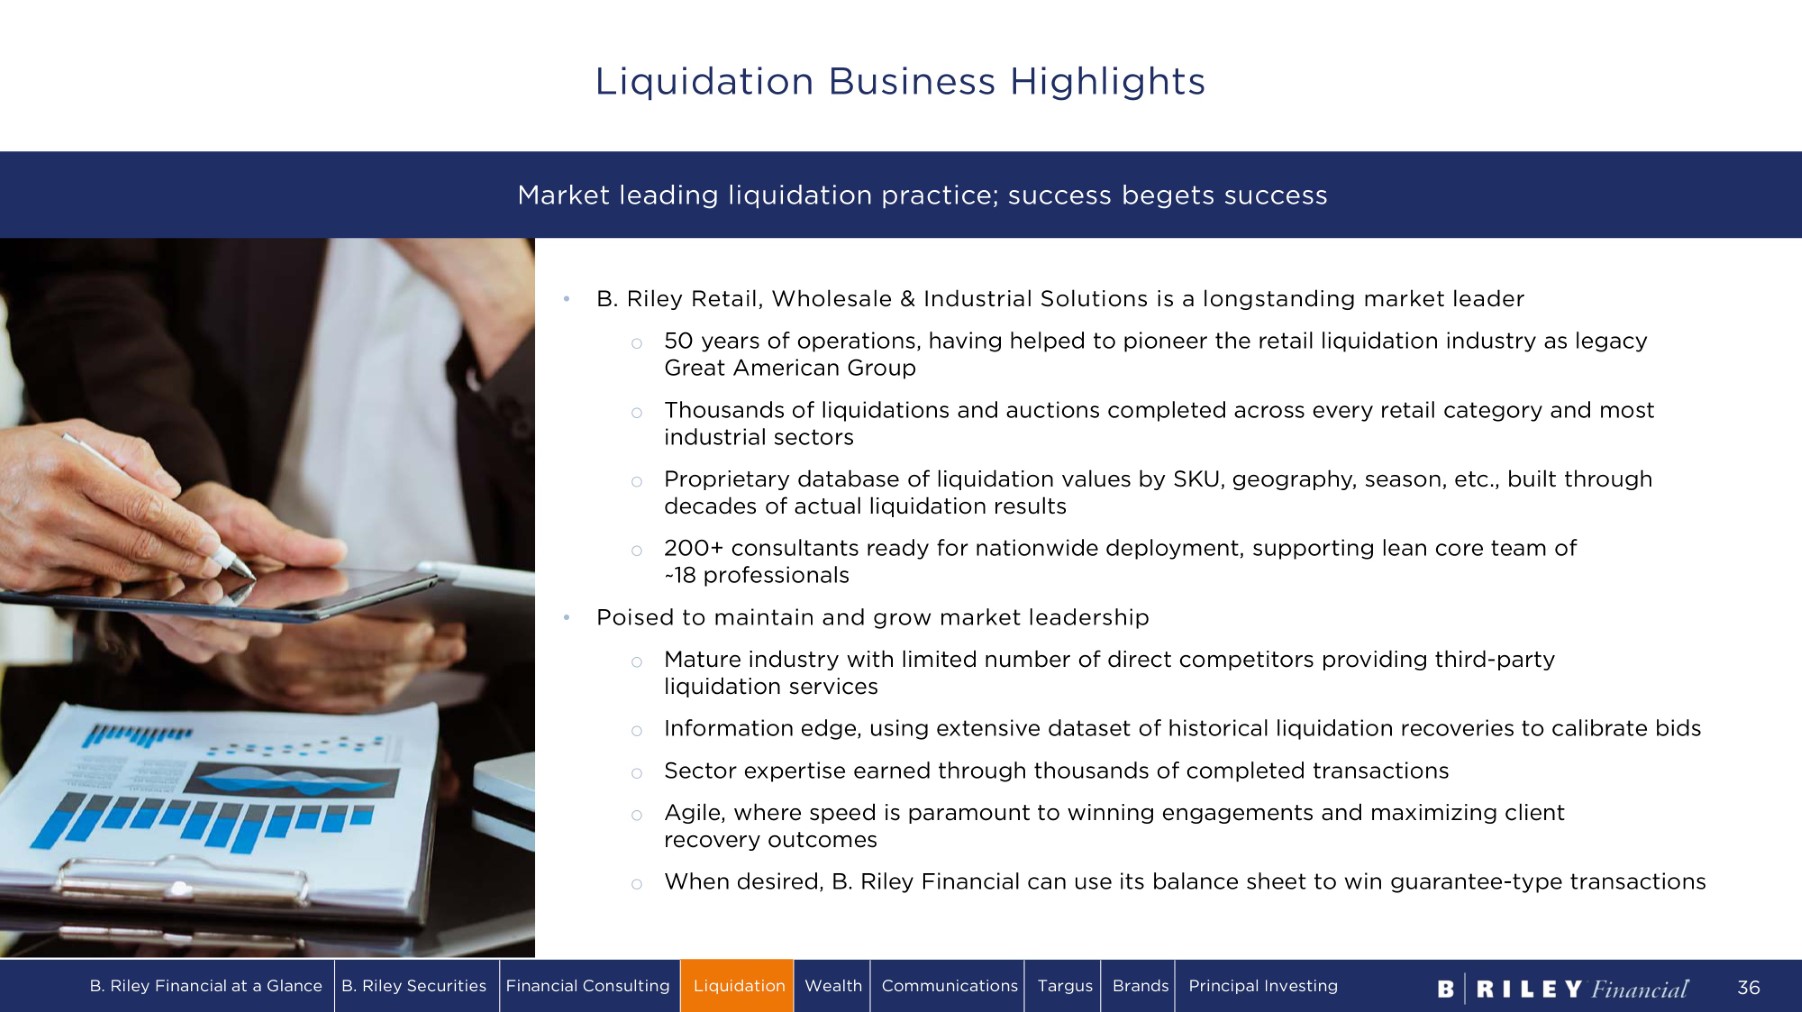
• B. Riley Retail, Wholesale & Industrial Solutions is a longstanding market leader o 50 years of operations, having helped to pioneer the retail liquidation industry as legacy Great American Group o Thousands of liquidations and auctions completed across every retail category and most industrial sectors o Proprietary database of liquidation values by SKU, geography, season, etc., built through decades of actual liquidation results o 200+ consultants ready for nationwide deployment, supporting lean core team of ~ 1 8 p r o f e s s i o n a ls • Poised to maintain and grow market leadership o Mature industry with limited number of direct competitors providing third - party liquidation services o Information edge, using extensive dataset of historical liquidation recoveries to calibrate bids o Sector expertise earned through thousands of completed transactions o Agile, where speed is paramount to winning engagements and maximizing client recovery outcomes o When desired, B. Riley Financial can use its balance sheet to win guarantee - type transactions Market leading liquidation practice; success begets success Liquidation Business Highlights B. Riley Financial at a Glance B. Riley Securities Financial Consulting Liquidation Wealth Communications Targus Brands Principal Investing 36
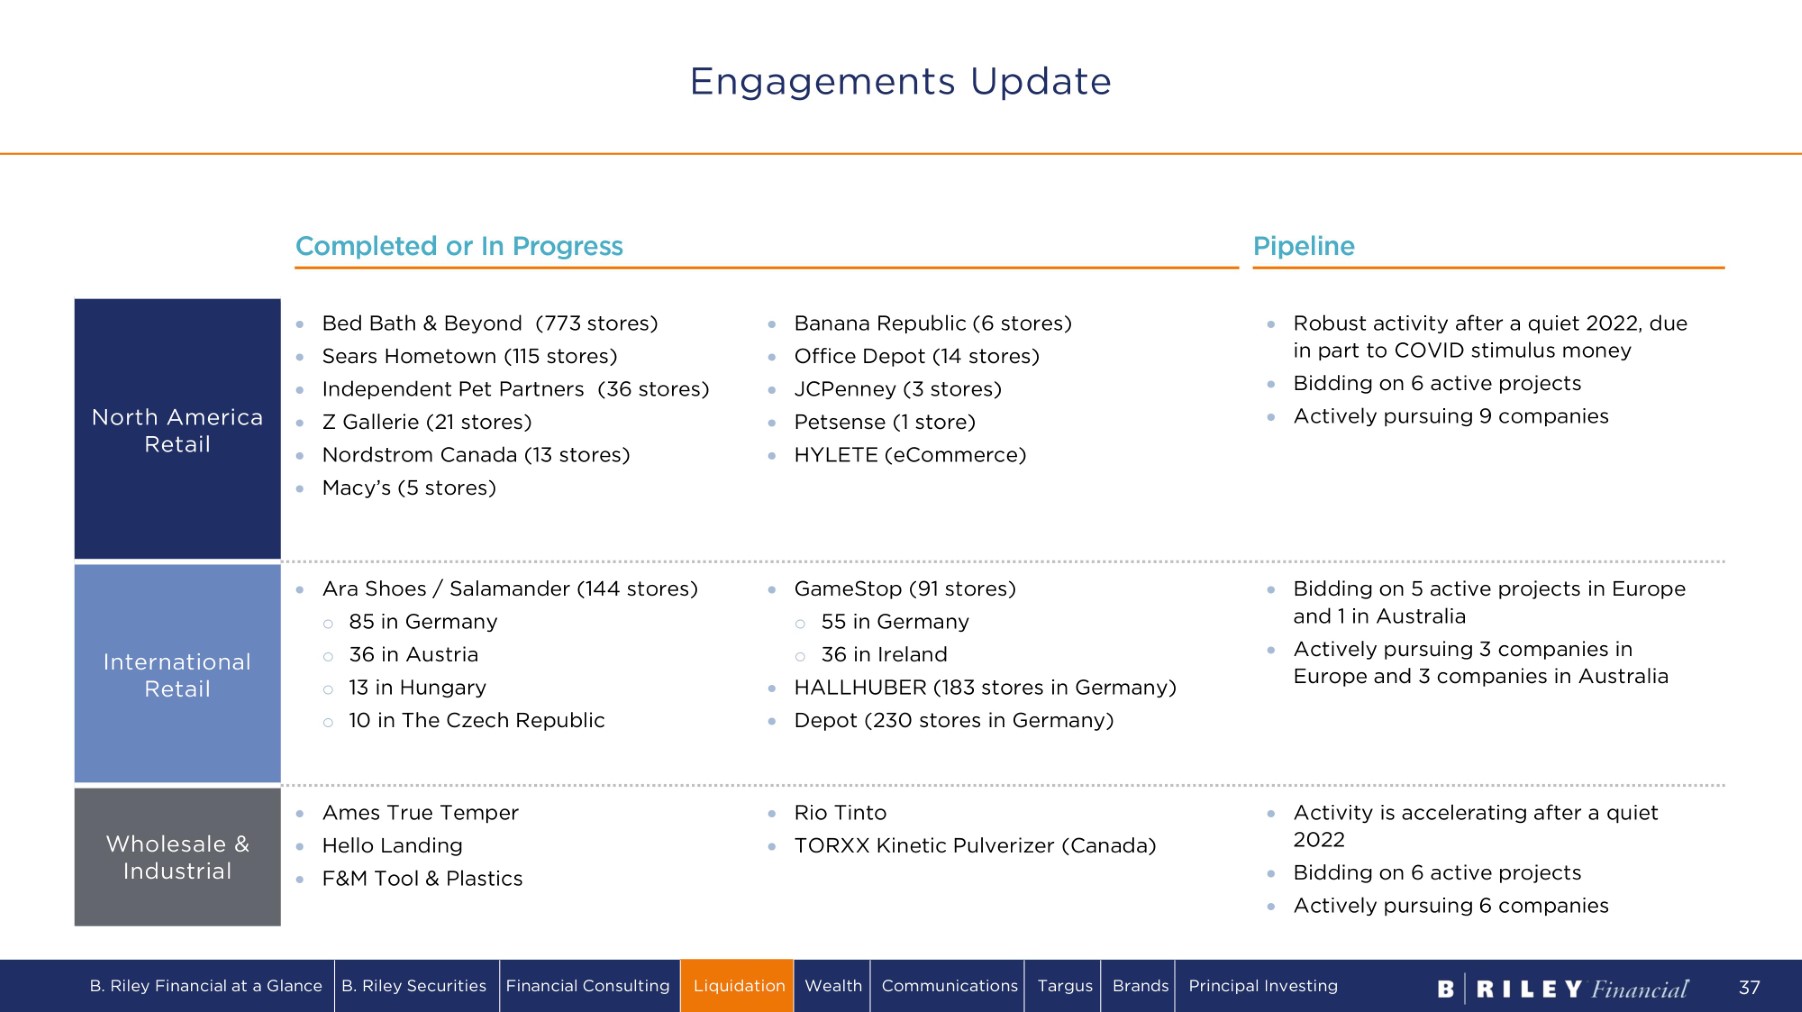
Pipeline C o mpl e t e d o r I n P r o g r e s s Robust activity after a quiet 2022, due in part to COVID stimulus money Bidding on 6 active projects Actively pursuing 9 companies Banana Republic (6 stores) Office Depot (14 stores) JCPenney (3 stores) Petsense (1 store) HYLETE (eCommerce) Bed Bath & Beyond (773 stores) Sears Hometown (115 stores) Independent Pet Partners (36 stores) Z Gallerie (21 stores) Nordstrom Canada (13 stores) Macy’s (5 stores) North America Retail Bidding on 5 active projects in Europe a nd 1 i n Aus tralia Actively pursuing 3 companies in Europe and 3 companies in Australia GameStop (91 stores) o 55 in Germany o 36 in Ireland HALLHUBER (183 stores in Germany) Depot (230 stores in Germany) Ara Shoes / Salamander (144 stores) o 85 in Germany o 36 in Austria o 13 i n Hun gar y o 10 in The Czech Republic I n t er n a ti on a l Retail Activity is accelerating after a quiet 2022 Bidding on 6 active projects Actively pursuing 6 companies Rio Tinto TORXX Kinetic Pulverizer (Canada) Ames True Temper Hello Landing F&M Tool & Plastics Wholesale & Industrial Engagements Update B. Riley Financial at a Glance B. Riley Securities Financial Consulting Liquidation Wealth Communications Targus Brands Principal Investing 37
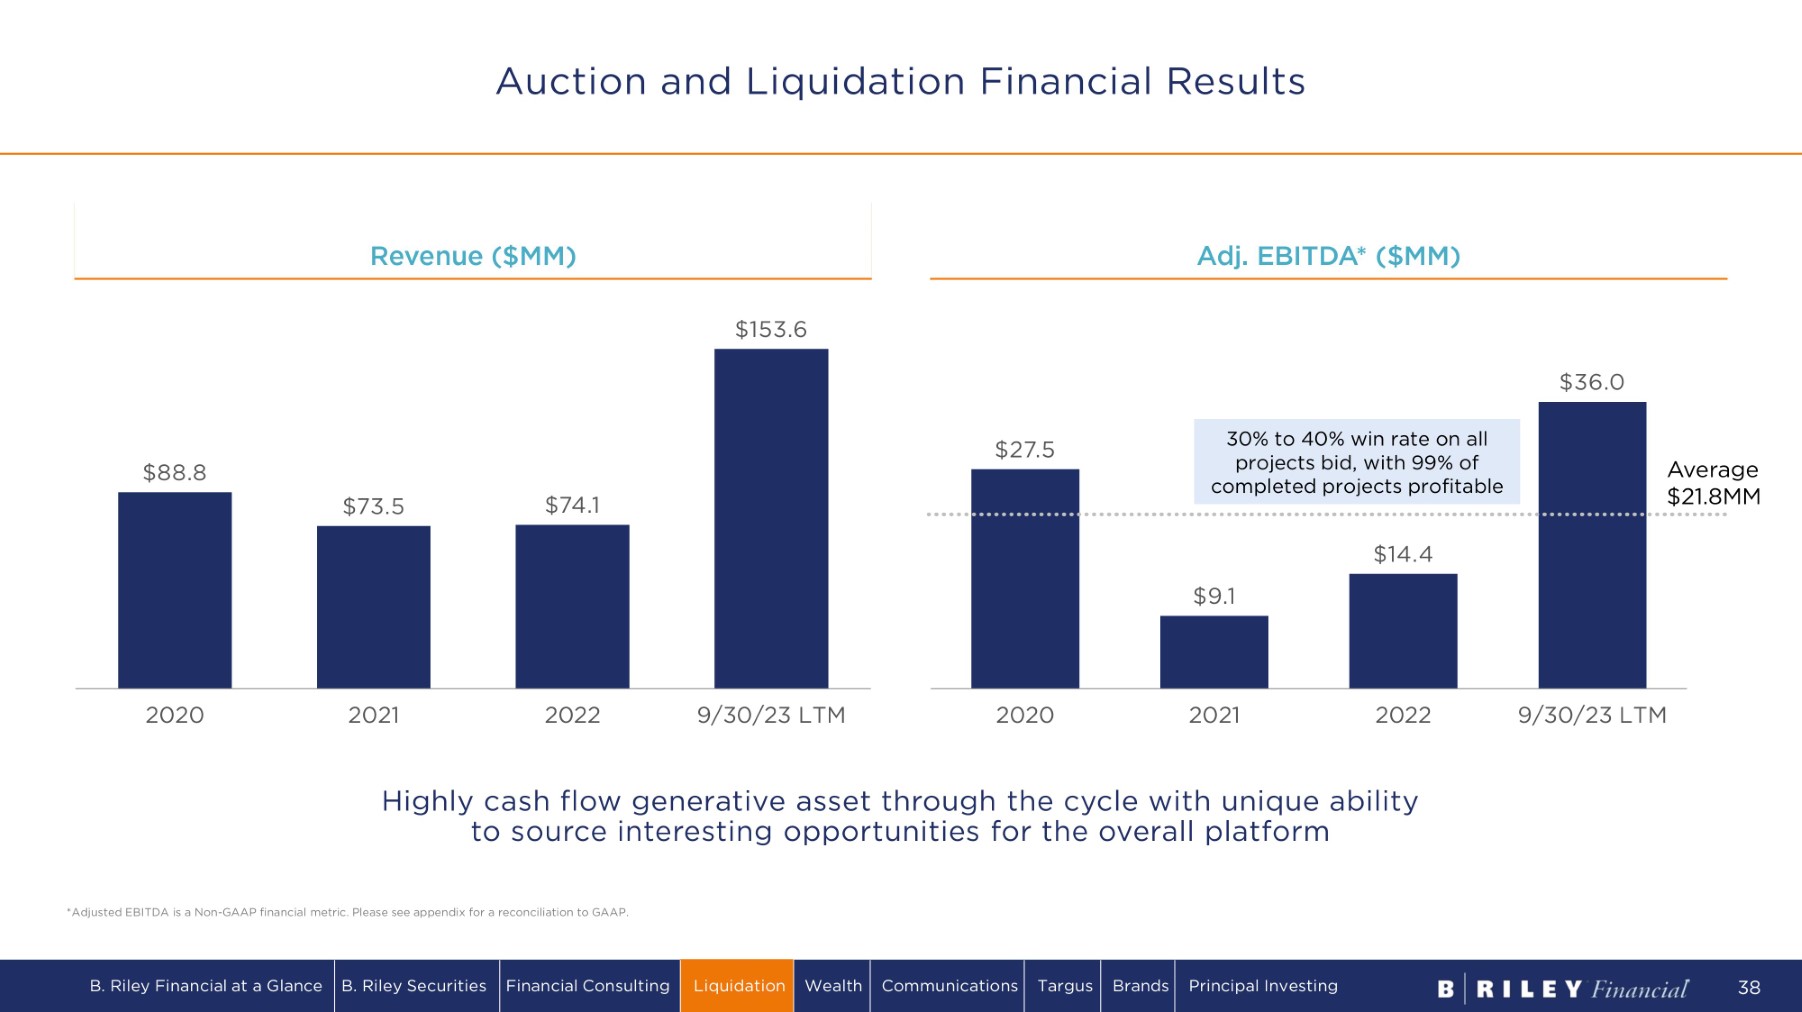
Auction and Liquidation Financial Results R e v e n u e ( $ MM) $ 88 . 8 $ 7 3 . 5 $ 7 4 . 1 $ 1 53 . 6 2 0 20 2 0 21 2 0 22 9/30/23 LTM A d j . E B I T D A * ( $ MM ) $ 2 7 . 5 $9 .1 $14.4 $ 3 6 .0 2 0 20 2 0 21 2 0 22 9/30/23 LTM Highly cash flow generative asset through the cycle with unique ability to source interesting opportunities for the overall platform Average $ 2 1 . 8 MM 30% to 40% win rate on all projects bid, with 99% of completed projects profitable *Adjusted EBITDA is a Non - GAAP financial metric. Please see appendix for a reconciliation to GAAP. B. Riley Financial at a Glance B. Riley Securities Financial Consulting Liquidation Wealth Communications Targus Brands Principal Investing 38
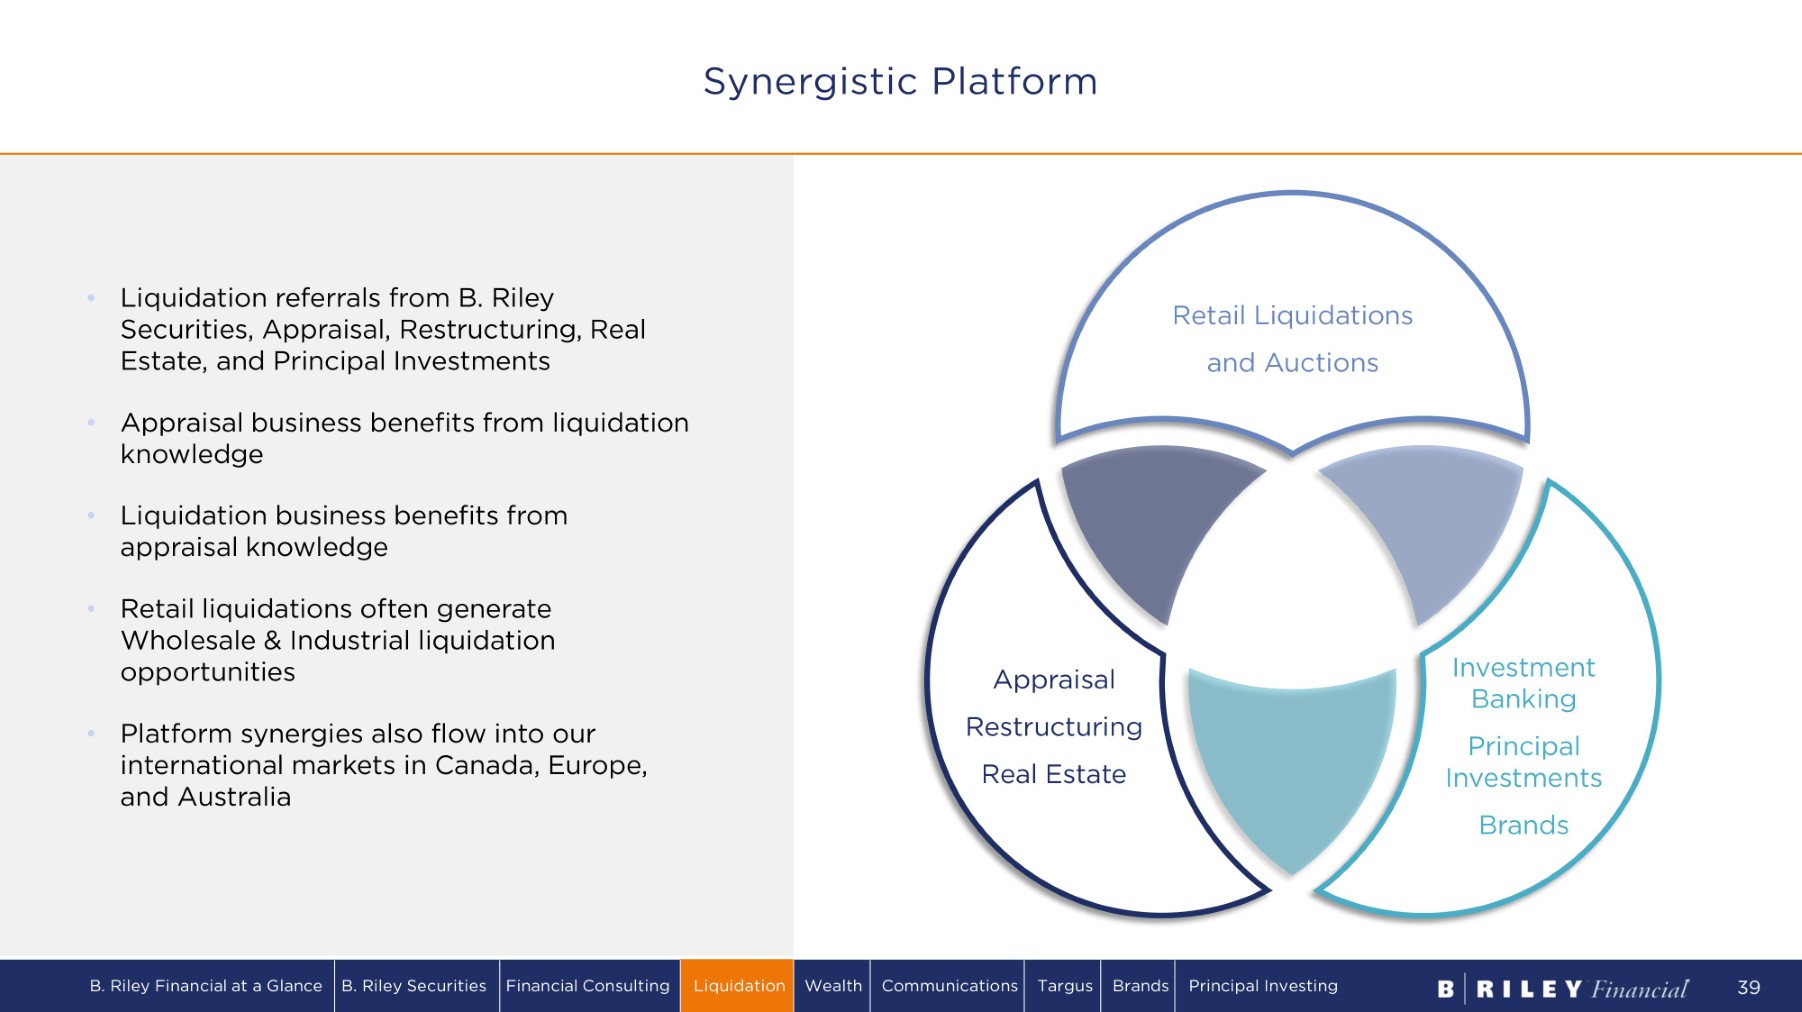
• Liquidation referrals from B. Riley Securities, Appraisal, Restructuring, Real Estate, and Principal Investments • Appraisal business benefits from liquidation knowledge • Liquidation business benefits from appraisal knowledge • Retail liquidations often generate Wholesale & Industrial liquidation opportunities • Platform synergies also flow into our international markets in Canada, Europe, and Australia Retail Liquidations and Auctions I n v e s tmen t Banking Principal I n v e s tmen ts Brands Appraisal R e s tr u c tu r i n g Real Estate Synergistic Platform B. Riley Financial at a Glance B. Riley Securities Financial Consulting Liquidation Wealth Communications Targus Brands Principal Investing 39

05 B. RILEY WEALTH
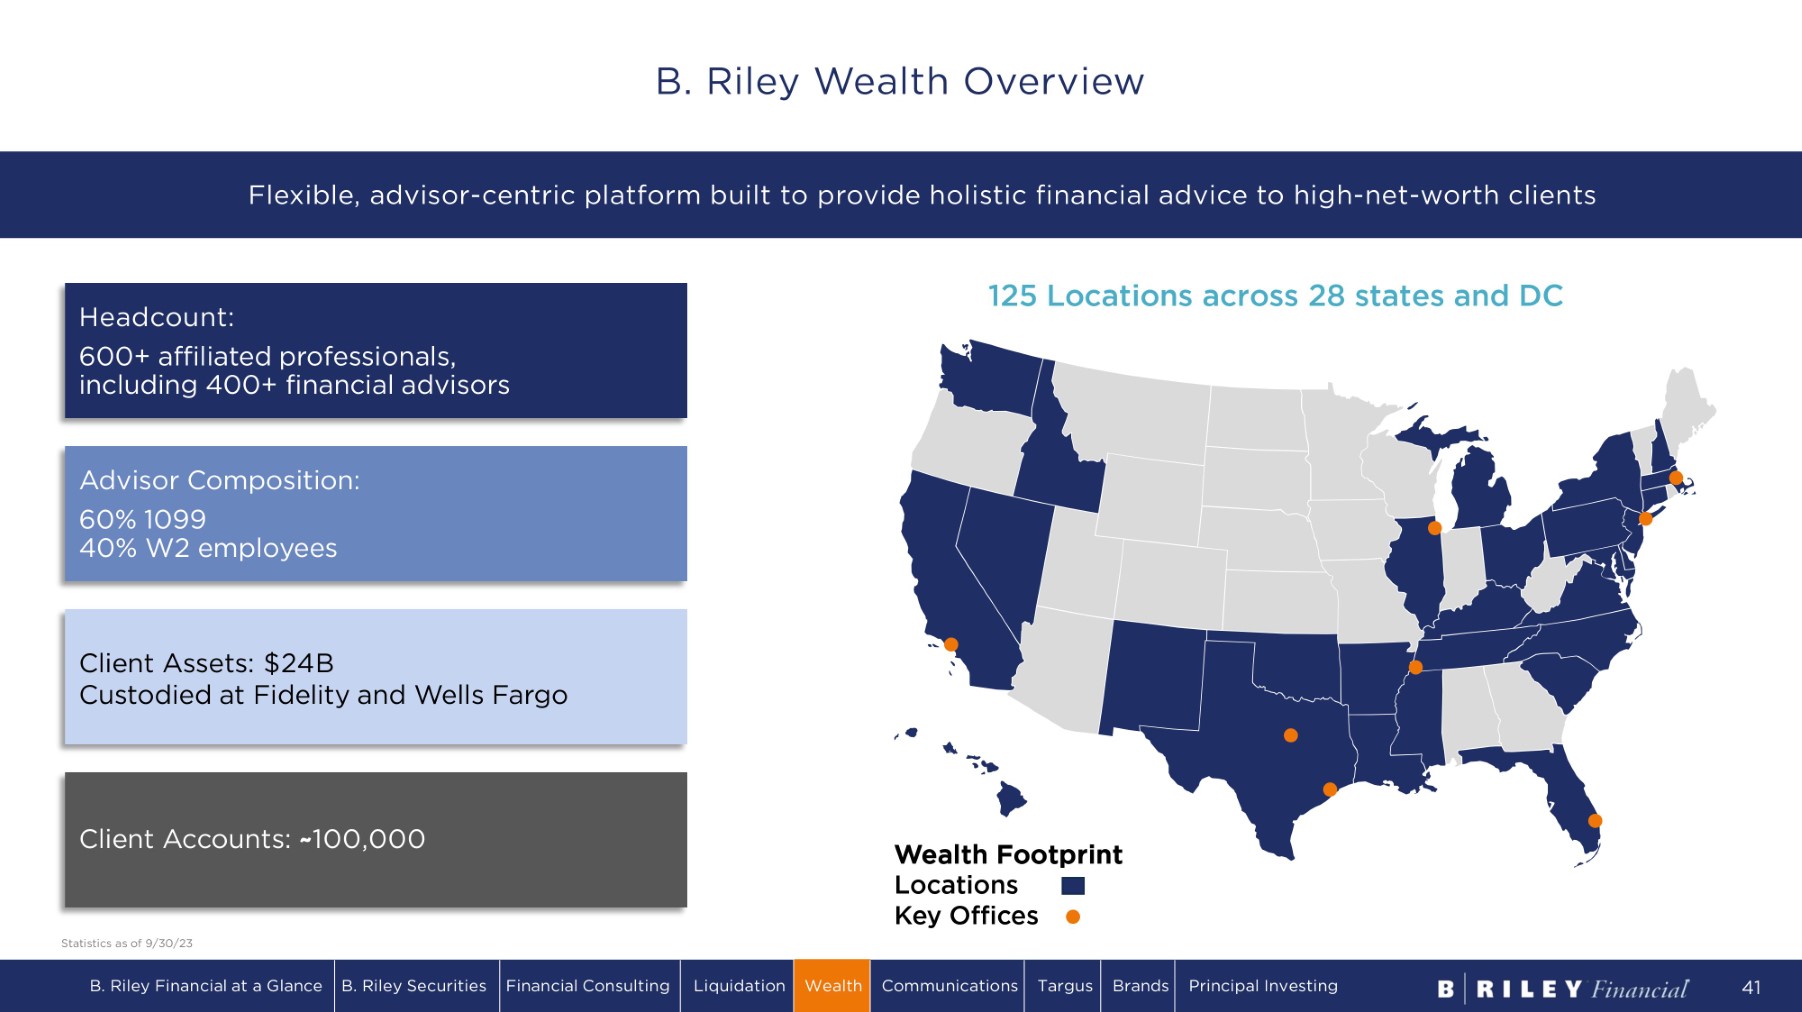
1 2 5 L o ca ti o n s a cr o s s 2 8 s t a t e s a n d DC Advisor Composition: 60% 1099 40% W2 employees Headcount: 600+ affiliated professionals, including 400+ financial advisors Client Assets: $24B Custodied at Fidelity and Wells Fargo Client Accounts: ~ 100,000 Wealth Footprint Locations K e y O ff i c e s Flexible, advisor - centric platform built to provide holistic financial advice to high - net - worth clients B. Riley Financial at a Glance B. Riley Securities Financial Consulting Liquidation Wealth Communications Targus Brands Principal Investing 41 B. Riley Wealth Overview Statistics as of 9/30/23
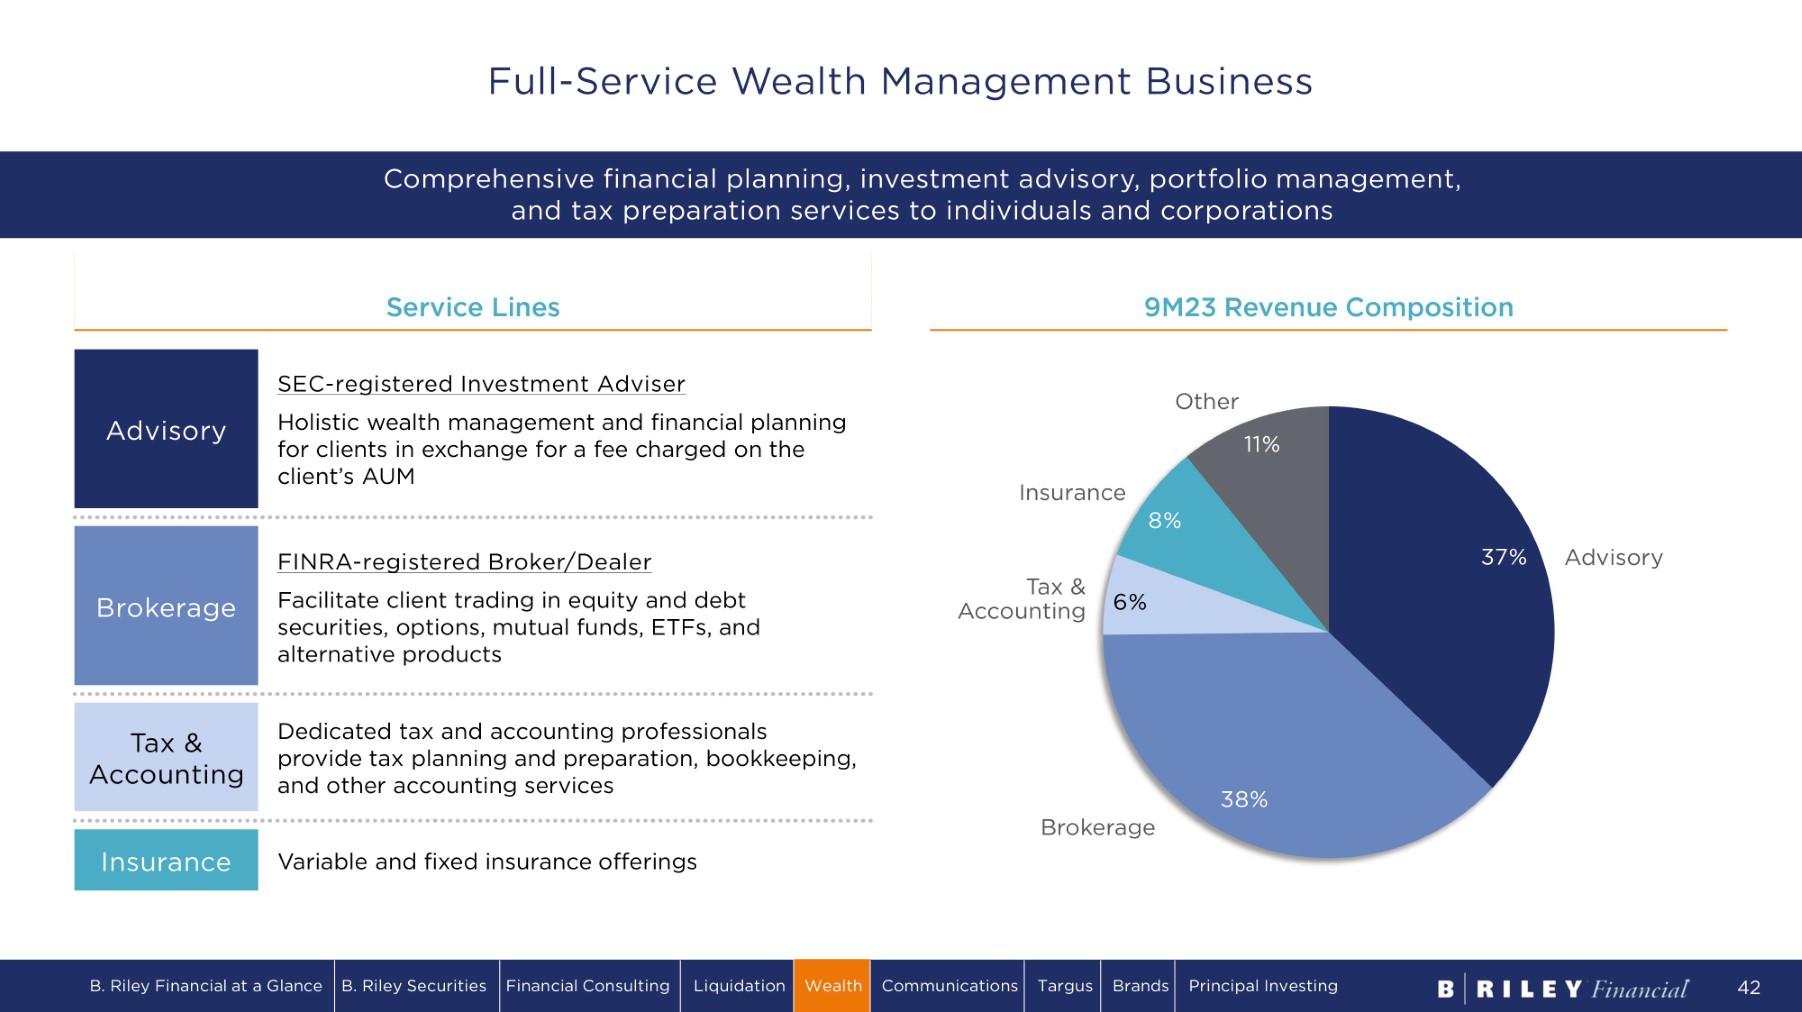
Advisory SEC - registered Investment Adviser Holistic wealth management and financial planning for clients in exchange for a fee charged on the client’s AUM Brokerage FINRA - registered Broker/Dealer Facilitate client trading in equity and debt securities, options, mutual funds, ETFs, and alternative products Tax & A cc o un t i n g Dedicated tax and accounting professionals provide tax planning and preparation, bookkeeping, and other accounting services Insurance Variable and fixed insurance offerings S e r v i c e L i n es 9 M 2 3 R e v e n u e C o m p o si t i o n 3 7 % 3 8 % 6% 8% 11% A d v i s o r y B r o k e r a g e Tax & A cc oun t i ng Insurance O t h e r Comprehensive financial planning, investment advisory, portfolio management, and tax preparation services to individuals and corporations B. Riley Financial at a Glance B. Riley Securities Financial Consulting Liquidation Wealth Communications Targus Brands Principal Investing 42 Full - Service Wealth Management Business
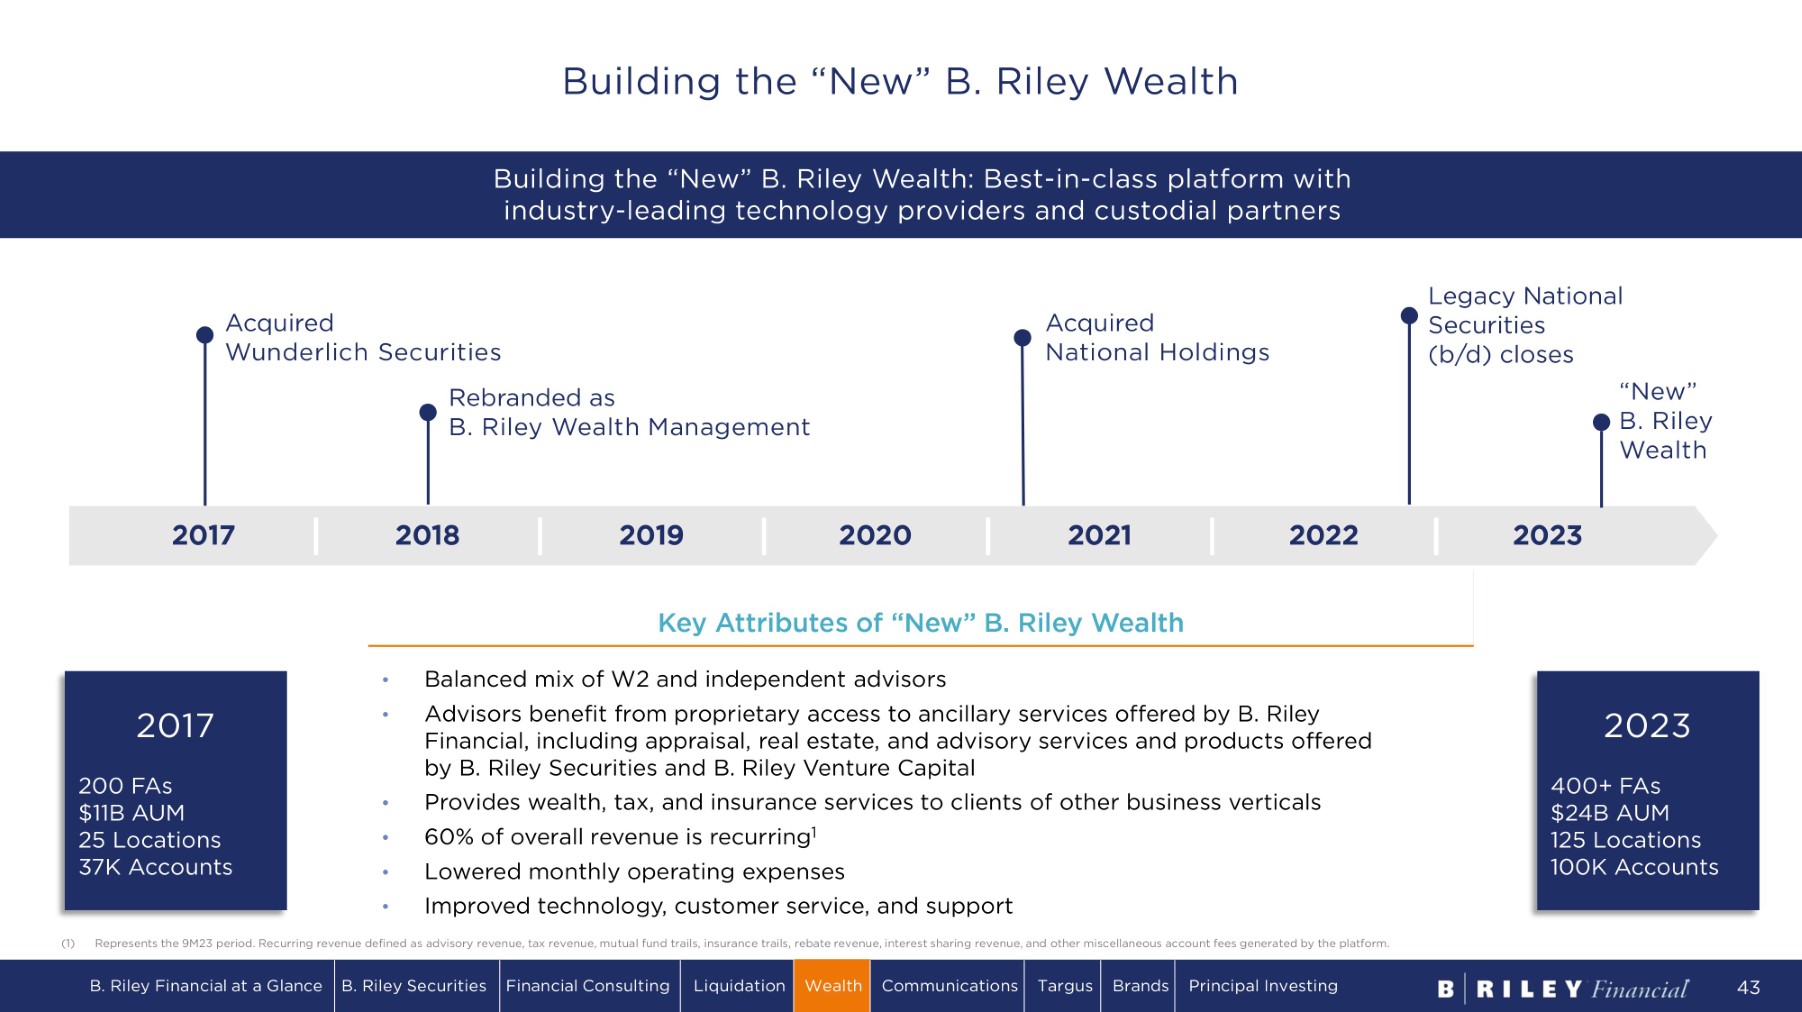
2023 2022 2021 2020 2019 2018 2017 Acquired National Holdings Acquired Wunderlich Securities Rebranded as B. Riley Wealth Management Legacy National Securities (b/d) closes “ N e w ” B. Riley Wealth • Balanced mix of W2 and independent advisors • Advisors benefit from proprietary access to ancillary services offered by B. Riley Financial, including appraisal, real estate, and advisory services and products offered by B. Riley Securities and B. Riley Venture Capital • Provides wealth, tax, and insurance services to clients of other business verticals • 60% of overall revenue is recurring 1 • Lowered monthly operating expenses • Improved technology, customer service, and support 2017 200 FAs $ 11B A UM 25 Locations 37K Accounts 2023 400+ FAs $24B AUM 125 Locations 100K Accounts Key Attributes of “New” B. Riley Wealth (1) Represents the 9M23 period. Recurring revenue defined as advisory revenue, tax revenue, mutual fund trails, insurance trails, rebate revenue, interest sharing revenue, and other miscellaneous account fees generated by the platform. Building the “New” B. Riley Wealth: Best - in - class platform with industry - leading technology providers and custodial partners B. Riley Financial at a Glance B. Riley Securities Financial Consulting Liquidation Wealth Communications Targus Brands Principal Investing 43 Building the “New” B. Riley Wealth

Headcount $148.9 $ 7 3 .1 $ 3 8 2 .0 $234.3 5 1 % 33% 55% 6 0 % 2 0 20 2021 Revenue 2 0 22 9 M23 % Recurring Revenue ($MM) 177 690 449 4 2 8 103 523 222 212 2 8 0 1 , 2 13 6 7 1 6 4 0 2 0 20 2 0 21 2 0 22 Financial Advisors 9 / 3 0 /2 3 Other B. Riley Wealth with $24B of AUM is ready to return to growth and is capable of generating 10% Adj. EBITDA margins Adj. EBITDA* ($MM) $ 5 . 9 $ 22 . 1 $ 6 .2 2 0 20 9 M23 ( $ 1 0. 0 ) 2021 2022 Adj. EBITDA A c qu i r e d National Holdings Feb 2021 Recurring revenue now covers ~70% of Adj. EBITDA breakeven Upside when capital markets activity i m p ro v e s Executed integration playbook, emphasizing recurring revenue and removing $30MM of indirect expenses. $195.1 LTM *Adjusted EBITDA is a Non - GAAP financial metric. Please see appendix for a reconciliation to GAAP. LTM refers to twelve months ended 9/30/23 Wealth Financial Results B. Riley Financial at a Glance B. Riley Securities Financial Consulting Liquidation Wealth Communications Targus Brands Principal Investing 44

06 COMMUNICATIONS
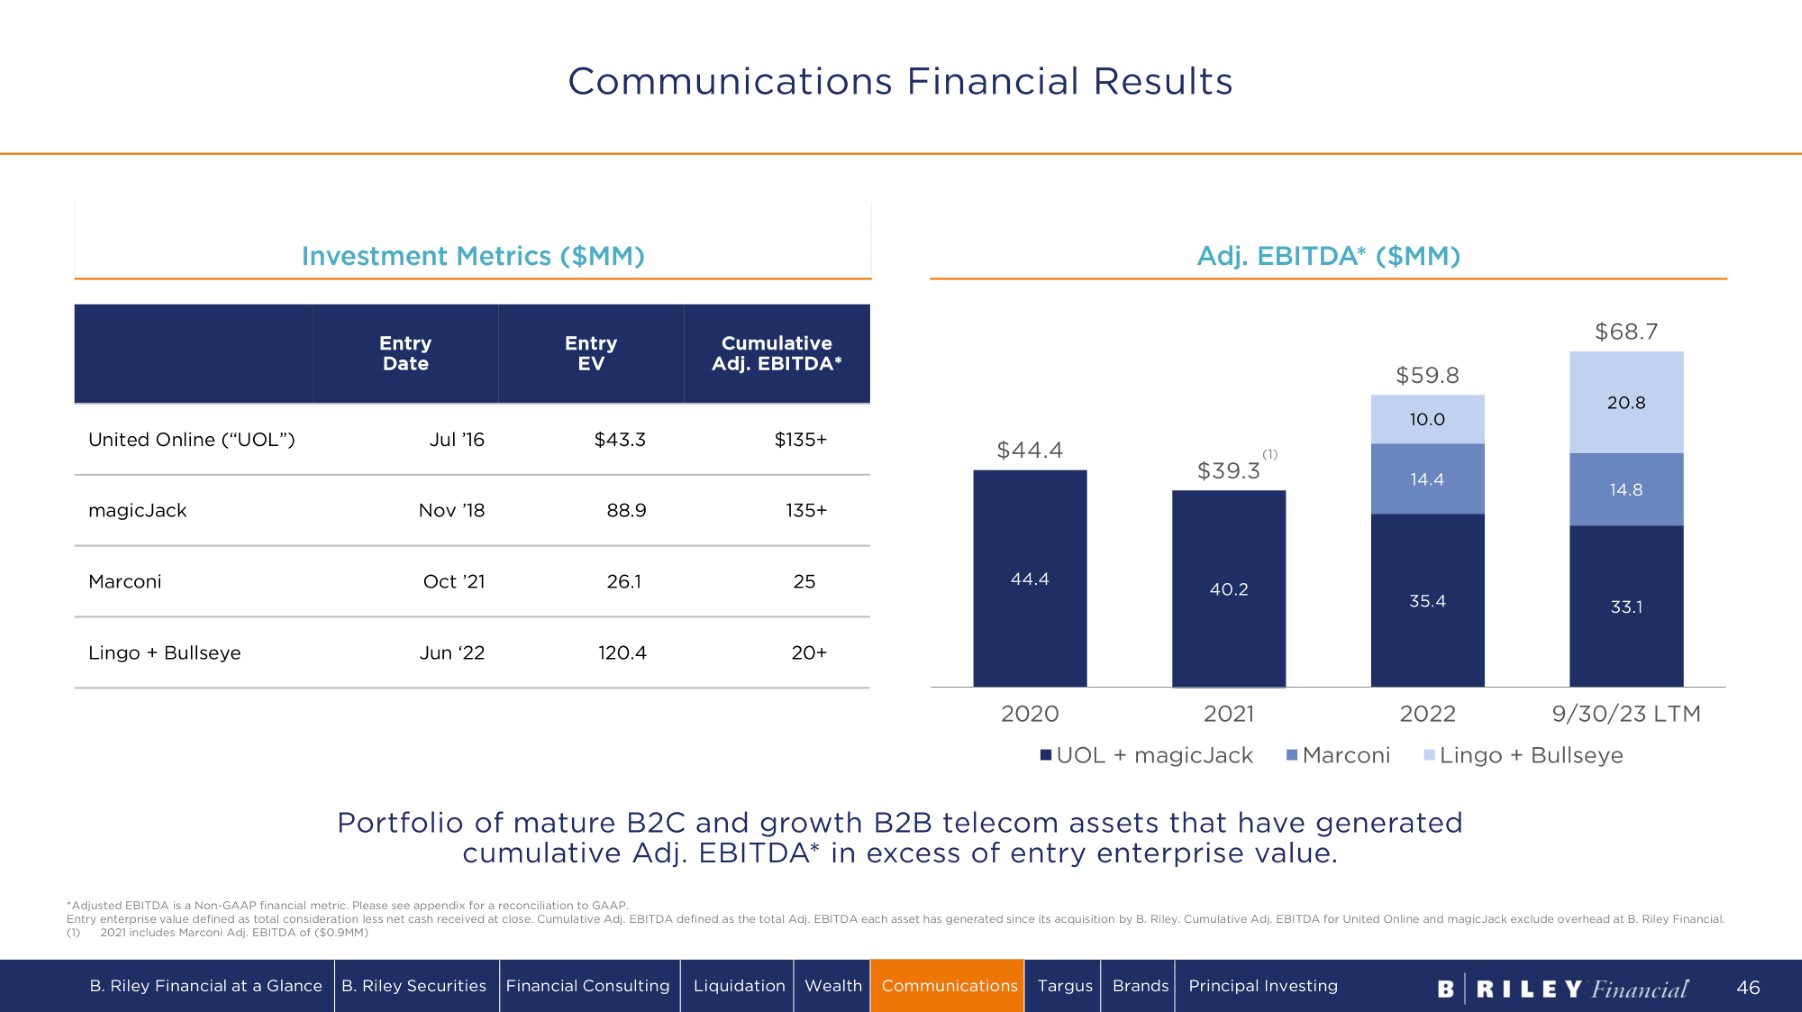
44.4 40.2 35.4 33.1 14.4 14.8 10.0 20.8 $ 44. 4 $ 3 9 . 3 $ 5 9 . 8 $ 6 8 .7 2020 2021 UO L + m a g i c Ja c k M a r c o ni 2022 9/30/23 LTM Lingo + Bullseye A d j . E B I T D A * ( $ MM ) Cumulative Adj. EBITDA* E n t r y EV E n t r y Date $135+ $43.3 Jul ’16 United Online (“UOL”) 135+ 88.9 Nov ’18 magicJack 25 26.1 Oct ’21 Marconi 20+ 120.4 Jun ‘22 Lingo + Bullseye I n v e s t m e n t M e t r i c s ( $ MM ) Portfolio of mature B2C and growth B2B telecom assets that have generated cumulative Adj. EBITDA* in excess of entry enterprise value. *Adjusted EBITDA is a Non - GAAP financial metric. Please see appendix for a reconciliation to GAAP. Entry enterprise value defined as total consideration less net cash received at close. Cumulative Adj. EBITDA defined as the total Adj. EBITDA each asset has generated since its acquisition by B. Riley. Cumulative Adj. EBITDA for United Online and magicJack exclude overhead at B. Riley Financial. (1) 2021 includes Marconi Adj. EBITDA of ($0.9MM) ( 1 ) Communications Financial Results B. Riley Financial at a Glance B. Riley Securities Financial Consulting Liquidation Wealth Communications Targus Brands Principal Investing 46

Marconi Wireless magicJack United Online July 2016 Internet access provider; Provides email, broadband, DSL and dial - up services under the NetZero and Juno brands. Nov 2018 Voice over Internet Protocol (VoIP) phone service provider. Provides subscription services and devices to consumers and small businesses. Oct 2021 Mobile virtual network operator (MVNO). Provides mobile services, including voice, text, and data services and devices to consumers. Aug 2022 Award - winning single source communications and cloud technology provider. Provides unified communications to SMB and Enterprise markets. Lingo acquired BullsEye Telecom in August 2022. $ 3 2 MM S eg m e n t R ev e n u e FY 2016 L i n g o May 2022 Global unified communications (UC) and managed service provider. Provides IP - based Cloud voice, data and other UC technologies to small - to - medium sized businesses (SMBs) and consumers. BullsEye Telecom $344MM S eg m e n t Revenue LTM Sep 2023 Marconi W i re l e s s Operationally Focused Control Investments Offer Free Cash Flow Communications Portfolio B. Riley Financial at a Glance B. Riley Securities Financial Consulting Liquidation Wealth Communications Targus Brands Principal Investing 47

Mature B2C Telecom Marconi ▪ Provider of paid mail, internet, voice over IP (VoIP), and mobile communication services to consumers ▪ Predictable net subscriber decline ▪ Adj. EBITDA* margins 40%+ with de minimis capex ▪ On ~$160MM of entry enterprise value, these assets have generated ~$300MM in cumulative Adj. EBITDA* ▪ Expect meaningful cash distributions to continue over the next 5+ years *Adjusted EBITDA is a Non - GAAP financial metric. Please see appendix for a reconciliation to GAAP. Entry enterprise value defined as total consideration less net cash received at close. Cumulative Adj. EBITDA for United Online and magicJack exclude overhead at B. Riley Financial. Growth B2B Telecom ▪ Re - seller of voice, VoIP, broadband, security, and collaboration tools like Microsoft Teams, under a single billing solution across all locations for Enterprise and Small - Medium businesses in the US ▪ $200MM+ of annual revenue with stable to moderate growth ▪ Platform for rolling up smaller UCaaS assets with significant synergies Communications Overview B. Riley Financial at a Glance B. Riley Securities Financial Consulting Liquidation Wealth Communications Targus Brands Principal Investing 48

0 7 T A R GUS
▪ Acquired Targus in October 2022 ▪ Leading brand share in key product categories in the U.S. and abroad ▪ Serves Fortune 1000 companies with global footprint in 100 countries 1 00 % ownership B. Riley Financial at a Glance B. Riley Securities Financial Consulting Liquidation Wealth Communications Targus Brands Principal Investing 50 • B. Riley acquired Targus in October 2022, attracted to its stability, market position, and strong FCF characteristics • Targus is the world’s largest non - OEM independent provider of carrying cases and docks, and a market leader in other accessories for laptops and tablets • Well positioned to serve the office, home, and mobile workforce of the future o Multiple robust distribution channels (wholesale, retail, OEM, and ecommerce) o Extensive and high - quality supply chain • We expect Targus to return to normalized financial performance o Demand rose in 2021 and 2022 as work - from - home movement elevated Targus products to long - term workforce productivity staples o Demand cooled in 1H2023, with overall PC market shipments down 30% YoY o We believe Targus is well positioned to benefit from a renewed purchasing cycle driven by aging hardware and demand for next generation technology o Industry appears to be at the early stages of a recovery Targus Overview

R e v e n u e ( $ MM) 330.9 9 . 9 77.8 257 . 0 $ 33 0.7 $ 35 3. 6 $ 40 8 .8 $ 2 66 . 9 2 0 20 2 0 21 A d j . E B I T D A * ( $ MM ) 2022 9/30/23 LTM Pre - B. Riley acquisition on 10/18/22 Well positioned to capitalize on market recovery, driving a return to normalized financial performance *Adjusted EBITDA is a Non - GAAP financial metric. Please see appendix for a reconciliation to GAAP. Revenue and Adj. EBITDA for periods prior to acquisition by B. Riley are as prepared by Targus, shown to communicate underlying business trends, not for reconciliation to B. Riley Financial consolidated financials. 2020 and 2021 are shown pro forma for Targus’ May 2021 acquisition of Hyper. 2022 includes 1/1/22 - 10/17/22 under prior ownership, during which Targus generated $330.9MM in revenue and $40.9MM in Adj. EBITDA. Subsequent to its acquisition by B. Riley on 10/18/22, Targus generated $77.8MM in revenue and $10.7MM in Adj. EBITDA for the period 10/18/22 – 12/31/22. 9/30/23 LTM includes 10/1/22 - 10/17/22 under prior ownership, during which Targus generated $9.9MM in revenue and ($0.4)MM in Adj. EBITDA. Subsequent to its acquisition by B. Riley on 10/18/22, Targus generated $257.0MM in revenue and $14.0MM in Adj. EBITDA for the period 10/18/22 – 9/30/23. 40.9 10.7 14.0 (0.4) $ 4 1 .7 $ 3 7 . 0 $ 5 1 . 6 $ 1 3 .7 2 0 20 2 0 21 2 0 22 9/30/23 LTM B. Riley ownership Prior to acquisition 10/18/22 Prior to acquisition 10/18/22 Targus Financial Results B. Riley Financial at a Glance B. Riley Securities Financial Consulting Liquidation Wealth Communications Targus Brands Principal Investing 51

08 B RAN D S

Six Brands October 2019 $116MM invested 80% owned ▪ Purchased the IP from the prior owner and operator, Bluestar Alliance . ▪ These brands are mature, relatively steady, and sold through full - and off - price B&M channels. Hurley October 2019 $67.5MM invested 43% owned ▪ Purchased as a divestiture from Nike. ▪ Since late 2019 it has nearly completely repaid our invested capital. Justice November 2020 $30MM invested 41% owned ▪ Purchased during Ascena Retail Group’s bankruptcy. ▪ Since late 2020 has returned approximately two thirds of our invested capital. Scotch and Soda March 2023 $12MM invested 10% owned ▪ Purchased out of its own bankruptcy process in the Netherlands. ▪ In less than a year of ownership, has returned over a quarter of our invested capital. • Our operating partner, Bluestar Alliance, licenses the use of these brands to a wide base of apparel manufacturers, each of whom focuses on a particular category of goods and pays a royalty based on their wholesale revenue. The licensees agree to multi - year contracts and pay a guaranteed minimum royalty (“GMR”) to hold the right to their segment. • Operating expenses for this unit are very low and often > 80% of the royalty income flows to EBITDA for distribution to shareholders Brands Overview 2023 2020 2019 B. Riley Financial at a Glance B. Riley Securities Financial Consulting Liquidation Wealth Communications Targus Brands Principal Investing 53

Net Inv e s t m e n t ( 1 ) Cumulative Di s t r ib u t io n s Investment Ownership E n t r y Date $67.8 $48.2 $116.0 80.0% Oct ’19 Six Brands 0.5 67.0 67.5 42.9% Oct ’19 Hurley 10.1 19.9 30.0 40.9% Nov ’20 Justice 8.7 3.3 12.0 10.3% Mar ’23 Scotch & Soda $87.1 $138.4 $225.5 Total 10.7 12.8 1 2 .8 1 2 .2 18.7 13.1 18.0 22.1 2.8 10.0 9.8 $3.3 $ 2 9 . 4 $ 2 8 . 6 $ 4 0 . 8 $4 7 . 5 2020 Six Brands 2021 H u r l e y 2 0 22 Justice 9/30/23 LTM Scotch & Soda I n v e s t m e n t M e t r i c s ( $ MM ) Distributions ($MM) Brands portfolio is owned for net investment of ~1.8x LTM distributions, with ~60% of investment returned Distributions represent cash wired from the joint ventures to B. Riley. Distributions approximate B. Riley’s pro rata share of each joint venture’s EBITDA. (1) Net investment defined as investment less cumulative distributions Brands Financial Results B. Riley Financial at a Glance B. Riley Securities Financial Consulting Liquidation Wealth Communications Targus Brands Principal Investing 54

09 PRINCIPAL INVESTING
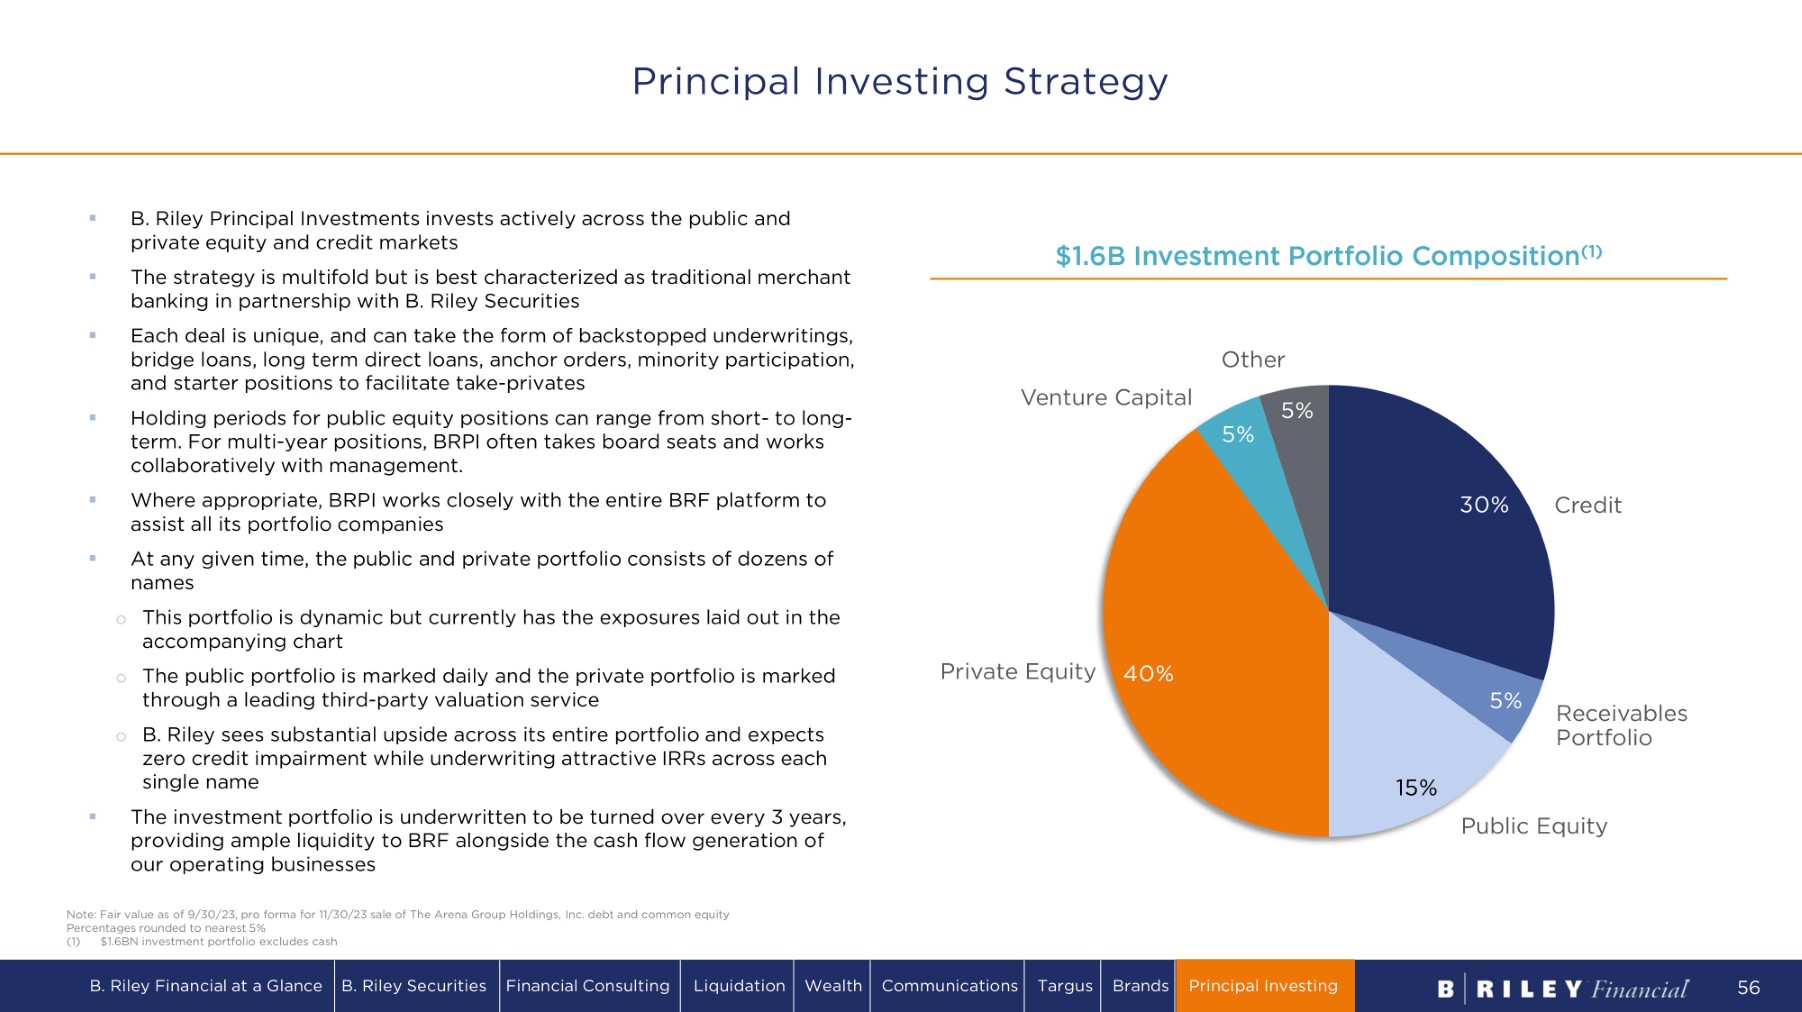
▪ B. Riley Principal Investments invests actively across the public and private equity and credit markets ▪ The strategy is multifold but is best characterized as traditional merchant banking in partnership with B. Riley Securities ▪ Each deal is unique, and can take the form of backstopped underwritings, bridge loans, long term direct loans, anchor orders, minority participation, and starter positions to facilitate take - privates ▪ Holding periods for public equity positions can range from short - to long - term. For multi - year positions, BRPI often takes board seats and works collaboratively with management. ▪ Where appropriate, BRPI works closely with the entire BRF platform to assist all its portfolio companies ▪ At any given time, the public and private portfolio consists of dozens of names o This portfolio is dynamic but currently has the exposures laid out in the accompanying chart o The public portfolio is marked daily and the private portfolio is marked through a leading third - party valuation service o B . Riley sees substantial upside across its entire portfolio and expects zero credit impairment while underwriting attractive IRRs across each single name ▪ The investment portfolio is underwritten to be turned over every 3 years, providing ample liquidity to BRF alongside the cash flow generation of our operating businesses $ 1 . 6 B I n v e s t m e n t P o r tf o li o C o m p o si t i o n ( 1 ) 3 0% 5% 1 5% 4 0% 5% 5% C r e d i t R e c ei v a b l es Portfolio Public Equity Private Equity Venture Capital O t h e r Principal Investing Strategy Note: Fair value as of 9/30/23, pro forma for 11/30/23 sale of The Arena Group Holdings, Inc. debt and common equity Percentages rounded to nearest 5% (1) $1.6BN investment portfolio excludes cash B. Riley Financial at a Glance B. Riley Securities Financial Consulting Liquidation Wealth Communications Targus Brands Principal Investing 56
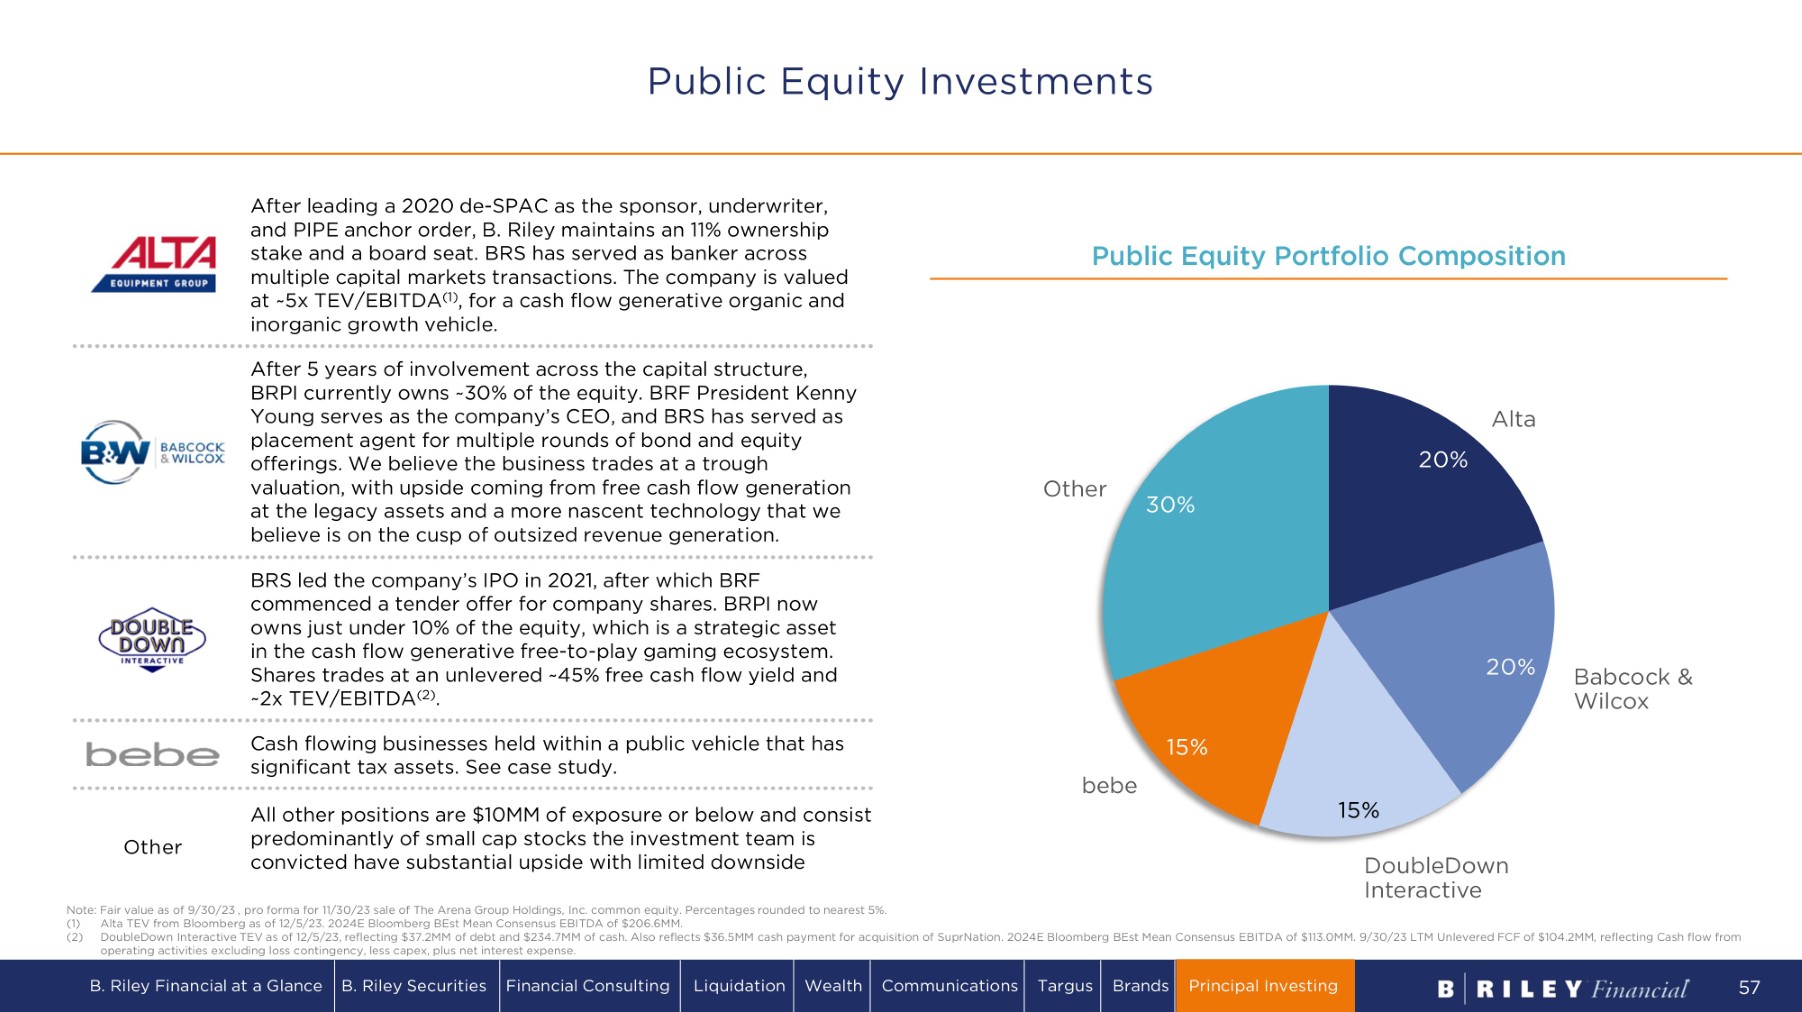
Public Equity Portfolio Composition 2 0% 2 0% 1 5% 1 5% 3 0% A l ta Babcock & Wilcox D o u b l eD o w n Interactive bebe O t h e r After 5 years of involvement across the capital structure, BRPI currently owns ~30% of the equity. BRF President Kenny Young serves as the company’s CEO, and BRS has served as placement agent for multiple rounds of bond and equity offerings. We believe the business trades at a trough valuation, with upside coming from free cash flow generation at the legacy assets and a more nascent technology that we believe is on the cusp of outsized revenue generation. BRS led the company’s IPO in 2021, after which BRF commenced a tender offer for company shares. BRPI now owns just under 10% of the equity, which is a strategic asset in the cash flow generative free - to - play gaming ecosystem. Shares trades at an unlevered ~45% free cash flow yield and ~2x TEV/EBITDA (2) . After leading a 2020 de - SPAC as the sponsor, underwriter, and PIPE anchor order, B. Riley maintains an 11% ownership stake and a board seat. BRS has served as banker across multiple capital markets transactions. The company is valued at ~5x TEV/EBITDA (1) , for a cash flow generative organic and inorganic growth vehicle. Cash flowing businesses held within a public vehicle that has significant tax assets. See case study. All other positions are $10MM of exposure or below and consist predominantly of small cap stocks the investment team is convicted have substantial upside with limited downside O t h er Note: Fair value as of 9/30/23 , pro forma for 11/30/23 sale of The Arena Group Holdings, Inc. common equity. Percentages rounded to nearest 5%. (1) Alta TEV from Bloomberg as of 12/5/23. 2024E Bloomberg BEst Mean Consensus EBITDA of $206.6MM. (2) DoubleDown Interactive TEV as of 12/5/23, reflecting $37.2MM of debt and $234.7MM of cash. Also reflects $36.5MM cash payment for acquisition of SuprNation. 2024E Bloomberg BEst Mean Consensus EBITDA of $113.0MM. 9/30/23 LTM Unlevered FCF of $104.2MM, reflecting Cash flow from operating activities excluding loss contingency, less capex, plus net interest expense. Public Equity Investments B. Riley Financial at a Glance B. Riley Securities Financial Consulting Liquidation Wealth Communications Targus Brands Principal Investing 57
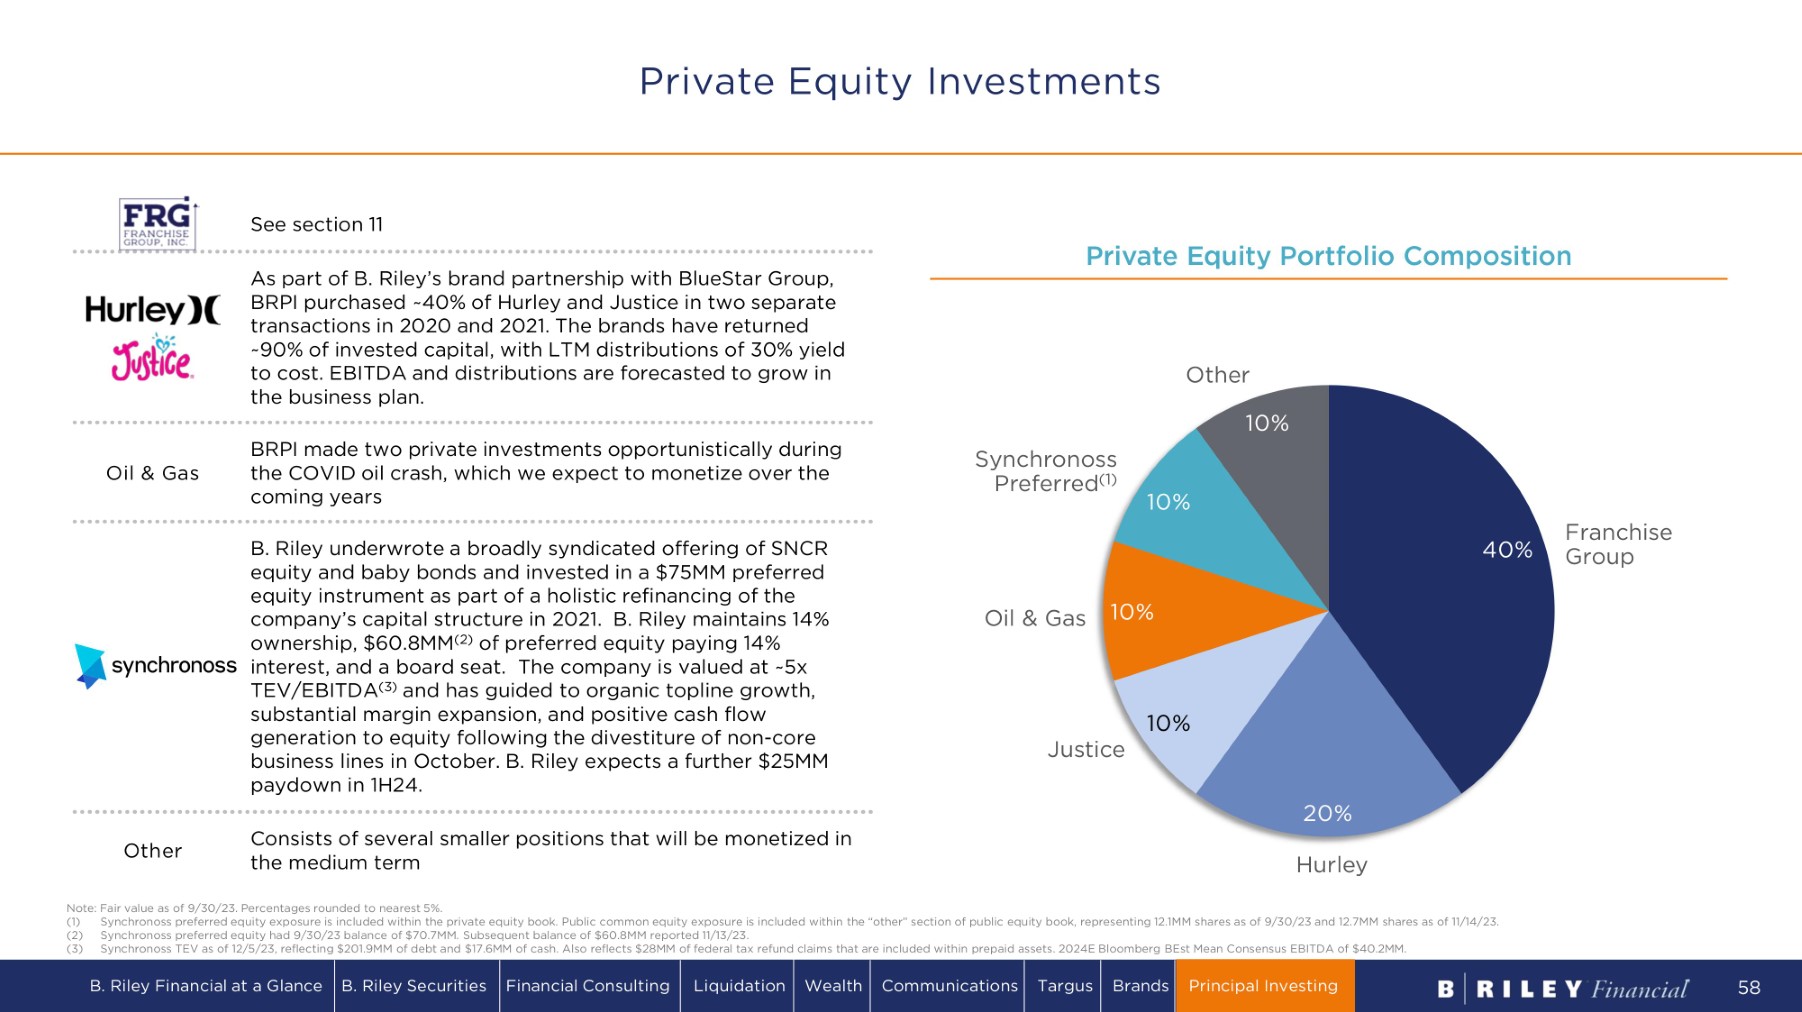
Private Equity Portfolio Composition As part of B . Riley’s brand partnership with BlueStar Group, BRPI purchased ~ 40 % of Hurley and Justice in two separate transactions in 2020 and 2021 . The brands have returned ~90% of invested capital, with LTM distributions of 30% yield to cost. EBITDA and distributions are forecasted to grow in the business plan. BRPI made two private investments opportunistically during the COVID oil crash, which we expect to monetize over the coming years See section 11 B. Riley underwrote a broadly syndicated offering of SNCR equity and baby bonds and invested in a $75MM preferred equity instrument as part of a holistic refinancing of the company’s capital structure in 2021. B. Riley maintains 14% ownership, $60.8MM (2) of preferred equity paying 14% interest, and a board seat. The company is valued at ~5x TEV/EBITDA (3) and has guided to organic topline growth, substantial margin expansion, and positive cash flow generation to equity following the divestiture of non - core business lines in October. B. Riley expects a further $25MM paydown in 1H24. Note: Fair value as of 9/30/23. Percentages rounded to nearest 5%. Synchronoss preferred equity exposure is included within the private equity book. Public common equity exposure is included within the “other” section of public equity book, representing 12.1MM shares as of 9/30/23 and 12.7MM shares as of 11/14/23. (1) (2) Synchronoss preferred equity had 9/30/23 balance of $70.7MM. Subsequent balance of $60.8MM reported 11/13/23. (3) Synchronoss TEV as of 12/5/23, reflecting $201.9MM of debt and $17.6MM of cash. Also reflects $28MM of federal tax refund claims that are included within prepaid assets. 2024E Bloomberg BEst Mean Consensus EBITDA of $40.2MM. Consists of several smaller positions that will be monetized in the medium term O t h er Oil & Gas 4 0% 2 0% 1 0% 1 0% 1 0% 1 0% F ra n c h i s e Group H u r l ey J u s t i c e Oil & Gas S y n c h r ono s s P r e f e r r e d ( 1 ) O t h e r Private Equity Investments B. Riley Financial at a Glance B. Riley Securities Financial Consulting Liquidation Wealth Communications Targus Brands Principal Investing 58

Credit Portfolio Composition 35 % 2 0% 1 5% 1 0% 5% 5% V i n t a ge HY Bonds / Pref E x e l a 1 0% Core Scientific C a di z Receivables Portfolio O t h e r Mostly a portfolio of stressed high - yield credit that we expect to provide $25MM+ of future P&L plus coupons Exela investment has generated 30%+ IRRs since inception. Two - thirds of this position is comprised of asset - backed loans with low probability of default. One - third of our exposure is marked at a ~20% haircut to publicly traded securities on a look - through basis. Vintage and Brian Kahn has been a profitable relationship for the firm, most notably via the original FRG transactions and the Badcock Receivables portfolio (see both case studies for detail). The $201MM secured Vintage loan bears PIK interest of 12% and matures in 2027. The vast majority of the collateral are shares of FRG. Expected to emerge from bankruptcy in Jan 2024. B. Riley’s sub debt is marked at $42MM vs. expected equity value post - emergence of $66MM. Despite the default, at current equity prices, B. Riley will make money on this loan. Our receivables portfolio is comprised of 3 separate transactions, 2 of which are outlined in the Badcock Receivables Case Study. Gross IRRs in the portfolio have been 25%+ and we expect the portfolio to be fully monetized within the next 18 months. Receivables V i n t a g e HY Bonds / Pref Since 2019, B. Riley has made 53 total loans. 38 (69%) have been paid back with a weighted average IRR of 12.7%. 15 loans remain outstanding with the notable examples outlined here. Note: Fair value as of 9/30/23, pro forma for 11/30/23 sale of The Arena Group Holdings, Inc. debt Top of capital structure and well covered on asset value basis Credit Investments Percentages rounded to nearest 5% B. Riley Financial at a Glance B. Riley Securities Financial Consulting Liquidation Wealth Communications Targus Brands Principal Investing 59

10 FRANCHISE GROUP

Vintage Capital Historical Value Creation in Collaboration with B. Riley Liberty Tax Acquisition and Formation of FRG (2018 – 2019) • Aug - 18: Vintage Capital, led by Brian Kahn, and B. Riley acquire majority position in Liberty Tax for $8.54 per share • Jul - 19: Liberty Tax and Buddy’s Home Furnishings (Vintage Capital asset) merge • Sept - 19: Liberty Tax renamed Franchise Group, Inc. (FRG) Innovative Financing Structures and Company Privatization (2021 – 2023) • Dec - 21: Sells $400MM Badcock receivables portfolio to B. Riley • Mar - 22: Completes $268MM sale - leaseback of Badcock real estate; B. Riley serves as Advisor • Oct - 22: Sells $148MM Badcock receivables portfolio to B. Riley • 4Q - 22 to 1Q - 23: Sells $377MM Badcock receivables portfolio to B. Riley in four transactions • May - 23: FRG announces take - private at $30 per share transaction led by Brian Kahn and management; B. Riley provides equity commitment Expanding Platform of Franchised and Franchisable Businesses (2019 – 2021) • Dec - 19: Acquires the Vitamin Shoppe; debt financing arranged by B. Riley • Feb - 20: Acquires American Freight; B. Riley provides loan commitment and partial guarantee • Jun - 20: Raises $112.3MM in follow - on equity offering led by B. Riley • Nov - 20: Refranchises 47 Buddy’s locations to bebe stores, Inc., an affiliate of B. Riley • Jan - 21: Raises $75MM in preferred stock offering led by B. Riley • Mar - 21: Acquires Pet Supplies Plus; B. Riley serves as financial advisor • Jul - 21: Sells Liberty Tax to NextPoint for ~$249MM total consideration at closing • Sept - 21: Acquires Sylvan Learning, Inc. • Nov - 21: Acquires W.S. Badcock Corporation 61

FRG Transaction Summary Capital structure as of 12/12/23. Debt principal as of 12/12/2023. Cash Balance as of 11/30/23. Current Capital Structure ($MM) C u r r en t D e b t O u t s t a n d i ng Transaction Background ▪ On August 21, 2023, B. Riley led the equity financing to facilitate the management - led acquisition of Franchise Group, Inc. ▪ B. Riley helped build the Company since its inception and is deeply familiar with the asset base and management team. Post the acquisition, B. Riley has ownership of 31% and board representation. 62 Capital Structure $319.6 Management Rollover 281.1 RILY 301.9 Others 902.6 Total Equity 2,013.5 (+) Debt (57.2) ( - ) Cash 2,858.9 Enterprise Value % ($MM) Tranche SOFR + 10.00% $475.0 Holdco SOFR + 4.75% 1,095.0 First Lien SOFR + 10.00% 125.0 Second Lien SOFR + 2.00% 318.5 ABL $2,013.5 Total

Underwriting Sum of the Parts Valuation Multiple Implied EV High Median Low Valuation metric ($MM) $1,148 10.0x 8.5x 7.0x $135 2022A Adj. EBITDA Vitamin Shoppe 168 13.0x 12.0x 11.0x 14 2022A Adj. EBITDA Sylvan Learning Centers 160 11.0x 10.0x 9.0x 16 2022A Adj. EBITDA Buddy’s 2,220 13.0x 12.0x 11.0x 185 2026E Adj. EBITDA Pet Supplies Plus 1,904 9.0x 8.0x 7.0x 238 2026E Adj. EBITDA American Freight 390 7.0x 6.0x 5.0x 65 2026E Adj. EBITDA Badcock $5,990 Total 63 The valuation metrics underlying the chart represent projections at July 2023, on the basis of which B. Riley underwrote the deal. While projections for individual business units may have changed over time, B. Riley continues to believe that the overall enterprise values represented in the chart are reasonable estimates. 2022A Adj. EBITDA was consistent with B. Riley’s expectations for 2023E Adj. EBITDA at the time of underwriting, July 2023. 2026E Adj. EBITDA estimates represent B. Riley’s projections at the time of underwriting, July 2023.
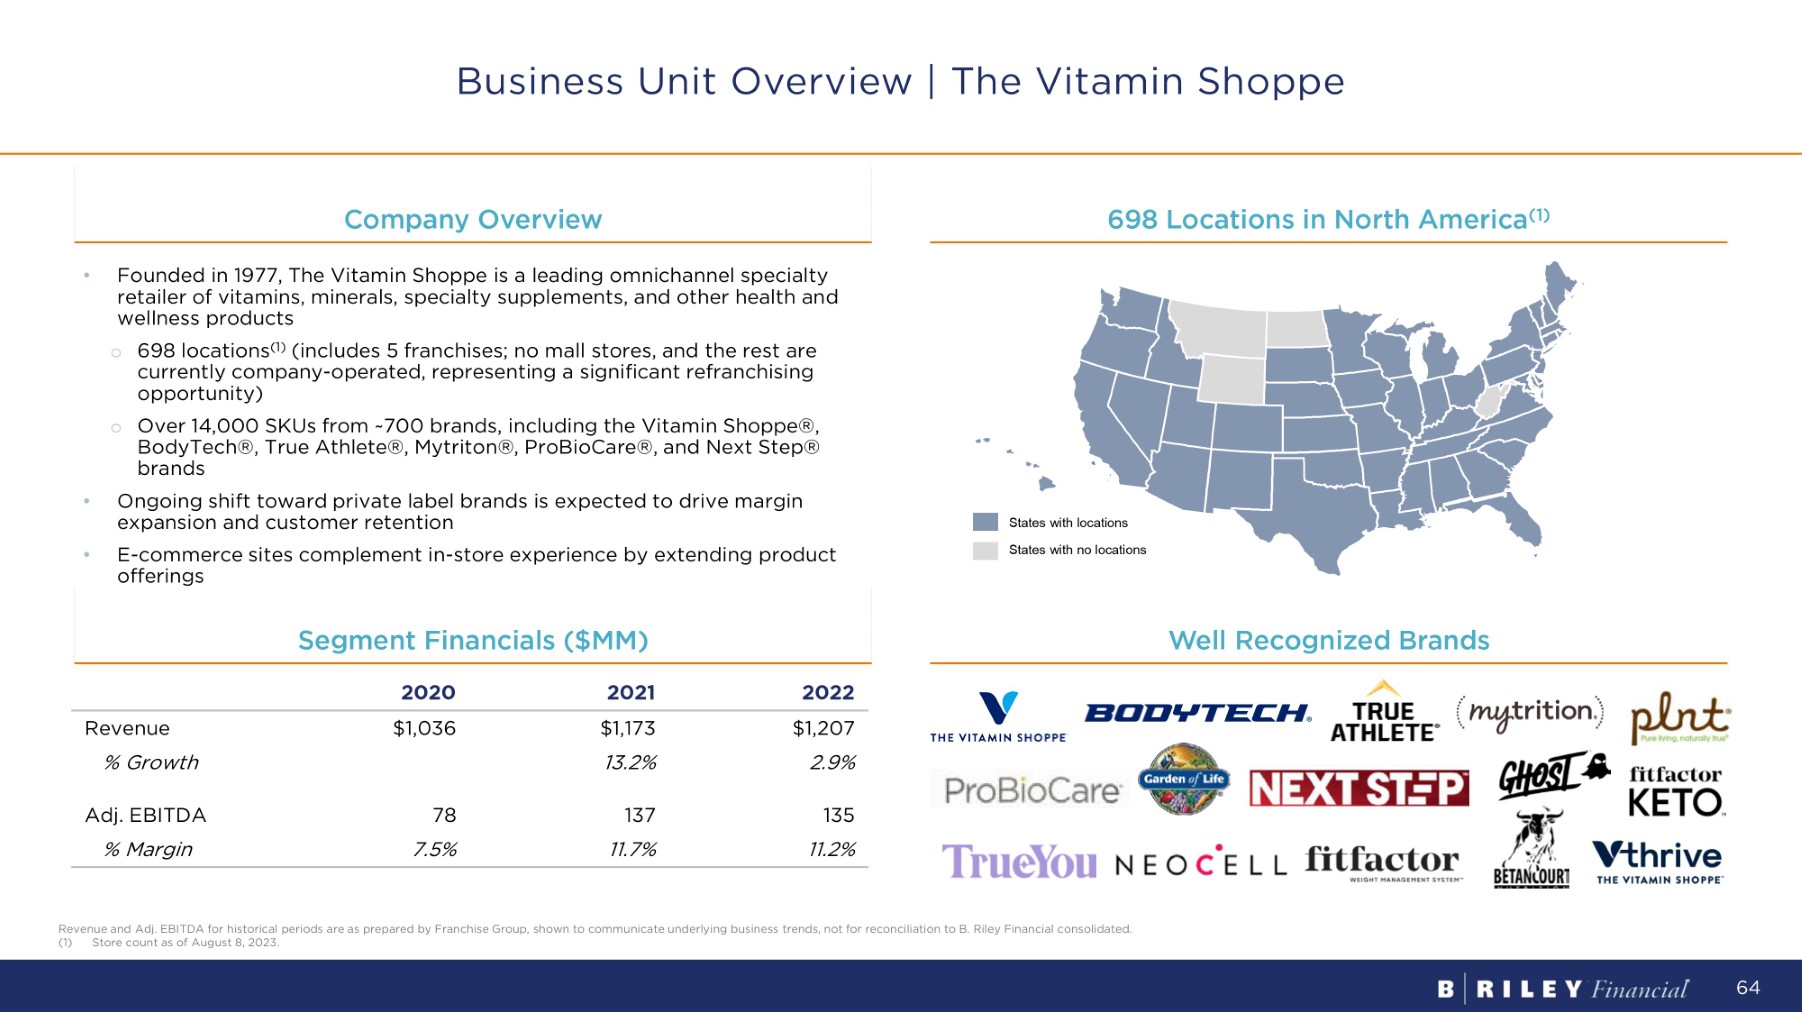
C o m p a n y O v e r v i e w 698 Locations in North America (1) Business Unit Overview | The Vitamin Shoppe 2022 2021 2020 $1,207 $1,173 $1,036 Revenue 2.9% 13.2% % G r o wt h 135 137 78 Adj. EBITDA 11.2% 11.7% 7.5% % M a rg i n Segment Financials ($MM) Well Recognized Brands • Founded in 1977, The Vitamin Shoppe is a leading omnichannel specialty retailer of vitamins, minerals, specialty supplements, and other health and wellness products o 698 locations ( 1 ) (includes 5 franchises ; no mall stores, and the rest are currently company - operated, representing a significant refranchising opportunity) o Over 14 , 000 SKUs from ~ 700 brands, including the Vitamin Shoppe®, BodyTech®, True Athlete®, Mytriton®, ProBioCare®, and Next Step® brands • Ongoing shift toward private label brands is expected to drive margin expansion and customer retention • E - commerce sites complement in - store experience by extending product offerings States with locations States with no locations Revenue and Adj. EBITDA for historical periods are as prepared by Franchise Group, shown to communicate underlying business trends, not for reconciliation to B. Riley Financial consolidated. (1) Store count as of August 8, 2023. 64

E du c a tio n Level Description Service Pre - K to Grade 12 Highly personalized learning plan developed with specific goals unique to each child’s needs ▪ Reading, math, writing, and study skills ▪ Homework help ▪ State test prep SylvanSync & Personalized Tutoring G r a d es 9 - 12 Support for the college bound student, with learning t a il o re d t o i n di v id u a l a d v a n c emen t g oa ls in a 1 : 1 or small group class setting ▪ SAT and ACT prep ▪ AP prep ▪ Course for credit ▪ College coaching College P re p ara t i on Pre - K to Grade 8 Fun, hands - on after school classes, weekend workshops, and developmental camps ▪ Math, science, and engineering ▪ STEM camps ▪ Robotics ▪ Coding STEM Pre - K to Grade 9 Small group, intervention - focused programs to remediate specific skill deficits in math and reading ▪ Math (K - Algebra) ▪ Reading (K - 8) Ace It! Suite of Services Business Unit Overview | Sylvan Learning Centers 2022 2021 2020 $42 $38 $26 Revenue 10.8% 45.8% % G r o wt h 14 12 6 Adj. EBITDA 33.1% 31.4% 22.9% % M a rg i n Segment Financials ($MM) Company Overview Revenue and Adj. EBITDA for historical periods are as prepared by Franchise Group, shown to communicate underlying business trends, not for reconciliation to B. Riley Financial consolidated. (1) Store count as of August 8, 2023. 65 ▪ Founded in 1979 , Sylvan Learning Centers is a leading omnichannel tutoring franchisor for PreK - 12 students and families, with over 700 locations in 49 states in the U . S . and 7 countries worldwide ( 1 ) ▪ Sylvan addresses the full range of remedial to advanced student needs with a broad variety of academic curriculums ▪ The business has the ability to provide a range of services, including on - premises, online, one - on - one, and in - group tutoring ▪ 99 % of the centers are franchised ; there are only 5 corporate locations

Appliances Computers and Electronics Furniture Company Overview 335 Locations in North America (1) Business Unit Overview | Buddy’s Home Furnishings 2022 2021 2020 $57 $64 $97 Revenue (10.9%) (33.8%) % G r o wt h 16 18 27 Adj. EBITDA 27.9% 27.9% 27.7% % M a rg i n Segment Financials ($MM) Representative Products Offered ▪ Founded in 1961 , Buddy’s Home Furnishings is one of North America’s leading operators of rent - to - own stores for home furnishing products and related accessories, with 335 stores ( 90 % franchised) located across 21 U . S . states and territories ( 1 ) ▪ Highest percentage of franchised stores in the RTO industry, providing a potential path to growth without significant capital investments ▪ The 36 company - operated stores serve as a proving ground for operational initiatives ▪ Sources products from large, well - known brands, such as Ashley Furniture, Sealy, LG, GE, Samsung, Whirlpool, Dell, and HP States with locations States with no locations Revenue and Adj. EBITDA for historical periods are as prepared by Franchise Group, shown to communicate underlying business trends, not for reconciliation to B. Riley Financial consolidated. (1) Store count as of August 8, 2023. 66

C o m p a n y O v e r v i e w 382 Locations in North America (1) Business Unit Overview | Badcock Home Furniture 2022 2021 2020 $716 $907 $899 Revenue (21.1%) 0.9% % G r o wt h 101 85 106 Adj. EBITDA 14.1% 9.4% 11.8% % M a rg i n S e g m e n t F i n a n c i a l s ( $ MM) Décor and Accents Electronics and Appliances Furniture Representative Products Offered ▪ Founded in 1904 , Badcock Home Furniture (“Badcock”) is one of the largest home - furnishings retailers, with 382 stores across 8 states in the Southeastern U . S . ( 1 ) ▪ The business offers a variety of products ranging from furniture, appliances, bedding, and floor covering, to home entertainment items ▪ Badcock runs an independent dealer network model for many of its stores, enabling entry into attractive locations without tying up capital ; dealer contract length is typically 10 years ▪ Stores are paid a monthly commission based on completed sales ▪ Individual stores are not responsible for extending credit, collections, pricing, advertising, or inventory States with locations States with no locations Revenue and Adj. EBITDA for historical periods are as prepared by Franchise Group, shown to communicate underlying business trends, not for reconciliation to B. Riley Financial consolidated. (1) Store count as of August 8, 2023. 67

C o m p a n y O v e r v i e w 7 1 8 L oc a t i o n s i n No r t h A m e r i c a ( 1 ) Business Unit Overview | Pet Supplies Plus 2022 2021 2020 $1,289 $1,121 $846 Revenue 15.0% 32.5% % G r o wt h 115 93 76 Adj. EBITDA 8.9% 8.3% 9.0% % M a rg i n Segment Financials ($MM) Diversified Portfolio of Brands ▪ Founded in 1988 , Pet Supplies Plus (“PSP”) is a leading U . S . pet care franchisor with 718 corporate and franchised stores ( 67 % franchised) across 39 states ( 1 ) ▪ Same - day delivery, BOPIS, and subscription services underpin differentiated online model ▪ Offers a curated selection of premium brands, proprietary private labels, and retail price parity with online players ▪ Captive distribution network provides ~ 90 % of merchandise to all stores, acting as a second royalty stream while saving franchisees money ▪ In 2022 , PSP acquired Wag N’ Wash, a 14 - store franchised chain focused on dog grooming, pet wash, and curated selection of dog food and treats States with locations States with no locations Revenue and Adj. EBITDA for historical periods are as prepared by Franchise Group, shown to communicate underlying business trends, not for reconciliation to B. Riley Financial consolidated. (1) Store count as of August 8, 2023. 68
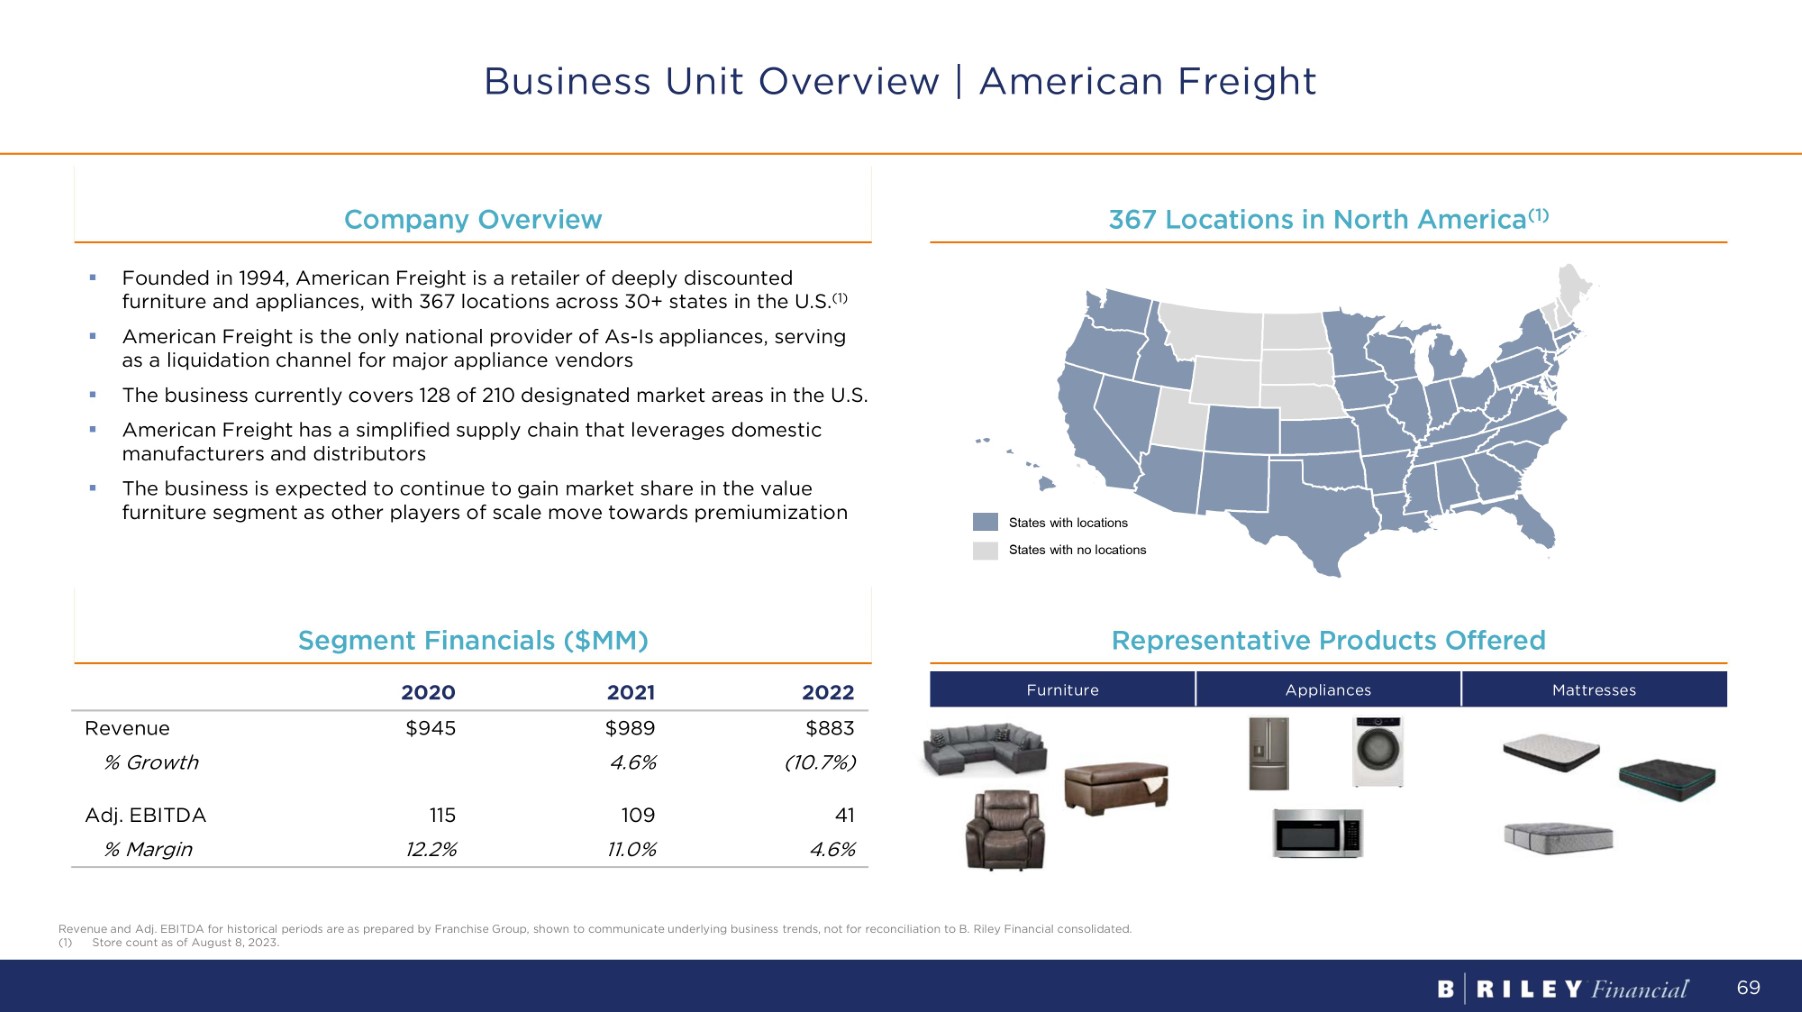
2022A R e v e nue M i x Company Overview 367 Locations in North America (1) Business Unit Overview | American Freight Segment Financials ($MM) 2022 2021 2020 $883 $989 $945 Revenue (10.7%) 4.6% % G r o wt h 41 109 115 Adj. EBITDA 4.6% 11.0% 12.2% % M a rg i n Mattresses Appliances Furniture Representative Products Offered States with locations States with no locations ▪ Founded in 1994, American Freight is a retailer of deeply discounted furniture and appliances, with 367 locations across 30+ states in the U.S. (1) ▪ American Freight is the only national provider of As - Is appliances, serving as a liquidation channel for major appliance vendors ▪ The business currently covers 128 of 210 designated market areas in the U.S. ▪ American Freight has a simplified supply chain that leverages domestic manufacturers and distributors ▪ The business is expected to continue to gain market share in the value furniture segment as other players of scale move towards premiumization Revenue and Adj. EBITDA for historical periods are as prepared by Franchise Group, shown to communicate underlying business trends, not for reconciliation to B. Riley Financial consolidated. (1) Store count as of August 8, 2023. 69

11 CONCLUSION
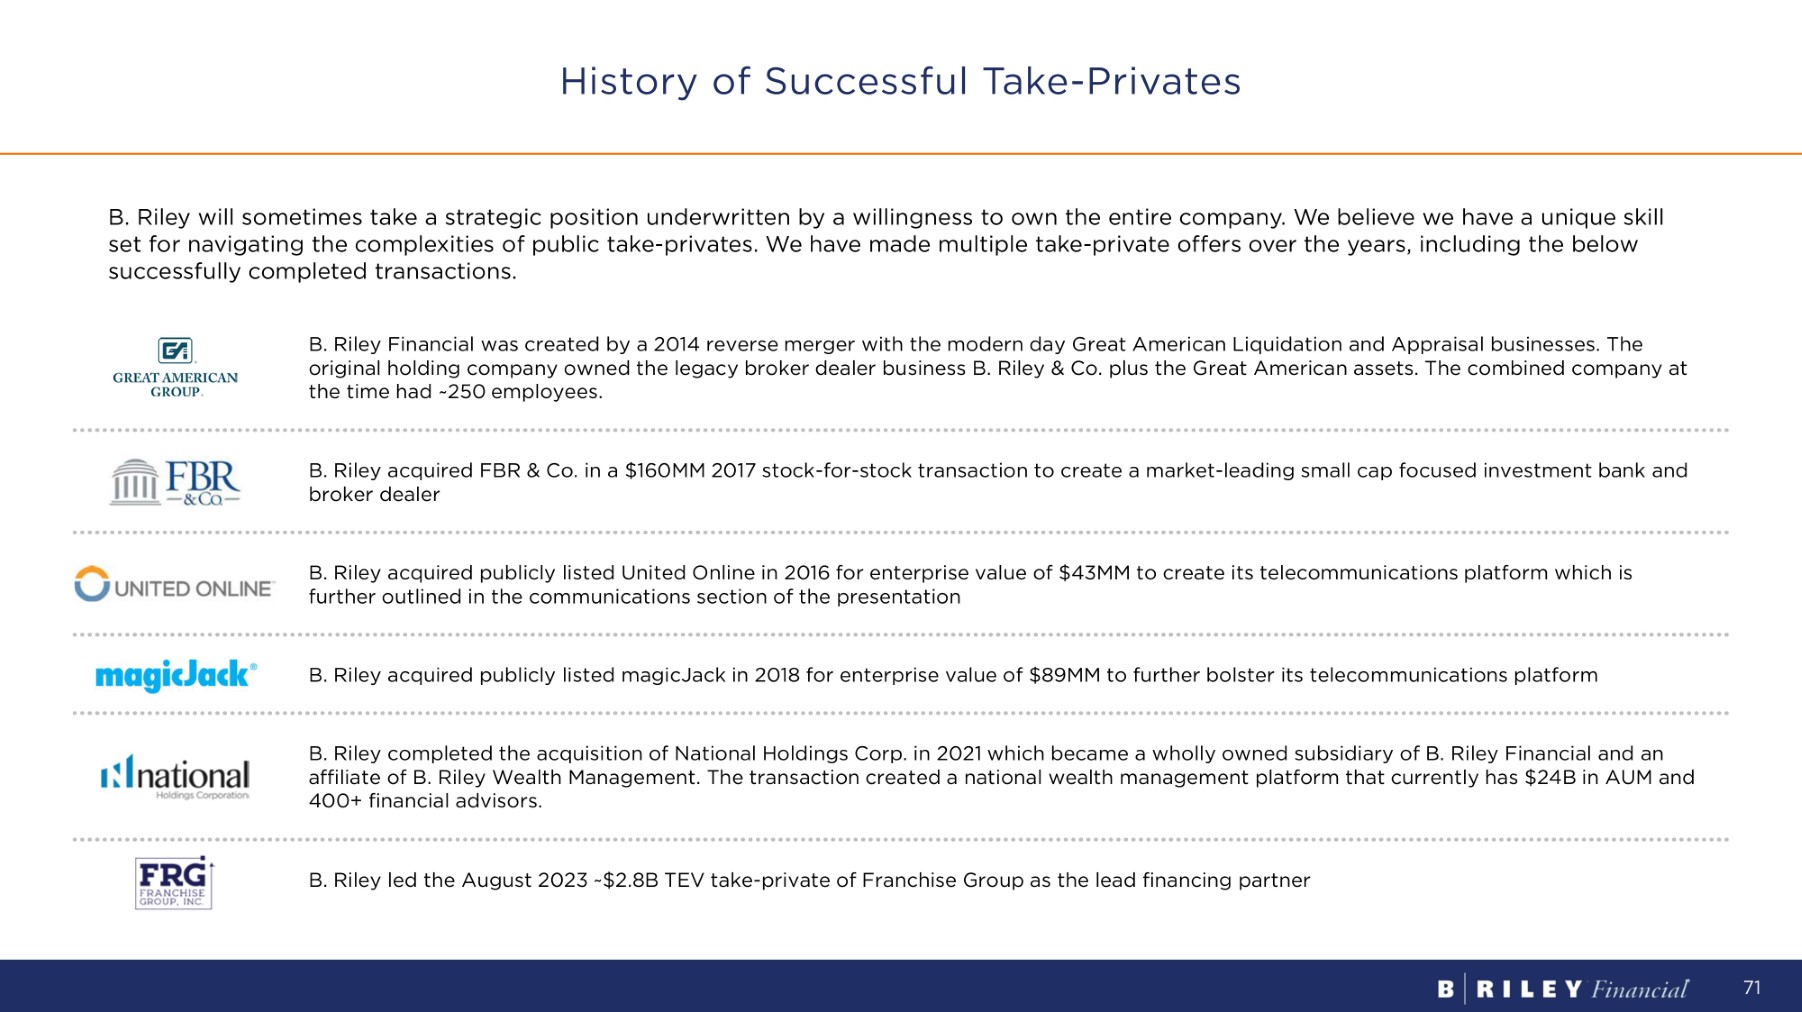
B. Riley will sometimes take a strategic position underwritten by a willingness to own the entire company. We believe we have a unique skill set for navigating the complexities of public take - privates. We have made multiple take - private offers over the years, including the below successfully completed transactions. B. Riley Financial was created by a 2014 reverse merger with the modern day Great American Liquidation and Appraisal businesses. The original holding company owned the legacy broker dealer business B. Riley & Co. plus the Great American assets. The combined company at the time had ~250 employees. B. Riley acquired FBR & Co. in a $160MM 2017 stock - for - stock transaction to create a market - leading small cap focused investment bank and broker dealer B. Riley acquired publicly listed United Online in 2016 for enterprise value of $43MM to create its telecommunications platform which is further outlined in the communications section of the presentation B. Riley acquired publicly listed magicJack in 2018 for enterprise value of $89MM to further bolster its telecommunications platform B. Riley completed the acquisition of National Holdings Corp. in 2021 which became a wholly owned subsidiary of B. Riley Financial and an affiliate of B. Riley Wealth Management. The transaction created a national wealth management platform that currently has $24B in AUM and 400+ financial advisors. B. Riley led the August 2023 ~$2.8B TEV take - private of Franchise Group as the lead financing partner History of Successful Take - Privates 71

I n s t i t u t i o n a l 48% I n s i d e rs 32% N o n - i n s t i t u t i o n a l 20% Strong Shareholder Alignment 83K Insider Open Market Purchases in Q4 2023 32% Insider Ownership 1.1M Insider Open Market Purchases in 2022 3.1M Insider Open Market Purchases since 2017 Significant Insider Ownership Ownership Summary 72 Data as of 12/12/23. Institutional ownership as defined by Nasdaq.com.
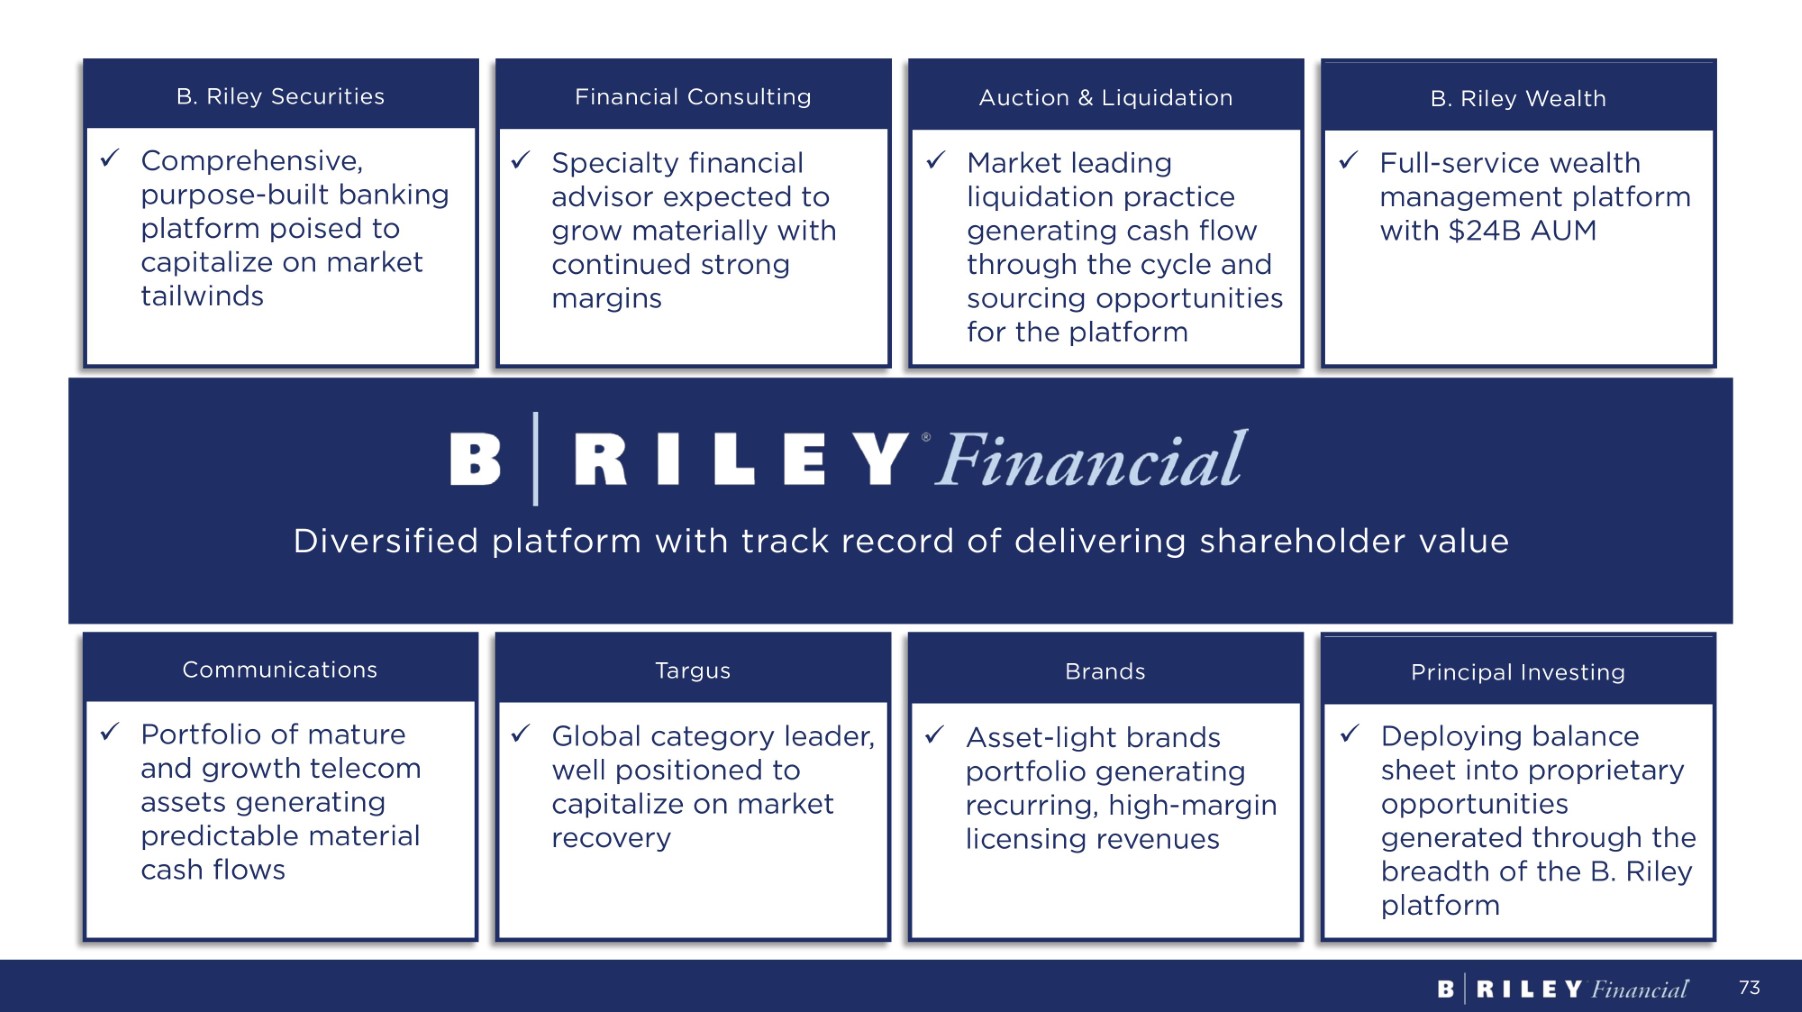
B. Riley Securities 73 Financial Consulting Auction & Liquidation B. Riley Wealth Communications Targus Brands Principal Investing Diversified platform with track record of delivering shareholder value x Comprehensive, purpose - built banking platform poised to capitalize on market tailwinds x Specialty financial advisor expected to grow materially with continued strong margins x Full - service wealth management platform with $24B AUM x Portfolio of mature and growth telecom assets generating predictable material cash flows x Market leading liquidation practice generating cash flow through the cycle and sourcing opportunities for the platform x Deploying balance sheet into proprietary opportunities generated through the breadth of the B. Riley platform x Asset - light brands portfolio generating recurring, high - margin licensing revenues x Global category leader, well positioned to capitalize on market recovery
12 APPENDIX

Consolidated Income Statement by year B. RILEY FINANCIAL, INC. AND SUBSIDIARIES C onso li da t e d F i nanc i a l I n f o r m a t i on ( D o ll a r s i n t hou s ands ) LT M 9 / 30 / 2023 (Unaudited) Y T D 9 / 30 / 2023 (Unaudited) Y T D 9 / 30 / 2022 (Unaudited) F Y 12 / 31 / 2022 F Y 12 / 31 / 2021 F Y 12 / 31 / 2020 R e v enue s - S e r v i ce s an d f ees R e v enue s - S a l e o f goods Trading (losses) income and fair value adjustments on loans Interest income - Loans and securities lending To t a l r evenu es D i r e c t co s t o f se r v i ce s C os t o f good s s o l d Selling, general, and administrative expenses Impairment of goodwill and tradenames Restructuring (charge) recovery Interest expense - Securities lending and loan participations sold O pe r a t i n g i nco m e I n t e r es t i nco m e D i v i den d i nco m e Realized and unrealized gains (losses) on investments C hang e i n f a i r v a l u e o f f i nanc i a l i ns t r u m en t s an d o t her ( Los s ) i nco m e o n equ i t y i n v es t m en t s I n t e r es t expen se ( Loss ) i nco m e be f o r e i nco m e t axes ( P r o v i s i on ) bene f i t f o r i nco m e t axes N e t ( l oss ) i nco m e Net (loss) income attributable to noncontrolling interests and r edee m ab l e non c on t r o l li n g i n t e r es t s Net (loss) income attributable to B. Riley Financial, Inc. 987 , 746 385 , 690 24,676 $ 743 , 909 251 , 310 83,346 $ 651,786 7,895 (143,958) $ 895,623 142,275 ( 202 , 628) $ 1,153,225 58,205 220,545 $ 645 , 906 29,135 56,677 $ 284,660 1,682,772 (246,684) (237,309) (831,752) (37,233) (1,944) (129,310) $ 198,540 4,937 45,230 (149,834) (3,538) 110 (184,521) 222,115 1,300,680 (178,188) (165,996) (623,200) (37,233) (949) (106,572) $ 188,542 3,455 35,635 (84,960) (3,998) (175) (140,122) 182,855 698,578 (73,959) (7,334) (506,062) 245,400 1,080,670 (142,455) (78,647) (714,614) 122,723 1,554,698 (54,390) (26,953) (906,196) 102,499 834,217 (60,451) (12,460) (428,537) (12,500) (1,557) ( 42 , 451) $ 276,261 564 21,163 47,341 - - - - (8,016) ( 43 , 757) $ 59,450 1,253 26,279 (136,205) 9,728 3,285 (96,787) (9,011) ( 66 , 495) $ 69,448 2,735 35,874 (201,079) 10,188 3,570 (141,186) ( 52 , 631) $ 514,528 229 19,732 166,131 3,796 2,801 (92,455) - (623) ( 65 , 249) $ (89,076) 9,654 (79,422) $ ( 1 , 623) (14,344) (15,967) $ (132,997) 39,858 (93,139) $ (220,450) 63,856 (156,594) $ 614,762 (163,960) 450,802 $ 279,457 (75,440) 204,017 (11,690) ( 5 , 680) 9 , 245 3 , 235 5 , 748 ( 1 , 131) $ (67,732) $ (10,287) $ (102,384) $ (159,829) $ 445,054 $ 205,148 75
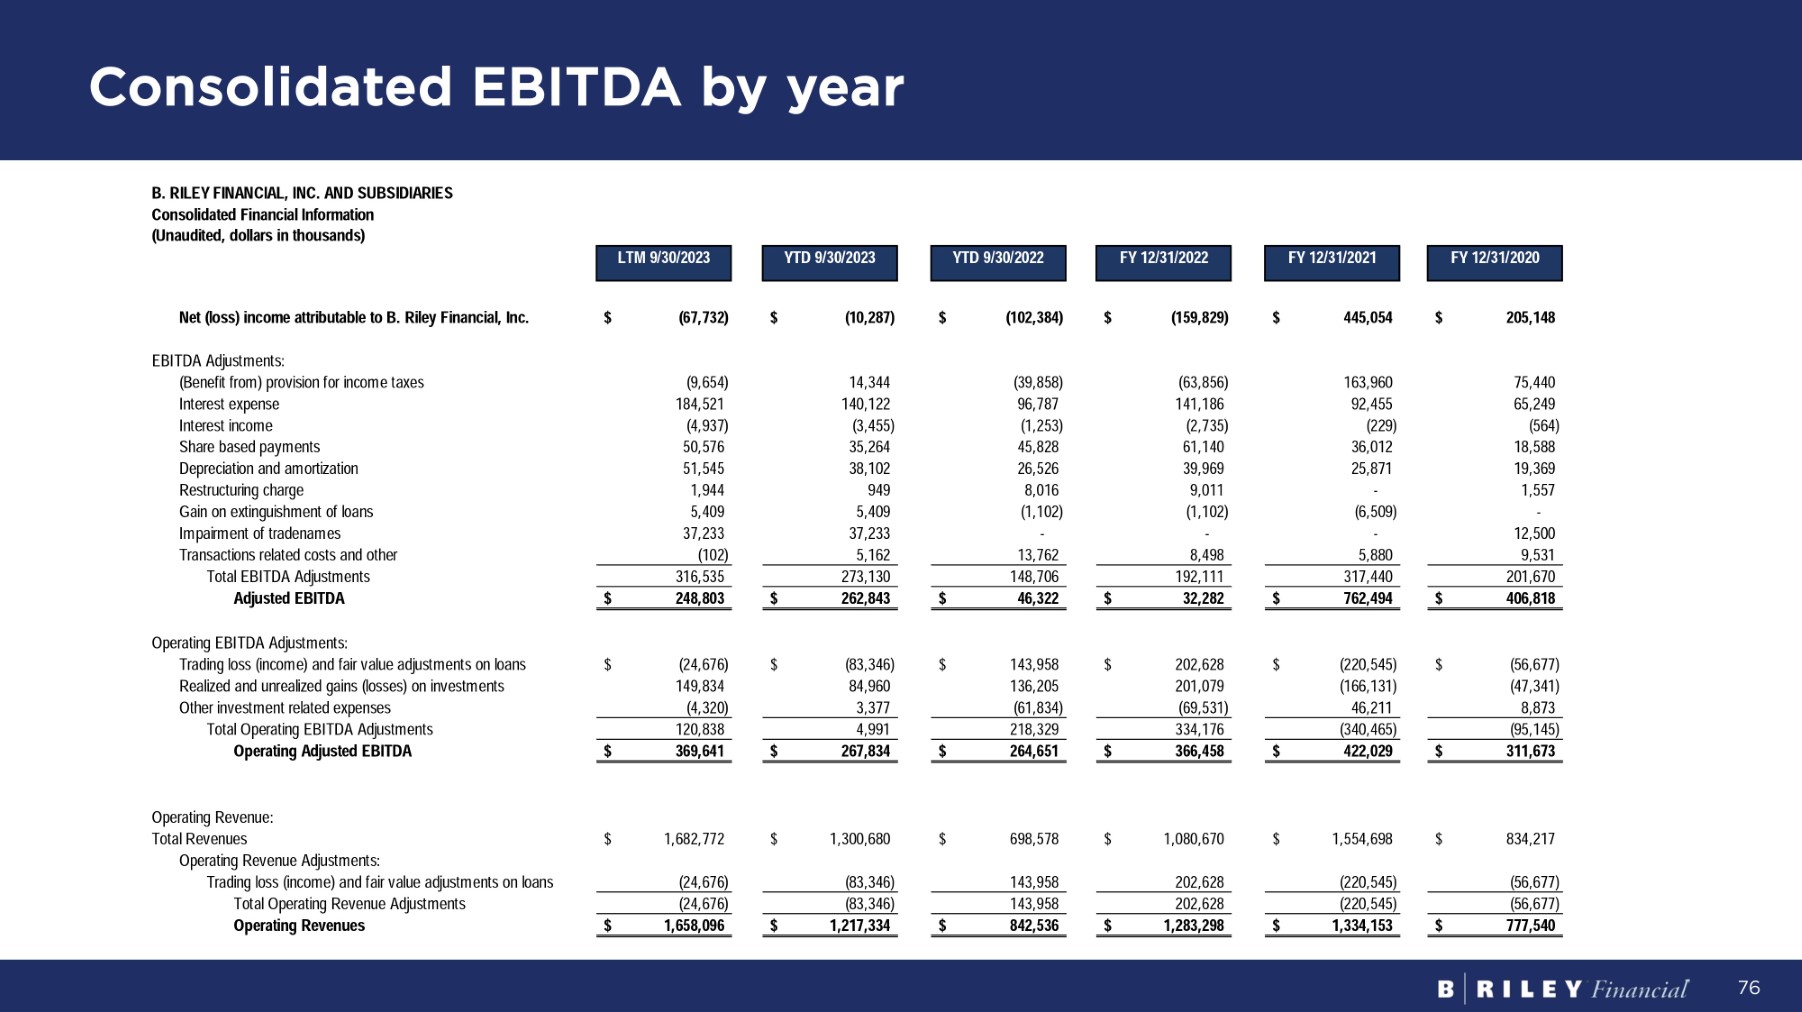
Consolidated EBITDA by year 76 B . R I LEY F I N A NC I A L , I NC . A N D S UB S I D I A R IES Consolidated Financial Information (Unaudited, dollars in thousands) LT M 9 / 30 / 2023 Y T D 9 / 30 / 2023 Y T D 9 / 30 / 2022 FY 12 / 31 / 2022 FY 12 / 31 / 2021 FY 12 / 31 / 2020 Net (loss) income attributable to B. Riley Financial, Inc. $ (67,732) $ (10,287) $ (102,384) $ (159,829) $ 445,054 $ 205,148 EB I T D A A d j us t m en t s : 75,440 163,960 (63,856) (39,858) 14,344 (9,654) (Benefit from) provision for income taxes 65,249 92,455 141,186 96,787 140,122 184,521 I n t e r es t expens e (564) (229) (2,735) (1,253) (3,455) (4,937) I n t e r es t i nco m e 18,588 36,012 61,140 45,828 35,264 50,576 S ha r e base d pa y m en t s 19,369 25,871 39,969 26,526 38,102 51,545 D ep r ec i a t i o n an d a m o r t i za t i on 1,557 - 9,011 8,016 949 1,944 R es t r uc t u r i n g cha r ge - (6,509) (1,102) (1,102) 5,409 5,409 G a i n o n ex t i ngu i sh m en t o f l oans 12,500 - - - 37,233 37,233 I m pa i r m en t o f t r adena m es 9,531 5,880 8,498 13,762 5,162 (102) T r ansac t i on s r e l a t e d cos t s an d o t her 201,670 317,440 192,111 148,706 273,130 316,535 T o t a l EB I T D A A d j us t m en t s $ 406,818 $ 762,494 $ 32,282 $ 46,322 $ 262,843 $ 248,803 A d j u s t e d E B I T D A $ (56,677) $ (220,545) $ 202,628 $ 143,958 $ (83,346) $ (24,676) O pe r a t i n g EB I T D A A d j us t m en t s : Trading loss (income) and fair value adjustments on loans (47,341) (166,131) 201,079 136,205 84,960 149,834 Realized and unrealized gains (losses) on investments 8,873 46,211 (69,531) (61,834) 3,377 (4,320) O t he r i n v es t m en t r e l a t e d expenses (95,145) (340,465) 334,176 218,329 4,991 120,838 T o t a l O pe r a t i n g EB I T D A A d j us t m en t s $ 311,673 $ 422,029 $ 366,458 $ 264,651 $ 267,834 $ 369,641 O p e r a ti n g A d j u s t e d E B I T D A O pe r a t i n g R e v enue: T o t a l R e v enues O pe r a t i n g R e v enu e A d j us t m en t s : 1,682,772 $ 1,300,680 $ 698,578 $ 1,080,670 $ 1,554,698 $ 834,217 $ (56,677) (220,545) 202,628 143,958 (83,346) (24,676) Trading loss (income) and fair value adjustments on loans (56,677) (220,545) 202,628 143,958 (83,346) (24,676) T o t a l O pe r a t i n g R e v enu e A d j us t m en t s $ 777,540 $ 1,334,153 $ 1,283,298 $ 842,536 $ 1,217,334 $ 1,658,096 O p e r a ti n g R eve nu es
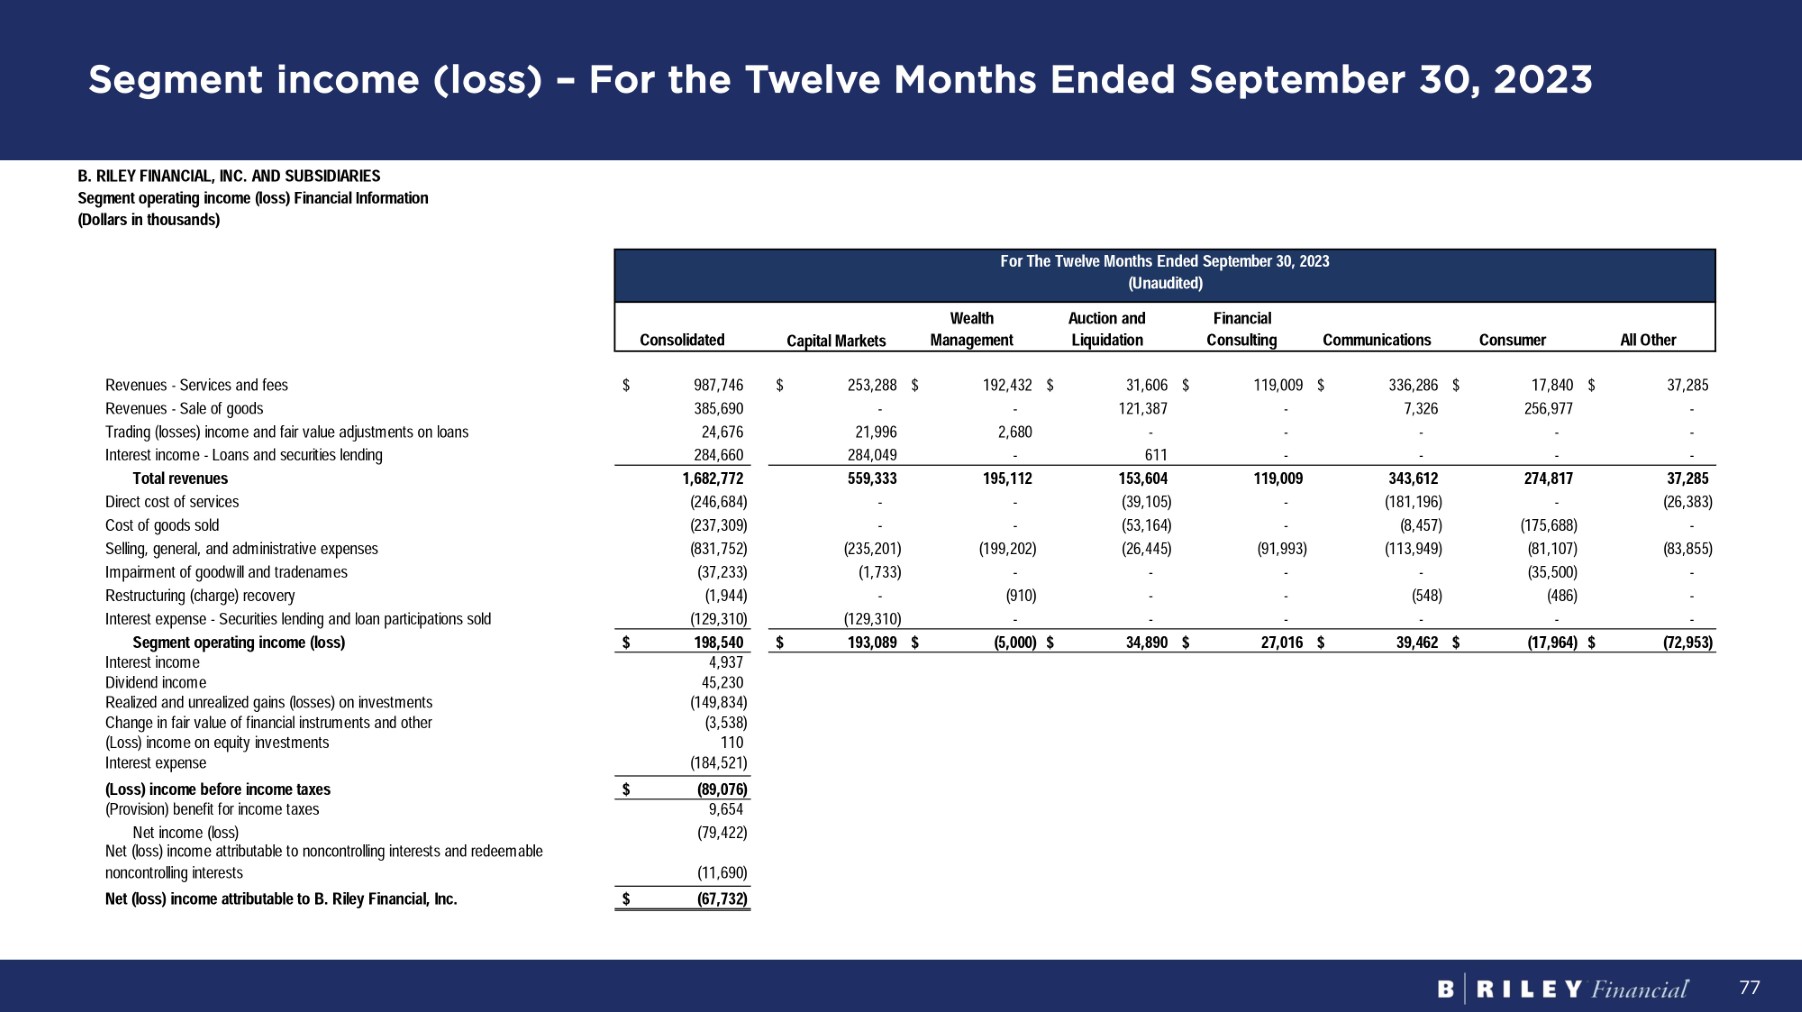
Segment income (loss) – For the Twelve Months Ended September 30, 2023 77 Fo r Th e T w e l v e M on t h s E nd e d S e p t e m b e r 30 , 2023 (Unaudited) A l l O t h e r Consumer Communications Financial C on s u lti ng A u c ti o n a nd Liquidation Wealth M a n a g e m e n t C a p it a l M a r ke t s Consolidated B . R I L EY F I N A NC I A L , I NC . A N D SUBS I D I A R IES Segment operating income (loss) Financial Information ( D o ll a rs i n t housands ) $ 37,285 $ 17,840 $ 336,286 $ 119,009 $ 31,606 $ 192,432 $ 253,288 $ 987,746 R e v enue s - S e r v i ce s an d f ees - 256,977 7,326 - 121,387 - - 385,690 R e v enue s - S a l e o f goods - - - - - 2,680 21,996 24,676 Trading (losses) income and fair value adjustments on loans 611 - - - - - 284,049 284,660 I n t e r es t i nco m e - Loan s an d secu r i t i e s l end i ng 37,285 274,817 343,612 119,009 153,604 195,112 559,333 1,682,772 To t a l r eve nu es (26,383) - (181,196) - (39,105) - - (246,684) D i r ec t cos t o f se r v i ce s - (175,688) (8,457) - (53,164) - - (237,309) C os t o f good s so l d (83,855) (81,107) (113,949) (91,993) (26,445) (199,202) (235,201) (831,752) S e lli ng , gene r a l , an d ad m i n i s t r a t i v e expenses - (35,500) - - - - (1,733) (37,233) Impairment of goodwill and tradenames - (486) - - (548) (910) - (1,944) R es t r uc t u r i n g ( cha r ge ) r eco v e r y - - - - - - (129,310) (129,310) I n t e r es t expens e - S ecu r i t i e s l end i n g an d l oa n pa r t i c i pa t i on s so l d (72,953) $ (17,964) $ 39,462 $ 27,016 $ 34,890 $ (5,000) $ 193,089 $ $ 198,540 S e g m e n t op e r a ti n g i n c o m e (l o ss ) 4,937 I n t e r es t i nco m e 45,230 D i v i den d i nco m e (149,834) Realized and unrealized gains (losses) on investments (3,538) C hang e i n f a i r v a l u e o f f i nanc i a l i ns t r u m en t s an d o t her 110 ( Loss ) i nco m e o n equ i t y i n v es t m en t s (184,521) I n t e r es t expens e $ ( 89 , 07 6) ( Lo ss ) i n c o m e b e f o r e i n c o m e t axes 9,654 ( P r o v i s i on ) bene f i t f o r i nco m e t axes (79,422) N e t i nco m e ( l oss ) Net (loss) income attributable to noncontrolling interests and redeemable (11,690) noncon t r o lli n g i n t e r es t s $ ( 67 , 73 2) N e t (l o ss ) i n c o m e a tt r i bu t a b l e t o B . R il e y F i n a n c i a l , I n c.
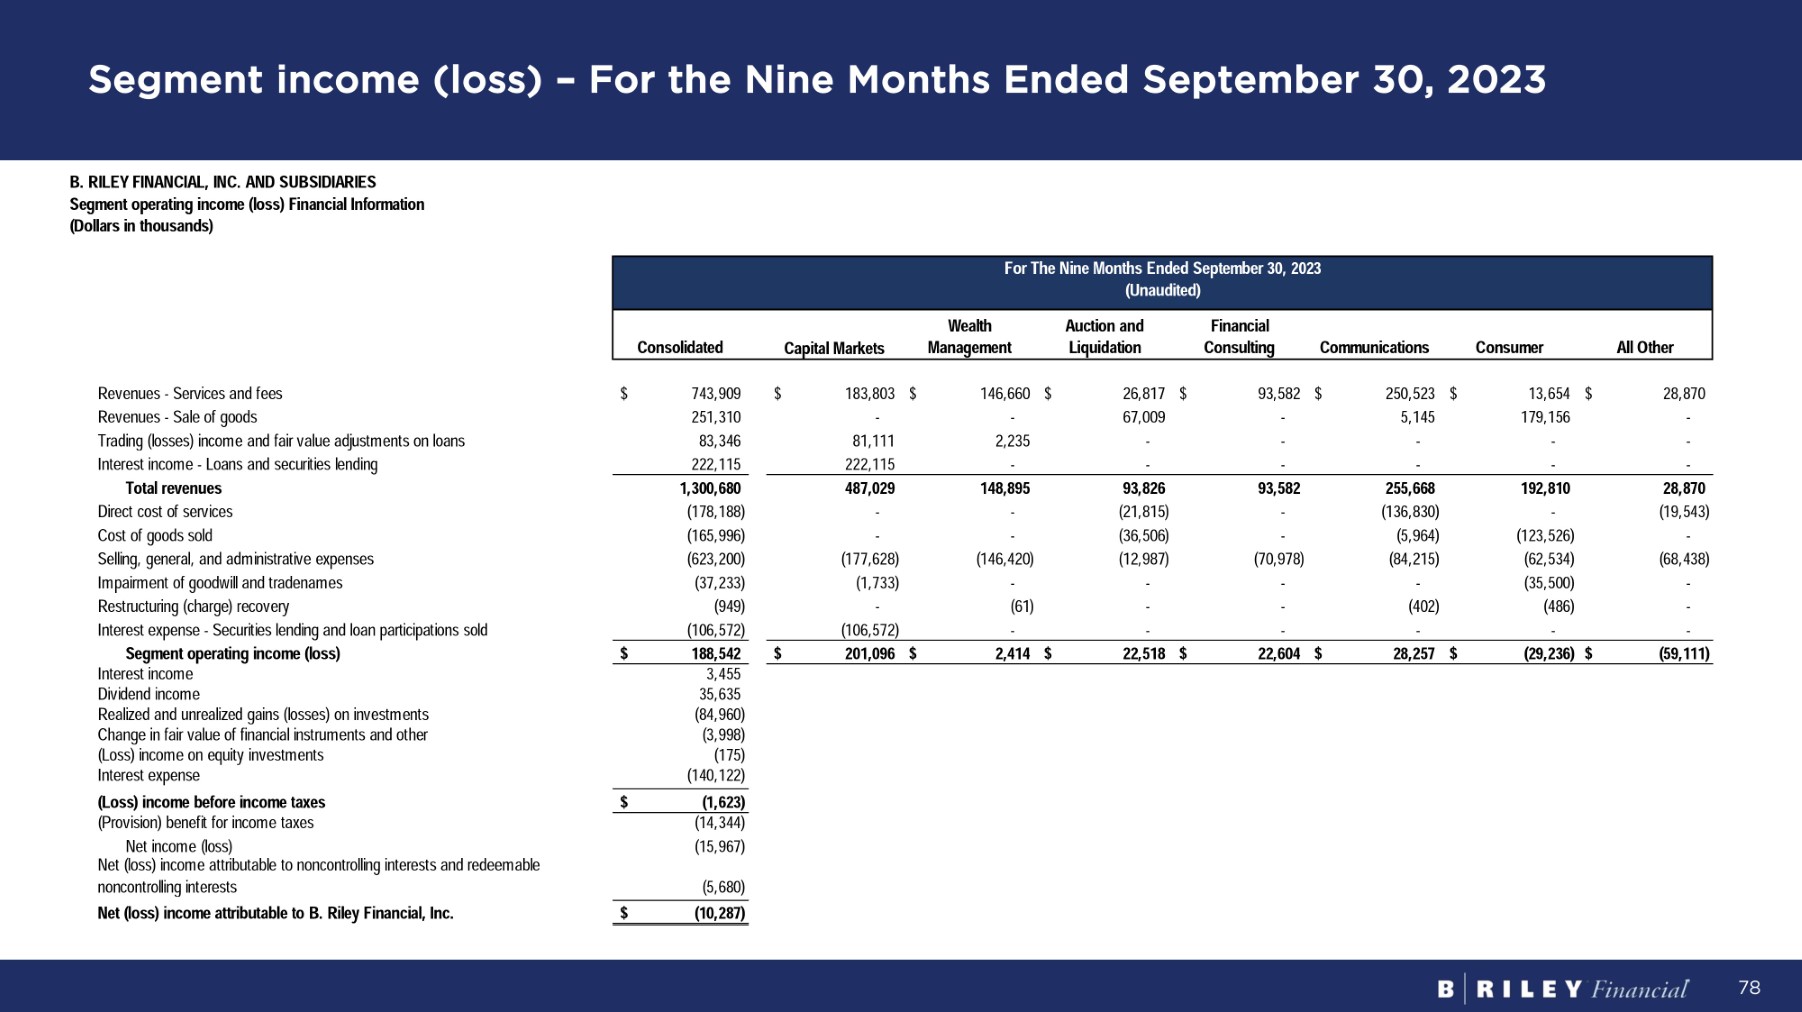
Segment income (loss) – For the Nine Months Ended September 30, 2023 78 For The Nine Months Ended September 30, 2023 (Unaudited) A l l O t h e r Consumer Communications Financial C on s u l t i ng A u c t i o n a nd Liquidation Wealth M a n a g e m e n t C a p i t a l M a r ke t s Consolidated B. RILEY FINANCIAL, INC. AND SUBSIDIARIES S eg m en t ope r a t i n g i nco m e ( l oss ) F i nanc i a l I n f o r m a t i on ( D o ll a r s i n t housands ) $ 28,870 $ 13,654 $ 250,523 $ 93,582 $ 26,817 $ 146,660 $ 183,803 $ 743,909 R e v enue s - S e r v i ce s an d f ees - 179,156 5,145 - 67,009 - - 251,310 R e v enue s - S a l e o f goods - - - - - 2,235 81,111 83,346 Trading (losses) income and fair value adjustments on loans - - - - - - 222,115 222,115 Interest income - Loans and securities lending 28,870 192,810 255,668 93,582 93,826 148,895 487,029 1,300,680 To t a l r eve nu es (19,543) - (136,830) - (21,815) - - (178,188) D i r ec t cos t o f se r v i ce s - (123,526) (5,964) - (36,506) - - (165,996) C os t o f good s so l d (68,438) (62,534) (84,215) (70,978) (12,987) (146,420) (177,628) (623,200) Selling, general, and administrative expenses - (35,500) - - - - (1,733) (37,233) I m pa i r m en t o f good w il l an d t r adena m es - (486) - - (402) (61) - (949) R es t r uc t u r i n g ( cha r ge ) r eco v e r y - - - - - - (106,572) (106,572) Interest expense - Securities lending and loan participations sold (59,111) $ (29,236) $ 28,257 $ 22,604 $ 22,518 $ 2,414 $ 201,096 $ $ 188,542 S e g m e n t op e r a t i n g i n c o m e ( l o ss ) 3,455 I n t e r es t i nco m e 35,635 D i v i den d i nco m e (84,960) R ea li ze d an d un r ea li ze d ga i n s ( l osses ) o n i n v es t m en t s (3,998) Change in fair value of financial instruments and other (175) ( Loss ) i nco m e o n equ i t y i n v es t m en t s (140,122) I n t e r es t expens e $ ( 1 , 62 3) ( Lo ss ) i n c o m e b e f o r e i n c o m e t axes (14,344) (Provision) benefit for income taxes (15,967) N e t i nco m e ( l oss ) Net (loss) income attributable to noncontrolling interests and redeemable (5,680) noncon t r o lli n g i n t e r es t s $ ( 10 , 28 7) Net (loss) income attributable to B. Riley Financial, Inc.

Segment income (loss) – For the Nine Months Ended September 30, 2022 79 Fo r Th e N i n e M on t h s E nd e d S e p t e m b e r 30 , 202 2 (Unaudited) A l l O t h e r Consumer Communications Financial C on s u l t i ng A u c t i o n a nd Liquidation Wealth M a n a g e m e n t C a p i t a l M a r ke t s Consolidated B . R I L EY F I N A NC I A L , I NC . A N D S UB S I D I A R I ES S e g m e n t op e r a t i n g i n c o m e ( l o ss ) F i n a n c i a l I n f o r m a t ion ( D o ll a r s i n t hou sa nd s ) $ 5,382 $ 14,754 $ 142,366 $ 73,081 $ 7,792 $ 184,963 $ 223,448 $ 651,786 R e v enue s - S e r v i ce s an d f ees - - 5,345 - 2,550 - - 7,895 R e v enue s - S a l e o f goods - - - - - 3,077 (147,035) (143,958) Trading (losses) income and fair value adjustments on loans - - - - 3,976 - 178,879 182,855 Interest income - Loans and securities lending 5,382 14,754 147,711 73,081 14,318 188,040 255,292 698,578 To t a l r eve nu es (3,009) - (64,320) - (6,630) - - (73,959) D i r ec t cos t o f se r v i ce s - - (6,099) - (1,235) - - (7,334) C os t o f good s so l d (47,459) (4,164) (54,267) (61,181) (6,225) (210,840) (121,926) (506,062) S e lli ng , gene r a l , an d ad m i n i s t r a t i v e expenses - - (3,910) - - (4,106) - (8,016) R es t r uc t u r i n g ( cha r ge ) r eco v e r y - - - - - - (43,757) (43,757) Interest expense - Securities lending and loan participations sold (45,086) $ 10,590 $ 19,115 $ 11,900 $ 228 $ (26,906) $ 89,609 $ $ 59,450 S e g m e n t op e r a t i n g i n c o m e ( l o ss ) 1,253 I n t e r es t i nco m e 26,279 D i v i den d i nco m e (136,205) R ea li ze d an d un r ea li ze d ga i n s ( l osses ) o n i n v es t m en t s 9,728 Change in fair value of financial instruments and other 3,285 ( Loss ) i nco m e o n equ i t y i n v es t m en t s (96,787) I n t e r es t expens e $ ( 132 , 99 7) ( Lo ss ) i n c o m e b e f o r e i n c o m e t axes 39,858 ( P r o v i s i on ) bene f i t f o r i nco m e t axes (93,139) N e t i nco m e ( l oss ) Net (loss) income attributable to noncontrolling interests and redeemable 9,245 noncontrolling interests $ ( 102 , 38 4) N e t ( l o ss ) i n c o m e a tt r i bu t a b l e t o B . R il e y F i n a n c i a l , I n c.

Segment income (loss) – For the Year Ended December 31, 2022 80 Fo r Th e Y ea r E nd e d D ece m b e r 31 , 2022 A l l O t h e r Consumer Communications Financial C on s u l t i ng A u c t i o n a nd Liquidation Wealth M a n a g e m e n t C a p i t a l M a r ke t s Consolidated B . R I LEY F I N A NC I A L , I NC . A N D S UB S I D I A R IES S e g m e n t op e r a ti n g i n c o m e (l o ss ) F i n a n c i a l I n f o r m a ti on ( D o ll a rs i n t hou sa nd s ) $ 13,797 $ 18,940 $ 228,129 $ 98,508 $ 12,581 $ 230,735 $ 292,933 $ 895,623 R e v enue s - S e r v i ce s an d f ees - 77,821 7,526 - 56,928 - - 142,275 R e v enue s - S a l e o f goods - - - - - 3,522 (206,150) (202,628) Trading (losses) income and fair value adjustments on loans - - - - 4,587 - 240,813 245,400 I n t e r es t i nco m e - Loan s an d secu r i t i e s l end i ng 13,797 96,761 235,655 98,508 74,096 234,257 327,596 1,080,670 To t a l r eve nu es (9,849) - (108,686) - (23,920) - - (142,455) D i r ec t cos t o f se r v i ce s - (52,162) (8,592) - (17,893) - - (78,647) C os t o f good s so l d (62,876) (22,737) (84,001) (82,196) (19,683) (263,622) (179,499) (714,614) Selling, general, and administrative expenses - - (4,056) - - (4,955) - (9,011) R es t r uc t u r i n g ( cha r ge ) r eco v e r y - - - - - - (66,495) (66,495) Interest expense - Securities lending and loan participations sold (58,928) $ 21,862 $ 30,320 $ 16,312 $ 12,600 $ (34,320) $ 81,602 $ $ 69,448 S e g m e n t op e r a t i n g i n c o m e ( l o ss ) 2,735 I n t e r es t i nco m e 35,874 D i v i den d i nco m e (201,079) Realized and unrealized gains (losses) on investments 10,188 Change in fair value of financial instruments and other 3,570 ( Loss ) i nco m e o n equ i t y i n v es t m en t s (141,186) I n t e r es t expens e $ ( 220 , 45 0) ( Lo ss ) i n c o m e b e f o r e i n c o m e t axes 63,856 ( P r o v i s i on ) bene f i t f o r i nco m e t axes (156,594) N e t i nco m e ( l oss ) Net (loss) income attributable to noncontrolling interests and redeemable 3,235 noncon t r o lli n g i n t e r es t s $ ( 159 , 82 9) Net (loss) income attributable to B. Riley Financial, Inc.
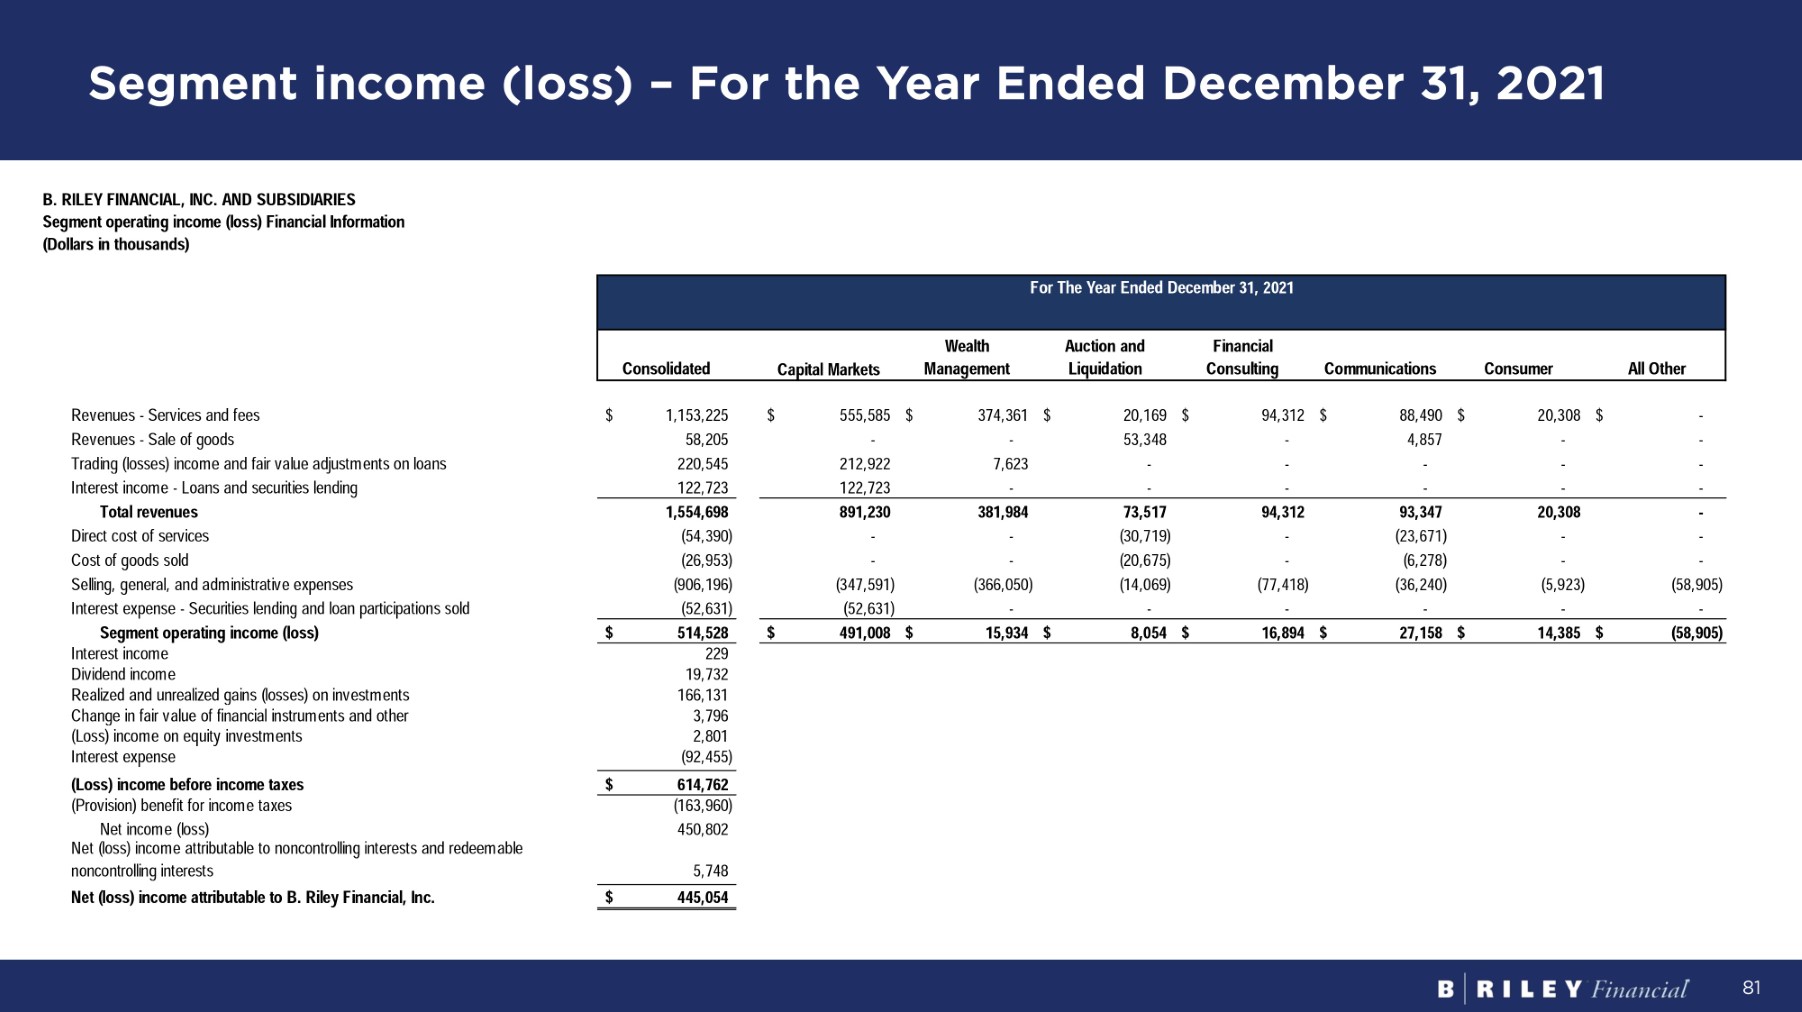
Segment income (loss) – For the Year Ended December 31, 2021 81 Fo r Th e Y ea r E nd e d D ece m b e r 31 , 2021 A l l O t h e r Consumer Communications Financial C on s u l t i ng A u c t i o n a nd Liquidation Wealth M a n a g e m e n t C a p i t a l M a r ke t s Consolidated B. RILEY FINANCIAL, INC. AND SUBSIDIARIES Segment operating income (loss) Financial Information ( D o ll a r s i n t housands ) $ - $ 20,308 $ 88,490 $ 94,312 $ 20,169 $ 374,361 $ 555,585 $ 1,153,225 R e v enue s - S e r v i ce s an d f ees - - 4,857 - 53,348 - - 58,205 R e v enue s - S a l e o f goods - - - - - 7,623 212,922 220,545 Trading (losses) income and fair value adjustments on loans - - - - - - 122,723 122,723 I n t e r es t i nco m e - Loan s an d secu r i t i e s l end i ng - 20,308 93,347 94,312 73,517 381,984 891,230 1,554,698 To t a l r eve nu es - - (23,671) - (30,719) - - (54,390) D i r ec t cos t o f se r v i ce s - - (6,278) - (20,675) - - (26,953) C os t o f good s so l d (58,905) (5,923) (36,240) (77,418) (14,069) (366,050) (347,591) (906,196) Selling, general, and administrative expenses - - - - - - (52,631) (52,631) Interest expense - Securities lending and loan participations sold (58,905) $ 14,385 $ 27,158 $ 16,894 $ 8,054 $ 15,934 $ 491,008 $ $ 514,528 S e g m e n t op e r a t i n g i n c o m e ( l o ss ) 229 I n t e r es t i nco m e 19,732 D i v i den d i nco m e 166,131 Realized and unrealized gains (losses) on investments 3,796 C hang e i n f a i r v a l u e o f f i nanc i a l i ns t r u m en t s an d o t her 2,801 ( Loss ) i nco m e o n equ i t y i n v es t m en t s (92,455) I n t e r es t expens e $ 614,762 ( Lo ss ) i n c o m e b e f o r e i n c o m e t axes (163,960) ( P r o v i s i on ) bene f i t f o r i nco m e t axes 450,802 N e t i nco m e ( l oss ) Net (loss) income attributable to noncontrolling interests and redeemable 5,748 noncon t r o lli n g i n t e r es t s $ 445,054 Net (loss) income attributable to B. Riley Financial, Inc.
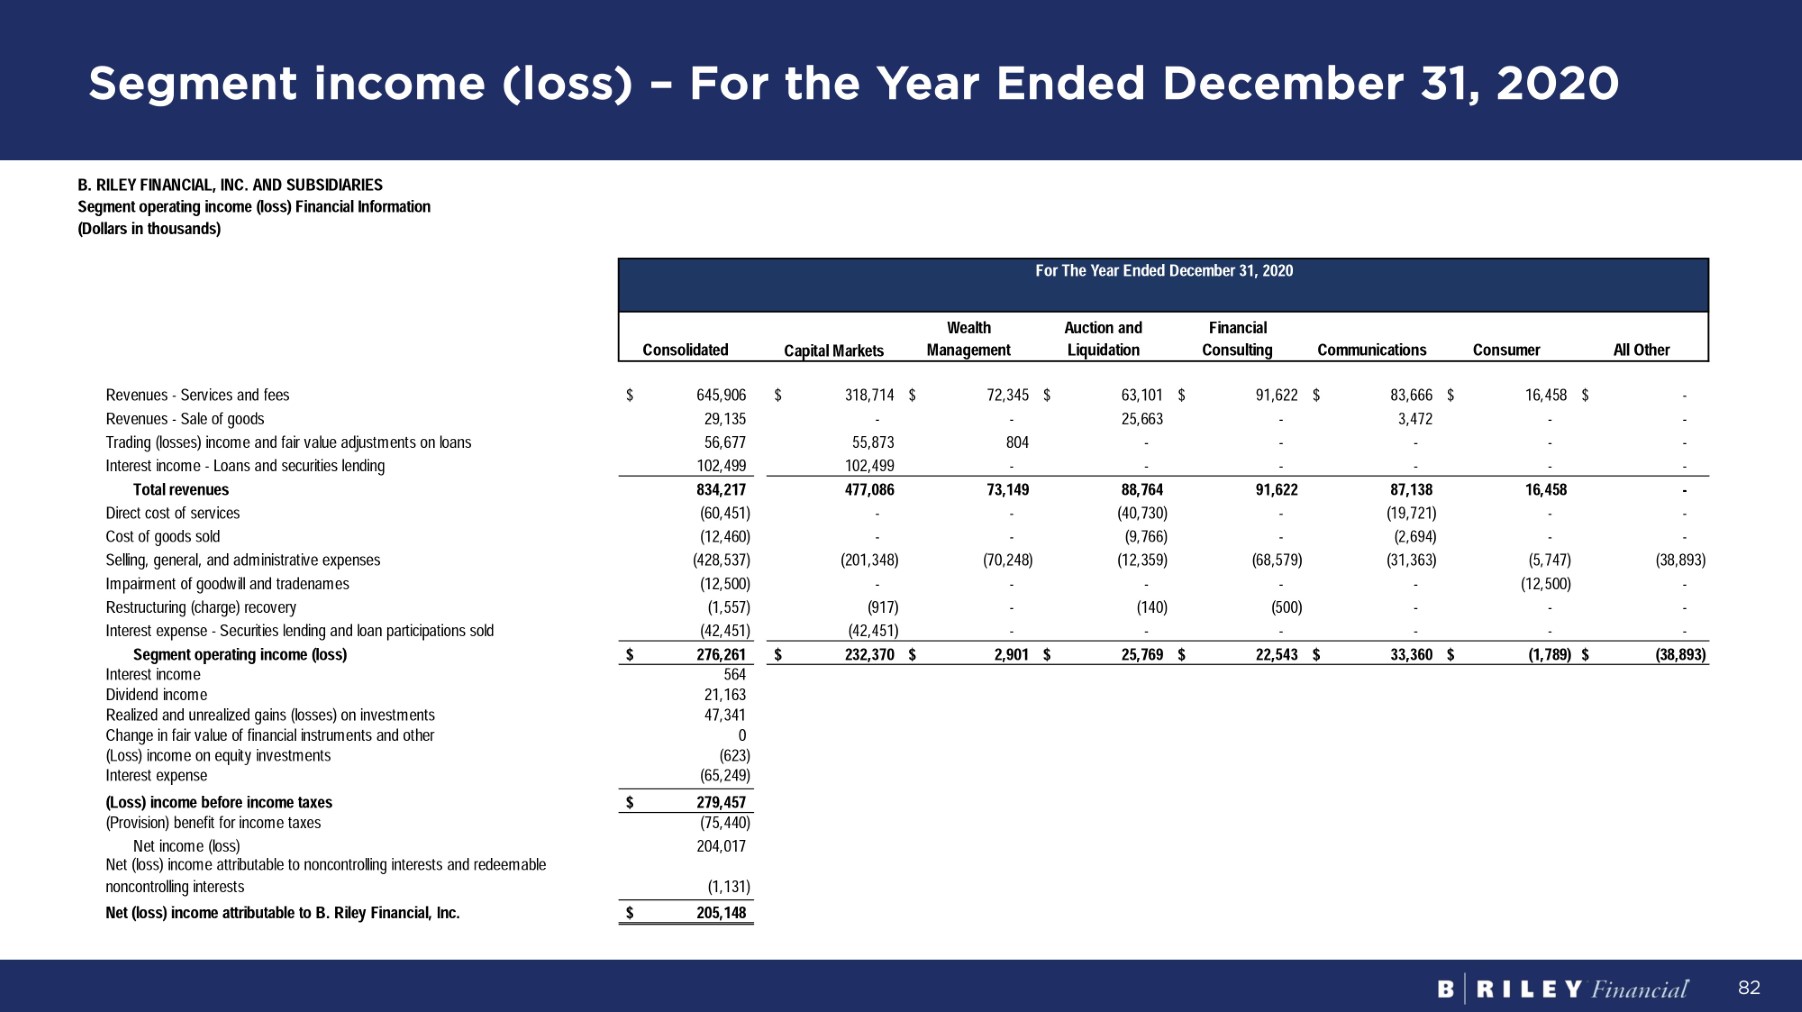
Segment income (loss) – For the Year Ended December 31, 2020 82 Fo r Th e Y ea r E nd e d D ece m b e r 31 , 2020 A l l O t h e r Consumer Communications Financial C on s u l t i ng A u c t i o n a nd Liquidation Wealth M a n a g e m e n t C a p i t a l M a r ke t s Consolidated B. RILEY FINANCIAL, INC. AND SUBSIDIARIES Segment operating income (loss) Financial Information ( D o ll a r s i n t hou sa nd s ) $ - $ 16,458 $ 83,666 $ 91,622 $ 63,101 $ 72,345 $ 318,714 $ 645,906 R e v enue s - S e r v i ce s an d f ees - - 3,472 - 25,663 - - 29,135 R e v enue s - S a l e o f goods - - - - - 804 55,873 56,677 Trading (losses) income and fair value adjustments on loans - - - - - - 102,499 102,499 I n t e r es t i nco m e - Loan s an d secu r i t i e s l end i ng - 16,458 87,138 91,622 88,764 73,149 477,086 834,217 To t a l r eve nu es - - (19,721) - (40,730) - - (60,451) D i r ec t cos t o f se r v i ce s - - (2,694) - (9,766) - - (12,460) C os t o f good s so l d (38,893) (5,747) (31,363) (68,579) (12,359) (70,248) (201,348) (428,537) Selling, general, and administrative expenses - (12,500) - - - - - (12,500) I m pa i r m en t o f good w il l an d t r adena m es - - - (500) (140) - (917) (1,557) R es t r uc t u r i n g ( cha r ge ) r eco v e r y - - - - - - (42,451) ( 42 , 45 1) Interest expense - Securities lending and loan participations sold (38,893) $ (1,789) $ 33,360 $ 22,543 $ 25,769 $ 2,901 $ 232,370 $ $ 276,261 S e g m e n t op e r a t i n g i n c o m e ( l o ss ) 564 I n t e r es t i nco m e 21,163 D i v i den d i nco m e 47,341 Realized and unrealized gains (losses) on investments 0 C hang e i n f a i r v a l u e o f f i nanc i a l i ns t r u m en t s an d o t her (623) ( Loss ) i nco m e o n equ i t y i n v es t m en t s (65,249) I n t e r es t expens e $ 279,457 ( Lo ss ) i n c o m e b e f o r e i n c o m e t axes (75,440) ( P r o v i s i on ) bene f i t f o r i nco m e t axes 204,017 N e t i nco m e ( l oss ) Net (loss) income attributable to noncontrolling interests and redeemable (1,131) noncon t r o lli n g i n t e r es t s $ 205,148 Net (loss) income attributable to B. Riley Financial, Inc.

Capital Markets segment by year 83 B . R I L EY F I N A NC I A L , I NC . A N D SUBS I D I A R I ES Capital Markets Segment Financial Information ( U na ud i t e d , do ll a r s i n t hous a nds ) C ap i t a l M a r ke t s C ap i t a l M a r ke t s - Segment Total B. Riley Securities Other C ap i t a l M a r ke t s C ap i t a l M a r ke t s - Segment Total B. Riley Securities Other C ap i t a l M a r ke t s C ap i t a l M a r ke t s - Segment Total B. Riley Securities Other $ (49,462) $ 139,071 $ 89,609 $ 41,135 $ 159,961 $ 201,096 $ 37,492 $ 155,597 $ 193,089 S eg m en t ope r a t i n g i nco m e ( l oss ) - 5,919 5,919 - 9,541 9,541 - 11,473 11,473 D i v i den d i n c o m e - (152,200) (152,200) - (77,020) (77,020) - (172,360) (172,360) Realized and unrealized gains (losses) on investments - 8,377 8,377 - (9,770) (9,770) - (15,021) (15,021) Segment income (loss) attributable to noncontrolling interests $ (49,462) $ (15,587) $ ( 65 , 04 9) $ 41,135 $ 102,252 $ 143,387 $ 37,492 $ 9,731 $ 47,223 Segment income (loss) after noncontrolling interests EB I T D A A d j u s t m en t s : 3,245 16,894 20,139 3,065 11,565 14,630 4,227 16,374 20,601 S ha r e ba s e d pa y m en t s 315 5,956 6,271 321 2,828 3,149 446 4,925 5,371 D ep r e c i a t i o n an d a m o r t i z a t i on - - - - 1,733 1,733 - 1,733 1,733 I m pa i r m en t o f t r adena m es (500) - (500) (3,900) 79 (3,821) (10,450) 4,636 (5,814) T r an s a c t i on s r e l a t e d c o s t s an d o t her 22,350 3,560 25,910 12,226 3,465 15,691 12,582 9,309 21,891 To t a l EB I T D A A d j u s t m en t s $ (27,112) $ (12,027) $ ( 39 , 13 9) $ 53,361 $ 105,717 $ 159,078 $ 50,074 $ 19,040 $ 69,114 S eg m en t A d j us t e d E B I T D A $ 126,540 $ 20,495 $ 147,035 $ (30,336) $ (50,775) $ (81,111) $ (10,736) $ (11,260) $ (21,996) O pe r a t i n g EB I T D A A d j u s t m en t s : T r ad i n g l o s s ( i n c o m e ) an d f a i r v a l u e ad j u s t m en t s o n l oans - 152,200 152,200 - 77,020 77,020 - 172,360 172,360 Realized and unrealized gains (losses) on investments (61,004) (830) ( 61 , 83 4) 12,882 (9,505) 3,377 10,367 (14,687) (4,320) O t he r i n v e s t m en t r e l a t e d e x pen s es 65,536 171,865 237,401 (17,454) 16,740 (714) (369) 146,413 146,044 To t a l O pe r a t i n g EB I T D A A d j u s t m en t s $ 38,424 $ 159,838 $ 198,262 $ 35,907 $ 122,457 $ 158,364 $ 49,705 $ 165,453 $ 215,158 S eg m en t ope r a t i n g A d j us t e d E B I T D A 159,838 38,424 $ $ 198,262 $ 122,457 35,907 $ $ 158,364 $ 165,453 49,705 $ $ 215,158 $ O pe r a t i n g A d j u s t e d EB I T D A, F I S p r ea d an d C EF I n c o m e S eg m en t ope r a t i n g A d j u s t e d EB I T D A - 15,838 15,838 - 18,509 18,509 - 25,436 25,436 Operating Adjusted EBITDA, FI Spread and CEF Income Adjustments: F i x e d I n c o m e t r ad i n g r e v enue (3,867) 3,867 - 7,535 (7,535) - 8,761 (8,761) - C o mm i tt e d E qu i t y Fa c ili t i e s ne t i n c o m e ( l o ss ) 11,971 3,867 15,838 26,044 (7,535) 18,509 34,197 (8,761) 25,436 Total Operating Adjusted EBITDA, FI Spread and CEF Income Adjustments $ 50,395 $ 163,705 $ 214,100 $ 61,951 $ 114,922 $ 176,873 $ 83,902 $ 156,692 $ 240,594 O pe r a t i n g A d j us t e d E B I T D A , F I S p r ea d an d C EF I nco m e Fo r Th e T w e l v e M on t h s E nded S ep t e m b e r 30 , 2023 Fo r Th e N i n e M on t h s E nded S e p t e m be r 30 , 202 3 Fo r Th e N i n e M on t h s E nded S e p t e m be r 30 , 202 2

C ap it a l M a r k et s s eg m en t b y y ea r – c o n t ’d 84 B . R I L EY F I N A NC I A L , I NC . A N D S UB S I D I A R IES Capital Markets Segment Financial Information (Unaudited, dollars in thousands) C ap it a l M a r ke t s C ap it a l M a r ke t s - Segment Total B. Riley Securities Other C ap it a l M a r ke t s C ap it a l M a r ke t s - Segment Total B. Riley Securities Other C ap it a l M a r ke t s C ap it a l M a r ke t s - Segment Total B. Riley Securities Other R e v enue s : 67,062 $ 156,386 $ $ 223,448 $ 27,779 $ 156,024 $ 183,803 $ 36,208 $ 217,080 $ 253,288 R e v enue s - S e r v i c e s an d f ees (20,495) (126,540) (147,035) 50,775 30,336 81,111 11,260 10,736 21,996 Trading (losses) income and fair value adjustments on loans 56,199 122,680 178,879 121,312 100,803 222,115 148,795 135,254 284,049 I n t e r e s t i n c o m e - Loan s an d s e c u r i t i e s l end i ng $ 86,045 $ 169,247 126,540 20,495 $ 255,292 147,035 $ 307,672 $ 179,357 (30,336) (50,775) $ 487,029 (81,111) $ 376,611 $ 182,722 (10,736) (11,260) $ 559,333 (21,996) To t a l R evenues Operating Revenue Adjustments: Trading loss (income) and fair value adjustments on loans 126,540 20,495 147,035 (30,336) (50,775) (81,111) (10,736) (11,260) (21,996) Total Operating Revenue Adjustments $ 212,585 $ 189,742 $ 402,327 $ 277,336 $ 128,582 $ 405,918 $ 365,875 $ 171,462 $ 537,337 Segment Operating Revenues 189,742 212,585 $ $ 402,327 $ 128,582 277,336 $ $ 405,918 $ 171,462 365,875 $ $ 537,337 $ O pe r a t i n g R e v enue , F I S p r ead , an d C EF R e v enues S eg m en t O pe r a t i n g R e v enue - 15,838 15,838 - 18,509 18,509 - 25,436 25,436 Operating Revenue, FI Spread, and CEF Revenues Adjustments: F i x e d I n c o m e t r ad i n g r e v enue 6,579 (6,579) - 10,432 (10,432) - 13,015 (13,015) - Committed Equity Facilities (CEF) revenues 22,417 (6,579) 15,838 28,941 (10,432) 18,509 38,451 (13,015) 25,436 Total Operating Revenue, FI Spread, and CEF revenues Adjustments $ 235,002 $ 183,163 $ 418,165 $ 306,277 $ 118,150 $ 424,427 $ 404,326 $ 158,447 $ 562,773 O pe r a t i n g R evenue , F I S p r ead , an d C EF r evenues For The Twelve Months Ended September 30, 2023 For The Nine Months Ended September 30, 2023 For The Nine Months Ended September 30, 2022
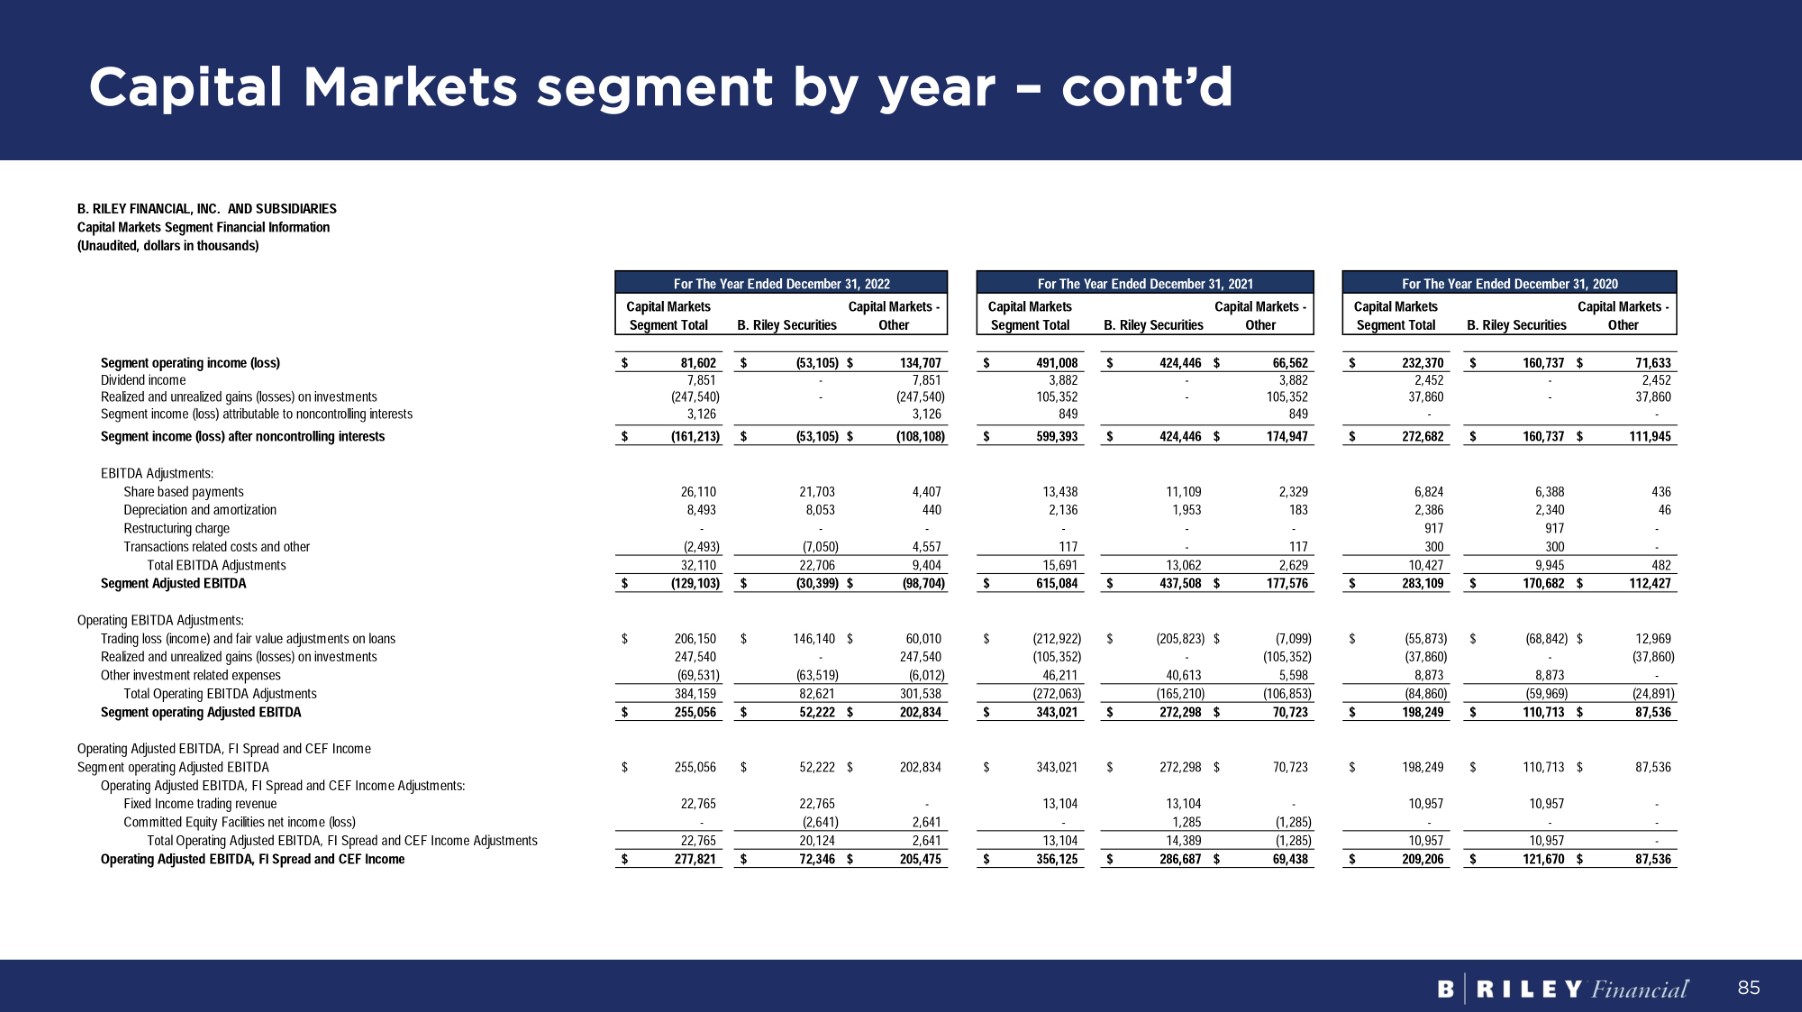
C ap it a l M a r k et s s eg m en t b y y ea r – c o n t ’d 85 B. RILEY FINANCIAL, INC. AND SUBSIDIARIES Capital Markets Segment Financial Information ( U na ud it e d , do ll a r s i n t hous a nds ) C ap it a l M a r ke t s C ap it a l M a r ke t s - Segment Total B. Riley Securities Other C ap it a l M a r ke t s C ap it a l M a r ke t s - Segment Total B. Riley Securities Other C ap it a l M a r ke t s C ap it a l M a r ke t s - Segment Total B. Riley Securities Other $ 160,737 $ 71,633 $ 232,370 $ 424,446 $ 66,562 $ 491,008 $ (53,105) $ 134,707 $ 81,602 S eg m en t ope r a t i n g i nco m e ( l oss ) - 2,452 2,452 - 3,882 3,882 - 7,851 7,851 D i v i den d i n c o m e - 37,860 37,860 - 105,352 105,352 - (247,540) (247,540) R ea li z e d an d un r ea li z e d ga i n s ( l o ss e s ) o n i n v e s t m en t s - - 849 849 3,126 3,126 Segment income (loss) attributable to noncontrolling interests $ 160,737 $ 111,945 $ 272,682 $ 424,446 $ 174,947 $ 599,393 $ (53,105) $ (108,108) $ (161,213) Segment income (loss) after noncontrolling interests EB I T D A A d j u s t m en t s : 436 6,388 6,824 2,329 11,109 13,438 4,407 21,703 26,110 S ha r e ba s e d pa y m en t s 46 2,340 2,386 183 1,953 2,136 440 8,053 8,493 D ep r e c i a t i o n an d a m o r t i z a t i on - 917 917 - - - - - - R e s t r u c t u r i n g c ha r ge 300 - 300 - 117 117 (7,050) 4,557 (2,493) T r an s a c t i on s r e l a t e d c o s t s an d o t her 9,945 482 10,427 13,062 2,629 15,691 22,706 9,404 32,110 To t a l EB I T D A A d j u s t m en t s $ 170,682 $ 112,427 $ 283,109 $ 437,508 $ 177,576 $ 615,084 $ (30,399) $ (98,704) $ (129,103) S eg m en t A d j us t e d E B I T D A $ (68,842) $ 12,969 $ (55,873) $ (205,823) $ (7,099) $ (212,922) $ 146,140 $ 60,010 $ 206,150 O pe r a t i n g EB I T D A A d j u s t m en t s : T r ad i n g l o s s ( i n c o m e ) an d f a i r v a l u e ad j u s t m en t s o n l oans - (37,860) (37,860) - (105,352) (105,352) - 247,540 247,540 R ea li z e d an d un r ea li z e d ga i n s ( l o ss e s ) o n i n v e s t m en t s 8,873 - 8,873 40,613 5,598 46,211 (63,519) (6,012) (69,531) O t he r i n v e s t m en t r e l a t e d e x pen s es (59,969) (24,891) (84,860) (165,210) (106,853) (272,063) 82,621 301,538 384,159 To t a l O pe r a t i n g EB I T D A A d j u s t m en t s $ 110,713 $ 87,536 $ 198,249 $ 272,298 $ 70,723 $ 343,021 $ 52,222 $ 202,834 $ 255,056 S eg m en t ope r a t i n g A d j us t e d E B I T D A 87,536 110,713 $ $ 198,249 $ 70,723 272,298 $ $ 343,021 $ 202,834 52,222 $ $ 255,056 $ Operating Adjusted EBITDA, FI Spread and CEF Income S eg m en t ope r a t i n g A d j u s t e d EB I T D A Operating Adjusted EBITDA, FI Spread and CEF Income Adjustments: - 10,957 10,957 - 13,104 13,104 - 22,765 22,765 F i x e d I n c o m e t r ad i n g r e v enue - - - 1,285 (1,285) - (2,641) 2,641 - Committed Equity Facilities net income (loss) 10,957 - 10,957 14,389 (1,285) 13,104 20,124 2,641 22,765 Total Operating Adjusted EBITDA, FI Spread and CEF Income Adjustments $ 121,670 $ 87,536 $ 209,206 $ 286,687 $ 69,438 $ 356,125 $ 72,346 $ 205,475 $ 277,821 O pe r a t i n g A d j us t e d E B I T D A , F I S p r ea d an d C EF I nco m e Fo r Th e Y ea r E nded D ece m b e r 31 , 2020 Fo r Th e Y ea r E nded D ece m b e r 31 , 2022 Fo r Th e Y ea r E nded D ece m b e r 31 , 2021

C ap it a l M a r k et s s eg m en t b y y ea r – c o n t ’d 86 B. RILEY FINANCIAL, INC. AND SUBSIDIARIES Capital Markets Segment Financial Information ( U na ud i t e d , do ll a r s i n t hous a nds ) C ap i t a l M a r ke t s C ap i t a l M a r ke t s - Segment Total B. Riley Securities Other C ap i t a l M a r ke t s C ap i t a l M a r ke t s - Segment Total B. Riley Securities Other C ap i t a l M a r ke t s C ap i t a l M a r ke t s - Segment Total B. Riley Securities Other R e v enue s : $ 57,304 $ 261,410 $ 318,714 $ 52,996 $ 502,589 $ 555,585 75,491 $ 217,442 $ $ 292,933 R e v enue s - S e r v i c e s an d f ees (12,969) 68,842 55,873 7,099 205,823 212,922 (60,010) (146,140) (206,150) Trading (losses) income and fair value adjustments on loans 57,973 44,526 102,499 70,523 52,200 122,723 83,682 157,131 240,813 Interest income - Loans and securities lending $ 388,225 $ 88,861 (68,842) 12,969 $ 477,086 (55,873) $ 778,935 $ 112,295 (205,823) (7,099) $ 891,230 (212,922) $ 154,984 $ 172,612 146,140 60,010 $ 327,596 206,150 To t a l R evenues O pe r a t i n g R e v enu e A d j u s t m en t s : Trading loss (income) and fair value adjustments on loans (68,842) 12,969 (55,873) (205,823) (7,099) (212,922) 146,140 60,010 206,150 To t a l O pe r a t i n g R e v enu e A d j u s t m en t s $ 319,383 $ 101,830 $ 421,213 $ 573,112 $ 105,196 $ 678,308 $ 301,124 $ 232,622 $ 533,746 S eg m en t O pe r a t i n g R evenues 101,830 319,383 $ $ 421,213 $ 105,196 573,112 $ $ 678,308 $ 232,622 301,124 $ $ 533,746 $ O pe r a t i n g R e v enue , F I S p r ead , an d C EF R e v enues S eg m en t O pe r a t i n g R e v enue - 10,957 10,957 - 13,104 13,104 - 22,765 22,765 Operating Revenue, FI Spread, and CEF Revenues Adjustments: F i x e d I n c o m e t r ad i n g r e v enue - - - 6,255 (6,255) - 9,162 (9,162) - C o mm i tt e d E qu i t y Fa c ili t i e s ( C E F ) r e v enues 10,957 - 10,957 19,359 (6,255) 13,104 31,927 (9,162) 22,765 Total Operating Revenue, FI Spread, and CEF revenues Adjustments $ 330,340 $ 101,830 $ 432,170 $ 592,471 $ 98,941 $ 691,412 $ 333,051 $ 223,460 $ 556,511 O pe r a t i n g R evenue , F I S p r ead , an d C EF r evenues Fo r Th e Y ea r E nded D ece m b e r 31 , 2022 Fo r Th e Y ea r E nded D ece m b e r 31 , 2021 Fo r Th e Y ea r E nded D ece m b e r 31 , 2020

Wealth Management segment by year B. RILEY FINANCIAL, INC. AND SUBSIDIARIES Wealth Management Segment Financial Information ( U n a ud i t e d , do ll a r s i n t hou sa nd s ) F Y 12 / 31 / 2020 F Y 12 / 31 / 2021 F Y 12 / 31 / 2022 Y T D 9 / 30 / 2022 Y T D 9 / 30 / 2023 LT M 9 / 30 / 2023 $ 2,901 $ 15,934 $ ( 34 , 32 0) $ ( 26 , 90 6) $ 2,414 $ ( 5 , 00 0) S e g m e n t op e r a t i n g i n c o m e ( l o ss ) - 3,448 156 156 - - Segment income (loss) attributable to noncontrolling interests $ 2,901 $ 12,486 $ ( 34 , 47 6) $ ( 27 , 06 2) $ 2,414 $ ( 5 , 00 0) Segment income (loss) after noncontrolling interests EB I T D A A d j us t m en t s : 963 2,197 3,194 2,312 1,453 1,453 S ha r e base d pa y m en t s 1,880 8,920 5,488 4,402 3,243 4,329 D ep r ec i a t i o n an d a m o r t i za t i on - - 4,955 4,106 61 910 R es t r uc t u r i n g cha r ge 150 (1,506) 10,845 14,418 (939) ( 939 ) Transactions related costs and other 2,993 9,611 24,482 25,238 3,818 5,753 T o t a l EB I T D A A d j us t m en t s $ 5,894 $ 22,097 $ (9,994) $ (1,824) $ 6,232 $ 753 S e g m e n t A d j u s t e d E B I T D A Revenues: $ 72,345 $ 374,361 $ 230,735 $ 184,963 $ 146,660 $ 192,432 R e v enue s - S e r v i ce s an d f ees 804 7,623 3,522 3,077 2,235 2,680 Trading (losses) income and fair value adjustments on loans $ 73,149 $ 381,984 $ 234,257 $ 188,040 $ 148,895 $ 195,112 To t a l R eve nu es 87

Auction & Liquidation segment by year B. RILEY FINANCIAL, INC. AND SUBSIDIARIES Auction and Liquidation Segment Financial Information (Unaudited, dollars in thousands) F Y 12 / 31 / 2020 F Y 12 / 31 / 2021 F Y 12 / 31 / 2022 Y T D 9 / 30 / 2022 Y T D 9 / 30 / 2023 LT M 9 / 30 / 2023 $ 25,769 $ 8,054 $ 12,600 $ 228 $ 22,518 $ 34,890 S e g m e n t op e r a t i n g i n c o m e ( l o ss ) (765) (21) (542) (338) 168 (36) Segment income (loss) attributable to noncontrolling interests $ 26,534 $ 8,075 $ 13,142 $ 566 $ 22,350 $ 34,926 S e g m e n t i n c o m e ( l o ss ) a ft e r non c on t r o lli n g i n t e r es t s EB I T D A A d j us t m en t s : 867 1,057 1,280 963 768 1,085 S ha r e base d pa y m en t s 2 - - - - - Depreciation and amortization 140 - - - - - R es t r uc t u r i n g cha r ge 1,009 1,057 1,280 963 768 1,085 T o t a l EB I T D A A d j us t m en t s $ 27,543 $ 9,132 $ 14,422 $ 1,529 $ 23,118 $ 36,011 S e g m e n t A d j u s t e d E B I T D A Revenues: $ 63,101 $ 20,169 $ 12,581 $ 7,792 $ 26,817 $ 31,606 R e v enue s - S e r v i ce s an d f ees 25,663 53,348 56,928 2,550 67,009 121,387 R e v enue s - S a l e o f goods - - 4,587 3,976 - 611 Interest income - Loans and securities lending $ 88,764 $ 73,517 $ 74,096 $ 14,318 $ 93,826 $ 153,604 To t a l R eve nu es 88

Financial Consulting segment by year B. RILEY FINANCIAL, INC. AND SUBSIDIARIES F i nanc i a l C on s u l t i n g S eg m en t F i nanc i a l I n f o r m a t i on ( U naud i t ed , do ll a r s i n t hou s and s ) LT M 9 / 30 / 2023 Y T D 9 / 30 / 2023 Y T D 9 / 30 / 2022 F Y 12 / 31 / 2022 F Y 12 / 31 / 2021 F Y 12 / 31 / 2020 F Y 12 / 31 / 2019 S eg m en t op e r a t i n g i nco m e $ 27,016 $ 22,604 $ 11,900 $ 16,312 $ 16,894 $ 22,543 $ 17,814 EB I T D A A d j us t m en t s : 1,285 2,022 2,954 4,058 3,030 2,343 3,371 S ha r e base d pa y m en t s 252 347 356 305 234 269 340 Depreciation and amortization - 500 - - - - - R es t r uc t u r i n g cha r ge - - - 308 - 534 842 Transactions related costs and other 1,537 2,869 3,310 4,671 3,264 3,146 4,553 T o t a l EB I T D A A d j us t m en t s $ 19,351 $ 25,412 $ 20,204 $ 20,983 $ 15,164 $ 25,750 $ 31,569 S e g m e n t A d j u s t e d E B I T D A Revenues: $ 76,292 $ 91,622 $ 94,312 $ 98,508 $ 73,081 $ 93,582 $ 119,009 R e v enue s - S e r v i ce s an d f ees $ 76,292 $ 91,622 $ 94,312 $ 98,508 $ 73,081 $ 93,582 $ 119,009 To t a l R eve nu es 89
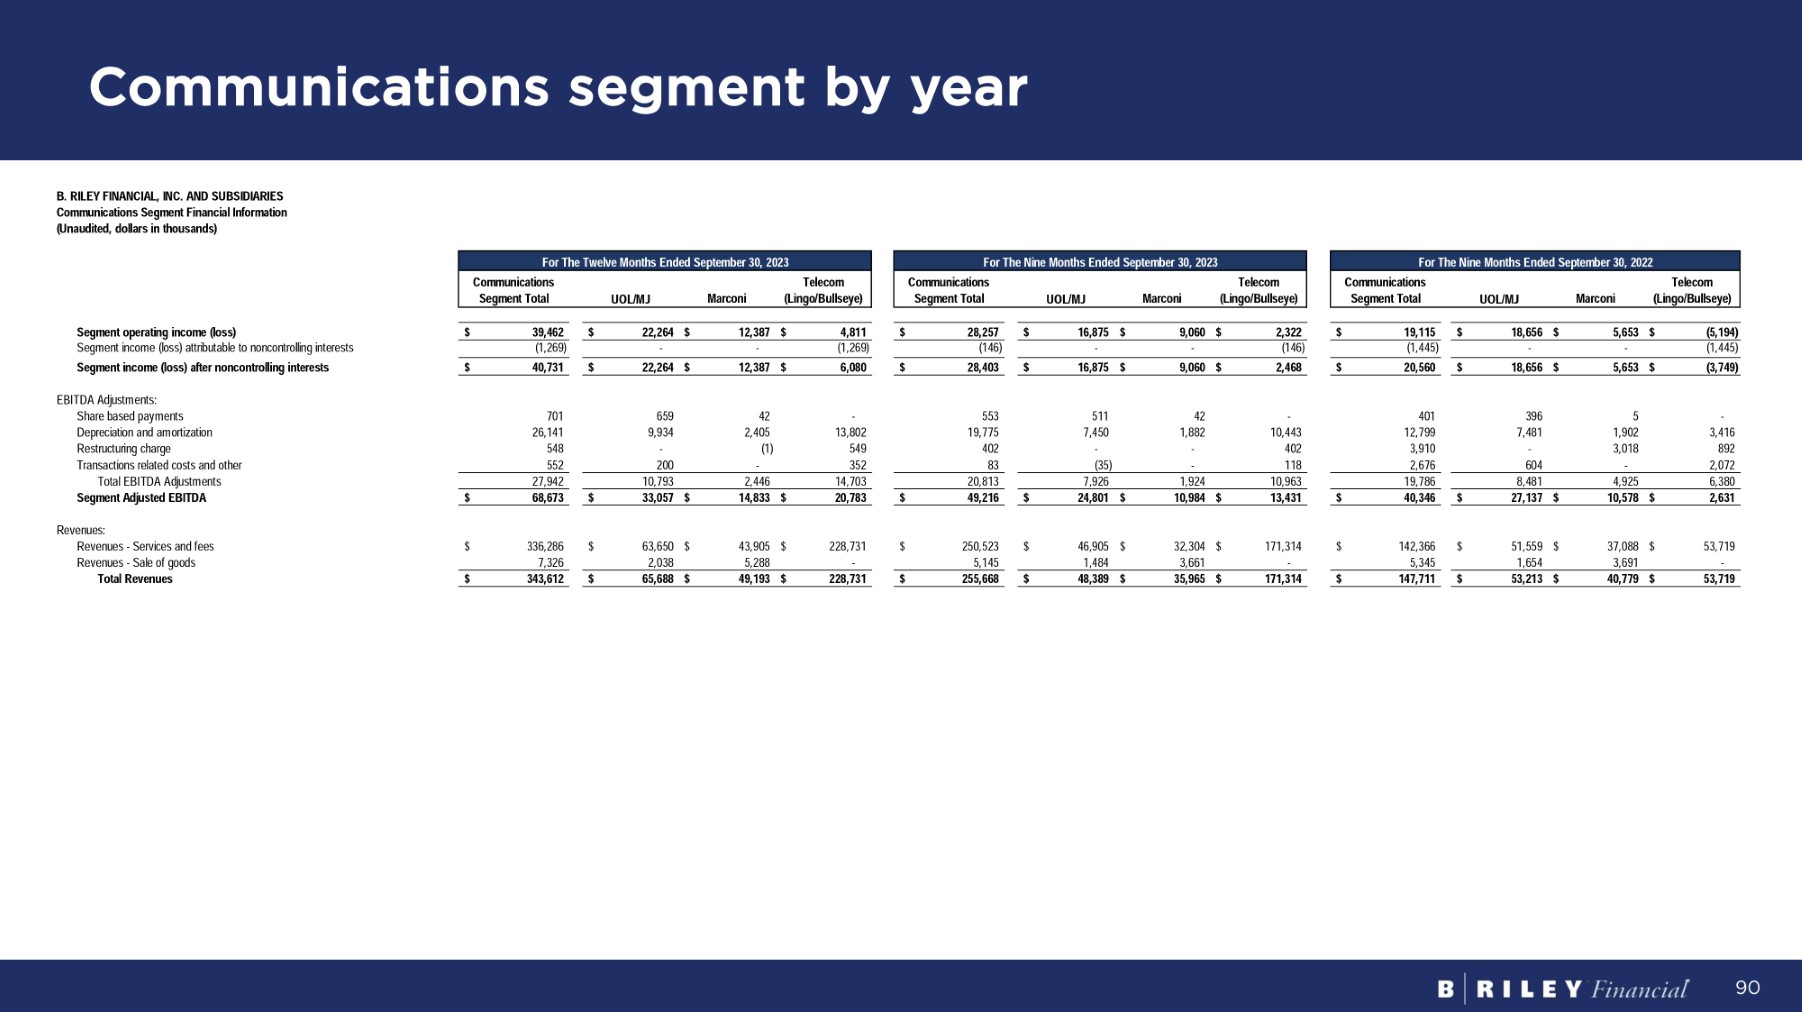
Communications segment by year 90 For The Twelve Months Ended September 30, 2023 Telecom ( L i ngo / B u ll se ye ) Marconi UOL/MJ C o mm un i ca ti o ns S eg m en t To t a l For The Nine Months Ended September 30, 2023 Telecom ( L i ngo / B u ll se ye ) Marconi UOL/MJ C o mm un i ca ti o ns S eg m en t To t a l For The Nine Months Ended September 30, 2022 Telecom ( L i ngo / B u ll se ye ) Marconi UOL/MJ C o mm un i ca ti o ns S eg m en t To t a l B . R I LEY F I N A NC I A L , I NC . A N D SUBS I D I A R IES Co mm un i ca t i on s Seg m e n t F i nanc i a l I n f o r m a t i on ( Unaud i t e d , do ll a rs i n t hous a nds ) $ 18 , 65 6 $ 5 , 65 3 $ ( 5 , 194) $ 19,115 $ 16,875 $ 9,060 $ 2,322 $ 28,257 $ 22,264 $ 12,387 $ 4,811 $ 39,462 S eg m en t ope r a ti n g i nco m e (l oss ) - - (1,445) (1,445) - - (146) (146) - - (1,269) (1,269) Segment income (loss) attributable to noncontrolling interests $ 18 , 65 6 $ 5 , 65 3 $ ( 3 , 749) $ 20,560 $ 16,875 $ 9,060 $ 2,468 $ 28,403 $ 22,264 $ 12,387 $ 6,080 $ 40,731 Segment income (loss) after noncontrolling interests EB I TDA A d j us t m en t s : - 5 396 401 - 42 511 553 - 42 659 701 S ha r e ba s e d pa y m en t s 3,416 1,902 7,481 12,799 10,443 1,882 7,450 19,775 13,802 2,405 9,934 26,141 Depreciation and amortization 892 3,018 - 3,910 402 - - 402 549 (1) - 548 R e s t r u c t u r i n g c ha r ge 604 - 2,072 2,676 (35) - 118 83 200 - 352 552 T r an s a c t i on s r e l a t e d c o s t s an d o t her 8,481 4,925 6,380 19,786 7,926 1,924 10,963 20,813 10,793 2,446 14,703 27,942 To t a l EB I T D A A d j u s t m en t s $ 27,137 $ 10,578 $ 2,631 $ 40,346 $ 24,801 $ 10,984 $ 13,431 $ 49,216 $ 33,057 $ 14,833 $ 20,783 $ 68,673 S eg m en t A d j us t e d E B I T D A 53,719 37,088 $ 51,559 $ $ 142,366 $ 171,314 32,304 $ $ 46,905 $ 250,523 $ 228,731 43,905 $ 63,650 $ $ 336,286 $ Revenues: R e v enue s - S e r v i c e s an d f ees 1,654 3,691 - 5,345 1,484 3,661 - 5,145 2,038 5,288 - 7,326 R e v enue s - S a l e o f goods $ 53,213 $ 40,779 $ 53,719 $ 147,711 $ 48,389 $ 35,965 $ 171,314 $ 255,668 $ 65,688 $ 49,193 $ 228,731 $ 343,612 To t a l R evenues
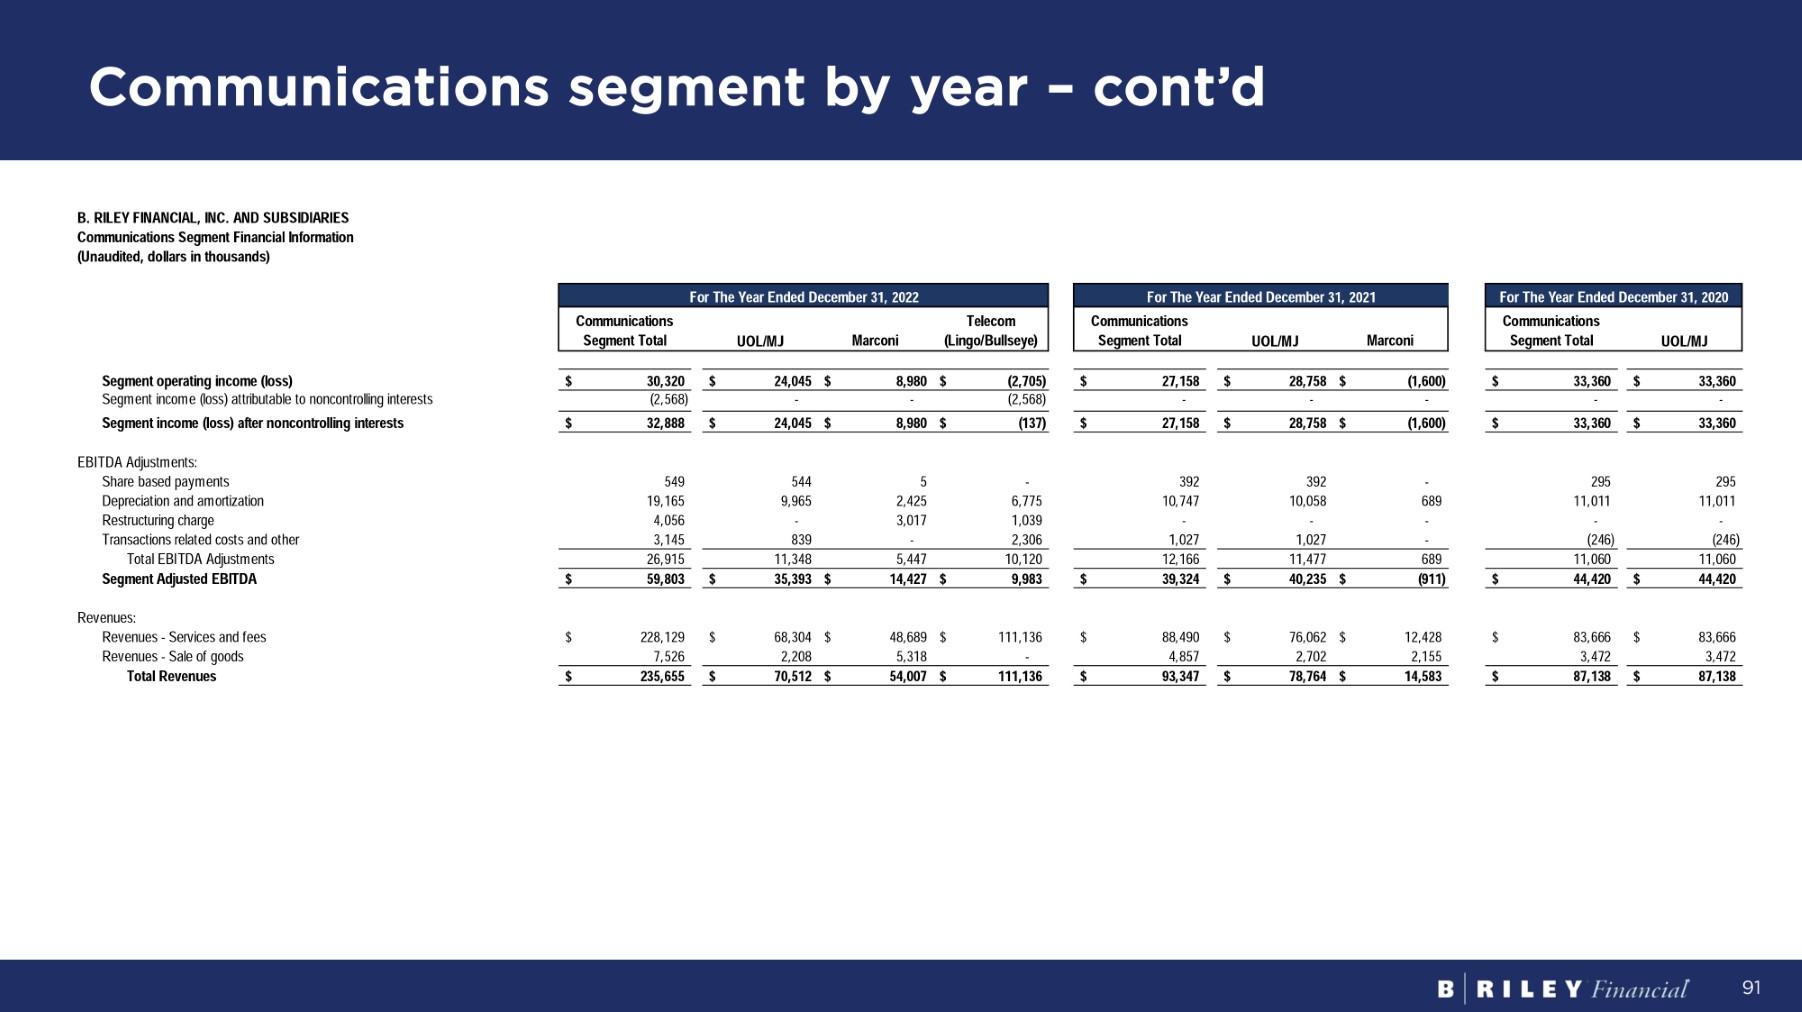
C o m m uni c a ti o n s se g me n t b y y e a r – c o n t ’d Fo r Th e Y ea r E nde d D ece m be r 31 , 2022 Telecom ( L i ngo / B u ll se ye ) Marconi UOL/MJ C o mm un i ca t i ons S eg m en t To t a l B . R I L EY F I N A NC I A L , I NC . A N D S UB S I D I A R IES Communications Segment Financial Information ( U naud it e d , do ll a r s i n t hous a nds ) Communications S eg m e n t To t a l U O L / M J M a r con i Communications Segment Total UOL/MJ $ 33,360 $ 33,360 $ 28,758 $ (1,600) $ 27,158 $ 24,045 $ 8,980 $ (2,705) $ 30,320 S eg m en t ope r a t i n g i nco m e ( l oss ) - - - - - - - (2,568) (2,568) Segment income (loss) attributable to noncontrolling interests $ 33,360 $ 33,360 $ 28,758 $ (1,600) $ 27,158 $ 24,045 $ 8,980 $ (137) $ 32,888 S eg m en t i nco m e ( l oss ) a ft e r noncon tr o lli n g i n t e r es t s EB I T D A A d j u s t m en t s : 295 295 - 392 392 - 5 544 549 S ha r e ba s e d pa y m en t s 11,011 11,011 689 10,058 10,747 6,775 2,425 9,965 19,165 D ep r e c i a t i o n an d a m o r t i z a t i on - - - - - 1,039 3,017 - 4,056 R e s t r u c t u r i n g c ha r ge (246) (246) 1,027 - 1,027 839 - 2,306 3,145 Transactions related costs and other 11,060 11,060 11,477 689 12,166 11,348 5,447 10,120 26,915 To t a l EB I T D A A d j u s t m en t s $ 44,420 $ 44,420 $ 40,235 $ (911) $ 39,324 $ 35,393 $ 14,427 $ 9,983 $ 59,803 S eg m en t A d j us t e d E B I T D A 83,666 83,666 $ $ 12,428 76,062 $ $ 88,490 $ 111,136 48,689 $ 68,304 $ $ 228,129 $ Revenues: R e v enue s - S e r v i c e s an d f ees 3,472 3,472 2,702 2,155 4,857 2,208 5,318 - 7,526 R e v enue s - S a l e o f goods $ 87,138 $ 87,138 $ 78,764 $ 14,583 $ 93,347 $ 70,512 $ 54,007 $ 111,136 $ 235,655 To t a l R evenues Fo r Th e Y ea r E nde d D ece m b e r 31 , 2020 Fo r Th e Y ea r E nde d D ece m b e r 31 , 2021 91

Consumer segment by year B. RILEY FINANCIAL, INC. AND SUBSIDIARIES C on s u m e r S eg m en t F i n a n c i a l I n f o r m a t i on ( U n a ud i t ed , do ll a r s i n t hou s and s ) Consumer S eg m en t To t a l B r ands T a r gus Consumer S eg m en t To t a l B r ands T a r gus Consumer S eg m en t To t a l B r ands $ 10,590 $ 10,590 $ 10,894 $ (40,130) $ (29,236) $ 13,978 $ (31,942) $ (17,964) S e g m e n t op e r a t i n g i n c o m e ( l o ss ) 20,360 20,360 - 26,094 26,094 - 33,757 33,757 D i v i den d i nco m e 15,995 15,995 - (7,940) (7,940) - 22,526 22,526 Realized and unrealized gains (losses) on investments 2,133 2,133 - 2,201 2,201 - 2,821 2,821 Segment income (loss) attributable to noncontrolling interests $ 44,812 $ 44,812 $ 26,847 $ (40,130) $ (13,283) $ 67,440 $ (31,942) $ 35,498 Segment income (loss) after noncontrolling interests EB I T D A A d j us t m en t s : - - (309) - (309) 33 - 33 S ha r e base d pa y m en t s 1,745 1,745 7,784 326 8,110 9,952 692 10,644 Depreciation and amortization - - 486 - 486 486 - 486 R es t r uc t u r i n g cha r ge - - - 35,500 35,500 - 35,500 35,500 I m pa i r m en t o f good w il l an d t r adena m es 1,745 1,745 326 43,461 43,787 692 45,971 46,663 T o t a l EB I T D A A d j us t m en t s $ 46,557 $ 46,557 $ 27,173 $ 3,331 $ 30,504 $ 68,132 $ 14,029 $ 82,161 S e g m e n t A d j u s t e d E B I T D A Revenues: $ 14,754 $ 14,754 $ 13,654 $ - $ 13,654 $ 17,840 $ - $ 17,840 R e v enue s - S e r v i ce s an d f ees - - - 179,156 179,156 - 256,977 256,977 R e v enue s - S a l e o f goods $ 14,754 $ 14,754 $ 13,654 $ 179,156 $ 192,810 $ 17,840 $ 256,977 $ 274,817 To t a l R eve nu es Fo r Th e T w e l v e M on t h s E nd e d S e p t e m be r 30 , 2023 Fo r Th e N i n e M on t h s E nd e d S e p t e m be r 30 , 2023 Fo r Th e N i n e M on t h s E nd e d S e p t e m be r 30 , 2022 92

C o nsume r se g me n t b y y e a r – c o n t ’d B. RILEY FINANCIAL, INC. AND SUBSIDIARIES C onsu m e r S eg m en t F i nanc i a l I n f o r m a t i on ( U naud i t ed , do ll a r s i n t housands ) Consumer S eg m en t To t a l Brands Ta r gus Consumer S eg m en t To t a l Brands Consumer S eg m en t To t a l Brands $ (1,789) $ (1,789) $ 14,385 $ 14,385 $ 13,674 $ 8,188 $ 21,862 S e g m e n t op e r a t i n g i n c o m e ( l o ss ) 18,711 18,711 15,850 15,850 - 28,023 28,023 D i v i den d i nco m e 9,481 9,481 61,051 61,051 - 46,461 46,461 Realized and unrealized gains (losses) on investments (366) (366) 2,774 2,774 - 2,753 2,753 Segment income (loss) attributable to noncontrolling interests $ 26,769 $ 26,769 $ 88,512 $ 88,512 $ 85,405 $ 8,188 $ 93,593 S e g m e n t i n c o m e ( l o ss ) a ft e r non c on t r o lli n g i n t e r es t s EB I T D A A d j us t m en t s : - - - - 342 - 342 S ha r e base d pa y m en t s 2,858 2,858 2,745 2,745 2,168 2,111 4,279 Depreciation and amortization - - - - - - - R es t r uc t u r i n g cha r ge 12,500 12,500 - - - - - Impairment of goodwill and tradenames 15,358 15,358 2,745 2,745 2,111 2,510 4,621 T o t a l EB I T D A A d j us t m en t s $ 42,127 $ 42,127 $ 91,257 $ 91,257 $ 87,516 $ 10,698 $ 98,214 S e g m e n t A d j u s t e d E B I T D A Revenues: $ 16,458 $ 16,458 $ 20,308 $ 20,308 $ 18,940 $ - $ 18,940 R e v enue s - S e r v i ce s an d f ees - - - - - 77,821 77,821 R e v enue s - S a l e o f goods $ 16,458 $ 16,458 $ 20,308 $ 20,308 $ 18,940 $ 77,821 $ 96,761 To t a l R eve nu es Fo r Th e Y ea r E nde d D ece m be r 31 , 2022 Fo r Th e Y ea r E nde d D ece m b er 31 , 2020 Fo r Th e Y ea r E nde d D ece m b er 31 , 2021 93

Maturity % I n t e r e st Book Value (9/30/23, ($MM) 5/31/2024 6.750% 140.2 6.75% 2024 Notes S e n i or Notes 2/28/2025 6.375% 145.7 6.375% 2025 Notes 3/31/2026 5.500% 215.9 5.5% 2026 Notes 9/30/2026 6.500% 180.4 6.50% 2026 Notes 12/31/2026 5.000% 321.4 5.00% 2026 Notes 1/31/2028 6.000% 263.7 6.0% 2028 Notes 8/31/2028 5.250% 399.9 5.25% 2028 Notes 6/23/2025 SOFR + 6.000% 477.8 (1) Nomura Term Loan Senior Debt 6/23/2025 SOFR + 6.000% 0.0 Nomu r a R e vo l v e r 6/23/2027 SOFR + 3.000% 50.9 BOC Term Loan (UOL/MJ/Marconi) S u b s idi a r y Debt 8/16/2027 SOFR + 3.500% 67.6 BOC Term Loan (Lingo/Bullseye) 10/18/2027 SOFR + 3.750% 22.0 PNC Term Loan (Targus) 10/18/2027 SOFR + 2.372% 57.2 PNC Revolver (Targus) 1/20/2025 5.100% 11.7 FocalPoint Seller Financing 7.0 Lingo Communication Seller Notes 9/13/2026 2.6 Other Notes Payable 2,363.9 Total Debt 6.875% 69.3 RILYP Preferred Preferred 7.375% 42.8 RILYL Preferred 112.1 Total Preferred 2,476.0 Total Debt + Preferred 252.3 Cash and Cash Equivalents 2,223.7 Net Debt + Preferred (1) Nomura Term Loan principal balance is $496.9MM as of 9/30/23 ($477.8MM + unamortized debt issuance costs of $19.1MM). Cash balance within the borrowing base is $103.0MM as of 11/30/23. Term Loan principal net of cash within the borrowing base is $393.9MM as of 11/30/23. RILY Debt 94

13 CASE STUDIES (BRS AND BRPI)

Description ● bebe stores inc. (“bebe”) is publicly traded with primary assets consisting of 50% interest in the licensing rights of the bebe brand, 30% interest in the licensing rights of the Brookstone brand, and 100% interest in 64 Buddy’s Home Furnishings (“BHF”) franchises. ● bebe holds significant tax assets including over $300MM of Federal and State Net Operating Losses (“NOL”). I n v e s t m e n t T h e s i s ● Various B. Riley divisions restructured bebe in 2017 and avoided a bankruptcy by selling non - core assets, liquidating 142 retail locations, providing a $35MM bridge loan, and selling a 50% stake in the bebe brand to Bluestar Alliance to operate the brand as a licensing model. ● The new corporate platform became a platform to aggregate high FCF targets and drive a dividend boosted by an intact NOL. Platform Growth ● In 2017 approximately half of the bridge loan was repaid using proceeds from the restructuring. In January 2018 B. Riley converted the remaining $17MM of bridge loan into equity at $6/share. ● In October 2018, bebe purchased a 29% interest in Brookstone for $20.6MM, a deal sourced by B. Riley. ● In November 2020, bebe purchased 47 BHF locations from Franchise Group. B. Riley sourced the deal and helped fund $7.5MM of the purchase price via a 1.5MM primary share purchase at $5.00/share. ● In 2021 and 2022, bebe opportunistically purchased additional BHF locations from Franchise Group and from other franchisees. ● In October 2023, B. Riley purchased 3.7MM shares from Founder and CEO Manny Mashouf in a block trade for $5.00 per share. I n v e s t m e n t Hi g h li g h t s ● Since investment, bebe’s cost structure has improved through corporate cost - sharing arrangements and down - listing the stock to OTC. ● bebe’s brand licensing businesses have generated approximately $11MM per year in cash flow to bebe (before corporate expenses) over the past three years. These royalties are historically stable and supported by contractually - obligated minimum payments from licensees. ● The BHF segment performed exceptionally well in 2021 but suffered during the following roll - off of stimulus funds and higher inflation in 2022 and 2023. bebe continues to focus on operations with a target of $6MM normalized EBITDA before corporate expenses. January 2018 $16.9MM Conversion of Bridge Loan to Equity November 2020 $7.5MM Purchase of Primary Shares October 2023 $18.5MM Block Purchase from Founder and CEO Case Study: bebe stores, inc. (OTC: BEBE) 96

● In November 2021, Franchise Group purchased W.S. Badcock Corp (“Badcock”) ● This transaction resulted in B. Riley having the opportunity to purchase the entire portfolio of Badcock’s receivables at an attractive price ● Badcock’s receivables portfolio at the time totaled $534.1MM of unsecured consumer receivables, comprising $485MM in revolving credit, $45MM in equal payment plans, and $5MM in late fees o These receivables incur finance, credit insurance, and other charges, which on an annualized basis yield ~22% of the portfolio balance. ● B. Riley purchased the $534.1MM of receivables for $400MM (~75% of face value) o B. Riley recycled cash flow from the portfolio to purchase an additional $148.1MM in face value of newly originated receivables for $131.0MM (~88% of face value) ● As of November 30, 2023, the portfolio has returned $458MM of cash vs. $400MM of capital deployed, and we expect a total IRR of 26.2% ● Subsequent to the initial purchase, and armed with the knowledge of the owned portfolio, B. Riley purchased an additional $448.1MM of receivables for $377.4MM (~84% of face value) in four transactions from Q4 2022 - Q1 2023. Given the performance of the first portfolio, B. Riley was able to finance the vast majority of this transaction on a non - recourse basis. ● This leveraged receivable pool was sold back to FRG in Q3 2023 as part of FRG’s broader take - private; prior to the sale, this pool had returned $232MM, primarily used to reduce debt with a small equity return of capital. o At the time of sale, the ultimate expected levered IRR was over 50% ● B. Riley now holds a $41.9MM note payable (1) with terms intended to mirror the return that B. Riley would have received from the portfolio had the sale not occurred (1) As of 11/30/23 Case Study: Badcock Receivables 97

● Alta Equipment Group Inc. (“Alta” or the “Company”) owns and operates one of the largest integrated equipment dealership platforms in the North America ● Through its branch network, the Company sells, rents, and provides parts and service support for several categories of specialized equipment ● At closing, Alta used proceeds from the business combination to acquire simultaneously the Volvo heavy equipment dealer in Florida and Hyster - Yale lift truck dealer in up - state New York, significantly expanding the Company’s footprint and scale Company Snapshot/ Situation Overview Transaction Highlights ● With the proceeds from the combination and continued access to the public capital markets, Alta management accelerated its existing territory acquisition strategy and entered new equipment end markets ● At the time of the combination announcement, Alta had estimated pro forma 2019E revenue and Adj. EBITDA of $900MM (1) and $94MM (1) , respectively ● In the LTM period ended 9/30/2023, Alta had revenue and Adj. EBITDA of ~$1.8B and ~$184MM, respectively o Dramatic growth has been driven by management’s consistent execution of Alta’s organic and M&A - driven growth strategies, enabled by public capital ● Leveraging the breadth of its platform, B. Riley offered and continues to provide Alta with wholistic capital solutions ● Through multiple transactions led by B. Riley, Alta received gross equity and debt proceeds of ~$195MM and ~$155MM, respectively, at closing o Included ~$130MM (~89%) retained from BRPM trust following a 4 - week public roadshow led by B. Riley involving 80+ one - on - one meetings o In parallel to the BRPM combination, B. Riley also led a $35MM PIPE investment in the Company’s common stock o Following the BRPM combination, B. Riley led a $30MM preferred stock offering, providing Alta with capital to opportunistically pursue its acquisition strategy B . R il e y S e c u r i t i e s ’ R o le February 2020 $155,000,000 Term Loan Arranger February 2020 Capital Markets Advisor February 2020 $35,000,000 PIPE Placement Agent December 2020 $30,000,000 Series A Perpetual Preferred Stock Lead Bookrunner consumma t ed a bus i ness comb i na ti on w i t h Information presented for illustration purposes only and does not represent a recommendation, solicitation or offer to buy or sell any security. Past performance is not indicative of future performance. (1) Source: Investor Presentation filed with the SEC on December 12, 2019 98 Case Study: Alta Equipment Group Inc. (NYSE: ALTG)

● Celsius Holdings, Inc. (“Celsius” or the “Company”) is a fast - growing leader in the functional energy drink and liquid supplement categories in the United States and internationally ● The Company offers differentiated products that provide clinically proven and innovative formulas meant to change the lives of its consumers for the better ● The equity offering also provided partial financing for the acquisition of Func Food, a wellness company and Celsius’ distribution partner in the Nordic region Company Snapshot / Situation Overview Transaction Highlights ● The transactions jump - started the Company’s dramatic growth ramp o At the time of the transactions, LTM revenue was $65.7MM (1) , compared to $1.15B LTM revenue as of 9/30/23 ● Proceeds from the B. Riley Securities - led follow - on offering provided the financial flexibility for Celsius to focus on growth, market opportunities, and operational efficiencies ● The offering gave the Company a chance to significantly expand its institutional sponsorship with dedicated small cap investors ● B. Riley’s Discovery group served as the original impetus to the relationship being the first sell - side firm to pick up research on the name 5 - Y ear S t oc k P r i c e P e r f o r m a n c e ( 2) September 2019 $28,750,000 Follow - On Offering Sole Bookrunner October 2019 $27,060,000 Buy - Side Advisor has acqu i r ed Information presented for illustration purposes only and does not represent a recommendation, solicitation or offer to buy or sell any security. Past performance is not indicative of future performance. (1) Sources: Celsius’ SEC filings (2) Reflects the Company’s three - for - one forward stock split, effected on November 13, 2023 $ 0 . 00 $ 1 0 . 00 $ 2 0 . 00 $ 3 0 . 00 $ 4 0 . 00 $50 . 00 $ 6 0 . 00 $ 7 0 . 00 $80.00 Announced/Completed Transactions Dividends/Splits 99 12/27/18 Announced $6.5MM investment from Charmnew Ltd (Li Ka Shing) 10/24/19 Closed Func Food acquisition 9/11/19 Completed ~$29MM Follow - On Entered into agreement to acquire FUNC Food Group Oyj 11/15/23 Enacted 3:1 Forward Stock - Split Case Study: Celsius Holdings, Inc. (Nasdaq: CELH)
v3.23.3
Cover
|
Dec. 13, 2023 |
| Document Type |
8-K
|
| Amendment Flag |
false
|
| Document Period End Date |
Dec. 13, 2023
|
| Entity File Number |
001-37503
|
| Entity Registrant Name |
B. RILEY FINANCIAL, INC.
|
| Entity Central Index Key |
0001464790
|
| Entity Tax Identification Number |
27-0223495
|
| Entity Incorporation, State or Country Code |
DE
|
| Entity Address, Address Line One |
11100 Santa Monica Blvd.
|
| Entity Address, Address Line Two |
Suite 800
|
| Entity Address, City or Town |
Los Angeles
|
| Entity Address, State or Province |
CA
|
| Entity Address, Postal Zip Code |
90025
|
| City Area Code |
310
|
| Local Phone Number |
966-1444
|
| Written Communications |
false
|
| Soliciting Material |
false
|
| Pre-commencement Tender Offer |
false
|
| Pre-commencement Issuer Tender Offer |
false
|
| Entity Emerging Growth Company |
false
|
| Common Stock Par Value 0. 0001 Per Share [Member] |
|
| Title of 12(b) Security |
Common Stock, par value $0.0001 per share
|
| Trading Symbol |
RILY
|
| Security Exchange Name |
NASDAQ
|
| Depositary Shares Each Representing 11000thinterestina 6. 875 [Member] |
|
| Title of 12(b) Security |
Depositary
Shares (each representing a 1/1000th interest in a 6.875
|
| Trading Symbol |
RILYP
|
| Security Exchange Name |
NASDAQ
|
| Depositary Shares Each Representing 11000thfractionalinterestina 7. 375 [Member] |
|
| Title of 12(b) Security |
Depositary
Shares, each representing a 1/1000th fractional interest in a 7.375
|
| Trading Symbol |
RILYL
|
| Security Exchange Name |
NASDAQ
|
| Sec 6. 75 Senior Notes Due 2024 [Member] |
|
| Title of 12(b) Security |
6.75% Senior Notes due 2024
|
| Trading Symbol |
RILYO
|
| Security Exchange Name |
NASDAQ
|
| Sec 6. 375 Senior Notes Due 2025 [Member] |
|
| Title of 12(b) Security |
6.375% Senior Notes due 2025
|
| Trading Symbol |
RILYM
|
| Security Exchange Name |
NASDAQ
|
| Sec 5. 00 Senior Notes Due 2026 [Member] |
|
| Title of 12(b) Security |
5.00% Senior Notes due 2026
|
| Trading Symbol |
RILYG
|
| Security Exchange Name |
NASDAQ
|
| Sec 5. 50 Senior Notes Due 2026 [Member] |
|
| Title of 12(b) Security |
5.50% Senior Notes due 2026
|
| Trading Symbol |
RILYK
|
| Security Exchange Name |
NASDAQ
|
| Sec 6. 50 Senior Notes Due 2026 [Member] |
|
| Title of 12(b) Security |
6.50% Senior Notes due 2026
|
| Trading Symbol |
RILYN
|
| Security Exchange Name |
NASDAQ
|
| Sec 5. 25 Senior Notes Due 2028 [Member] |
|
| Title of 12(b) Security |
5.25% Senior Notes due 2028
|
| Trading Symbol |
RILYZ
|
| Security Exchange Name |
NASDAQ
|
| Sec 6. 00 Senior Notes Due 2028 [Member] |
|
| Title of 12(b) Security |
6.00% Senior Notes due 2028
|
| Trading Symbol |
RILYT
|
| Security Exchange Name |
NASDAQ
|
| X |
- DefinitionBoolean flag that is true when the XBRL content amends previously-filed or accepted submission.
| Name: |
dei_AmendmentFlag |
| Namespace Prefix: |
dei_ |
| Data Type: |
xbrli:booleanItemType |
| Balance Type: |
na |
| Period Type: |
duration |
|
| X |
- DefinitionFor the EDGAR submission types of Form 8-K: the date of the report, the date of the earliest event reported; for the EDGAR submission types of Form N-1A: the filing date; for all other submission types: the end of the reporting or transition period. The format of the date is YYYY-MM-DD.
| Name: |
dei_DocumentPeriodEndDate |
| Namespace Prefix: |
dei_ |
| Data Type: |
xbrli:dateItemType |
| Balance Type: |
na |
| Period Type: |
duration |
|
| X |
- DefinitionThe type of document being provided (such as 10-K, 10-Q, 485BPOS, etc). The document type is limited to the same value as the supporting SEC submission type, or the word 'Other'.
| Name: |
dei_DocumentType |
| Namespace Prefix: |
dei_ |
| Data Type: |
dei:submissionTypeItemType |
| Balance Type: |
na |
| Period Type: |
duration |
|
| X |
- DefinitionAddress Line 1 such as Attn, Building Name, Street Name
| Name: |
dei_EntityAddressAddressLine1 |
| Namespace Prefix: |
dei_ |
| Data Type: |
xbrli:normalizedStringItemType |
| Balance Type: |
na |
| Period Type: |
duration |
|
| X |
- DefinitionAddress Line 2 such as Street or Suite number
| Name: |
dei_EntityAddressAddressLine2 |
| Namespace Prefix: |
dei_ |
| Data Type: |
xbrli:normalizedStringItemType |
| Balance Type: |
na |
| Period Type: |
duration |
|
| X |
- Definition
+ References
+ Details
| Name: |
dei_EntityAddressCityOrTown |
| Namespace Prefix: |
dei_ |
| Data Type: |
xbrli:normalizedStringItemType |
| Balance Type: |
na |
| Period Type: |
duration |
|
| X |
- DefinitionCode for the postal or zip code
| Name: |
dei_EntityAddressPostalZipCode |
| Namespace Prefix: |
dei_ |
| Data Type: |
xbrli:normalizedStringItemType |
| Balance Type: |
na |
| Period Type: |
duration |
|
| X |
- DefinitionName of the state or province.
| Name: |
dei_EntityAddressStateOrProvince |
| Namespace Prefix: |
dei_ |
| Data Type: |
dei:stateOrProvinceItemType |
| Balance Type: |
na |
| Period Type: |
duration |
|
| X |
- DefinitionA unique 10-digit SEC-issued value to identify entities that have filed disclosures with the SEC. It is commonly abbreviated as CIK. Reference 1: http://www.xbrl.org/2003/role/presentationRef
-Publisher SEC
-Name Exchange Act
-Number 240
-Section 12
-Subsection b-2
| Name: |
dei_EntityCentralIndexKey |
| Namespace Prefix: |
dei_ |
| Data Type: |
dei:centralIndexKeyItemType |
| Balance Type: |
na |
| Period Type: |
duration |
|
| X |
- DefinitionIndicate if registrant meets the emerging growth company criteria. Reference 1: http://www.xbrl.org/2003/role/presentationRef
-Publisher SEC
-Name Exchange Act
-Number 240
-Section 12
-Subsection b-2
| Name: |
dei_EntityEmergingGrowthCompany |
| Namespace Prefix: |
dei_ |
| Data Type: |
xbrli:booleanItemType |
| Balance Type: |
na |
| Period Type: |
duration |
|
| X |
- DefinitionCommission file number. The field allows up to 17 characters. The prefix may contain 1-3 digits, the sequence number may contain 1-8 digits, the optional suffix may contain 1-4 characters, and the fields are separated with a hyphen.
| Name: |
dei_EntityFileNumber |
| Namespace Prefix: |
dei_ |
| Data Type: |
dei:fileNumberItemType |
| Balance Type: |
na |
| Period Type: |
duration |
|
| X |
- DefinitionTwo-character EDGAR code representing the state or country of incorporation.
| Name: |
dei_EntityIncorporationStateCountryCode |
| Namespace Prefix: |
dei_ |
| Data Type: |
dei:edgarStateCountryItemType |
| Balance Type: |
na |
| Period Type: |
duration |
|
| X |
- DefinitionThe exact name of the entity filing the report as specified in its charter, which is required by forms filed with the SEC. Reference 1: http://www.xbrl.org/2003/role/presentationRef
-Publisher SEC
-Name Exchange Act
-Number 240
-Section 12
-Subsection b-2
| Name: |
dei_EntityRegistrantName |
| Namespace Prefix: |
dei_ |
| Data Type: |
xbrli:normalizedStringItemType |
| Balance Type: |
na |
| Period Type: |
duration |
|
| X |
- DefinitionThe Tax Identification Number (TIN), also known as an Employer Identification Number (EIN), is a unique 9-digit value assigned by the IRS. Reference 1: http://www.xbrl.org/2003/role/presentationRef
-Publisher SEC
-Name Exchange Act
-Number 240
-Section 12
-Subsection b-2
| Name: |
dei_EntityTaxIdentificationNumber |
| Namespace Prefix: |
dei_ |
| Data Type: |
dei:employerIdItemType |
| Balance Type: |
na |
| Period Type: |
duration |
|
| X |
- DefinitionLocal phone number for entity.
| Name: |
dei_LocalPhoneNumber |
| Namespace Prefix: |
dei_ |
| Data Type: |
xbrli:normalizedStringItemType |
| Balance Type: |
na |
| Period Type: |
duration |
|
| X |
- DefinitionBoolean flag that is true when the Form 8-K filing is intended to satisfy the filing obligation of the registrant as pre-commencement communications pursuant to Rule 13e-4(c) under the Exchange Act. Reference 1: http://www.xbrl.org/2003/role/presentationRef
-Publisher SEC
-Name Exchange Act
-Number 240
-Section 13e
-Subsection 4c
| Name: |
dei_PreCommencementIssuerTenderOffer |
| Namespace Prefix: |
dei_ |
| Data Type: |
xbrli:booleanItemType |
| Balance Type: |
na |
| Period Type: |
duration |
|
| X |
- DefinitionBoolean flag that is true when the Form 8-K filing is intended to satisfy the filing obligation of the registrant as pre-commencement communications pursuant to Rule 14d-2(b) under the Exchange Act. Reference 1: http://www.xbrl.org/2003/role/presentationRef
-Publisher SEC
-Name Exchange Act
-Number 240
-Section 14d
-Subsection 2b
| Name: |
dei_PreCommencementTenderOffer |
| Namespace Prefix: |
dei_ |
| Data Type: |
xbrli:booleanItemType |
| Balance Type: |
na |
| Period Type: |
duration |
|
| X |
- DefinitionTitle of a 12(b) registered security. Reference 1: http://www.xbrl.org/2003/role/presentationRef
-Publisher SEC
-Name Exchange Act
-Number 240
-Section 12
-Subsection b
| Name: |
dei_Security12bTitle |
| Namespace Prefix: |
dei_ |
| Data Type: |
dei:securityTitleItemType |
| Balance Type: |
na |
| Period Type: |
duration |
|
| X |
- DefinitionName of the Exchange on which a security is registered. Reference 1: http://www.xbrl.org/2003/role/presentationRef
-Publisher SEC
-Name Exchange Act
-Number 240
-Section 12
-Subsection d1-1
| Name: |
dei_SecurityExchangeName |
| Namespace Prefix: |
dei_ |
| Data Type: |
dei:edgarExchangeCodeItemType |
| Balance Type: |
na |
| Period Type: |
duration |
|
| X |
- DefinitionBoolean flag that is true when the Form 8-K filing is intended to satisfy the filing obligation of the registrant as soliciting material pursuant to Rule 14a-12 under the Exchange Act. Reference 1: http://www.xbrl.org/2003/role/presentationRef
-Publisher SEC
-Name Exchange Act
-Section 14a
-Number 240
-Subsection 12
| Name: |
dei_SolicitingMaterial |
| Namespace Prefix: |
dei_ |
| Data Type: |
xbrli:booleanItemType |
| Balance Type: |
na |
| Period Type: |
duration |
|
| X |
- DefinitionTrading symbol of an instrument as listed on an exchange.
| Name: |
dei_TradingSymbol |
| Namespace Prefix: |
dei_ |
| Data Type: |
dei:tradingSymbolItemType |
| Balance Type: |
na |
| Period Type: |
duration |
|
| X |
- DefinitionBoolean flag that is true when the Form 8-K filing is intended to satisfy the filing obligation of the registrant as written communications pursuant to Rule 425 under the Securities Act. Reference 1: http://www.xbrl.org/2003/role/presentationRef
-Publisher SEC
-Name Securities Act
-Number 230
-Section 425
| Name: |
dei_WrittenCommunications |
| Namespace Prefix: |
dei_ |
| Data Type: |
xbrli:booleanItemType |
| Balance Type: |
na |
| Period Type: |
duration |
|
| X |
- Details
| Name: |
us-gaap_StatementClassOfStockAxis=RILY_CommonStockParValue0.0001PerShareMember |
| Namespace Prefix: |
|
| Data Type: |
na |
| Balance Type: |
|
| Period Type: |
|
|
| X |
- Details
| Name: |
us-gaap_StatementClassOfStockAxis=RILY_DepositarySharesEachRepresenting11000thinterestina6.875Member |
| Namespace Prefix: |
|
| Data Type: |
na |
| Balance Type: |
|
| Period Type: |
|
|
| X |
- Details
| Name: |
us-gaap_StatementClassOfStockAxis=RILY_DepositarySharesEachRepresenting11000thfractionalinterestina7.375Member |
| Namespace Prefix: |
|
| Data Type: |
na |
| Balance Type: |
|
| Period Type: |
|
|
| X |
- Details
| Name: |
us-gaap_StatementClassOfStockAxis=RILY_Sec6.75SeniorNotesDue2024Member |
| Namespace Prefix: |
|
| Data Type: |
na |
| Balance Type: |
|
| Period Type: |
|
|
| X |
- Details
| Name: |
us-gaap_StatementClassOfStockAxis=RILY_Sec6.375SeniorNotesDue2025Member |
| Namespace Prefix: |
|
| Data Type: |
na |
| Balance Type: |
|
| Period Type: |
|
|
| X |
- Details
| Name: |
us-gaap_StatementClassOfStockAxis=RILY_Sec5.00SeniorNotesDue2026Member |
| Namespace Prefix: |
|
| Data Type: |
na |
| Balance Type: |
|
| Period Type: |
|
|
| X |
- Details
| Name: |
us-gaap_StatementClassOfStockAxis=RILY_Sec5.50SeniorNotesDue2026Member |
| Namespace Prefix: |
|
| Data Type: |
na |
| Balance Type: |
|
| Period Type: |
|
|
| X |
- Details
| Name: |
us-gaap_StatementClassOfStockAxis=RILY_Sec6.50SeniorNotesDue2026Member |
| Namespace Prefix: |
|
| Data Type: |
na |
| Balance Type: |
|
| Period Type: |
|
|
| X |
- Details
| Name: |
us-gaap_StatementClassOfStockAxis=RILY_Sec5.25SeniorNotesDue2028Member |
| Namespace Prefix: |
|
| Data Type: |
na |
| Balance Type: |
|
| Period Type: |
|
|
| X |
- Details
| Name: |
us-gaap_StatementClassOfStockAxis=RILY_Sec6.00SeniorNotesDue2028Member |
| Namespace Prefix: |
|
| Data Type: |
na |
| Balance Type: |
|
| Period Type: |
|
|
Amplify Video Game Tech ... (AMEX:GAMR)
Historical Stock Chart
From Mar 2024 to Apr 2024

Amplify Video Game Tech ... (AMEX:GAMR)
Historical Stock Chart
From Apr 2023 to Apr 2024
