false 0001785173 0001785173 2023-12-04 2023-12-04
UNITED STATES
SECURITIES AND EXCHANGE COMMISSION
Washington, D.C. 20549
FORM 8-K
CURRENT REPORT
Pursuant to Section 13 or 15(d)
of the Securities Exchange Act of 1934
Date of Report (Date of earliest event reported): December 4, 2023
89bio, Inc.
(Exact name of registrant as specified in its charter)
|
|
|
|
|
| Delaware |
|
001-39122 |
|
36-4946844 |
| (State or other jurisdiction of incorporation) |
|
(Commission File Number) |
|
(IRS Employer Identification No.) |
142 Sansome Street, Second Floor
San Francisco, CA 94104
(Address of principal executive offices, including zip code)
(415) 432-9270
(Registrant’s telephone number, including area code)
Not Applicable
(Former name or former address, if changed since last report)
Check the appropriate box below if the Form 8-K filing is intended to simultaneously satisfy the filing obligation of the registrant under any of the following provisions:
| ☐ |
Written communications pursuant to Rule 425 under the Securities Act (17 CFR 230.425) |
| ☐ |
Soliciting material pursuant to Rule 14a-12 under the Exchange Act (17 CFR 240.14a-12) |
| ☐ |
Pre-commencement communications pursuant to Rule 14d-2(b) under the Exchange Act (17 CFR 240.14d-2(b)) |
| ☐ |
Pre-commencement communications pursuant to Rule 13e-4(c) under the Exchange Act (17 CFR 240.13e-4(c)) |
Securities registered pursuant to Section 12(b) of the Act:
|
|
|
|
|
| Title of each class |
|
Trading Symbol(s) |
|
Name of each exchange on which registered |
| Common Stock, par value $0.001 per share |
|
ETNB |
|
The Nasdaq Global Market |
Indicate by check mark whether the registrant is an emerging growth company as defined in Rule 405 of the Securities Act of 1933 (§230.405 of this chapter) or Rule 12b-2 of the Securities Exchange Act of 1934 (§240.12b-2 of this chapter).
Emerging growth company ☒
If an emerging growth company, indicate by check mark if the registrant has elected not to use the extended transition period for complying with any new or revised financial accounting standards provided pursuant to Section 13(a) of the Exchange Act. ☐
On December 4, 2023, the Company made available an updated corporate presentation on the Company’s website. A copy of the corporate presentation is filed herewith as Exhibit 99.1 and incorporated herein by reference.
| Item 9.01 |
Financial Statements and Exhibits |
(d) Exhibits.
EXHIBIT INDEX
SIGNATURES
Pursuant to the requirements of the Securities Exchange Act of 1934, the registrant has duly caused this report to be signed on its behalf by the undersigned hereunto duly authorized.
|
|
|
|
|
|
|
89bio, Inc. |
|
|
|
| Date: December 6, 2023 |
|
By: |
|
/s/ Rohan Palekar |
|
|
|
|
Rohan Palekar |
|
|
|
|
Chief Executive Officer |

Exhibit 99.1 Powerful Science Meaningful Medicines Changing Lives
Nasdaq: ETNB December 2023

Disclaimers This presentation contains “forward-looking
statements” within the meaning of the federal securities laws, which statements are subject to substantial risks and uncertainties and are based on estimates and assumptions. Other than statements of historical facts, all statements included
in this presentation are forward-looking statements, including statements concerning our plans, objectives, goals, strategies, future events, plans or intentions relating to product candidates, potential market opportunities, estimates of market
size, estimates of market growth, the potential clinical benefit, complementary benefits to other therapies, effect on histology and safety and tolerability profile of pegozafermin (formerly BIO89-100), the clinical potential of pegozafermin,
potential indications for pegozafermin, the association of clinical data with potential clinical benefit in other indications, the anticipated timing, design, endpoints, and conduct of our future and ongoing clinical trials for pegozafermin, the
timing of anticipated milestones, the timing of regulatory meetings, the timing and likelihood of success, plans and objectives of management for future operations and future results of anticipated product development efforts and our liquidity and
capital resources, including our cash position. In some cases, you can identify forward-looking statements by terms such as “may,” “might,” “will,” “objective,” “intend,”
“should,” “could,” “can,” “would,” “expect,” “believe,” “design,” “estimate,” “predict,” “potential,” “plan” or the
negative of these terms, and similar expressions intended to identify forward-looking statements. These statements involve known and unknown risks, uncertainties and other factors that could cause our actual results to differ materially from the
forward-looking statements expressed or implied in this presentation including those described more fully our most recent Form 10-K and Form 10-Q under the caption “Risk Factors” and elsewhere in such report and in other subsequent
disclosure documents filed with the SEC. We cannot assure you that we will realize the results, benefits or developments that we expect or anticipate or, even if substantially realized, that they will result in the consequences or affect us or our
business in the way expected. Forward-looking statements are not historical facts, and reflect our current views with respect to future events. Given the significant uncertainties, you should evaluate all forward-looking statements made in this
presentation in the context of these risks and uncertainties and not place undue reliance on these forward- looking statements as predictions of future events. All forward-looking statements in this presentation apply only as of the date made and
are expressly qualified in their entirety by the cautionary statements included in this presentation. We disclaim any intent to publicly update or revise any forward-looking statements to reflect subsequent events or circumstances, except as
required by law. We obtained the industry, market and competitive position data used throughout this presentation from our own internal estimates and research, as well as from industry and general publications, and research, surveys and studies
conducted by third parties. Internal estimates are derived from publicly available information released by industry analysts and third-party sources, our internal research and our industry experience, and are based on assumptions made by us based on
such data and our knowledge of the industry and market, which we believe to be reasonable. In addition, while we believe the industry, market and competitive position data included in this presentation is reliable and based on reasonable
assumptions, we have not independently verified any third-party information, and all such data involve risks and uncertainties and are subject to change based on various factors. This data involves a number of assumptions and limitations, and you
are cautioned not to give undue weight to such estimates. This presentation discusses product candidates that are under preclinical or clinical evaluation and that have not yet been approved for marketing by the U.S. Food and Drug Administration or
any other regulatory authority. Until finalized in a clinical study report, clinical trial data presented herein remain subject to adjustment as a result of clinical site audits and other review processes. No representation is made as to the safety
or effectiveness of these product candidates for the use for which such product candidates are being studied. 1

Corporate Highlights Potential Best-in-Class FGF21 in Two Phase 3
programs, each of which * represents a significant market opportunity Nonalcoholic Steatohepatitis (NASH) Program 1 • Strongest fibrosis data in category with favorable tolerability and dosing convenience • First FGF21 with positive 48
wk data; additive benefits in patients on background GLP-1 therapy • Regulatory alignment on Phase 3 program including potentially accelerated approval using histology in pre-cirrhotic (F2-F3) and cirrhotic (F4) patients; trials expected to
initiate in 1H24 Severe Hypertriglyceridemia (SHTG) Program • Substantially de-risked Phase 3 with topline data anticipated in 2025 3 Strong balance sheet with $448 million in cash Intended commercial product presentation available;
composition of 2 matter patent expires in 2038 Highly experienced leadership team with track record of execution 1 Efficacy comparison based on relative risk ratios and not based on head-to-head results 2 Patent expiration date excludes any patent
term extension or new patents 3 Cash, cash equivalents and short-term investments as of September 30, 2023; excludes in-the-money warrants of approximately $50 million that expire on June 30, 2024 2 * If approved

Advancing Pegozafermin in Clinical Development INDICATION TRIAL
PRECLINICAL PHASE 1 PHASE 2 PHASE 3 NASH Phase 3 trial in F2/F3: Histology & Outcomes – 1Q24 Breakthrough Therapy designation Phase 3 trial in F4: Histology & Outcomes – 2Q24 Phase 3 trial – Ongoing SHTG 3

Pegozafermin Data Published in Prestigious Journals 4

Pegozafermin is an FGF21 Analog Optimally Engineered to Balance Efficacy
and Long Dosing Interval glycoPEG(20kD) FGF21 Pegozafermin EC (nM) EC (nM) 50 50 Strong and flexible linker RECEPTOR Mean ± S.D. Mean ± S.D. (glycoPEGylation technology) Position 182 KLB nd nd KLB/FGFR1 4.5 ± 1.0 0.3 ± 0.07
N-terminus C-terminus FGF21 XX KLB/FGFR2 4.5 ± 0.9 1.1 ± 0.4 KLB/FGFR3 1.8 ± 0.3 1.2 ± 0.4 Mutations in positions 173 and 176 KLB/FGFR4 nd nd (glycoPEG attached at position 173) nd – not determined; rhFGF19 EC at FGFR4 =
1.7 ± 0.4 50 • Proprietary glycoPEGylation technology commercially validated with approved products • Increases half-life of native FGF21 (<2 hours) to 55-100 hours based on single ascending dose study • Low nanomolar
potency against FGF receptors 1c, 2c, 3c, similar to native FGF21 • Composition of Matter patent expiring in 2038 * Receptor agonism measured in L6 cells expressing β-klotho and either FGF Receptor 1c, 2c, 3c, or 4 via pERK functional
assay 5 ** Table represents mean data from multiple experiments

Opportunity in NASH

* Pegozafermin Offers Potential Best-in-Class Therapeutic for NASH
REDUCES LIVER FAT FAVORABLE TOLERABILITY & IMPROVES REVERSES LIVER FIBROSIS RESOLVES NASH CONVENIENT DOSING INSULIN to improve patient RESISTANCE persistence and compliance IMPROVES DYSLIPIDEMIA * If approved 7

ENLIVEN Trial Evaluated Weekly (QW) and Every-Two-Week (Q2W) Dosing in
Patients with NASH F2-F3 BLINDED PRIMARY ENDPOINTS MAIN STUDY EXTENSION PHASE (24 weeks) (24 weeks) • ≥1-stage fibrosis improvement 1 with no worsening of NASH Placebo (QW or Q2W) PLACEB PLO* ACEBO (QWQ2 orW Q2W) • NASH resolution
with no 2 worsening of fibrosis Pegozafermin 15mg QW Pegozafermin 15mg QW KEY SECONDARY Pegozafermin 30mg QW Pegozafermin 30mg QW EFFICACY ENDPOINTS • ≥2-point change in NAS with no Pegozafermin 44mg Q2W Pegozafermin 44mg Q2W worsening
of fibrosis B B• Non-invasive liver markers (liver fat, liver injury, fibrosis markers) Week 12 Week 24 Week 48 B Liver Biopsy MRI-PDFF Primary endpoint 1 Improvement in liver fibrosis by ≥1 stage and no worsening of steatohepatitis
defined as no increase in NAS for ballooning, inflammation, or steatosis (FDA draft guidance). 2 Resolution of steatohepatitis is defined as absent fatty liver disease or isolated or simple steatosis without steatohepatitis and a NAS score of 0-1
for inflammation, 0 for ballooning and any value for steatosis (FDA draft guidance). *Some placebo patients were re-randomized in the extension phase to receive pegozafermin. 8 NAS, NAFLD Activity Score; MRI-PDFF, Magnetic resonance
imaging-estimated proton density fat fraction; QW: Every week; Q2W: Every 2 weeks SCREENING RANDOMIZATION
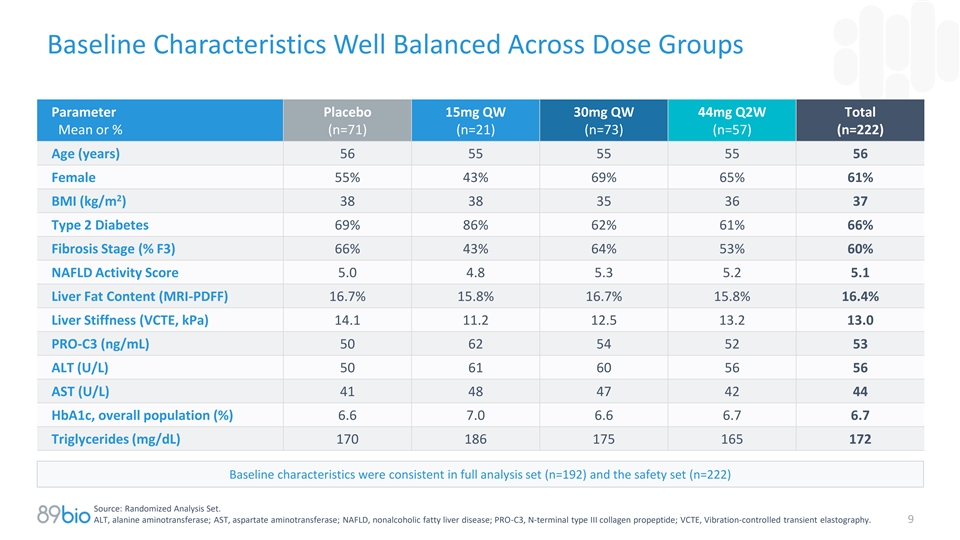
Baseline Characteristics Well Balanced Across Dose Groups Parameter
Placebo 15mg QW 30mg QW 44mg Q2W Total Mean or % (n=71) (n=21) (n=73) (n=57) (n=222) Age (years) 56 55 55 55 56 Female 55% 43% 69% 65% 61% 2 BMI (kg/m ) 38 38 35 36 37 Type 2 Diabetes 69% 86% 62% 61% 66% Fibrosis Stage (% F3) 66% 43% 64% 53% 60%
NAFLD Activity Score 5.0 4.8 5.3 5.2 5.1 Liver Fat Content (MRI-PDFF) 16.7% 15.8% 16.7% 15.8% 16.4% Liver Stiffness (VCTE, kPa) 14.1 11.2 12.5 13.2 13.0 PRO-C3 (ng/mL) 50 62 54 52 53 ALT (U/L) 50 61 60 56 56 AST (U/L) 41 48 47 42 44 HbA1c, overall
population (%) 6.6 7.0 6.6 6.7 6.7 Triglycerides (mg/dL) 170 186 175 165 172 Baseline characteristics were consistent in full analysis set (n=192) and the safety set (n=222) Source: Randomized Analysis Set. ALT, alanine aminotransferase; AST,
aspartate aminotransferase; NAFLD, nonalcoholic fatty liver disease; PRO-C3, N-terminal type III collagen propeptide; VCTE, Vibration-controlled transient elastography. 9

WEEK 24 Pegozafermin Demonstrated Statistical Significance on Fibrosis
Improvement at 30mg QW and 44mg Q2W Dose Fibrosis Improvement Without Worsening of NASH at Week 24 p=0.008 40% p=0.008 p=0.1 30% 27% 26% 22% 20% 19% 20% 15% 10% 7% 0% Placebo 15mg QW 30mg QW 44mg Q2W n=61 n=14 n=66 n=51 * Relative Risk 1.0 2.9 3.5
3.6 *Relative risk presented is calculated by dividing the drug response by placebo response. Relative risk calculated using statistical methods show similar results. Source: Full Analysis Set; multiple imputation analysis via
Cochran-Mantel-Haenszel (CMH) test stratified by type 2 diabetes mellitus (T2DM) status (yes vs. no) and fibrosis stage (F2 vs. F3). 10

Comparative Clinical Data in Non-Cirrhotic Patients ≥1 Stage
Fibrosis Improvement with No Worsening of NASH (placebo-adjusted) ƚ 2 Pegozafermin Ocaliva Resmetirom Lanifibranor Semaglutide Efruxifermin Phase 3 | 52 weeks Phase 2b | 24 weeks Phase 3 | 72 weeks Phase 2b | 24 weeks Phase 2 | 72 weeks Phase
2b | 24 weeks 1 Multiple Imputation Completers Analysis Drug response as multiple of 3.5 3.6 2.3 1.7 1.9 1.1 1.6 1.3 2.0 2.0 placebo response* 21% 20% 19% 19% 17% 12% 13% 10% 10% 3% p<0.05 p<0.05 p=0.008 p=0.008 p<0.001 p=0.0002 p<0.0001
p=ns p=0.04 p=ns 50mg 30mg QW 44mg Q2W 25mg 80mg 100mg 800mg 1200mg 0.4mg QD 28mg (n=34) (n=66) (n=51) (n=308) (n=316) (n=321) (n=63) (n=69) (n=56) (n=38) *Drug response as multiple of placebo response is calculated by dividing drug response by
placebo response 1 2 ƚ Results same for Completer Analysis Set; ≥1 stage fibrosis improvement with no worsening of NAS; Program discontinued; ns= not significant Note: These data are derived from different clinical trials at different
points in time, with differences in trial design and patient populations. As a result, cross-trial comparisons cannot be made, and no head-to-head clinical trials have been conducted. 11

WEEK 24 Pegozafermin Demonstrated Statistical Significance on NASH
Resolution at All Doses NASH Resolution Without Worsening of Fibrosis at Week 24 p=0.0005 p=0.0009 50% p<0.0001 40% 37% 30% 26% 23% 20% 35% 24% 21% 10% 2% 0% Placebo 15mg QW 30mg QW 44mg Q2W n=61 n=14 n=66 n=51 * Relative Risk 1.0 18.8 11.8 13.5
* Relative risk presented is calculated by dividing the drug response by placebo response. Relative risk calculated using statistical methods show similar results. Source: Full Analysis Set; multiple imputation analysis via Cochran-Mantel-Haenszel
(CMH) test stratified by T2DM status (yes vs. no) and fibrosis stage (F2 vs. F3). 12

Comparative Clinical Data in Non-Cirrhotic Patients NASH Resolution
with No Worsening of Fibrosis ƚ 2 Pegozafermin Ocalivia Resmetirom Lanifibranor Semaglutide Efruxifermin Phase 2b | 24 weeks Phase 3 | 72 weeks Phase 3 | 52 weeks Phase 2b | 24 weeks Phase 2 | 72 weeks Phase 2b | 24 weeks 1 Multiple Imputation
Completers Analysis Drug response as multiple of 11.8 13.5 1.9 2.6 3.0 1.7 2.1 3.5 3.1 5.1 placebo response* 61% 44% 32% 26% 24% 21% 20% 17% 16% 3% p=ns p=0.0009 p=0.0005 p<0.0001 p<0.0001 p=0.039 p=0.002 p<0.001 p<0.01 p<0.001 30mg
QW 44mg Q2W 25mg 80mg 100mg 800mg 1200mg 0.4mg 28mg 50mg (n=66) (n=51) (n=308) (n=316) (n=321) (n=56) (n=38) (n=34) (n=63) (n=69) * Drug response as multiple of placebo response is calculated by dividing drug response by placebo response 1 2 Results
same for Completer Analysis Set; NASH resolution with ≥2 point reduction in NAS and no worsening of fibrosis ƚ Program discontinued 13 Note: These data are derived from different clinical trials at different points in time, with
differences in trial design and patient populations. As a result, cross-trial comparisons cannot be made, and no head-to-head clinical trials have been conducted.

WEEK 24 Pegozafermin Demonstrated Statistical Significance on the
Combined Endpoint of Fibrosis Improvement and NASH Resolution Both Fibrosis Improvement and ≥2-Point Improvement in NAS and MRI-PDFF NASH Resolution at Week 24 Response and ALT Response 30% 80% *** 60% *** 60% *** 20% 52% 20% *** 14% 40% 10%
20% 9% 0% 0% 0% Placebo 30mg QW 44mg Q2W Placebo 30mg QW 44mg Q2W n=61 n=66 n=51 n=61 n=66 n=51 Source: Full Analysis Set; multiple imputation analysis via Cochran-Mantel-Haenszel (CMH) test stratified by T2DM status (yes vs. no) and fibrosis stage
(F2 vs. F3). MRI-PDFF responder defined as ≥30% reduction in liver fat content; ALT responder defined as ≥17U/L reduction. 14 ***p<0.001 versus placebo. Patients Patients

WEEK 24 Pegozafermin Demonstrated Robust Liver Fat Reduction with High
Responder Rates by MRI-PDFF 1 Mean Relative Reduction in Liver Fat vs Baseline Patients Achieving ≥30% and ≥50% Reduction in 2 at Week 24 Hepatic Fat Fraction Versus Baseline Placebo 30mg QW 44mg Q2W N=48 N=49 N=35 100% 0% -10% 80%
≥30% *** 85% *** -20% 77% reduction -15% 60% -30% -40% 40% *** ≥50% *** 67% 66% -50% reduction *** 31% 20% -50% *** -60% -55% 13% -70% 0% Placebo 30mg QW 44mg Q2W N=48 N=44 N=33 1 2 Analysis via mixed model repeated measure (MMRM).
Analysis via Cochran-Mantel-Haenszel (CMH) test stratified by T2DM status (yes vs. no) and fibrosis stage (F2 vs. F3). MRI-PDFF Analysis Set in patients with >10% liver fat at baseline. 15 ***p<0.001 versus placebo Change from baseline
Patients

WEEK 24 Pegozafermin Demonstrated Significant Improvements in Markers
of Liver Injury/Inflammation (ALT and AST) Mean Relative Reduction in ALT vs Mean Relative Reduction in AST vs Baseline at Week 24 Baseline at Week 24 Placebo 30mg QW 44mg Q2W Placebo 30mg QW 44mg Q2W n=61 n=66 n=51 n=61 n=66 n=51 0% 0% -10% -5%
-10% -5% -20% -20% -30% -30% *** -32% *** -34% -40% -40% *** -39% *** -42% -50% -50% ALT *** *** 24% 59% 65% 1 normalization 1 ALT normalization defined as patients with ALT ≥30 U/L at baseline (n=133) with end-of-study ALT <30 U/L. Source:
Full Analysis Set: Analysis via mixed model with repeated measure (MMRM). Data presented as LS Means. 16 ***p<0.001 versus placebo.

WEEK 24 Pegozafermin Demonstrated Significant Reductions in
Non-Invasive Markers (NITs) of Liver Inflammation and Fibrosis cT1 - Absolute Change from VCTE - Absolute Change from FAST - Percent Change from Baseline at Week 24 (ms) Baseline at Week 24 (kPa) Baseline at Week 24 0 0% 0.8 0.5 -6 -6% -20 -20% -0.5
-40 -40% -1.5 -60 -60% *** *** -2.5 -70 -56% *** -80 ** -57% -2.4 *** -3.1 *** -92 -100 -3.5 -80% Placebo 30mg QW 44mg Q2W Placebo 30mg QW 44mg Q2W Placebo 30mg QW 44mg Q2W n=57 n=61 n=49 n=61 n=66 n=51 n=61 n=66 n=51 Placebo-adjusted -86 -64
Placebo-adjusted -3.9 -3.2 Placebo-adjusted -50% -51% Source: Full Analysis Set for FibroScan and PRO-C3 assessments and MRI-PDFF analysis set for cT1, Analysis via MMRM for cT1 and PRO-C3, ANCOVA for VCTE. A patient is designated a cT1 responder
with ≥80 msec reduction as compared to baseline. cT1 analysis was performed at sites where available. 17 *p<0.05, **p<0.01, ***p<0.001 versus placebo.

WEEK 24 Pegozafermin Demonstrated Significant Improvements on Non-
Invasive Markers (NITs) for Fibrosis ELF - Absolute Change from FIB-4 - Absolute Change from PRO-C3 - Percent Change from Baseline at Week 24 (ms) Baseline at Week 24 (kPa) Baseline at Week 24 0.3 0.2 6% 0.2 0.1 5% 0.1 0.0 -5% -0.1 -0.2 -15% -0.3
*** *** *** -0.3 -0.3 *** -17% -18% *** -0.3 *** -0.4 -0.4 -0.5 -25% Placebo 30mg QW 44mg Q2W Placebo 30mg QW 44mg Q2W Placebo 30mg QW 44mg Q2W n=61 n=66 n=51 n=61 n=66 n=51 n=61 n=66 n=51 Placebo-adjusted -0.5 -0.5 Placebo-adjusted -0.4 -0.4
Placebo-adjusted -25% -24% Source: Full Analysis Set. NITs reported as LS means with changes from baseline (absolute or %) 18 ***p<0.001 versus placebo.

WEEK 48 Pegozafermin Demonstrated Sustained Benefits Across Key Liver
NITs and Metabolic Markers At 48 Weeks of Treatment BACKGROUND KEY RESULTS • After the Main Study (week 24), patients entered • Robust effects were observed at week 48 on liver a 24-week blinded Extension Phase for a total of fat
reduction, markers of liver fibrosis, 48 weeks of treatment inflammation and injury, and metabolic markers • Liver benefits at week 48 assessed by NITs only. • Maintenance of benefit was seen through week 48 Repeat biopsies were not
conducted • Benefit sustained in patients on background GLP-1 • Some placebo patients (n=19) were re- therapy and in patients with compensated randomized at week 24 to receive pegozafermin cirrhosis (F4) 30mg QW during the Extension
Phase • Favorable safety and tolerability profile 19

ENLIVEN Patient Disposition and Analysis Sets DOSED Safety Analysis Set
Ineligible per 3-panel read N=219 • Stage F1 (n=7) • Stage F4 (n=14) • Stage F2/F3 but NAS <4 (n=6) F2/F3, NAS≥4 N=192 Full Analysis Set (FAS) Placebo 15mg QW 30mg QW 44mg Q2W n=61 n=14 n=66 n=51 Extension Placebo 30mg QW
Phase Full 15mg QW 30mg QW 44mg Q2W n=35 n=19 n=14 n=50 n=45 Analysis Set (eFAS) Analysis Sets were prospectively defined MRI-PDFF Analysis Set = all patients in FAS with baseline and at least one post-baseline MRI-PDFF assessment (n=181).
20

WEEK 48 Pegozafermin Maintained Robust Liver Fat Reduction Measured by
MRI-PDFF 1 Median Relative Reduction in Liver Fat vs Baseline at Week 48 Placebo 30mg QW 44mg Q2W N=25 N=39 N=28 0% -10% -11% -20% -30% -40% -50% * -47% -60% ** -60% -70% 84% of super-responders on PGZ 30 mg QW at week 24 maintained benefit at week
48 1 Analysis via non-parametric statistical method. MRI-PDFF Analysis Set in patients with >10% liver fat at baseline. 21 *p<0.05, **p<0.01 versus placebo; super-responder defined as ≥50% relative reduction from baseline Change from
baseline

WEEK 48 Pegozafermin Demonstrated Sustained Improvements in Markers of
Liver Injury/Inflammation (ALT and AST) over 48 Weeks Mean Percent Change from Baseline ALT AST Baseline Week 12 Week 24 Week 48 Baseline Week 12 Week 24 Week 48 0% 0% -11% -4% -10% -10% -20% -20% -30% -30% ** *** -35% -36% -40% -40% *** -39% ***
-42% -50% -50% Placebo PGZ 30mg QW PGZ 44mg Q2W Placebo PGZ 30mg QW PGZ 44mg Q2W >85% of ALT responders maintained benefit from week 24 to week 48 on both PGZ doses **p<0.01, ***p<0.001 versus placebo. Analysis via mixed model with repeated
measure (MMRM). Baseline values based on Randomized Analysis set for total patients; results based on Full Analysis Set. ALT responder defined as ≥17 U/L reduction from baseline 22

WEEK 48 Pegozafermin Demonstrated Significant Reductions in NITs of
Liver Inflammation and Fibrosis FAST Pro-C3 VCTE (kPa) ELF Score 30mg 44mg 30mg 44mg 30mg 44mg 30mg 44mg Placebo QW Q2W Placebo QW Q2W Placebo QW Q2W Placebo QW Q2W n=33 n=48 n=40 n=33 n=48 n=40 n=42 n=66 n=51 n=42 n=66 n=51 0.0 10% 0.2 +0.1 +5%
-10% 0.1 -4% -1.0 0.0 -0.8 0% -1.3 -30% -0.1 -2.0 -0.2 -10% -50% -0.3 -3.0 ** -0.3 *** * -51% -2.9 -0.4 *** -14% *** *** -15% *** -59% -0.4 -70% -4.0 -20% -0.5 Placebo-adjusted -56% -48% Placebo-adjusted -2.0 -0.2 Placebo-adjusted -20% -19%
Placebo-adjusted -0.4 -0.5 Analysis via MMRM for FAST, PRO-C3 and ELF score; via non-parametric statistical method for VCTE median relative reduction Source: Full Analysis Set, VCTE results from patients with week 48 assessment. 23 *p<0.05,
**p<0.01, ***p<0.001 versus placebo.

WEEK 48 Pegozafermin Demonstrated Continued Benefit in Metabolic
Endpoints HbA1c Triglycerides LDL-C Non-HDL-C 30mg 44mg 30mg 44mg 30mg 44mg 30mg 44mg Placebo QW Q2W Placebo QW Q2W Placebo QW Q2W Placebo QW Q2W n=14 n=23 n=16 n=32 n=48 n=38 n=32 n=48 n=38 n=32 n=48 n=38 0.0 0% 0% 0% -5% -2% -3% -0.2 -5% -5% -5%
-5% -10% -0.4 -10% -8% -15% -8% -10% -0.5 -0.5 -0.6 -15% -20% -12% ** -21% -0.7 -18% -0.8 -25% -20% -15% Analysis via MMRM for HbA1c and non-parametric statistical method for Triglycerides, LDL-C and Non-HDL-C; **p<0.01 versus placebo. Source:
Full Analysis Set; Median change from baseline except for HbA1c; HbA1c in patients with T2DM and baseline >7.0% (n=53) 24
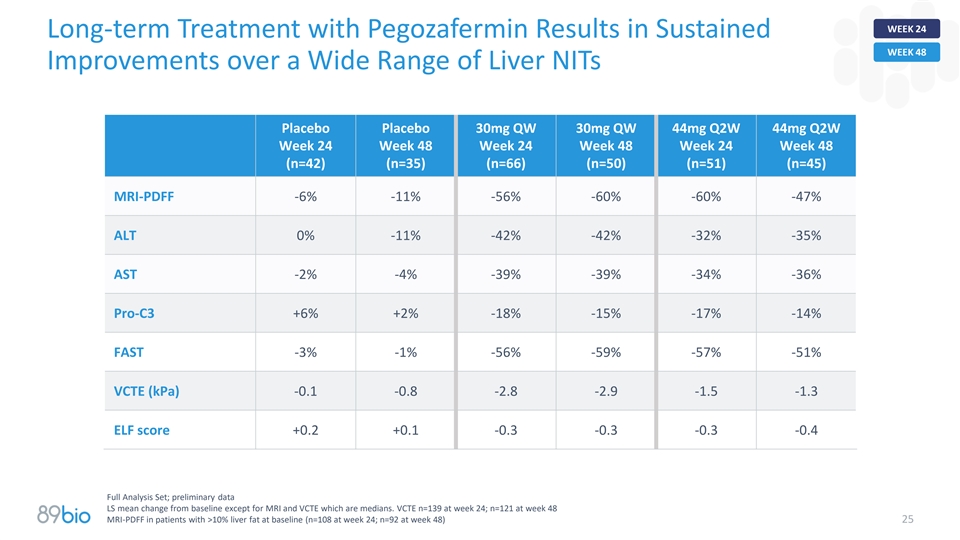
WEEK 24 Long-term Treatment with Pegozafermin Results in Sustained WEEK
48 Improvements over a Wide Range of Liver NITs Placebo Placebo 30mg QW 30mg QW 44mg Q2W 44mg Q2W Week 24 Week 48 Week 24 Week 48 Week 24 Week 48 (n=42) (n=35) (n=66) (n=50) (n=51) (n=45) MRI-PDFF -6% -11% -56% -60% -60% -47% ALT 0% -11% -42% -42%
-32% -35% AST -2% -4% -39% -39% -34% -36% Pro-C3 +6% +2% -18% -15% -17% -14% FAST -3% -1% -56% -59% -57% -51% VCTE (kPa) -0.1 -0.8 -2.8 -2.9 -1.5 -1.3 ELF score +0.2 +0.1 -0.3 -0.3 -0.3 -0.4 Full Analysis Set; preliminary data LS mean change from
baseline except for MRI and VCTE which are medians. VCTE n=139 at week 24; n=121 at week 48 MRI-PDFF in patients with >10% liver fat at baseline (n=108 at week 24; n=92 at week 48) 25

WEEK 48 Independent Patient Confirmation of Pegozafermin Treatment
Effect Placebo Patients Showed Robust Benefits Upon Crossing Over to Pegozafermin Change from Baseline Main Study Extension Phase Parameter Placebo 30mg QW n=19 n=19 MRI-PDFF -21% -63% ALT -2% -32% AST -2% -31% PRO-C3 +8% -17% FAST -14% -53% VCTE
(kPa) -0.7 -2.4 ELF score +0.1 -0.2 19 patients were re-randomized from placebo to 30mg QW at week 24 and continued through week 48 Mean change from baseline except for VCTE which is median 26 MRI-PDFF in patients with >10% liver fat at
baseline (n=17); Full Analysis Set

GLP1 Pegozafermin Offered Additive Benefits to GLP-1 Therapy in
Patients with NASH through Week 48 KEY RESULTS BACKGROUND • Results from 37 patients in ENLIVEN who were Pegozafermin on top of GLP-1 therapy showed the on GLP-1 therapy at baseline – 25 received following versus GLP-1 plus placebo at
week 24 and pegozafermin, 12 received placebo week 48: • Patients on GLP-1 were on stable doses for a • Improved Fibrosis minimum of six months with most patients on • Reduced Liver Fat semaglutide or dulaglutide; most of these
patients were also on additional diabetes • Improved Liver Health medications • Acceptable Tolerability Profile • Patients had comparable baseline characteristics across groups and relative to full study population 27

WEEK 24 Greater Benefits on Fibrosis Markers Were Observed with
Pegozafermin vs. GLP1 Placebo in Patients on Background GLP-1 Therapy at Week 24 ALT (%) VCTE (kPa) ELF Score Pro-C3 (%) 0.5 40% 0% 0.0 +0.3 +26% 0.3 -0.5 -0.4 -11% 20% -1.0 0.1 -25% -1.5 -0.1 0% -2.0 -0.3 -38% -2.1 -0.4 -50% -0.5 -20% -2.5 -15%
Placebo PGZ Placebo PGZ Placebo PGZ Placebo PGZ (N=12) (N=25) (N=12) (N=25) (N=11) (N=23) (N=12) (N=25) Source: Full Analysis Set. ELF, ALT and Pro-C3 reported as LS mean change from baseline; VCTE reported as median change (absolute) from baseline.
28 Post-hoc analysis

WEEK 24 Greater Benefits on Metabolic Markers Were Observed with
Pegozafermin GLP1 vs. Placebo in Patients on Background GLP-1 Therapy at Week 24 HbA1c Triglycerides (%) MRI-PDFF (%) Adiponectin (%) 0 0% 40% 0% 0% 33% -0.1 -10% -20% 30% -0.1 -0.2 -28% -20% -40% 20% -0.3 -30% -60% 10% -54% -0.4 -29% 4% -0.4 -0.5
-80% 0% -40% Placebo PGZ Placebo PGZ Placebo PGZ Placebo PGZ (N=11) (N=23) (N=11) (N=22) (N=12) (N=25) (N=11) (N=23) Source: Full Analysis Set. Adiponectin reported as LS mean change from baseline; HbA1c reported as median change (absolute) from
baseline; 29 MRI-PDFF and TG reported as median percent change from baseline. Post-hoc analysis

WEEK 48 Sustained Benefits on Fibrosis Markers Were Observed with
Pegozafermin GLP1 vs. Placebo in Patients on Background GLP-1 Therapy at Week 48 ELF Score FAST (%) Pro-C3 (%) ALT (%) 0 0% 0% 0% 0 -5% -0.2 -20% -20% -15% -10% -9% -15% -40% -40% -0.4 * -43% -20% -44% -19% -0.5 -52% -60% -0.6 -60% -25% Placebo PGZ
Pooled Placebo PGZ Pooled Placebo PGZ Pooled Placebo PGZ Pooled n=10 n=26 n=10 n=26 n=10 n=26 n=10 n=26 Source: Full Analysis Set. ELF, ALT, FAST and Pro-C3 reported as LS mean change from baseline. *p<0.05 versus placebo. Post-hoc analysis.
30

WEEK 48 Sustained Benefits on Metabolic Markers Were Observed with
Pegozafermin GLP1 vs. Placebo in Patients on Background GLP-1 Therapy at Week 48 MRI-PDFF (%) Triglycerides (%) LDL-C (%) Placebo PGZ Pooled Placebo PGZ Pooled Placebo PGZ Pooled n=8 n=17 n=8 n=18 n=8 n=18 0% 0% 0% -5% -20% -10% -12% -10% -34% -40%
-20% -14% -22% -53% -20% -60% -30% 31 Source: Full Analysis Set. TG, and LDL-C and MRI-PDFF reported as median percent change from baseline. Post-hoc analysis

F4 Pegozafermin Offers a Promising Profile in Patients with Compensated
NASH Cirrhosis (F4) KEY RESULTS BACKGROUND • ENLIVEN enrolled 14 NASH Stage F4 patients of • 45% of pegozafermin-treated patients had fibrosis * which 12 patients had follow-up biopsies at improvement ≥1 stage without worsening of
NASH week 24 • Improvements in NITs of fibrosis, liver injury, and • Patients had baseline characteristics generally liver fat were observed through week 48 reflective of a well-compensated cirrhotic • Safety and tolerability
profile in F4 was similar to population the F2/F3 population *N=1 on placebo and N=11 PGZ (all doses) 32

WEEK 24 Pegozafermin Achieved Fibrosis Improvement Without Worsening F4
of NASH in 45% of Patients with F4 Fibrosis at Baseline Fibrosis Improvement ≥1 Stage Without Worsening of NASH 50% 45% • Pegozafermin treatment led to fibrosis improvement ≥1 40% stage in 9/11 treated patients (82%) 30% •
Pegozafermin treatment led to fibrosis improvement with 20% no worsening of ballooning and inflammation in 7/11 treated patients 10% 0% 0% Placebo PGZ Pooled n=1 n=11 12/14 cirrhotic patients enrolled in ENLIVEN had follow-up biopsies at week 24 (11
treated patients and 1 placebo patient). 33

Pegozafermin Has Demonstrated Preliminary Evidence for Potential
Best-in-Category Fibrosis Regression in Patients with F4 Fibrosis* FGF21 FGF21 Peg-FGF21 FGF19 GLP-1 FXR ASK1 PGZ | 24 weeks EFX | 36 weeks Pegbelfermin | 48 weeks Aldafermin | 48 weeks Sema | 48 weeks Ocaliva | 78 weeks Selonsertib | 48 weeks 45%
31% 29% 28% 24% 24% 23% 22% 21% 19% 17% 16% 15% 14% 12% 11% 11% 10% 0% Placebo PGZ Placebo 28mg 50mg Placebo 20mg 40mg Placebo 1mg 3mg Placebo 2.4mg Placebo 10mg 25mg Placebo 6mg 18mg (n=1) Pooled (n=57) (n=46) (n=50) (n=39) (n=37) (n=39) (n=40)
(n=40) (n=40) (n=24) (n=47) (n=~306) (n=~306) (n=~306) (n=172) (n=351) (n=354) (n=11) * If approved Note: These data are derived from different clinical trials at different points in time, with differences in trial design and patient populations. As
a result, cross-trial comparisons cannot be made, and no head-to-head clinical trials have been conducted. 34

WEEK 24 NIT Results over 48 Weeks in F4 Patients From ENLIVEN WEEK 48
Demonstrated Consistent Benefit F4 PGZ Treated Patients (n=12) Parameter 24 weeks 48 weeks Liver Fibrosis and Inflammation ELF (units) -0.3 -0.5 FAST -46% -42% VCTE (kPa) -2.7 -1.1 Pro-C3 -5% -20% FIB-4 -11% -16% Liver Injury ALT (%) -53% -58% AST
(%) -31% -38% High correlation between NIT responders and fibrosis improvement (AASLD 2023) Data presented as LS means for ALT, AST, FAST, Pro-C3, FIB-4 and ELF and as medians for the other parameters 35

Pegozafermin Was Well Tolerated Through 48 Weeks Drug-related TEAEs in
≥10% of patients during the Main Study Placebo 15mg QW 30mg QW 44mg Q2W Preferred Term (n=69) (n=21) (n=72) (n=57) Diarrhea 3% 24% 17% 9% Nausea 1% 14% 21% 18% Injection site erythema 3% 14% 14% 5% Injection site rash 1% 0 10% 4% Increased
appetite 0 10% 13% 5% * Additional Patients that Reported Drug-related TEAEs during the Extension Phase Placebo 15mg QW 30mg QW 44mg Q2W Preferred Term (n=50) (n=21) (n=72) (n=57) Diarrhea 2% 0 0 0 Nausea 0 0 0 0 Injection site erythema or rash 0 0
0 0 Increased appetite 2% 0 1% 0 At week 48, no statistically significant or clinically meaningful changes were observed in blood pressure, bone biomarkers or DXA with PGZ 30 mg QW or 44 mg Q2W relative to placebo. No treatment-related AE
discontinuations during the extension phase. *Drug-related TEAEs in ≥10% of patients in the trial 36 Source: Safety Analysis Set. AE table cutoff ≥10% of patients for placebo, 30mg QW and 44mg Q2W doses. Bone biomarkers were CTX and
P1NP.

Phase 3 ENLIGHTEN Studies in NASH Expected to Initiate in 1H24 FDA and
EMA Generally Aligned on Phase 3 Program ENLIGHTEN-Fibrosis: ENLIGHTEN-Cirrhosis: in F2-F3 NASH patients in Compensated F4 NASH patients Design/ Randomized, double-blind, placebo-controlled trial Randomized, double-blind, placebo-controlled trial of
pegozafermin 30mg QW and 44mg Q2W of pegozafermin 30mg QW Doses Histology Co-primary endpoints: one-point improvement in Primary endpoint: regression of fibrosis from F4 to an Portion for fibrosis with no worsening of NASH and NASH earlier stage of
fibrosis Accelerated resolution with no worsening of fibrosis Duration: 24 months, with potential to assess earlier Approval Duration: 52 weeks based on the evolving clinical and regulatory landscape • Patients continue to clinical outcomes to
support • Patients continue to clinical outcomes to Outcomes full approval across F2-F4 patients support full approval in F2-F3 patients Portion for • Modifications to some outcome definitions to allow • Outcomes defined per FDA
guidance document Full trial to reach final number of events quicker, and Approval therefore potentially accelerate timeline to readout Safety Database: Regulatory alignment on size of safety database including data from the ongoing SHTG Phase 3
program Drug Presentation: Liquid formulation in pre-filled syringe (planned commercial presentation; stable at 2-8 C) 37

Pegozafermin Has Potential to Address a Large Commercial Opportunity
NASH represents a large patient population with significant health risks • NASH is estimated to impact ~30M patients by 2030 in the US with equivalent number in EU Significant market opportunity for pegozafermin • Pegozafermin positioned
for NASH patients with (i) advanced fibrosis and (ii) compensated cirrhosis • Pegozafermin is uniquely positioned to meet the primary treatment objectives for these patients - reversal of fibrosis stage and prevention to cirrhosis or
decompensation – Potent anti-fibrotic drugs like pegozafermin are expected to be the preferred option to treat NASH versus metabolic drugs that reduce fat and indirectly improve liver health over time – Pegozafermin data showed additive
benefits to GLP-1 based therapies for NASH patients • Large NASH market is likely to support drugs with different mechanisms of action and multiple drugs within a specific mechanism (similar to T2DM or LDL therapeutic area) 38

NASH Treatment Paradigm and Pegozafermin Positioning FIBROSIS STAGING
F1 F2 F3 F4 (Compensated) LOW Risk Staging based on: MEDIUM • Fibrosis Progression HIGH • Liver Events • CV Events VERY HIGH Improve Glycemic Control / Improve Dyslipidemia / Reduce Weight Resolve Steatohepatitis Primary Treatment
Prevent Fibrosis Progression Objectives Prevent Progression to Cirrhosis Prevent Decompensation Metabolic Drugs / Obesity Drugs Primary Therapeutic Metabolic + Anti-Fibrotic Drugs Interventions (based on Potent Anti-Fibrotic + Metabolic Primary
Objectives) Potent Anti-Fibrotic Drugs Based on data generated to date, we believe pegozafermin has two As a potent anti-fibrotic As a potent anti-fibrotic primary opportunities to be positioned in the NASH treatment paradigm: and anti-metabolic
39

Pegozafermin Offers a Highly Differentiated Profile Pegozafermin
differentiates on key attributes for an effective NASH drug * 1 EFFICACY: Potential best-in-category fibrosis data ; robust metabolic data; benefits on top of T2DM/obesity drugs 2 SAFETY AND TOLERABILITY: Potential best-in-class (FGF21) tolerability
profile with fewer GI events and no tremors 3 DOSING: Convenience of every-two-week injections (26 fewer annual injections) – strongly preferred by patients (~66%); physicians like the optionality offered with two dosing regimens (QW and Q2W)
FGF21 class could have multiple successful drugs • Best-in-category mechanisms have had multiple successful drug with the same MOA; e.g., 4 different GLP-1 RAs for T2DM each had sales > $1B in 2022 (two were the 4th and 5th entrants) NASH
commercialization considerations • Pegozafermin target audience in the US is estimated to be approximately 7,300 hepatology providers requiring a relatively modest sales force • Payers expected to support premium pricing for advanced
fibrosis and cirrhotic patients based on medical necessity and cost effectiveness models * If approved 40 Source: Primary research with US payers, October 2020

Opportunity in Severe Hypertriglyceridemia (SHTG)

Pegozafermin Could Offer an Important New Treatment Option for SHTG
Topline results expected in 2025 Large growing patient population with significant health risks; overlap with NASH patient population • Increasing TG levels increase risk of acute pancreatitis, cardiovascular disease and all-cause mortality
• Emerging evidence of the cardiovascular (CV) benefit associated with TG reduction in patients with CV risk factors Significant market opportunity for agent with broad metabolic benefits • Pegozafermin has a unique selling proposition
that is meaningful to prescribers – more effective triglyceride reduction with improvements in liver fat and other metabolic measures • Analyst consensus peak year sales estimated to be greater than $1 billion (US only) Clinical program
substantially de-risked • Phase 3 ENTRUST trial initiated; design similar to positive Phase 2 ENTRIGUE design with same primary endpoint • Agency alignment on trial design and regulatory path to approval SHTG program is synergistic with
the NASH program • Development: Leverages safety database across the two programs to minimize spend across total program • Commercial: Leverage sales force and infrastructure costs 42

– Phase 2 SHTG Trial Design KEY INCLUSION CRITERIA 8 Weeks•
TG ≥500mg/dL and ≤2,000mg/dL PLACEBO (n=18) • Background therapy: statins and/or prescription fish oil and/or fibrates OR none 9mg QW Pegozafermin (n=16) PRIMARY ENDPOINT 18mg QW Pegozafermin (n=17) • Primary endpoint: %
Change in TGs from baseline 27mg QW Pegozafermin (n=18) KEY SECONDARY ENDPOINTS • Lipids: non-HDL-C, HDL-C, Apo-B 36mg Q2W Pegozafermin (n=16) • Liver fat (MRI-PDFF) • Glycemic control Magnetic Resonance Imaging – Proton
Density Fat Fraction QW, once-weekly; Q2W, once every two weeks. Safety analysis set, n=85 (patients who received at least 1 dose) Full analysis set, n=82 (patients with at least 1 post-baseline TG assessment) MRI analysis set n=23 (patients with
baseline and end of treatment MRIs) 43 SCREENING RANDOMIZATION SAFETY FOLLOW-UP

Pegozafermin Significantly Reduces Triglycerides Across All Dose Groups
Median % Change in Triglycerides from Baseline at Week 8 QW Q2W Placebo 9mg 18mg 27mg 36mg -10% -12% Q1; Q3: [-23.22; 7.88] -30% * -36% Q1; Q3: [-62.39; -10.92] -50% *** *** -56% -57% Q1; Q3: [-67.60; -39.85] Q1; Q3: [-64.73; -40.37] *** -63% -70%
Q1; Q3: [-75.76; -40.03] QW: Every week; Q2W: Every 2 weeks p value vs placebo for change from baseline based on Wilcoxon Rank-Sum Test Full Analysis Set; * p<0.05; ** p<0.01; *** p<0.001 vs. placebo 44

Pegozafermin Shows Significant Decrease in Triglycerides on Top of
Background Therapy Median % Change in Triglycerides from Baseline at Week 8 Not On Background Therapy On Background Therapy QW Q2W QW Q2W Placebo 9mg 18mg 27mg 36mg Placebo 9mg 18mg 27mg 36mg n=6 n=8 n=8 n=6 n=8 n=11 n=8 n=9 n=10 n=8 5% 10% 10% -10%
-10% -18% -30% -30% -21% -50% -50% -45% -50% -56% -59% -59% -70% -70% -62% -68% Results are consistent with data from patients on background therapy of statins or statin combos, prescription fish oils, and fibrates Background therapy defined as
concomitant lipid-modifying therapy 45 Full Analysis Set

Pegozafermin Shows Significant Decrease in Triglycerides at Different
Threshold Levels TG Normalization TG Reduction ≥50% from baseline Responders (<500 mg/dL) (<150mg/dL, <200mg/dL) *** 60% 100% 80% 75% *** 80% 44% 80% 60% 40% * 60% 31% 40% 40% 29% 20% 20% 20% 6% <150 <200 0% mg/dL mg/dL 0% 0% 0%
Placebo PGZ Placebo PGZ PGZ Placebo PGZ Pooled 27mg QW 27mg QW 27mg QW Analysis via unstratified Chi-square Test comparing the individual PGZ groups vs placebo. * p<0.05; ** p<0.01; *** p<0.001 vs. placebo TG Responders defined as patients
who achieve TG <500 mg/dL Full Analysis Set 46

Pegozafermin Demonstrated Clinically Meaningful Improvements in
Non-HDL-C and Apo-B – Key Marker of CV Risk Mean % Change from Baseline at Week 8 Mean % Change from Baseline at Week 8 Non-HDL-C Apo-B Q2W QW Q2W QW Placebo 9mg 18mg 27mg 36mg Placebo 9mg 18mg 27mg 36mg Baseline (mg/dL): 218 216 203 202 215
Baseline (mg/dL): 114 120 115 118 106 -1% -1% -3% -9% -11% -15% -15% -14%* -14% -18%** ** -22% *** -29% -35% -35% Full Analysis Set; * p<0.05; ** p<0.01; *** p<0.001 vs. placebo based on MMRM analysis 47

Pegozafermin Demonstrated Significant Improvement on Key Co-
morbidities in SHTG – Liver Fat and Glycemic Control Mean Relative Reduction in Liver Fat vs Absolute Change in HbA1c at Week 8 Baseline at Week 8 Patients with Baseline HbA1c ≥6.5% Placebo PGZ pooled Placebo 27mg QW n=6 n=17 n=6 n=9 0%
0 -5% -0.1 -20% -0.2 -0.2 -0.3 -40% * -0.4 -43% -0.4 -60% p=0.012 -0.5 HIGH RESPONDER RATES ≥30% Reduction in liver fat: 88% vs 0% in placebo HbA1c: Mean Baseline 27 mg QW: 7.48%; Week 8: 7.08% Post-hoc analysis of patients with follow-up
MRI-PDFF ≤21 days from date of last dose in 27mg QW cohort demonstrated a 63% mean relative reduction from baseline *p <0.05 vs. placebo 48 MRI Analysis Set; p value vs placebo based on ANCOVA analysis

Pegozafermin Demonstrated Favorable Safety/Tolerability Profile in
Phase 2 Study • Pooled pegozafermin treatment related Adverse Events (AEs) observed in ≥7.5% of patients were: – Nausea (10%), diarrhea (9%) and injection site reaction (9%) vs placebo (0%) – All Gastrointestinal (GI) AEs
were Grade 1 or 2 • No Grade 3 or higher AEs • No treatment-related SAEs; 2 treatment-related discontinuations at 27mg QW (both Grade 2) • No tremor or hypersensitivity AEs reported • No adverse effects on blood pressure or
heart rate 49

Phase 3 ENTRUST Trial Design KEY INCLUSION CRITERIA • TG
≥500mg/dL and 52 WEEKS ≤2,000mg/dL • Stable background lipid Placebo QW (n=90) modifying therapy* PRIMARY ENDPOINT Pegozafermin 20mg QW (n=135) • Percent change from baseline in fasting TGs at Week 26 vs. Pegozafermin 30mg QW
(n=135) placebo KEY SECONDARY ENDPOINTS • Liver fat by MRI-PDFF, Various Week 26 Week 52 lipids, HbA1c at Week 26 vs. placebo, TGs at Week 52 vs. Primary analysis placebo EOT (End of treatment) *Not all patients may be on background lipid
modifying therapy 50 SCREENING RANDOMIZATION SAFETY FOLLOW-UP

SHTG Represents a Large Population with High Unmet Need Prevalence in
US PREVALENCE Co-morbidity SHTG UP TO 4 MILLION population Fatty Liver Disease Up to 100% (NAFLD) DIAGNOSED ~2.8 MILLION Type 2 Up to 70% diabetes/Prediabetes Dyslipidemia Up to 65% UN-TREATED DRUG TREATED ~1.1 MILLION ~1.7 MILLION Pegozafermin
profile is unique and compelling to physicians CONTROLLED POORLY MANAGED because of potential for metabolic benefits ~900K ~800K PEGOZAFERMIN TARGET POPULATION 51
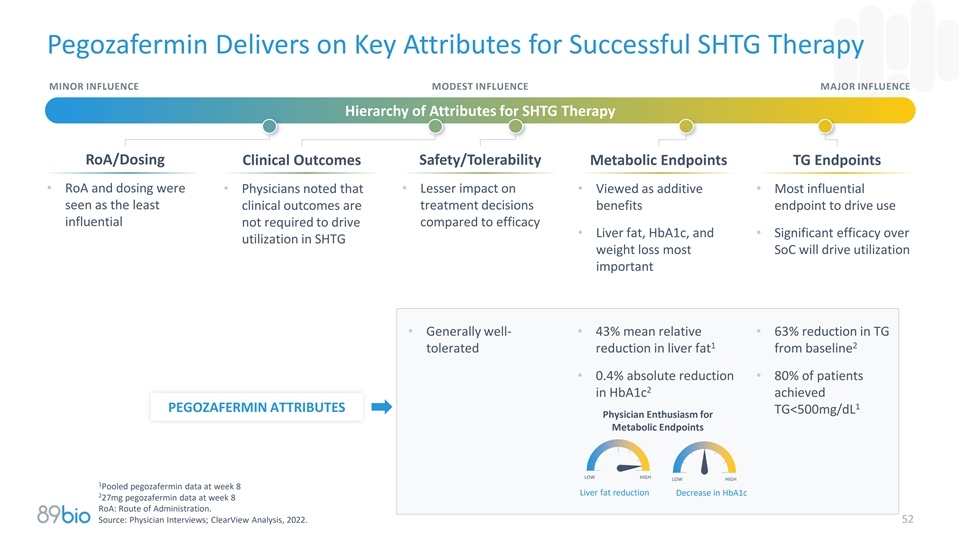
Pegozafermin Delivers on Key Attributes for Successful SHTG Therapy
MINOR INFLUENCE MODEST INFLUENCE MAJOR INFLUENCE Hierarchy of Attributes for SHTG Therapy RoA/Dosing Clinical Outcomes Safety/Tolerability Metabolic Endpoints TG Endpoints • RoA and dosing were • Physicians noted that • Lesser
impact on • Viewed as additive • Most influential seen as the least treatment decisions clinical outcomes are benefits endpoint to drive use influential not required to drive compared to efficacy • Liver fat, HbA1c, and •
Significant efficacy over utilization in SHTG weight loss most SoC will drive utilization important • Generally well-• 43% mean relative • 63% reduction in TG 1 2 tolerated reduction in liver fat from baseline • 0.4% absolute
reduction • 80% of patients 2 in HbA1c achieved 1 PEGOZAFERMIN ATTRIBUTES TG<500mg/dL Physician Enthusiasm for Metabolic Endpoints LOW HIGH LOW HIGH 1 Pooled pegozafermin data at week 8 Liver fat reduction Decrease in HbA1c 2 27mg
pegozafermin data at week 8 RoA: Route of Administration. Source: Physician Interviews; ClearView Analysis, 2022. 52
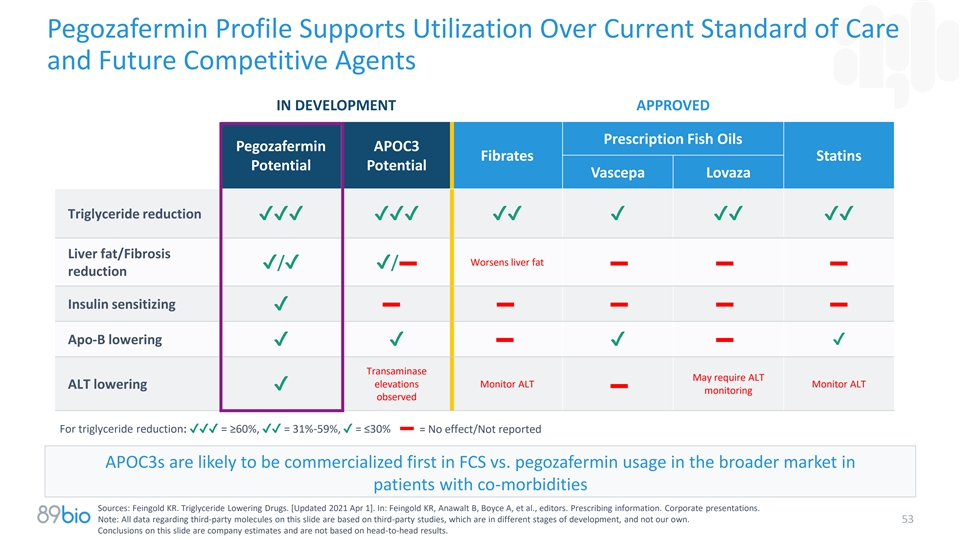
Pegozafermin Profile Supports Utilization Over Current Standard of Care
and Future Competitive Agents IN DEVELOPMENT APPROVED Prescription Fish Oils Pegozafermin APOC3 Fibrates Statins Potential Potential Vascepa Lovaza Triglyceride reduction
✔✔✔✔✔✔✔✔✔✔✔✔✔ Liver fat/Fibrosis Worsens liver fat ✔/✔✔/ reduction Insulin sensitizing ✔ Apo-B lowering
✔✔✔✔ Transaminase May require ALT elevations Monitor ALT Monitor ALT ALT lowering ✔ monitoring observed For triglyceride reduction: ✔✔✔ = ≥60%,✔✔ = 31%-59%, ✔ =
≤30% = No effect/Not reported APOC3s are likely to be commercialized first in FCS vs. pegozafermin usage in the broader market in patients with co-morbidities Sources: Feingold KR. Triglyceride Lowering Drugs. [Updated 2021 Apr 1]. In:
Feingold KR, Anawalt B, Boyce A, et al., editors. Prescribing information. Corporate presentations. Note: All data regarding third-party molecules on this slide are based on third-party studies, which are in different stages of development, and not
our own. 53 Conclusions on this slide are company estimates and are not based on head-to-head results.

Corporate Highlights Potential Best-in-Class FGF21 in Two Phase 3
programs, each of which * represents a significant market opportunity Nonalcoholic Steatohepatitis (NASH) Program 1 • Strongest fibrosis data in category with favorable tolerability and dosing convenience • First FGF21 with positive 48
wk data; additive benefits in patients on background GLP-1 therapy • Regulatory alignment on Phase 3 program including potentially accelerated approval using histology in pre-cirrhotic (F2-F3) and cirrhotic (F4) patients; trials expected to
initiate in 1H24 Severe Hypertriglyceridemia (SHTG) Program • Substantially de-risked Phase 3 with topline data anticipated in 2025 3 Strong balance sheet with $448 million in cash Intended commercial product presentation available;
composition of 2 matter patent expires in 2038 Highly experienced leadership team with track record of execution 1 Efficacy comparison based on relative risk ratios and not based on head-to-head results 2 Patent expiration date excludes any patent
term extension or new patents 3 Cash, cash equivalents and short-term investments as of September 30, 2023; excludes in-the-money warrants of approximately $50 million that expire on June 30, 2024 54 * If approved

Appendix

Experienced Management Team Positions 89bio for Success Rohan Palekar
Hank Mansbach, MD Ryan Martins Quoc Le-Nguyen CEO CMO CFO CTO & Head of Quality CEO, CCO experience 20+ years biopharma and CFO, Strategy/IR, 20+ years biopharma and R&D leadership in clinical finance, sell-side leadership in technical
Commercial, strategy, development and medical experience operations, product supply, and R&D experience affairs and quality 56

Pegozafermin Exhibits Highly Potent FGF Receptor Agonism FGFR2 FGFR3
FGFR4 FGFR1 2000 3000 BIO89-100 BIO89-100 BIO89-100 BIO89-100 2600 5500 FGF21 FGF21 1800 FGF21 FGF21 2600 2200 4500 1600 2200 1400 1800 3500 1800 1200 1400 2500 1400 1000 1000 1500 800 1000 600 600 500 600 0.0001 0.1 100 0.0001 0.1 100 0.0001 0.1
100 0.0001 0.1 100 Concentration (nM) Concentration (nM) Concentration (nM) Concentration (nM) FGF21 Pegozafermin EC (nM) EC (nM) 50 50 RECEPTOR Mean ± S.D. Mean ± S.D. KLB nd nd Pegozafermin has the potential to reproduce KLB/FGFR1 4.5
± 1.0 0.3 ± 0.07 the beneficial metabolic effects of native FGF21 KLB/FGFR2 4.5 ± 0.9 1.1 ± 0.4 KLB/FGFR3 1.8 ± 0.3 1.2 ± 0.4 KLB/FGFR4 nd nd nd – not determined; rhFGF19 EC at FGFR4 = 1.7 ± 0.4 50 * Receptor
agonism measured in L6 cells expressing β-klotho and either FGF Receptor 1c, 2c, 3c, or 4 via pERK functional assay ** Figures represent data from a single experiment; Table represents mean data from multiple experiments 57 pERK pERK pERK
pERK

ENLIVEN Used Objective Biopsy Reading Methodology Designed to Reduce
Histology Scoring Biases and Variability ALL BIOPSIES SCORED INDEPENDENTLY • Pathologists underwent AND SEPARATELY protocol-specific harmonization training Pathologist Pathologist Pathologist before and during trial #1 #2 #3 •
Pathologists were blinded to patient, treatment and sequence Score recorded 3 of 3 agree on score (full agreement) 40-50% • >99% of final scores determined by a priori Score recorded 2 of 3 agree on score (mode) 40-50% established
algorithm, versus resolving disagreements via inter- reader discussion Score recorded Median or consensus phone call < 5% 58

Learnings from the Obeticholic Acid NASH Phase 3 Program: Comparison of
Single Central Reader vs. 3-Panel Consensus Improvement of Fibrosis by ≥ 1 Stage without Worsening NASH Resolution of NASH with No Worsening of Liver Fibrosis OBSERVATIONS: • Placebo response for NASH resolution is >2 fold higher with
single reader vs 3-panel consensus • Placebo response similar to ENLIVEN study for both fibrosis improvement and for NASH resolution IMPLICATIONS: • 3-panel consensus highlights treatment delta but dampens absolute response •
3-panel consensus methodology can reproduce low placebo response in phase 3 trial REGENERATE re-analysis topline, July 2022. 59

Pre-Specified ITT Analysis Confirms Robustness of Primary Efficacy
Results ITT (missing data = non-responder); (n=192) at Week 24 30mg QW 44mg Q2W Fibrosis improvement without worsening of NASH Effect Size (placebo-adjusted) 15% 16% p-value 0.019 0.015 NASH resolution without worsening of fibrosis Effect Size
(placebo-adjusted) 17% 20% p-value 0.0019 0.0009 60 Source: FAS

Pegozafermin Showed Consistent and Significant Benefit in Achieving
Fibrosis Improvement Across Prespecified Subgroups Pegozafermin 30mg QW Pegozafermin 44mg Q2W Proportion Achieving Fibrosis Improvement Proportion Achieving Fibrosis Improvement BL T2DM: Yes BL T2DM: Yes BL T2DM: No BL T2DM: No BL Fibrosis stage: F2
BL Fibrosis stage: F2 BL Fibrosis stage: F3 BL Fibrosis stage: F3 BL MRI-PDFF: <Median (16%) BL MRI-PDFF: <Median… BL MRI-PDFF: ≥Median (16%) BL MRI-PDFF: ≥Median… BL ALT: Normal BL ALT: Normal BL ALT: >ULN BL ALT:
>ULN BL NAS score: <Median (5) BL NAS score: <Median (5) BL NAS score: ≥Median (5) BL NAS score: ≥Median (5) -10 0 10 20 30 40 50 -10 0 10 20 30 40 50 60 FAVORS PLACEBO FAVORS PEGOZAFERMIN FAVORS PLACEBO FAVORS PEGOZAFERMIN Est.
proportion difference (95% CI) Est. proportion difference (95% CI) Source: Full Analysis Set 61 ALT, alanine aminotransferase; BL, baseline; MRI-PDFF, magnetic resonance imaging proton density fat fraction; NAS, Nonalcoholic fatty liver disease
Activity Score; NASH, nonalcoholic steatohepatitis; Q2W, every 2 weeks; QW, once weekly; T2DM, type 2 diabetes mellitus; ULN, upper limit of normal.

Metabolic Data: Benefits Maintained Over Time Change From Baseline at
Week 24 and Week 48 Placebo Placebo 30mg QW 30mg QW 44mg Q2W 44mg Q2W Week 24 Week 48 Week 24 Week 48 Week 24 Week 48 (n=42) (n=35) (n=66) (n=50) (n=51) (n=45) HbA1c -0.2 -0.5 -0.6 -0.7 -0.5 -0.4 Triglycerides -3% -5% -27% -21% -10% -5% LDL-C 0% -3%
-3% -8% -5% -18% Full Analysis Set; preliminary data HbA1c LS mean change from baseline; TG and LDL-C median CFB HbA1c in patients with T2DM and baseline >7.0% 62

Pegozafermin Demonstrated Meaningful Reductions in HbA1c (ENLIVEN)
Change in HbA1c from Baseline at Week 24 Total Population Baseline HbA1c ≥6.5% Placebo 30mg QW 44mg Q2W Placebo 30mg QW 44mg Q2W n=61 n=66 n=51 n=31 n=32 n=25 0.0 0.0 0.0 0.0 -0.1 -0.1 -0.2 -0.2 -0.3 -0.2 -0.4 -0.3 -0.4 * -0.5 -0.3 ** -0.5
-0.4 -0.6 Source: Full Analysis Set for either overall population or FAS with baseline HbA1c ≥6.5%. Analysis via MMRM. 63 *p<0.05, **p<0.01 versus placebo.

Pegozafermin Demonstrated Meaningful Changes in Serum Lipids (ENLIVEN)
Percent Change in Serum Lipids from Baseline at Week 24 Triglycerides Non-HDL Cholesterol HDL Cholesterol 0% 0% 0% 20% *** 14% -6% -10% 10% * -10% 6% -20% 0% -7% -7% -3% *** -27% -30% -10% -10% Placebo 30mg QW 44mg Q2W Placebo 30mg QW 44mg Q2W
Placebo 30mg QW 44mg Q2W n=61 n=66 n=51 n=61 n=66 n=51 n=61 n=66 n=51 Source: Full Analysis Set. Analysis via van Eltren Test for triglycerides (reported as median) and mixed model with repeated measure (MMRM). Patients with missing week 24
triglycerides are excluded from the non-parametric analysis. 64 Non-HDL-cholesterol and HDL Cholesterol (reported as LS means) with changes from baseline (absolute or %) as dependent variables. *p<0.05, ***p<0.001 versus placebo.

Data from Cohort 7 Support Pegozafermin’s Impact in F4 Patients
Histology data - Fibrosis improvement ≥ 1 stage without worsening of NASH ranged from 17% to 57% Parameter PGZ Treated Patients (n=6) Liver Fibrosis VCTE (kPa) -3.8 FAST (%) -78.5% Pro-C3 (%) -25.5% Liver Injury ALT (%) -50.7% AST (%) -48.7%
Data presented as means for Cohort 7 F4 patients Safety and tolerability were similar to what has been observed in the non-cirrhotic patient population 65

Comparative Profile of FGF21 Analogs in NASH –
Safety/Tolerability Pegozafermin (PGZ) Efruxifermin (EFX) 30mg QW 44mg Q2W 28mg 50mg Tolerability and safety (key terms) Diarrhea 17% 9% 35% 33% Nausea 21% 18% 25% 33% Frequent bowel - - 20% - Increased appetite 13% 5% 18% 23% Injection site
erythema 14% 5% 15% 16% Injection site bruising - - 15% 7% 66 Note: All data regarding third-party molecules on this slide are based on third-party studies and not our own. Conclusions on this slide are not based on head-to-head results

Comparative Profile of FGF21 Analogs - Histology and Liver Markers
Pegozafermin (PGZ) Efruxifermin (EFX) 30mg QW 44mg Q2W 28mg 50mg • GlycoPEGylated FGF21 (40 kDa) Structure (molecular weight) Fc-fusion FGF21 (92 kDa) • Structurally different from other monovalent analogs 1 Potency against FGF receptors
(EC50) PGZ (rFGF21) EFX (rFGF21) 1c/2c/3c 0.3 (4.5)/1.1 (4.5)/1.2 (1.8) 0.3 (0.08)/0.7 (0.4)/1.9 (1.0) Efficacy (histology) • Rigorous biopsy reading 3 separate independent Methods 2 independent readers with consensus based on discussion
reader (no bias); algorithm derived score (no adjudication required) • 95% + alignment based on 2+ reader agreement Fibrosis 1-point improvement Placebo adjusted percent 19% 20% 19% 20% Relative risk 3.5 3.6 2.0 2.0 NASH Resolution Placebo
adjusted percent 21% 26% 32% 61% Relative risk 11.8 13.5 3.1 5.1 Key liver non-invasive markers 2 Liver fat change baseline -52% -54% -52% -64% VCTE kPa (chg baseline, placebo -3.7 -3.1 -1.9 -3.6 adjusted) * * ProC3 (chg baseline, placebo adjusted)
-25% -24% -28% -33% ALT -42% -32% -38% -47% 1 LG cells overexpressing β-klotho and either FGF receptor 1c, 2c, 3c via PERK functional assay. PGZ data is based on MRI-PDFF Analysis Set in patients with >10% liver fat at baseline 67 Note: All
data regarding third-party molecules on this slide are based on third-party studies and not our own. Conclusions on this slide are not based on head-to-head results *Calculated values

Over 60% of T2D Patients Prefer or Strongly Prefer Every-Two-Week
Injections Preference of Every-Two-Week Injections Over Weekly Injections 100% 26.7% • Every-two-week dosing provides opportunity 63% 75% Prefer or for physicians to optimize therapy to patient preference Strongly 36.7% Prefer 50% •
Compliance is important in treatment for chronic, asymptomatic diseases 18.7% 25% 10.0% 8.0% 0% No Preference Minimal Preference Moderate Preference Preferred 68 Source: primary market research with 150 people with type 2 diabetes, 2019.
v3.23.3
| X |
- DefinitionBoolean flag that is true when the XBRL content amends previously-filed or accepted submission.
| Name: |
dei_AmendmentFlag |
| Namespace Prefix: |
dei_ |
| Data Type: |
xbrli:booleanItemType |
| Balance Type: |
na |
| Period Type: |
duration |
|
| X |
- DefinitionFor the EDGAR submission types of Form 8-K: the date of the report, the date of the earliest event reported; for the EDGAR submission types of Form N-1A: the filing date; for all other submission types: the end of the reporting or transition period. The format of the date is YYYY-MM-DD.
| Name: |
dei_DocumentPeriodEndDate |
| Namespace Prefix: |
dei_ |
| Data Type: |
xbrli:dateItemType |
| Balance Type: |
na |
| Period Type: |
duration |
|
| X |
- DefinitionThe type of document being provided (such as 10-K, 10-Q, 485BPOS, etc). The document type is limited to the same value as the supporting SEC submission type, or the word 'Other'.
| Name: |
dei_DocumentType |
| Namespace Prefix: |
dei_ |
| Data Type: |
dei:submissionTypeItemType |
| Balance Type: |
na |
| Period Type: |
duration |
|
| X |
- DefinitionAddress Line 1 such as Attn, Building Name, Street Name
| Name: |
dei_EntityAddressAddressLine1 |
| Namespace Prefix: |
dei_ |
| Data Type: |
xbrli:normalizedStringItemType |
| Balance Type: |
na |
| Period Type: |
duration |
|
| X |
- DefinitionAddress Line 2 such as Street or Suite number
| Name: |
dei_EntityAddressAddressLine2 |
| Namespace Prefix: |
dei_ |
| Data Type: |
xbrli:normalizedStringItemType |
| Balance Type: |
na |
| Period Type: |
duration |
|
| X |
- Definition
+ References
+ Details
| Name: |
dei_EntityAddressCityOrTown |
| Namespace Prefix: |
dei_ |
| Data Type: |
xbrli:normalizedStringItemType |
| Balance Type: |
na |
| Period Type: |
duration |
|
| X |
- DefinitionCode for the postal or zip code
| Name: |
dei_EntityAddressPostalZipCode |
| Namespace Prefix: |
dei_ |
| Data Type: |
xbrli:normalizedStringItemType |
| Balance Type: |
na |
| Period Type: |
duration |
|
| X |
- DefinitionName of the state or province.
| Name: |
dei_EntityAddressStateOrProvince |
| Namespace Prefix: |
dei_ |
| Data Type: |
dei:stateOrProvinceItemType |
| Balance Type: |
na |
| Period Type: |
duration |
|
| X |
- DefinitionA unique 10-digit SEC-issued value to identify entities that have filed disclosures with the SEC. It is commonly abbreviated as CIK. Reference 1: http://www.xbrl.org/2003/role/presentationRef
-Publisher SEC
-Name Exchange Act
-Number 240
-Section 12
-Subsection b-2
| Name: |
dei_EntityCentralIndexKey |
| Namespace Prefix: |
dei_ |
| Data Type: |
dei:centralIndexKeyItemType |
| Balance Type: |
na |
| Period Type: |
duration |
|
| X |
- DefinitionIndicate if registrant meets the emerging growth company criteria. Reference 1: http://www.xbrl.org/2003/role/presentationRef
-Publisher SEC
-Name Exchange Act
-Number 240
-Section 12
-Subsection b-2
| Name: |
dei_EntityEmergingGrowthCompany |
| Namespace Prefix: |
dei_ |
| Data Type: |
xbrli:booleanItemType |
| Balance Type: |
na |
| Period Type: |
duration |
|
| X |
- DefinitionCommission file number. The field allows up to 17 characters. The prefix may contain 1-3 digits, the sequence number may contain 1-8 digits, the optional suffix may contain 1-4 characters, and the fields are separated with a hyphen.
| Name: |
dei_EntityFileNumber |
| Namespace Prefix: |
dei_ |
| Data Type: |
dei:fileNumberItemType |
| Balance Type: |
na |
| Period Type: |
duration |
|
| X |
- DefinitionTwo-character EDGAR code representing the state or country of incorporation.
| Name: |
dei_EntityIncorporationStateCountryCode |
| Namespace Prefix: |
dei_ |
| Data Type: |
dei:edgarStateCountryItemType |
| Balance Type: |
na |
| Period Type: |
duration |
|
| X |
- DefinitionThe exact name of the entity filing the report as specified in its charter, which is required by forms filed with the SEC. Reference 1: http://www.xbrl.org/2003/role/presentationRef
-Publisher SEC
-Name Exchange Act
-Number 240
-Section 12
-Subsection b-2
| Name: |
dei_EntityRegistrantName |
| Namespace Prefix: |
dei_ |
| Data Type: |
xbrli:normalizedStringItemType |
| Balance Type: |
na |
| Period Type: |
duration |
|
| X |
- DefinitionThe Tax Identification Number (TIN), also known as an Employer Identification Number (EIN), is a unique 9-digit value assigned by the IRS. Reference 1: http://www.xbrl.org/2003/role/presentationRef
-Publisher SEC
-Name Exchange Act
-Number 240
-Section 12
-Subsection b-2
| Name: |
dei_EntityTaxIdentificationNumber |
| Namespace Prefix: |
dei_ |
| Data Type: |
dei:employerIdItemType |
| Balance Type: |
na |
| Period Type: |
duration |
|
| X |
- DefinitionLocal phone number for entity.
| Name: |
dei_LocalPhoneNumber |
| Namespace Prefix: |
dei_ |
| Data Type: |
xbrli:normalizedStringItemType |
| Balance Type: |
na |
| Period Type: |
duration |
|
| X |
- DefinitionBoolean flag that is true when the Form 8-K filing is intended to satisfy the filing obligation of the registrant as pre-commencement communications pursuant to Rule 13e-4(c) under the Exchange Act. Reference 1: http://www.xbrl.org/2003/role/presentationRef
-Publisher SEC
-Name Exchange Act
-Number 240
-Section 13e
-Subsection 4c
| Name: |
dei_PreCommencementIssuerTenderOffer |
| Namespace Prefix: |
dei_ |
| Data Type: |
xbrli:booleanItemType |
| Balance Type: |
na |
| Period Type: |
duration |
|
| X |
- DefinitionBoolean flag that is true when the Form 8-K filing is intended to satisfy the filing obligation of the registrant as pre-commencement communications pursuant to Rule 14d-2(b) under the Exchange Act. Reference 1: http://www.xbrl.org/2003/role/presentationRef
-Publisher SEC
-Name Exchange Act
-Number 240
-Section 14d
-Subsection 2b
| Name: |
dei_PreCommencementTenderOffer |
| Namespace Prefix: |
dei_ |
| Data Type: |
xbrli:booleanItemType |
| Balance Type: |
na |
| Period Type: |
duration |
|
| X |
- DefinitionTitle of a 12(b) registered security. Reference 1: http://www.xbrl.org/2003/role/presentationRef
-Publisher SEC
-Name Exchange Act
-Number 240
-Section 12
-Subsection b
| Name: |
dei_Security12bTitle |
| Namespace Prefix: |
dei_ |
| Data Type: |
dei:securityTitleItemType |
| Balance Type: |
na |
| Period Type: |
duration |
|
| X |
- DefinitionName of the Exchange on which a security is registered. Reference 1: http://www.xbrl.org/2003/role/presentationRef
-Publisher SEC
-Name Exchange Act
-Number 240
-Section 12
-Subsection d1-1
| Name: |
dei_SecurityExchangeName |
| Namespace Prefix: |
dei_ |
| Data Type: |
dei:edgarExchangeCodeItemType |
| Balance Type: |
na |
| Period Type: |
duration |
|
| X |
- DefinitionBoolean flag that is true when the Form 8-K filing is intended to satisfy the filing obligation of the registrant as soliciting material pursuant to Rule 14a-12 under the Exchange Act. Reference 1: http://www.xbrl.org/2003/role/presentationRef
-Publisher SEC
-Name Exchange Act
-Section 14a
-Number 240
-Subsection 12
| Name: |
dei_SolicitingMaterial |
| Namespace Prefix: |
dei_ |
| Data Type: |
xbrli:booleanItemType |
| Balance Type: |
na |
| Period Type: |
duration |
|
| X |
- DefinitionTrading symbol of an instrument as listed on an exchange.
| Name: |
dei_TradingSymbol |
| Namespace Prefix: |
dei_ |
| Data Type: |
dei:tradingSymbolItemType |
| Balance Type: |
na |
| Period Type: |
duration |
|
| X |
- DefinitionBoolean flag that is true when the Form 8-K filing is intended to satisfy the filing obligation of the registrant as written communications pursuant to Rule 425 under the Securities Act. Reference 1: http://www.xbrl.org/2003/role/presentationRef
-Publisher SEC
-Name Securities Act
-Number 230
-Section 425
| Name: |
dei_WrittenCommunications |
| Namespace Prefix: |
dei_ |
| Data Type: |
xbrli:booleanItemType |
| Balance Type: |
na |
| Period Type: |
duration |
|
89bio (NASDAQ:ETNB)
Historical Stock Chart
From Apr 2024 to May 2024

89bio (NASDAQ:ETNB)
Historical Stock Chart
From May 2023 to May 2024
