Goldman Sachs Reports Higher Earnings
April 17 2018 - 8:12AM
Dow Jones News
By Liz Hoffman
Goldman Sachs Group Inc. reported higher profit and revenue from
a year ago, catching the wave of lower taxes and newly active
markets that boosted other big banks' quarterly earnings.
Revenue at the Wall Street firm rose to $10.04 billion from
$8.03 billion a year ago. Goldman's profit was $2.83 billion, or
$6.95 a share, up from the year-ago first quarter when the bank's
traders made bad bets on the dollar and interest rates.
Analysts, on average, were expecting earnings of $2.21 billion,
or $5.58 a share, on revenue of $8.74 billion, according to Thomson
Reuters.
For all of Goldman's changes in recent years -- launching a
consumer bank and embracing steadier businesses like asset
management and corporate lending -- it still relies heavily on its
traders, who make money selling everything from stocks to
interest-rate swaps to big investors. They account for about
one-third of the firm's revenue.
That business was expected to benefit this quarter as volatility
returned to the markets. The dollar fell, and interest rates rose.
Stocks swung around amid fears of a trade war and as the tumult at
Facebook Inc. weighed on shares of technology companies.
But the trading seen early in the quarter, which was active but
followed familiar patterns, devolved into more troublesome chaos
for the banks in its later weeks.
Indeed, JPMorgan Chase & Co., Citigroup Inc. and Bank of
America Corp. in recent days reported mixed trading results, doing
better in equities but disappointing in areas like bond and credit
trading.
Goldman's return on equity, a measure of how profitably it
invests shareholders' money, was 15.4% for the quarter. Goldman has
been pouring money into its new consumer bank and hiring senior
executives in its investment-banking and technology divisions,
which weighs on profitability.
Shares of Goldman Sachs, up 1.2% in 2018, slid 0.5% to $256.69
in premarket trading.
Write to Liz Hoffman at liz.hoffman@wsj.com
(END) Dow Jones Newswires
April 17, 2018 07:57 ET (11:57 GMT)
Copyright (c) 2018 Dow Jones & Company, Inc.
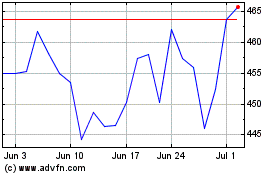
Goldman Sachs (NYSE:GS)
Historical Stock Chart
From Mar 2024 to Apr 2024

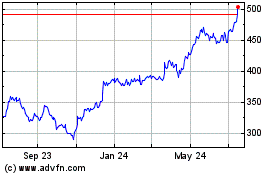
Goldman Sachs (NYSE:GS)
Historical Stock Chart
From Apr 2023 to Apr 2024
