Below, I show the AcelRx (NASDAQ: ACRX) charts and give some commentary why I believe it will hit $12 soon.
- Chart 1
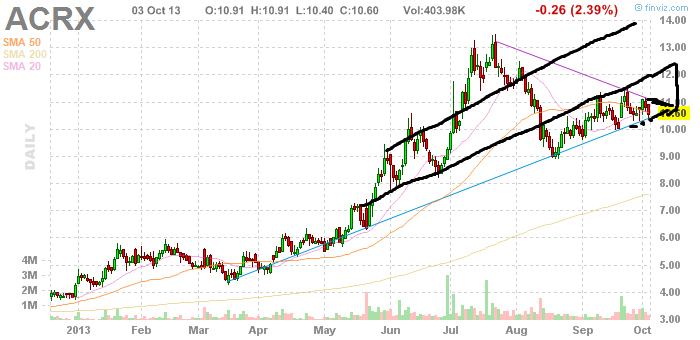
We can see a tight bullish wedge forming above, where the 50 day and 20 day moving averages have converged. The end of the black box, or second black line is where it appears the stock is headed to soon, representing the $12 level. 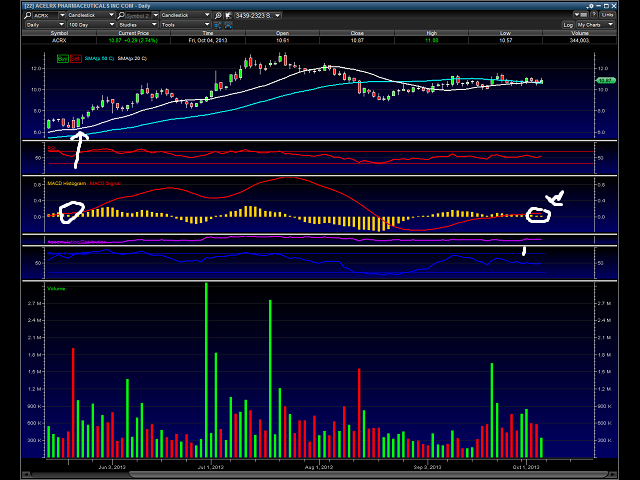
I have drawn in where the current price is, a white circle above, where the MACD signal is crossing above the yellow histogram. The closest past pattern representation is marked with the same white circle, and we can see the stock went up signficantly at that time.
With the buyout buzz associated with this stock and the likeliness of a euro partner soon. I feel the stock will break over $14 within 3 months/ AcelRx is de risked with an already submitted NDA, I expect to hear an FDA acceptance of this NDA within 40 days from now. Again. it’s also possible the company will be bought out before then. Almost always, the chart will tell the story of what could be going on “behind the scenes” so to speak. Wise traders and investors pay close attention to chart technicals, as there is a lot of “noise” out there which should be ignored. These chart technicals help us weed through the noise to determine buy and sell points of a stock and its channel. My price target opinion on ACRX is somewhere around $12 within the next week, and $14 before the end of this year.