Goldman Tops Estimate, Revenue Down - Analyst Blog
July 17 2012 - 5:27AM
Zacks
The Goldman Sachs Group Inc. (GS) reported its
second-quarter 2012 earnings per share of $1.78, significantly
surpassing the Zacks Consensus Estimate of $1.14. Amid the
deteriorating global markets and European debt crisis, the results
were driven by Goldman’s prudent expense management. Yet lower
client activity levels acted as a headwind for the quarter.
However, the reported earnings lagged the prior-year quarter’s
earnings by 7 cents. Moreover, results declined substantially from
$3.92 per share recorded in the prior quarter.
Net income applicable to common shareholders in the quarter was
$927 million, down from $2.1 billion in the prior quarter and $1.1
billion recorded in the prior-year quarter.
Performance in Detail
Total revenue of Goldman decreased 9% from the prior-year quarter
to $6.6 billion, resulting from a decrease in overall businesses,
partially offset by higher incentive fees. Moreover, a fall in
global equity prices and higher volatility levels during the
quarter were the negatives. Revenue also missed the Zacks Consensus
Estimate of $6.8 billion.
Quarterly revenue, as per business segments, is as follows:
Investment Banking division generated
revenues of $1.2 billion, down 17% year over year. Results
reflected lower-than-expected revenues from equity underwriting
along with a decrease in revenues from the financial advisory
business. However, higher revenues in debt underwriting partially
offset the decline.
Investing and Lending division booked
revenues of $203 million in the quarter, plummeting 81% year over
year. Results principally reflected a loss of $194 million from
Goldman’s investment in the ordinary shares of Industrial and
Commercial Bank of China Limited (ICBC), coupled with net losses of
$112 million from other investments in equity securities.
However, the segment recorded net interest income and net gains
of $222 million from debt securities and loans and other net
revenues of $287 million.
Institutional Client Services division
recorded revenues of $3.9 billion, jumping 11% year over year.
Results improved due to outstanding performance in Fixed Income,
Currency and Commodities (FICC), marked by increased net revenues
in mortgages and commodities.
However, a fall in equity trading revenues (down 12% year over
year) due to lower commissions and fees and reduced net revenues in
equities client execution, added to the decline.
Investment Management division generated
revenues of $1.3 billion, up 5% year over year. The year-over-year
rise mainly reflected higher incentive fees, partly offset by
decreased transaction revenues and management and other fees.
In the second quarter of 2012, operating expenses descended 8% to
$5.2 billion compared with the prior-year quarter. Moreover, lower
compensation and benefits added fuel to the fire.
Non-compensation expenses were $2.3 billion in the quarter, down 7%
year over year. Expenses decreased largely due to lower levels of
business activity and the benefits of continued expense reduction
initiatives.
These positives were partially offset by higher impairment
charges associated with consolidated investment entities during the
quarter. Additionally, results included net provisions of $67
million for regulatory proceedings.
Evaluation of Capital
As of June 30, 2012, Goldman’s Tier 1 capital ratio under Basel I
was 15%, up from 14.7% in the prior quarter. Tier 1 common ratio
under Basel I was 13.1%, improving from 12.9% in the prior
quarter.
Return on common shareholders’ equity, on an annualized basis, was
5.4%. Goldman’s book value per share and tangible book value per
share surged to $137.00 and $126.12 from $134.48 and $123.94
respectively, at the end of the prior quarter.
Assets under management (AUM) climbed to $836 billion in the
quarter compared with $824 billion in the prior quarter, with $4
billion of net market depreciation and $16 billion of net
inflows.
Share Repurchase and Dividend Update
During second quarter 2012, Goldman repurchased 14.3 million shares
of its common stock at an average price per share of $104.81 and a
total cost of $1.5 billion. Remaining share authorization under
Goldman’s existing repurchase program stands at 46 million
shares.
Concurrent with the earnings release, Goldman declared its
quarterly dividend of 46 cents per share. The dividend will be paid
on September 27, 2012 to common shareholders of record as of August
30, 2012.
Performance by Peers
Citigroup Inc. (C), one of Goldman’s peers, after
reporting a mixed bag in the prior quarter, reported somewhat
encouraging second quarter 2012 results. Earnings per share came in
at 95 cents for the quarter, comfortably surpassing the Zacks
Consensus Estimate of 88 cents on lower loan loss provisions,
higher transaction services revenues and a drop in expenses.
Another peer, JPMorgan Chase & Co. (JPM),
proved pessimists wrong second quarter earnings per share of $1.21,
way ahead of the Zacks Consensus Estimate of 78 cents. However,
this compares unfavorably with $1.27 earned in the prior-year
quarter.
Most importantly, due to an imprudent hedging strategy, the company
incurred a derivative trading loss of $4.4 billion (before taxes)
in its chief investment office (CIO) for the period, exhibiting a
two-fold increase from what was disclosed on May 10.
One of the company’s strongest peers, Morgan
Stanley (MS), will be releasing its second quarter 2012
earnings on July 19, 2012.
Recent Divestiture
Concurrent with the earnings release, Goldman divested Goldman
Sachs Administration Services (GSAS), a leading hedge fund
administrator to State Street Corporation (STT).
The cash deal is valued at $550 million, subject to certain
adjustments.
The agreement awaits regulatory approvals and other customary
conditions. Moreover, the deal is anticipated to close early in the
fourth quarter of 2012.
Our Viewpoint
Overall, the results of Goldman declined compared to the prior
period, mainly driven by market turmoil. Although the company has
reported profits and decreased operating expenses, lower top-line
remains a matter of concern. Moreover, regulatory issues, including
lawsuits and the fundamental pressures on the banking sector, are
expected to dent the financials of the company in the upcoming
quarters.
However, we expect Goldman to benefit from its well-managed global
franchise, strong capital base, and industry leading position in
trading and asset management in the near future.
In Conclusion
During the quarter, Goldman completed the purchase of Ariel
Reinsurance’s Bermuda-based insurance and reinsurance operations
from Ariel Holdings Ltd. Goldman will combine the acquired business
with its existing Lloyd’s business. The acquisition will expand
Goldman’s property and casualty coverage.
Through acquisitions and global expansions, Goldman is trying to
capitalize on every opportunity to leverage its strong reputation
in the corporate trust market.
An investor with an appetite to absorb risks related to the market
volatility should not be disappointed with an investment in Goldman
over the long haul. Goldman’s fundamentals remain highly promising
with a diverse business model and a strong balance sheet.
From the risk perspective as well, it is assured that the company
would be able to withstand another financial crisis as Goldman
cleared the severest stress test.
Moreover, one can consider Goldman to be a value investment due to
its steady dividend-yielding nature. Concurrent with the earnings
release, the company also declared the quarterly dividend,
instilling investors’ confidence.
Goldman currently retains its Zacks #4 Rank, which translates into
a short-term Sell rating. However, considering the fundamentals, we
maintain a long-term Neutral rating on the stock.
CITIGROUP INC (C): Free Stock Analysis Report
GOLDMAN SACHS (GS): Free Stock Analysis Report
JPMORGAN CHASE (JPM): Free Stock Analysis Report
MORGAN STANLEY (MS): Free Stock Analysis Report
STATE ST CORP (STT): Free Stock Analysis Report
To read this article on Zacks.com click here.
Zacks Investment Research
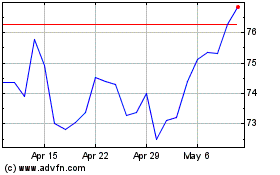
State Street (NYSE:STT)
Historical Stock Chart
From Jun 2024 to Jul 2024

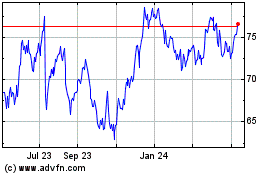
State Street (NYSE:STT)
Historical Stock Chart
From Jul 2023 to Jul 2024
