State Street Announces Private Equity Index(sm)Third Quarter Results
January 31 2008 - 10:00AM
Business Wire
State Street Corporation (NYSE:STT), the world�s leading provider
of financial services to institutional investors, today announced
the third quarter results of the State Street Private Equity
Indexsm. The Index is based on the latest quarterly statistics from
State Street Investment Analytics� Private Edge� Group, which
provides detailed analyses of customers� private equity portfolios
through a fully automated web-enabled environment. Comprising of
data including more than 1,300 private equity partnerships with a
total fund size in excess of $1.1 trillion, the State Street
Private Equity Index allows private equity investors to evaluate
their performance against their peers across a broad and
representative sample of investments. Unlike other indices, the
State Street Private Equity Index does not rely on voluntary
reporting of cash flows from general partners in order to calculate
returns. As a result, the Index provides an accurate representation
of private equity holdings across all funds, without reporting
bias. The State Street Private Equity Index includes data derived
from the diverse client base of The Private Edge Group covering
public and private pensions, endowments and foundations,
representing more than 4,000 commitments totaling over $150
billion. The Private Edge Group has one of the most expansive and
comprehensive private equity data sets currently maintained,
including partnership information down to the portfolio company
level. �The tightening of credit conditions, especially in the US,
has constrained deal flow during the quarter as evidenced by
cancellation and postponement of several buyout transactions and
increased challenges in placing leveraged buyout debt for completed
transactions,� said William Pryor, senior vice president. �This
decrease in buyout transactions has manifested itself in slightly
lower overall valuations and thereby lower long-term returns on a
quarter-over-quarter basis across the US private equity space.
However, international private equity actually displayed slightly
improved returns over the prior quarter due to the continued
weakness of the US dollar.� State Street Investment Analytics
(SSIA) services are provided through offices located around the
world, including Alameda, Amsterdam, Boston, Dublin, Edinburgh,
Frankfurt, Hong Kong, London, Luxemburg, New York, Paris, Sydney,
Toronto and Zurich. SSIA calculates performance for over 1200
clients globally on asset volumes exceeding $5.5 trillion,
providing private equity performance and analytics services through
The Private Edge Group since 1994. The table below summarizes the
long-term internal rates of return (IRR) of the index by major
private equity strategy, in addition to the composition of the
Index: State Street Private Equity Indexsm Composition and
long-term IRR as of September 30, 2007 � � � Strategy Number of
Funds Commitments ($B) Long-term IRR% as of 9/30/2007 � 6/30/2007
Buyout 619 $813 15.70% 15.79% Venture Capital 162 $204 12.42%
13.23% Other 600 $136 14.13% 14.55% Total 1,381 $1,153 15.03%
15.29% Non-US total(a) 232 $252 21.68% 20.80% (a) Included in total
About State Street State Street Corporation (NYSE: STT) is the
world's leading specialist in providing institutional investors
with investment servicing, investment management and investment
research and trading services. With $15.30 trillion in assets under
custody and $2 trillion in assets under management at December 31,
2007, State Street operates in 26 countries and more than 100
geographic markets worldwide. For more information, visit State
Street�s web site at www.statestreet.com. About Private Edge� Group
State Street provides private equity performance and analytics
services through The Private Edge� Group, which it has offered for
more than a decade. The Private Edge Group provides detailed
analyses of customers� private equity portfolios through a fully
automated web-enabled environment and offers services ranging from
performance measurement to complex quantitative and qualitative
portfolio analysis.
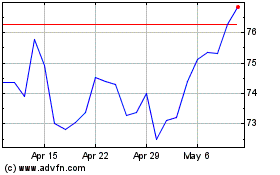
State Street (NYSE:STT)
Historical Stock Chart
From May 2024 to Jun 2024

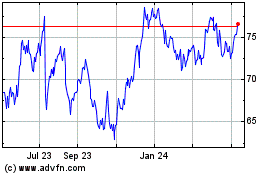
State Street (NYSE:STT)
Historical Stock Chart
From Jun 2023 to Jun 2024
