Fidelity National Financial - Value
October 17 2011 - 8:00PM
Zacks
Fidelity National Financial (FNF) trades at a discount to
its peers and the overall market, with a forward P/E of 9.6X well
into value territory. But estimates are on the rise too, providing
a unique combination of growth and value for this Zacks #1 Rank
stock.
Company Description
Fidelity National Financial is an insurance
provider in the United States with a market cap of $3.4
billion.
Fidelity National has held strong in the recent
sell off, supported by a compelling valuation and strong Q2 results
from late July that came in ahead of expectations.
Second-Quarter Results
Although revenue slipped slightly from last year in
a tough real estate environment, earnings came in ahead of
expectations at 36 cents, 20% ahead of the Zacks Consensus
Estimate, where the company has an average earnings surprise of 46%
over the last four quarters.
The good results were driven by a 38% increase in
commercial revenue from last year to $94 million. Margins were also
on the upswing, with pre tax margin up 200 basis points to 11.7%.
That would represent a 7% increase in earnings from last year.
Estimates
We saw some bullish movement in estimates off the
good quarter, with he current-year estimate adding 49 cents to
$1.64.
Valuation
With a forward P/E of 9.6X, FNF trades at a
discount to its peer average of 14X. It's Price/Sales multiple of
.63 is well below its peer average of .88.
12-Month Chart
On the chart, shares continue to trade in elevated
territory near the recent 52-week high just above $17.
Michael Vodicka is the Momentum Stock Strategist
for Zacks.com. He is also the Editor in charge of the
market-beating Zacks Whisper Trader Service.
FIDELITY NAT FI (FNF): Free Stock Analysis Report
Zacks Investment Research
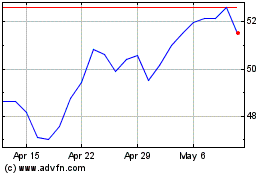
Fidelity National Financ... (NYSE:FNF)
Historical Stock Chart
From Aug 2024 to Sep 2024

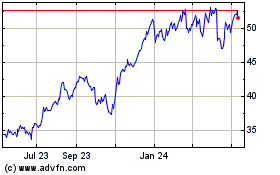
Fidelity National Financ... (NYSE:FNF)
Historical Stock Chart
From Sep 2023 to Sep 2024
