VSE Welcomes New CEO
VSE Corporation (Nasdaq: VSEC) reported the following
unaudited consolidated financial results for the first quarter of
2019.
CEO Commentary
“As VSE’s newly appointed CEO, I look forward to building and
executing on a plan of revenue and profit growth for our three
operating groups, expanding our current customer, product, and
service initiatives, and pursuing new strategic opportunities,”
said John Cuomo, VSE’s CEO and President. “We remain focused on
operational excellence and returning value to our
stockholders.”
Mr. Cuomo continued, “While revenues declined compared to the
first quarter of 2018, our operating income slightly improved. We
are pleased with the contributions of our 1st Choice Aerospace
acquisition, which is meeting expectations. Our international
programs are growing, thus providing further uplift to our Aviation
Group revenues in the first quarter. Our Supply Chain Management
Group revenue decreases were partially offset by continuing
increases in parts sales and distribution to new commercial
customers. Despite revenue challenges in our Federal Services
Group, we have increased this group’s operating income through
margin and performance improvement.”
First Quarter Results (unaudited)
(in thousands, except per share data)
Three
months ended March 31, 2019 2018
% Change Revenues $ 169,919 $
176,897 (3.9 )% Operating income $ 11,813
$ 11,593 1.9 % Net income $ 6,603
$ 7,052 (6.4 )% EPS (Diluted) $ 0.60
$ 0.65 (7.7 )%
Financial Information
Revenues were $169.9 million in the first quarter of 2019
compared to $176.9 million in the first quarter of 2018. The
decrease in revenues is primarily attributable to our Federal
Services and Supply Chain Management groups. The decrease was
partially offset by an increase in revenue from our Aviation Group,
which was primarily attributable to revenues from our 1st Choice
Aerospace acquisition and increased parts distribution sales in our
international markets.
Operating income was $11.8 million for the first quarter of 2019
compared to $11.6 million in the first quarter of 2018. The
operating income increase was primarily attributable to our
Aviation Group, and margin improvements in our Federal Services
Group. Operating income for the first quarter of 2019 was reduced
by non-recurring costs associated with our CEO transition and the
acquisition of 1st Choice Aerospace.
Net income was $6.6 million for the first quarter of 2019, or
$0.60 per diluted share, compared to $7.1 million, or $0.65 per
diluted share for the first quarter of 2018. The decrease in net
income is primarily attributable to increased interest expense.
Bookings in our Federal Services Group were $51 million for
the first three months of 2019 compared to revenue for this group
of $69 million. Funded contract backlog at March 31, 2019 was $278
million, compared to $290 million at December 31, 2018 and
$261 million at March 31, 2018.
Non-GAAP Financial Information
The non-GAAP Financial Information (unaudited) listed below is
not calculated in accordance with U.S. generally accepted
accounting principles ("GAAP") under SEC Regulation G. We consider
EBITDA a non-GAAP financial measure and an important indicator of
performance and useful metric for management and investors to
evaluate our business' ongoing operating performance on a
consistent basis across reporting periods. EBITDA should not be
considered in isolation or as a substitute for performance measures
prepared in accordance with GAAP.
EBITDA represents net income before interest expense, income
taxes, amortization of intangible assets and depreciation and other
amortization. Adjusted EBITDA represents EBITDA (as defined above)
adjusted for 1st Choice Aerospace acquisition related and CEO
transition costs.
Non-GAAP Financial Information (unaudited)
(in thousands)
Three
Month Results ended March 31, 2019
2018 % Change Net Income $ 6,603 $
7,052 (6 )% Interest Expense 3,158 2,175 45 % Income Taxes 2,052
2,366 (13 )% Amortization of Intangible Assets 4,991 4,004 25 %
Depreciation and Other Amortization 2,439
2,480 (2 )% EBITDA $ 19,243 $ 18,077 6 %
Acquisition Related and CEO Transition Costs 1,121
— — Adjusted EBITDA $ 20,364
$ 18,077 13 %
Capital Expenditures
Purchases of property and equipment were $601 thousand for the
first quarter of 2019 compared to $1.1 million for the first
quarter of 2018.
About VSE
Established in 1959, VSE is a diversified products and services
company providing logistics solutions with integrity, agility, and
value. VSE is dedicated to making our federal and commercial
clients successful by delivering innovative solutions for vehicle,
ship, and aircraft sustainment, supply chain management, platform
modernization, mission enhancement, and program management, and
providing energy, IT, and consulting services. For additional
information regarding VSE services and products, please see the
Company's web site at www.vsecorp.com or contact Christine Kaineg,
VSE Investor Relations, at (703) 329-3263.
Please refer to the Form 10-Q that will be filed with the
Securities and Exchange Commission (SEC) on or about May 3, 2019
for more details on our 2019 first quarter results. Also, refer to
VSE’s Annual Report on Form 10-K for the year ended December 31,
2018 for further information and analysis of VSE’s financial
condition and results of operations. VSE encourages investors and
others to review the detailed reporting and disclosures contained
in VSE’s public filings for additional discussion about the status
of customer programs and contract awards, risks, revenue sources
and funding, dependence on material customers, and management’s
discussion of short and long term business challenges and
opportunities.
Safe Harbor
This news release contains statements that to the extent they
are not recitations of historical fact, constitute “forward looking
statements” under federal securities laws. All such statements are
intended to be subject to the safe harbor protection provided by
applicable securities laws. For discussions identifying some
important factors that could cause actual VSE results to differ
materially from those anticipated in the forward looking statements
in this news release, see VSE’s public filings with the SEC.
VSE Corporation and Subsidiaries Unaudited
Consolidated Balance Sheets
(in thousands except share and per share
amounts)
March 31,2019
December 31,2018
Assets Current assets: Cash and cash equivalents $ 829 $ 162
Receivables, net 64,746 60,004 Unbilled receivables, net 44,450
41,255 Inventories, net 181,069 166,392 Other current assets
18,456 13,407 Total current assets 309,550 281,220
Property and equipment, net 40,167 49,606 Intangible assets,
net 152,901 94,892 Goodwill 259,212 198,622 Operating lease
right-of-use assets 26,371 — Other assets 15,844
14,488 Total assets $ 804,045 $ 638,828
Liabilities and Stockholders' equity Current liabilities: Current
portion of long-term debt $ 9,466 $ 9,466 Accounts payable 59,106
57,408 Current portion of earn-out obligation 10,700 — Accrued
expenses and other current liabilities 39,919 37,133 Dividends
payable 876 871 Total current liabilities
120,067 104,878 Long-term debt, less current portion 265,681
151,133 Deferred compensation 20,909 17,027 Long-term lease
obligations, less current portion — 18,913 Long-term operating
lease liabilities 26,845 — Earn-out obligation 14,300 — Deferred
tax liabilities 18,712 18,482 Total
liabilities 466,514 310,433 Commitments
and contingencies Stockholders' equity: Common stock, par value
$0.05 per share, authorized 15,000,000 shares; issued and
outstanding 10,949,775 and 10,881,106, respectively 547 544
Additional paid-in capital 28,788 26,632 Retained earnings 308,742
301,073 Accumulated other comprehensive (loss) income (546 )
146 Total stockholders' equity 337,531
328,395 Total liabilities and stockholders' equity $ 804,045
$ 638,828
VSE Corporation and Subsidiaries
Unaudited Consolidated Statements of Income
(in thousands except share and per share
amounts)
For the three months endedMarch 31,
2019 2018 Revenues: Products $ 88,901 $ 88,673
Services 81,018 88,224 Total revenues 169,919 176,897
Costs and operating expenses: Products 76,293 74,726
Services 75,440 85,755 Selling, general and administrative expenses
1,382 819 Amortization of intangible assets 4,991
4,004 Total costs and operating expenses 158,106
165,304 Operating income 11,813 11,593 Interest
expense, net 3,158 2,175 Income before income
taxes 8,655 9,418 Provision for income taxes 2,052
2,366 Net income $ 6,603 $ 7,052 Basic
earnings per share $ 0.60 $ 0.65 Basic weighted average
shares outstanding 10,920,171 10,860,555
Diluted earnings per share $ 0.60 $ 0.65 Diluted weighted
average shares outstanding 10,974,081 10,896,504
Dividends declared per share $ 0.08 $ 0.07
VSE Corporation and Subsidiaries Unaudited
Consolidated Statements of Cash Flows
(in thousands)
For the three months endedMarch 31,
2019 2018 Cash flows from operating activities: Net
income $ 6,603 $ 7,052 Adjustments to reconcile net income to net
cash provided by operating activities: Depreciation and
amortization 7,430 6,484 Deferred taxes (564 ) 283 Stock-based
compensation 1,640 1,263 Changes in operating assets and
liabilities, net of impact of acquisitions: Receivables, net 2,667
(978 ) Unbilled receivables, net (3,195 ) 13,589 Inventories, net
(7,798 ) (18,895 ) Other current assets and noncurrent assets
(4,990 ) 3,169 Accounts payable and deferred compensation 2,653
11,681 Accrued expenses and other current and noncurrent
liabilities (1,675 ) (9,949 ) Long-term lease obligations —
(406 ) Net cash provided by operating
activities 2,771 13,293 Cash
flows from investing activities: Purchases of property and
equipment (601 ) (1,053 ) Proceeds from the sale of property and
equipment 3 — Cash paid for acquisitions, net of cash acquired
(112,660 ) — Net cash used in investing
activities (113,258 ) (1,053 ) Cash flows from
financing activities: Borrowings on loan agreement 194,598 247,669
Repayments on loan agreement (80,183 ) (256,368 ) Payment of debt
financing costs (1,702 ) (1,798 ) Payments on capital lease
obligations — (346 ) Payments of taxes for equity transactions (687
) (641 ) Dividends paid (872 ) (759 ) Net cash
provided by (used in) financing activities 111,154
(12,243 ) Net increase (decrease) in cash and cash
equivalents 667 (3 ) Cash and cash equivalents at beginning of
period 162 624 Cash and cash
equivalents at end of period $ 829 $ 621
View source
version on businesswire.com: https://www.businesswire.com/news/home/20190502005943/en/
VSE Financial News Contact:Christine Kaineg -- (703)
329-3263
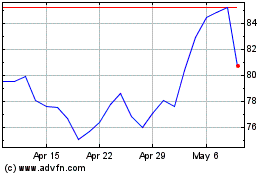
VSE (NASDAQ:VSEC)
Historical Stock Chart
From Aug 2024 to Sep 2024

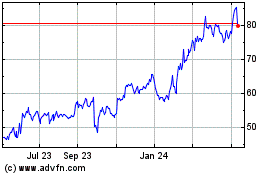
VSE (NASDAQ:VSEC)
Historical Stock Chart
From Sep 2023 to Sep 2024
