Final Results -17-
February 27 2012 - 2:01AM
UK Regulatory
The provision of an adjusted earnings per share, derived in
accordance with the table above, has been included to identify the
performance of operations, from the time of acquisition or until
the time of disposal, prior to the impact of the following
items:
 --   gains or losses arising from the sale of fixed assets
 --   amortisation of intangible assets acquired on acquisitions
 --   impairment of goodwill
 --   acquisition costs
8. Goodwill
Goodwill increased by GBP40.2m during the year to GBP209.9m
(2010 - GBP169.7m) due to goodwill arising on the acquisition of
Damar and Weston of GBP11.1m and GBP27.5m respectively (see Note
13), and exchange translation differences of GBP1.6m. An impairment
charge of GBP8.7m relating to the goodwill arising upon the
acquisition of Capo Industries, Inc. was recognised in 2010.
9. Property, plant and equipment
During the period, the Group spent GBP21.1m (2010 - GBP13.5m) on
the acquisition of property, plant and equipment, and acquired
GBP0.2m of assets under finance leases. The Group also disposed of
property, plant and equipment with a carrying value of GBP0.6m
(2010 - GBP1.9m) for proceeds of GBP0.3m (2010 - GBP2.1m).
10. Share capital
Share capital as at 31 December 2011 amounted to GBP40.2m.
During 2011, the Group issued 86,311 shares at an average price of
25.00p per share under share option plans raising GBP0.02m.
1,256,703 shares were also issued during 2011 under the 2005 Long
Term Incentive Plan.
11. Notes to the cash flow statement
a) Reconciliation of operating profit to net cash from operating
activities
                                                        Year ended   Year ended
                                                              2011         2010
                                                              GBPm         GBPm
 Operating profit from continuing operations                  83.0         62.2
 Adjustments for:
      Depreciation of property, plant and equipment           18.0         19.4
      Amortisation of intangible assets                        5.0          5.2
      Share options                                            2.5          1.4
      Loss / (profit) on disposal of property, plant
       and equipment                                           0.3        (0.2)
      Pension payments in excess of service cost             (7.8)       (11.8)
      Impairment of goodwill                                     -          8.7
                                                       -----------  -----------
 Operating cash flows before movements in working
  capital                                                    101.0         84.9
      Increase in inventories                                (7.3)        (8.1)
      Increase in receivables                               (13.8)        (0.4)
      Increase in payables                                    16.5         11.0
      Working capital currency movements                     (0.1)        (0.3)
                                                       -----------  -----------
 Cash generated by operations                                 96.3         87.1
 Income taxes paid                                          (10.7)        (8.6)
 Interest paid                                               (8.5)        (8.3)
                                                       -----------  -----------
 Net cash from operating activities                           77.1         70.2
                                                       ===========  ===========
b) Free cash flow
Free cash flow, a non-statutory item, highlights the total net
cash generated by the Group prior to corporate activity such as
acquisitions, disposals, financing and transactions with
shareholders. It is derived as follows:
                                                 Year ended   Year ended
                                                       2011         2010
                                                       GBPm         GBPm
 Net cash from operating activities                    77.1         70.2
 Interest received                                      0.3          0.7
 Proceeds on disposal of property, plant and
  equipment                                             0.3          2.1
 Purchases of property, plant and equipment -
  cash                                               (21.1)       (13.5)
 Purchase of intangible assets                        (1.0)        (0.7)
                                                -----------  -----------
 Free cash flow                                        55.6         58.8
                                                ===========  ===========
c) Analysis of net debt
                                   At                                         Assumed                   At
                                1 Jan     Cash   Non-cash   New finance            on   Exchange    31 Dec
                                 2011     flow      items        leases   acquisition   movement      2011
                                 GBPm     GBPm       GBPm          GBPm          GBPm       GBPm      GBPm
 Cash                            56.0   (25.7)          -             -             -      (1.0)      29.3
 Overdrafts                     (0.1)    (0.8)          -             -             -        0.1     (0.8)
                             --------  -------  ---------  ------------  ------------  ---------  --------
 Cash and cash equivalents       55.9   (26.5)          -             -             -      (0.9)      28.5
 Debt due within one
  year                          (0.2)      0.2      (0.2)             -             -          -     (0.2)
 Debt due after one
  year                        (118.3)        -        0.2             -             -      (1.6)   (119.7)
 Finance leases                 (1.1)      0.4          -         (0.2)         (0.7)          -     (1.6)
 Forward contracts                  -    (0.2)          -             -             -        0.2         -
 Total                         (63.7)   (26.1)          -         (0.2)         (0.7)      (2.3)    (93.0)
                             ========  =======  =========  ============  ============  =========  ========


                                        Year ended   Year ended
                                              2011         2010
                                              GBPm         GBPm
 Cash and cash equivalents comprise:
 Cash                                         29.3         56.0
 Bank overdrafts                             (0.8)        (0.1)
                                       -----------  -----------
 Total                                        28.5         55.9
                                       ===========  ===========
Cash and cash equivalents (which are presented as a single class
of assets on the face of the Balance Sheet) comprise cash at bank
and other short-term highly liquid investments with a maturity of
three months or less. The Directors consider that the carrying
amount of cash and cash equivalents approximates to their fair
value.
12. Retirement benefit schemes
Defined Benefit Schemes
Aggregate retirement benefit liabilities are GBP34.5m (2010 -
GBP38.2m). The primary components of this liability are the Group's
UK and US defined benefit pension schemes, with deficits of
GBP25.3m (2010 - GBP29.8m) and GBP4.2m (2010 - GBP3.3m)
respectively, and a liability on unfunded schemes of GBP5.0m (2010
- GBP5.1m). These values have been assessed by independent
actuaries using current market values and discount rates. The
decrease in the liability from GBP38.2m at 31 December 2010 to
GBP34.5m at 31 December 2011 reflects the positive effect of plan
asset returns of GBP23.3m, and increased total cash contributions
in excess of service cost of GBP7.8m, offset by an increase in the
present value of benefit obligations, due to decreases in the UK
and US plan discount rate assumptions to 4.8% and 4.6%,
respectively (2010 - 5.4% and 5.3%). These changes in discount rate
assumptions since 31 December 2010 are in line with movements in
market yields of high-quality corporate bonds which are used to
determine the rate for discounting future scheme liabilities.
13. Acquisitions
Damar Machine Company
On 25 March 2011, the Group acquired 100% of the issued share
capital of Damar Machine Company and two small related entities
(collectively "Damar"). Damar, located in Monroe, Washington, USA,
is principally a manufacturer and integrator of precision machined
parts and assemblies for the commercial aircraft industry. The
business, like the Group's existing Aerospace Division, has content
on each of Boeing's 737, 747, 767, 777 and 787 platforms, with
Boeing commercial aircraft representing some 88% of Damar's 2010
revenue. Over the past year, Boeing has announced build rate
increases for all of these aircraft types. Consequently, the future
prospects for Damar, and the Group's Aerospace Division, appear
highly encouraging. Damar's capabilities, combined with Senior's
wider market access, financial strength and operational excellence
focus, are expected to lead to stronger growth prospects and
improved operational efficiencies, benefiting customers, employees
and shareholders. The cash consideration, including acquired
overdraft of GBP0.1m, was GBP15.6m and the acquisition was funded
from the Group's existing debt facilities.
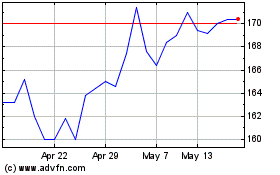
Senior (LSE:SNR)
Historical Stock Chart
From Jun 2024 to Jul 2024

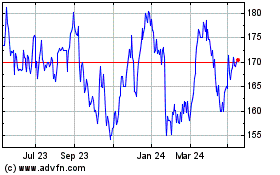
Senior (LSE:SNR)
Historical Stock Chart
From Jul 2023 to Jul 2024
