Goodfellow Reports Its Results for the Second Quarter Ended May 31, 2023
July 06 2023 - 5:54PM

Goodfellow Inc. (TSX: GDL) (the “Company” or “Goodfellow”)
announced today its financial results for the second quarter of
fiscal year 2023.
For the three months ended May 31, 2023, the
Company reported net earnings of $6.6 million or $0.77 per share
compared to net earnings of $12.5 million or $1.46 per share a year
ago, while consolidated sales were $142.3 million compared to
$184.9 million last year.
For the six months ended May 31, 2023, the
Company reported net earnings of $6.4 million or $0.75 per share
compared to net earnings of $17.7 million or $2.06 per share a year
ago, while consolidated sales were $248.3 million compared to
$314.3 million last year.
Given the slowing economy and widespread market
uncertainty, the decline in seasonal demand was in line with
expectations. Goodfellow's experienced team has continued to
provide excellent service to clients from coast to coast, while
diligently managing increased overhead costs to achieve strong
results. While these results are lower than last year, they
represent a solid performance for the second quarter.
About Goodfellow
Goodfellow is a diversified manufacturer of
value-added lumber products, as well as a wholesale distributor of
building materials and floor coverings. Goodfellow has a
distribution footprint from coast-to-coast in Canada servicing
commercial and residential sectors through lumber yard retailer
networks, manufacturers, industrial and infrastructure project
partners, and floor covering specialists. Goodfellow also leverages
its value-added product capabilities to serve lumber markets
internationally. Goodfellow Inc. is a publicly traded company, and
its shares are listed on the Toronto Stock Exchange under the
symbol “GDL”.
|
GOODFELLOW INC. |
|
Consolidated Statements of Comprehensive
Income |
|
For the three and six months ended May 31, 2023 and
2022 |
|
(in thousands of dollars, except per share amounts) |
|
Unaudited |
|
|
|
|
|
|
|
|
For the three months ended |
For the six months ended |
|
|
May 312023 |
May 312022 |
May 312023 |
May 312022 |
|
|
$ |
$ |
$ |
$ |
| |
|
|
|
|
|
Sales |
142,326 |
184,947 |
248,251 |
314,312 |
|
Expenses |
|
|
|
|
|
Cost of goods sold |
110,034 |
143,745 |
194,294 |
245,001 |
|
Selling, administrative and general expenses |
22,239 |
22,900 |
43,923 |
43,338 |
|
Net financial costs |
921 |
882 |
1,195 |
1,446 |
|
|
133,194 |
167,527 |
239,412 |
289,785 |
|
|
|
|
|
|
| Earnings
before income taxes |
9,132 |
17,420 |
8,839 |
24,527 |
| |
|
|
|
|
| Income
taxes |
2,557 |
4,878 |
2,475 |
6,868 |
|
|
|
|
|
|
|
Total comprehensive income |
6,575 |
12,542 |
6,364 |
17,659 |
| |
|
|
|
|
|
|
|
|
|
|
|
Net earnings per share – Basic and Diluted |
0.77 |
1.46 |
0.75 |
2.06 |
|
GOODFELLOW INC. |
|
Consolidated Statements of Financial
Position |
|
(in thousands of dollars) |
|
Unaudited |
|
|
|
|
|
|
|
As at |
As at |
As at |
|
|
May 312023 |
November 302022 |
May 312022 |
|
|
$ |
$ |
$ |
|
Assets |
|
|
|
|
Current Assets |
|
|
|
|
Cash |
3,171 |
3,420 |
2,608 |
|
Trade and other receivables |
87,163 |
64,423 |
101,654 |
|
Income taxes receivable |
6,001 |
2,439 |
1,078 |
|
Inventories |
122,268 |
112,294 |
141,126 |
|
Prepaid expenses |
2,263 |
2,555 |
9,451 |
|
Total Current Assets |
220,866 |
185,131 |
255,917 |
| |
|
|
|
|
Non-Current Assets |
|
|
|
|
Property, plant and equipment |
32,405 |
32,269 |
30,782 |
|
Intangible assets |
1,795 |
2,096 |
2,388 |
|
Right-of-use assets |
12,916 |
14,999 |
13,663 |
|
Defined benefit plan asset |
11,760 |
11,620 |
10,426 |
|
Other assets |
802 |
802 |
802 |
|
Total Non-Current Assets |
59,678 |
61,786 |
58,061 |
|
Total Assets |
280,544 |
246,917 |
313,978 |
|
|
|
|
|
|
Liabilities |
|
|
|
|
Current Liabilities |
|
|
|
|
Bank indebtedness |
34,002 |
- |
72,320 |
|
Trade and other payables |
36,553 |
36,286 |
44,322 |
|
Provision |
2,252 |
2,281 |
405 |
|
Current portion of lease liabilities |
4,748 |
4,969 |
4,605 |
|
Total Current Liabilities |
77,555 |
43,536 |
121,652 |
| |
|
|
|
|
Non-Current Liabilities |
|
|
|
|
Provision |
770 |
634 |
2,255 |
|
Lease liabilities |
10,189 |
12,537 |
11,738 |
|
Deferred income taxes |
3,431 |
3,431 |
3,151 |
|
Total Non-Current Liabilities |
14,390 |
16,602 |
17,144 |
|
Total Liabilities |
91,945 |
60,138 |
138,796 |
|
|
|
|
|
|
Shareholders’ Equity |
|
|
|
|
Share capital |
9,394 |
9,419 |
9,424 |
|
Retained earnings |
179,205 |
177,360 |
165,758 |
|
|
188,599 |
186,779 |
175,182 |
|
Total Liabilities and Shareholders’ Equity |
280,544 |
246,917 |
313,978 |
|
GOODFELLOW INC. |
| Consolidated
Statements of Cash Flows |
| For the three
and six months ended May 31, 2023 and 2022 |
| (in thousands of
dollars) |
|
Unaudited |
|
|
|
|
|
|
|
For the three months ended |
For the six months ended |
|
|
May 31 2023 |
May 31 2022 |
May 31 2023 |
May 31 2022 |
|
|
$ |
$ |
$ |
$ |
|
Operating Activities |
|
|
|
|
|
Net earnings |
6,575 |
12,542 |
6,364 |
17,659 |
|
Adjustments for: |
|
|
|
|
|
Depreciation and amortization of: |
|
|
|
|
|
Property, plant and equipment |
795 |
577 |
1,540 |
1,152 |
|
Intangible assets |
150 |
152 |
301 |
302 |
|
Right-of-use assets |
1,188 |
1,140 |
2,445 |
2,190 |
|
Accretion expense on provision |
68 |
26 |
136 |
51 |
|
Provision |
(7) |
462 |
(29) |
462 |
|
Income taxes |
2,557 |
4,878 |
2,475 |
6,868 |
|
Gain on disposal of property, plant and equipment |
(171) |
(10) |
(181) |
(35) |
|
Interest expense |
481 |
385 |
569 |
499 |
|
Interest on lease liabilities |
158 |
147 |
140 |
278 |
|
Funding in excess of pension plan expense |
(70) |
(15) |
(140) |
(29) |
|
Other |
(10) |
(24) |
(139) |
(25) |
|
|
11,714 |
20,260 |
13,481 |
29,372 |
|
|
|
|
|
|
|
Changes in non-cash working capital items |
(15,844) |
(32,520) |
(32,124) |
(68,474) |
|
Interest paid |
(632) |
(617) |
(740) |
(887) |
|
Income taxes paid |
(3,019) |
(3,277) |
(6,037) |
(16,968) |
|
|
(19,495) |
(36,414) |
(38,901) |
(86,329) |
|
Net Cash Flows from Operating Activities |
(7,781) |
(16,154) |
(25,420) |
(56,957) |
|
|
|
|
|
|
|
Financing Activities |
|
|
|
|
|
Net (decrease) increase in bank loans |
(2,000) |
- |
- |
11,000 |
|
Net increase in banker’s acceptances |
23,000 |
32,000 |
28,000 |
53,000 |
|
Payment of lease liabilities |
(1,287) |
(1,233) |
(2,792) |
(2,420) |
|
Redemption of shares |
(150) |
- |
(270) |
- |
|
Dividends paid |
(4,274) |
(3,425) |
(4,274) |
(3,425) |
|
Net Cash Flows from Financing Activities |
15,289 |
27,342 |
20,664 |
58,155 |
|
|
|
|
|
|
|
Investing Activities |
|
|
|
|
|
Acquisition of property, plant and equipment |
(839) |
(1,468) |
(1,683) |
(1,912) |
|
Increase in intangible assets |
- |
(40) |
- |
(40) |
|
Proceeds on disposal of property, plant and equipment |
178 |
10 |
188 |
35 |
|
Net Cash Flows from Investing Activities |
(661) |
(1,498) |
(1,495) |
(1,917) |
|
|
|
|
|
|
|
Net cash inflow (outflow) |
6,847 |
9,690 |
(6,251) |
(719) |
|
Cash position, beginning of period |
(9,678) |
(13,402) |
3,420 |
(2,993) |
|
Cash position, end of period |
(2,831) |
(3,712) |
(2,831) |
(3,712) |
|
|
|
|
|
|
|
Cash position is comprised of: |
|
|
|
|
|
Cash |
3,171 |
2,608 |
3,171 |
2,608 |
|
Bank overdraft |
(6,002) |
(6,320) |
(6,002) |
(6,320) |
|
|
(2,831) |
(3,712) |
(2,831) |
(3,712) |
|
GOODFELLOW INC. |
|
Consolidated Statements of Changes in Shareholders’
Equity |
|
For the six months ended May 31, 2023 and
2022 |
|
(in thousands of dollars) |
|
Unaudited |
|
|
Share Capital |
Retained Earnings |
Total |
|
|
$ |
$ |
$ |
| |
|
|
|
|
Balance as at November 30, 2021 |
9,424 |
151,524 |
160,948 |
|
|
|
|
|
|
Net earnings |
- |
17,659 |
17,659 |
|
|
|
|
|
|
Total comprehensive income |
- |
17,659 |
17,659 |
|
|
|
|
|
| |
|
|
|
|
Dividend |
- |
(3,425) |
(3,425) |
|
|
|
|
|
|
Balance as at May 31, 2022 |
9,424 |
165,758 |
175,182 |
|
|
|
|
|
|
|
|
|
|
Balance as at November 30, 2022 |
9,419 |
177,360 |
186,779 |
|
|
|
|
|
|
Net earnings |
- |
6,364 |
6,364 |
|
|
|
|
|
|
Total comprehensive income |
- |
6,364 |
6,364 |
|
|
|
|
|
|
Dividend |
- |
(4,274) |
(4,274) |
|
Redemption of Shares |
(25) |
(245) |
(270) |
|
|
|
|
|
|
Balance as at May 31, 2023 |
9,394 |
179,205 |
188,599 |
|
From: |
|
Goodfellow
Inc. |
| |
|
Patrick Goodfellow |
| |
|
President and CEO |
| |
|
T: 450 635-6511 |
| |
|
F: 450 635-3730 |
| |
|
info@goodfellowinc.com |
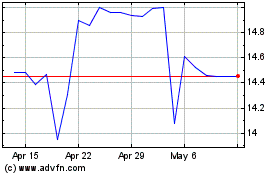
Goodfellow (TSX:GDL)
Historical Stock Chart
From Jan 2025 to Feb 2025

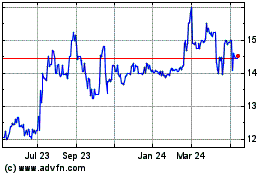
Goodfellow (TSX:GDL)
Historical Stock Chart
From Feb 2024 to Feb 2025
