| 15
BALANCE SHEET
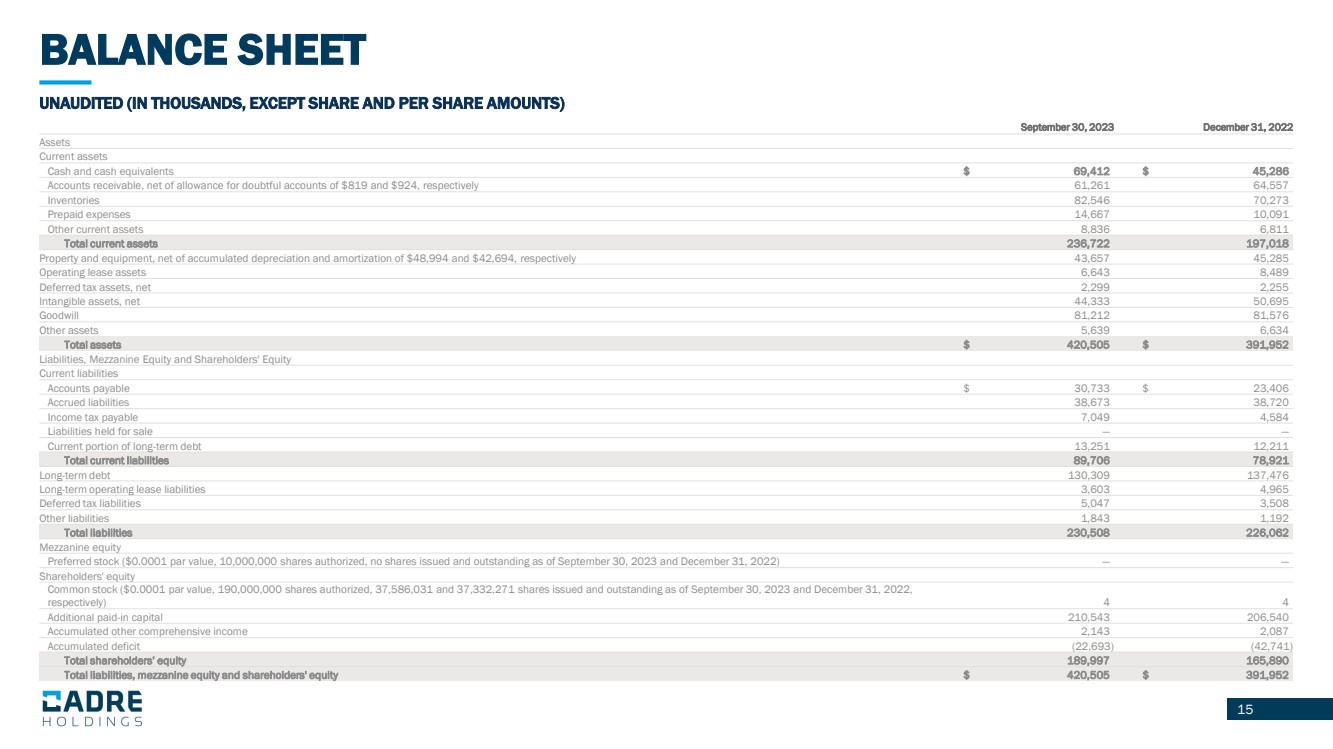
UNAUDITED (IN THOUSANDS, EXCEPT SHARE AND PER SHARE AMOUNTS)
September 30, 2023 December 31, 2022
Assets
Current assets
Cash and cash equivalents $ 69,412 $ 45,286
Accounts receivable, net of allowance for doubtful accounts of $819 and $924, respectively 61,261 64,557
Inventories 82,546 70,273
Prepaid expenses 14,667 10,091
Other current assets 8,836 6,811
Total current assets 236,722 197,018
Property and equipment, net of accumulated depreciation and amortization of $48,994 and $42,694, respectively 43,657 45,285
Operating lease assets 6,643 8,489
Deferred tax assets, net 2,299 2,255
Intangible assets, net 44,333 50,695
Goodwill 81,212 81,576
Other assets 5,639 6,634
Total assets $ 420,505 $ 391,952
Liabilities, Mezzanine Equity and Shareholders' Equity
Current liabilities
Accounts payable $ 30,733 $ 23,406
Accrued liabilities 38,673 38,720
Income tax payable 7,049 4,584
Liabilities held for sale — —
Current portion of long-term debt 13,251 12,211
Total current liabilities 89,706 78,921
Long-term debt 130,309 137,476
Long-term operating lease liabilities 3,603 4,965
Deferred tax liabilities 5,047 3,508
Other liabilities 1,843 1,192
Total liabilities 230,508 226,062
Mezzanine equity
Preferred stock ($0.0001 par value, 10,000,000 shares authorized, no shares issued and outstanding as of September 30, 2023 and December 31, 2022) — —
Shareholders' equity
Common stock ($0.0001 par value, 190,000,000 shares authorized, 37,586,031 and 37,332,271 shares issued and outstanding as of September 30, 2023 and December 31, 2022,
respectively) 4 4
Additional paid-in capital 210,543 206,540
Accumulated other comprehensive income 2,143 2,087
Accumulated deficit (22,693) (42,741)
Total shareholders’ equity 189,997 165,890
Total liabilities, mezzanine equity and shareholders' equity $ 420,505 $ 391,952 |