false
0001090009
0001090009
2025-01-28
2025-01-28
0001090009
dei:FormerAddressMember
2025-01-28
2025-01-28
iso4217:USD
xbrli:shares
iso4217:USD
xbrli:shares
UNITED
STATES
SECURITIES
AND EXCHANGE COMMISSION
WASHINGTON,
DC 20549
FORM
8-K
CURRENT
REPORT PURSUANT
TO
SECTION 13 OR 15(D) OF THE
SECURITIES
EXCHANGE ACT OF 1934
Date
of report (Date of earliest event reported) January 28, 2025

Southern
First Bancshares, Inc.
(Exact
name of registrant as specified in its charter)
| South Carolina |
| (State
or other jurisdiction of incorporation) |
|
000-27719 |
58-2459561 |
| (Commission
File Number) |
(IRS
Employer Identification No.) |
| |
| 6
Verdae Boulevard, Greenville, SC |
29607 |
| (Address
of principal executive offices) |
(Zip
Code) |
|
(864) 679-9000 |
| (Registrant's
telephone number, including area code) |
| |
|
100 Verdae Boulevard, Suite 100, Greenville, SC |
| (Former
name or former address, if changed since last report) |
Check
the appropriate box below if the Form 8-K filing is intended to simultaneously satisfy the filing obligation of the registrant under
any of the following provisions (see General Instruction A.2. below):
☐ Written
communications pursuant to Rule 425 under the Securities Act (17 CFR 230.425)
☐ Soliciting
material pursuant to Rule 14a-12 under the Exchange Act (17 CFR 240.14a-12)
☐ Pre-commencement
communications pursuant to Rule 14d-2(b) under the Exchange Act (17CFR 240.14d-2(b))
☐ Pre-commencement
communications pursuant to Rule 13e-4(c) under the Exchange Act (17 CFR 240.13e-4(c))
Securities registered pursuant to Section 12(b)
of the Act:
| Title of each class |
Trading Symbol(s) |
Name of each exchange on which registered |
| Common Stock |
SFST |
The Nasdaq Global Market |
Indicate by check mark whether the registrant is an emerging growth company as defined in Rule 405 of the Securities Act of 1933 (§230.405 of this chapter) or Rule 12b-2 of the Securities Exchange Act of 1934 (§240.12b-2 of this chapter).
Emerging growth company ¨
If an emerging growth company, indicate by check mark if the registrant has elected not to use the extended transition period for complying with any new or revised financial accounting standards provided pursuant to Section 13(a) of the Exchange Act. ¨
ITEM
2.02. Results of Operations and Financial Condition.
On
January 28, 2025, Southern First Bancshares, Inc., holding company for Southern First Bank, issued a press release announcing its financial
results for the period ended December 31, 2024. The press release is furnished as Exhibit 99.1 to this Current Report on Form 8-K.
ITEM
7.01 Regulation FD Disclosure.
A copy of a slide presentation also highlighting Southern First
Bancshares, Inc. financial results for the period ended December 31, 2024 is furnished as Exhibit 99.2 to this Current Report on Form
8-K. The slide presentation also will be available on our website, www.southernfirst.com, under the “Investor Relations”
section.
ITEM 9.01. Financial Statements and Exhibits.
| (d) Exhibits |
The
following exhibit index lists the exhibits that are either filed or furnished with the Current Report on Form 8-K. |
EXHIBIT
INDEX
SIGNATURES
Pursuant
to the requirements of the Securities Exchange Act of 1934, the Registrant has duly caused this report to be signed on its behalf by
the undersigned hereunto duly authorized.
| |
SOUTHERN FIRST BANCSHARES, INC. |
| |
|
|
|
| |
By: |
/s/ Christian
J. Zych |
|
| |
Name: |
Christian J. Zych |
|
| |
Title: |
Chief Financial Officer |
|
January 28, 2025
Exhibit 99.1

Southern First Reports Fourth Quarter 2024 Results
Greenville, South Carolina, January 28, 2025 – Southern
First Bancshares, Inc. (NASDAQ: SFST), holding company for Southern First Bank, today announced its financial results for the three
and twelve months ended December 31, 2024.
“Our financial performance this quarter reflects continued
momentum in margin and gives us great optimism as a starting point for 2025. Asset quality remained outstanding with excellent performance
metrics and a positive outlook. Our balance sheet performed as we expected with the Fed’s interest rate cuts, and our margin continued
to expand each quarter this year. Our capital ratios remain strong, and we are pleased with our growth in book value to $40.47 to end
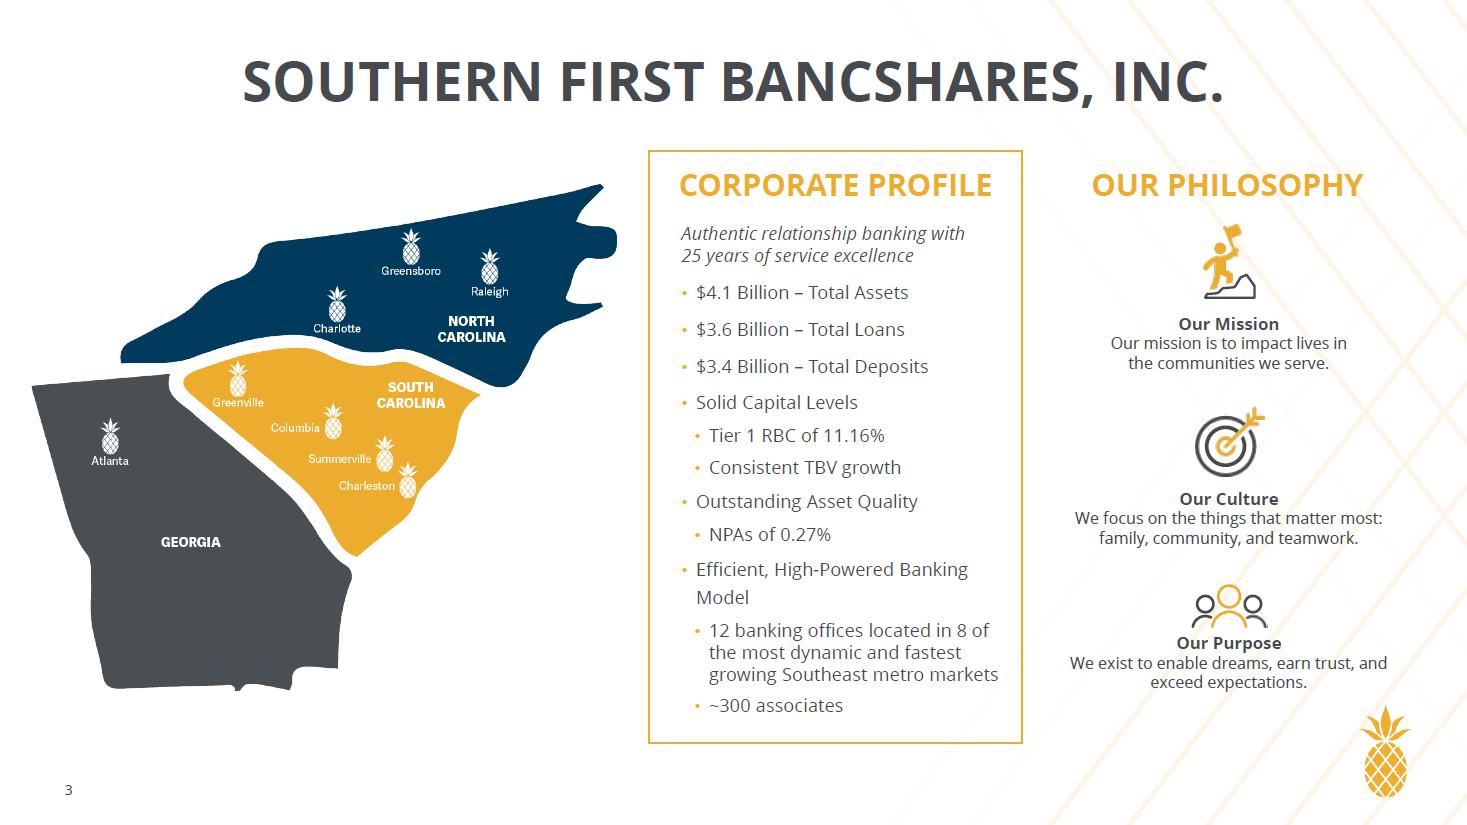
the year.” stated Art Seaver, Chief Executive Officer. “After 25 years, we are proud of the company we have built and our
continued mission to impact lives in the communities we serve. We are well-positioned with a strong balance sheet and healthy pipelines
to continue the positive trends in performance and generating value for our shareholders.”
2024 Fourth Quarter Highlights
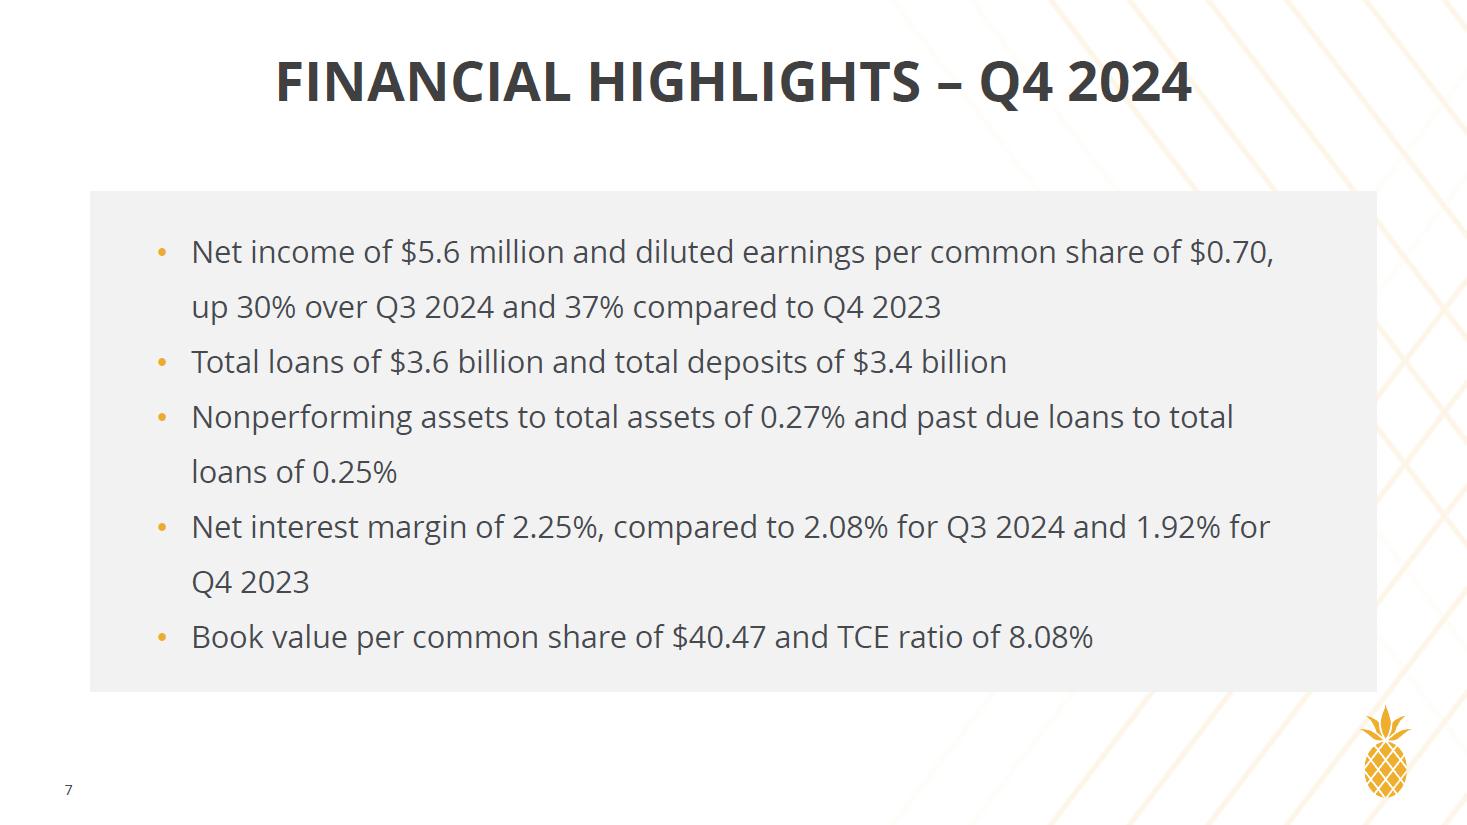
| · | Net
income of $5.6 million and diluted earnings per common share of $0.70, up 30% over last quarter
and 37% compared to Q4 2023 |
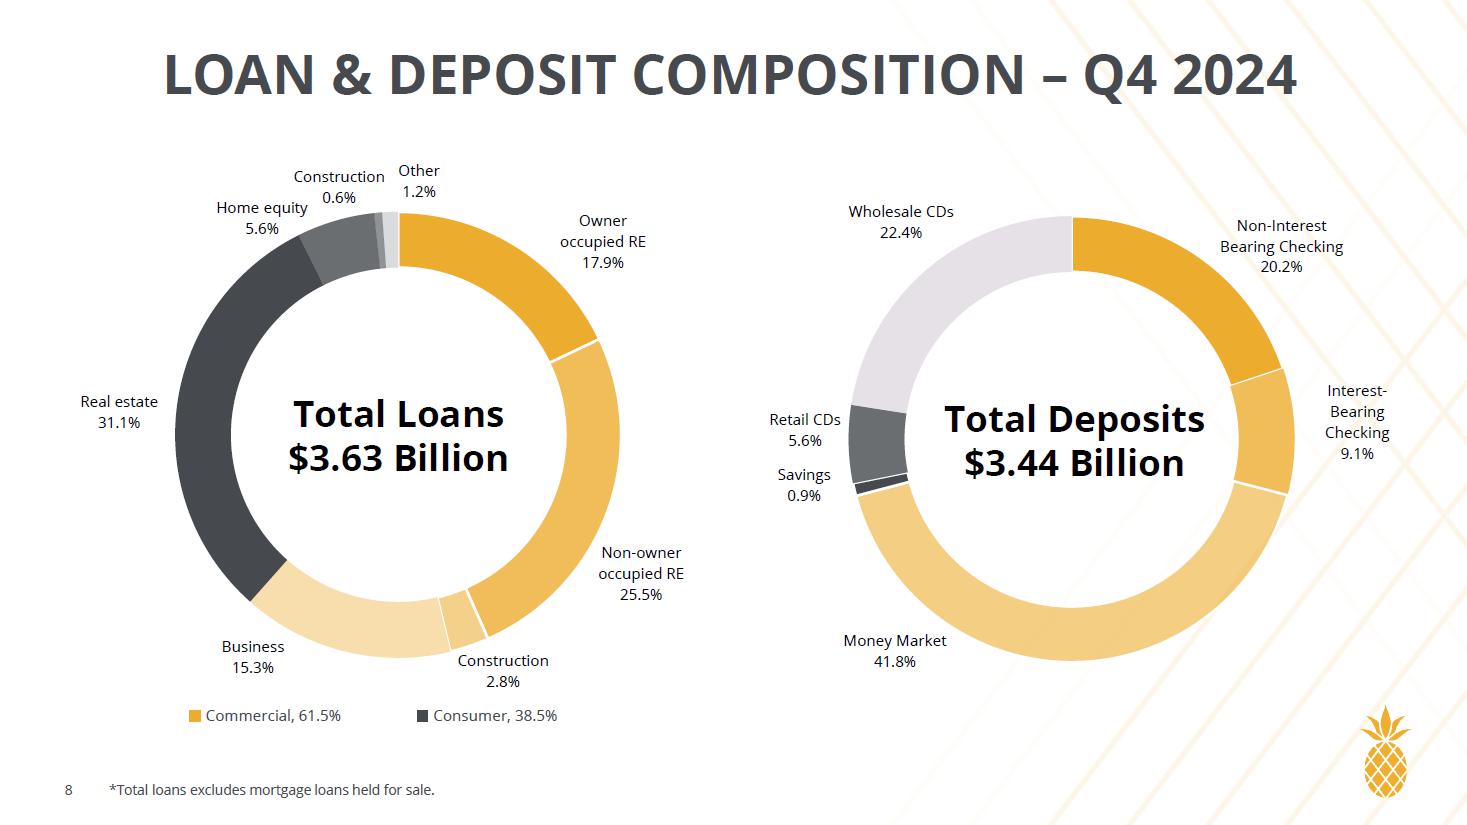
| · | Total loans of
$3.6 billion and total deposits of $3.4 billion |
| · | Nonperforming assets
to total assets of 0.27% and past due loans to total loans of 0.25% |
| · | Net interest margin
of 2.25%, compared to 2.08% for Q3 2024 and 1.92% for Q4 2023 |
| · | Book value per
common share of $40.47 and a TCE ratio of 8.08% |
| |
|
Quarter
Ended |
| |
|
December
31 |
September
30 |
June
30 |
March
31 |
December
31 |
| |
|
2024 |
2024 |
2024 |
2024 |
2023 |
| Earnings
($ in thousands, except per share data): |
|
|
|
|
|
|
| Net
income available to common shareholders |
$ |
5,627
|
4,382
|
2,999
|
2,522
|
4,167
|
| Earnings
per common share, diluted |
|
0.70
|
0.54
|
0.37
|
0.31
|
0.51
|
| Total
revenue(1) |
|
25,237 |
23,766 |
23,051 |
21,309 |
21,390 |
| Net
interest margin (tax-equivalent)(2) |
|
2.25% |
2.08% |
1.98% |
1.94% |
1.92% |
| Return
on average assets(3) |
|
0.54% |
0.43% |
0.29% |
0.25% |
0.40% |
| Return
on average equity(3) |
|
6.80% |
5.40% |
3.81% |
3.22% |
5.39% |
| Efficiency
ratio(4) |
|
73.48% |
75.90% |
80.87% |
84.94% |
79.61% |
| Noninterest
expense to average assets (3) |
|
1.78% |
1.75% |
1.81% |
1.81% |
1.64% |
| Balance
Sheet ($ in thousands): |
|
|
|
|
|
|
| Total
loans(5) |
$ |
3,631,767 |
3,619,556 |
3,622,521 |
3,643,766 |
3,602,627 |
| Total
deposits |
|
3,435,765 |
3,518,825 |
3,459,869 |
3,460,681 |
3,379,564 |
| Core
deposits(6) |
|
2,661,736 |
2,705,429 |
2,788,223 |
2,807,473 |
2,811,499 |
| Total
assets |
|
4,087,593 |
4,174,631 |
4,109,849 |
4,105,704 |
4,055,789 |
| Book
value per common share |
|
40.47 |
40.04 |
39.09 |
38.65 |
38.63 |
| Loans
to deposits |
|
105.70% |
102.86% |
104.70% |
105.29% |
106.60% |
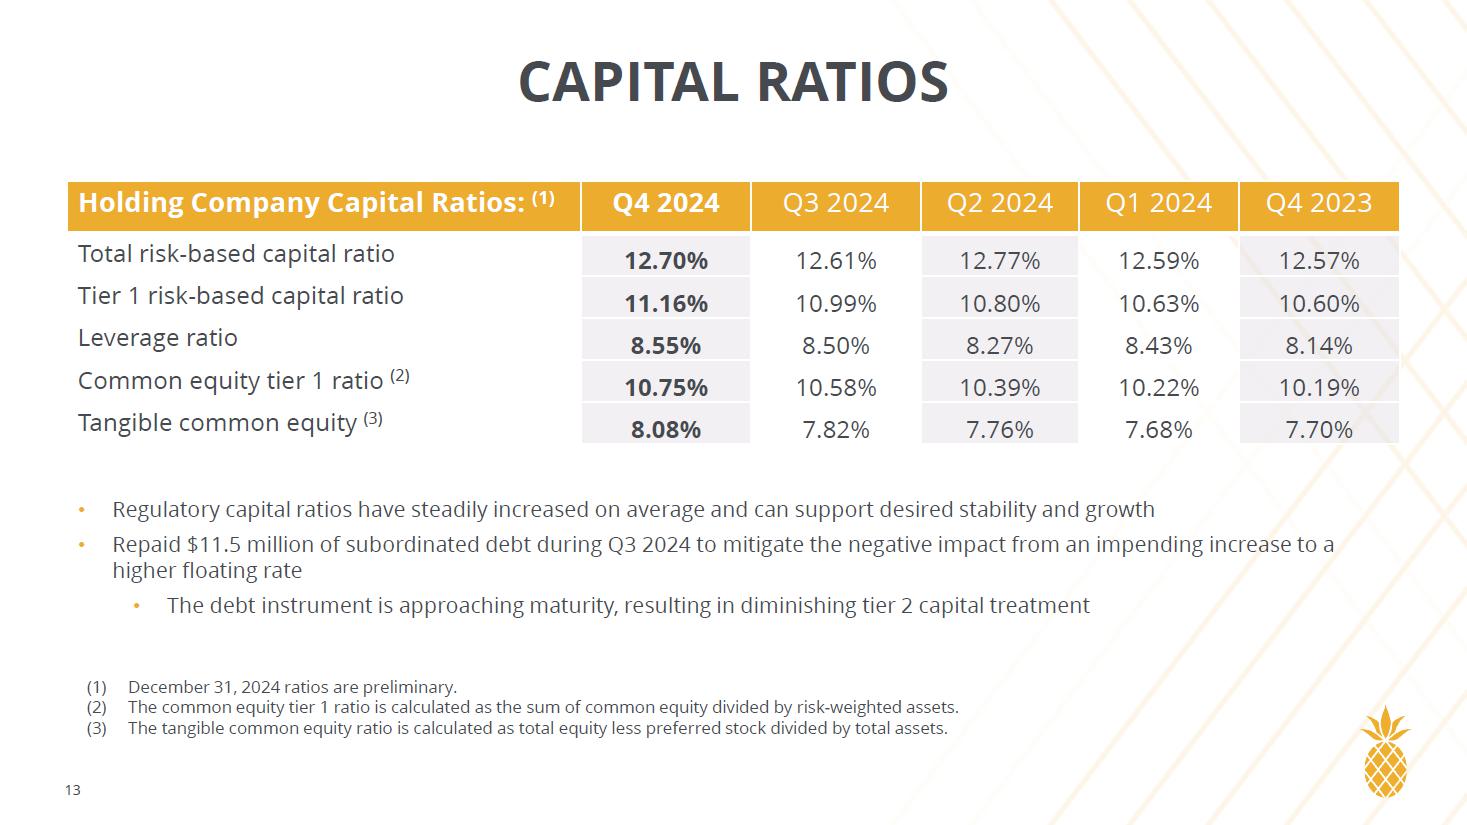
| Holding
Company Capital Ratios(7): |
|
|
|
|
|
|
| Total
risk-based capital ratio |
|
12.70% |
12.61% |
12.77% |
12.59% |
12.56% |
| Tier
1 risk-based capital ratio |
|
11.16% |
10.99% |
10.80% |
10.63% |
10.59% |
| Leverage
ratio |
|
8.55% |
8.50% |
8.27% |
8.44% |
8.14% |
| Common
equity tier 1 ratio(8) |
|
10.75% |
10.58% |
10.39% |
10.22% |
10.18% |
| Tangible
common equity(9) |
|
8.08% |
7.82% |
7.76% |
7.68% |
7.70% |
| Asset
Quality Ratios: |
|
|
|
|
|
|
| Nonperforming
assets/total assets |
|
0.27% |
0.28% |
0.27% |
0.09% |
0.10% |
| Classified
assets/tier one capital plus allowance for credit losses |
|
4.25% |
4.35% |
4.22% |
3.99% |
4.25% |
| Loans
30 days or more past due/loans(5) |
|
0.25% |
0.16% |
0.30% |
0.36% |
0.37% |
| Net
charge-offs (recoveries)/average loans(5) (YTD annualized) |
|
0.04% |
0.05% |
0.07% |
0.03% |
0.00% |
| Allowance
for credit losses/loans(5) |
|
1.10% |
1.11% |
1.11% |
1.11% |
1.13% |
| Allowance
for credit losses/nonaccrual loans |
|
366.94% |
346.78% |
357.95% |
1,109.13% |
1,026.58% |
[Footnotes to table located on page 6]
income statements
– Unaudited
| |
|
|
|
|
|
|
|
|
| |
|
Quarter
Ended |
|
Twelve
Months Ended |
| |
|
Dec
31 |
Sept
30 |
Jun
30 |
Mar
31 |
Dec
31 |
|
December
31 |
| (in
thousands, except per share data) |
|
2024 |
2024 |
2024 |
2024 |
2023 |
|
2024 |
2023 |
| Interest income |
|
|
|
|
|
|
|
|
|
| Loans |
$ |
47,163 |
47,550 |
46,545 |
45,605 |
44,758 |
|
186,863 |
166,137 |
| Investment securities |
|
1,504 |
1,412 |
1,418 |
1,478 |
1,674 |
|
5,812 |
4,463 |
| Federal funds sold |
|
2,465 |
2,209 |
2,583 |
1,280 |
2,703 |
|
8,537 |
6,998 |
| Total interest income |
|
51,132 |
51,171 |
50,546 |
48,363 |
49,135 |
|
201,212 |
177,598 |
| Interest expense |
|
|
|
|
|
|
|
|
|
| Deposits |
|
25,901 |
27,725 |
28,216 |
26,932 |
27,127 |
|
108,774 |
91,373 |
| Borrowings |
|
2,773 |
2,855 |
2,802 |
2,786 |
2,948 |
|
11,216 |
8,571 |
| Total interest expense |
|
28,674 |
30,580 |
31,018 |
29,718 |
30,075 |
|
119,990 |
99,944 |
| Net interest income |
|
22,458 |
20,591 |
19,528 |
18,645 |
19,060 |
|
81,222 |
77,654 |
| Provision (reversal) for credit losses |
|
(200) |
- |
500 |
(175) |
(975) |
|
125 |
1,260 |
| Net interest income after provision for credit losses |
|
22,658 |
20,591 |
19,028 |
18,820 |
20,035 |
|
81,097 |
76,394 |
| Noninterest income |
|
|
|
|
|
|
|
|
|
| Mortgage banking income |
|
1,024 |
1,449 |
1,923 |
1,164 |
868 |
|
5,560 |
4,036 |
| Service fees on deposit accounts |
|
499 |
455 |
423 |
387 |
371 |
|
1,764 |
1,382 |
| ATM and debit card income |
|
607 |
599 |
587 |
544 |
565 |
|
2,337 |
2,245 |
| Income from bank owned life insurance |
|
407 |
401 |
384 |
377 |
361 |
|
1,569 |
1,379 |
| Other income |
|
242 |
271 |
206 |
192 |
165 |
|
911 |
818 |
| Total noninterest income |
|
2,779 |
3,175 |
3,523 |
2,664 |
2,330 |
|
12,141 |
9,860 |
| Noninterest expense |
|
|
|
|
|
|
|
|
|
| Compensation and benefits |
|
10,610 |
10,789 |
11,290 |
10,857 |
9,401 |
|
43,546 |
40,275 |
| Occupancy |
|
2,587 |
2,595 |
2,552 |
2,557 |
2,718 |
|
10,291 |
10,255 |
| Outside service and data processing costs |
|
2,003 |
1,930 |
1,962 |
1,846 |
2,000 |
|
7,741 |
7,078 |
| Insurance |
|
1,077 |
1,025 |
965 |
955 |
937 |
|
4,022 |
3,766 |
| Professional fees |
|
656 |
548 |
582 |
618 |
581 |
|
2,404 |
2,496 |
| Marketing |
|
335 |
319 |
389 |
369 |
364 |
|
1,412 |
1,357 |
| Other |
|
1,276 |
833 |
903 |
898 |
1,027 |
|
3,910 |
3,600 |
| Total noninterest expenses |
|
18,544 |
18,039 |
18,643 |
18,100 |
17,028 |
|
73,326 |
68,827 |
| Income before provision for income taxes |
|
6,893 |
5,727 |
3,908 |
3,384 |
5,337 |
|
19,912 |
17,427 |
| Income tax expense |
|
1,266 |
1,345 |
909 |
862 |
1,170 |
|
4,382 |
4,001 |
| Net income available to common shareholders |
$ |
5,627 |
4,382 |
2,999 |
2,522 |
4,167 |
|
15,530 |
13,426 |
| |
|
|
|
|
|
|
|
|
|
| Earnings per common share – Basic |
$ |
0.70 |
0.54 |
0.37 |
0.31 |
0.51 |
|
1.92 |
1.67 |
| Earnings per common share – Diluted |
|
0.70 |
0.54 |
0.37 |
0.31 |
0.51 |
|
1.91 |
1.66 |
| Basic weighted average common shares |
|
8,023 |
8,064 |
8,126 |
8,110 |
8,056 |
|
8,081 |
8,047 |
| Diluted weighted average common shares |
|
8,097 |
8,089 |
8,141 |
8,142 |
8,080 |
|
8,117 |
8,078 |
[Footnotes to table located on page 6]
Net income for the fourth quarter of 2024 was $5.6 million,
or $0.70 per diluted share, a $1.2 million increase from the third quarter of 2024 and a $1.5 million increase from the fourth quarter
of 2023. Net interest income increased $1.9 million during the fourth quarter of 2024, compared to the third quarter of 2024, and increased
$3.4 million, compared to the fourth quarter of 2023. The increase in net interest income from the prior quarter and prior year was primarily
driven by an increase in interest income on loans and a decrease in interest expense on deposits.
There was a reversal of the provision for credit losses of $200
thousand for the fourth quarter of 2024, compared to no provision for credit losses during the third quarter of 2024 and a reversal of
the provision for credit losses of $975 thousand during the fourth quarter of 2023. The provision reversal during the fourth quarter of
2024 includes a $250 thousand reversal of the provision for credit losses and a $50 thousand increase in the reserve for unfunded commitments.
The reversal of the provision for credit losses was driven by lower expected loss rates and few charge-offs, while the increase in the
reserve for unfunded commitments was driven by an increase in the balance of unfunded commitments at December 31, 2024, compared to the
previous quarter and year.
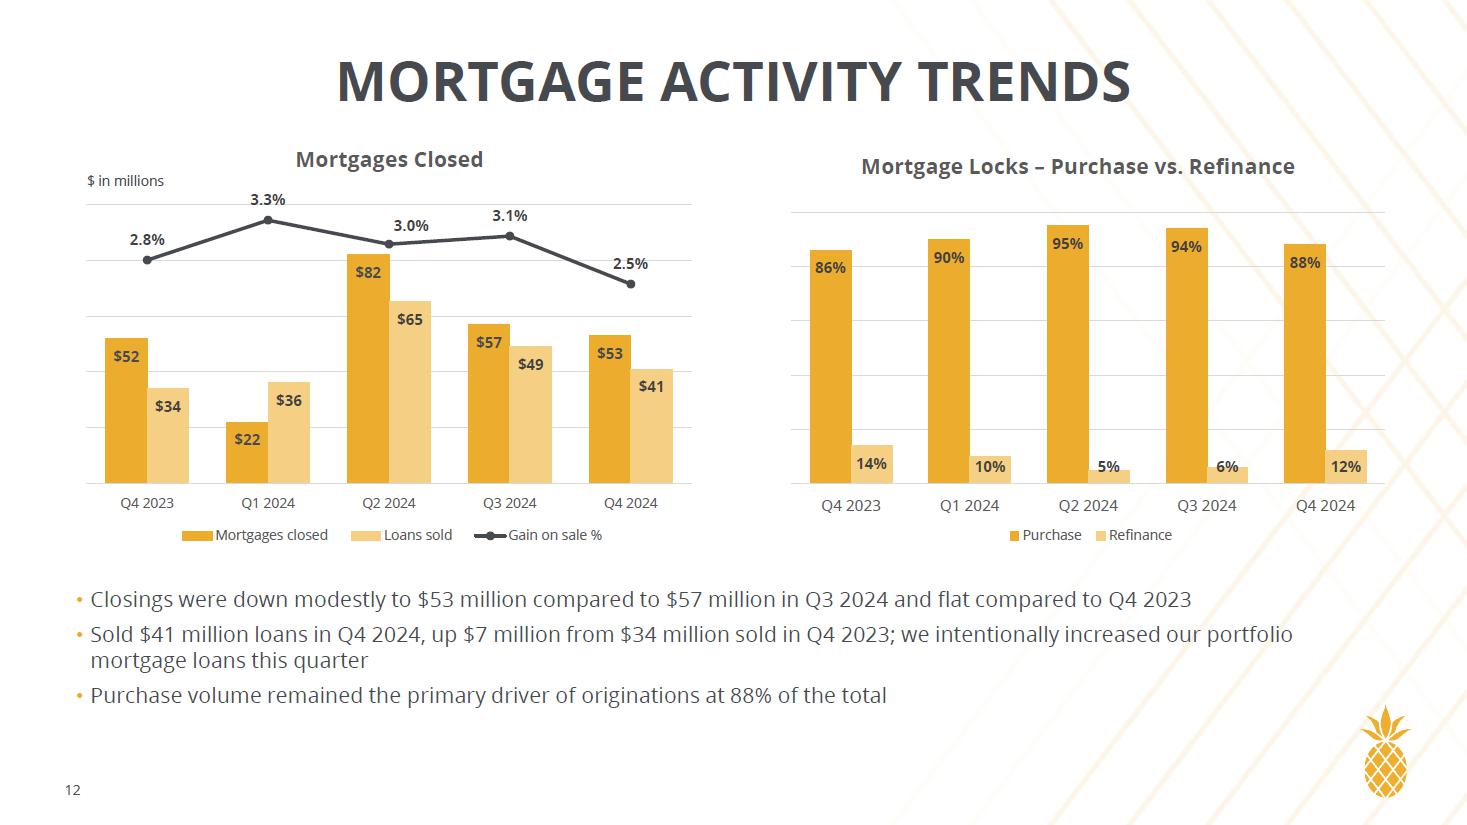
Noninterest income was $2.8 million for the fourth quarter of
2024, compared to $3.2 million for the third quarter of 2024, and $2.3 million for the fourth quarter of 2023. Mortgage banking income
continues to be the largest component of our noninterest income at $1.0 million in fee revenue for the fourth quarter of 2024, $1.4 million
for the third quarter of 2024, and $868
thousand for the fourth quarter of 2023. Mortgage closing volume
increased in the fourth quarter of 2024; however, the linked quarter decrease in fee revenue is attributable to more loans being held
in the loan portfolio with fewer sold into the secondary market.
Noninterest expense for the fourth quarter of 2024 was $18.5
million, a $505 thousand increase from the third quarter of 2024, and a $1.5 million increase from the fourth quarter of 2023. The increase
in noninterest expense from the previous quarter was driven by an increase in professional fees and other noninterest expense, which includes
increases in business tax expense, collection costs and dues and subscription expenses. The increase in noninterest expense from the previous
year related primarily to increases in compensation and benefits, insurance, and other noninterest expenses.
Our effective tax rate was 18.4% for the fourth quarter of 2024,
23.5% for the third quarter of 2024, and 21.9% for the fourth quarter of 2023. The lower tax rate in the fourth quarter of 2023 compared
to the prior quarter and prior year primarily relates to the effect of equity compensation transactions and return to provision differences
on our actual tax rate during the quarter compared to what was estimated during the year.
Net interest income and margin - Unaudited
| |
|
|
|
| |
|
For the Three Months Ended |
| |
December 31, 2024 |
September 30, 2024 |
December 31,2023 |
| (dollars in thousands) |
Average
Balance |
Income/
Expense |
Yield/
Rate(3) |
Average
Balance |
Income/
Expense |
Yield/
Rate(3) |
Average
Balance |
Income/
Expense |
Yield/
Rate(3) |
| Interest-earning assets |
|
|
|
|
|
|
|
|
|
| Federal funds sold and interest-bearing deposits |
$ 203,065 |
$ 2,465 |
4.83% |
$ 158,222 |
$ 2,209 |
5.55% |
$ 197,482 |
$ 2,703 |
5.43% |
| Investment securities, taxable |
145,932 |
1,462 |
3.99% |
137,087 |
1,370 |
3.98% |
151,969 |
1,632 |
4.26% |
| Investment securities, nontaxable(2) |
7,988 |
55 |
2.72% |
8,047 |
55 |
2.70% |
7,831 |
55 |
2.76% |
| Loans(10) |
3,620,765 |
47,163 |
5.18% |
3,629,050 |
47,550 |
5.21% |
3,586,863 |
44,758 |
4.95% |
| Total interest-earning assets |
3,977,750 |
51,145 |
5.12% |
3,932,406 |
51,184 |
5.18% |
3,944,145 |
49,148 |
4.94% |
| Noninterest-earning assets |
158,779 |
|
|
158,550 |
|
|
174,717 |
|
|
| Total assets |
$4,136,529 |
|
|
$4,090,956 |
|
|
$4,118,862 |
|
|
| Interest-bearing liabilities |
|
|
|
|
|
|
|
|
|
| NOW accounts |
$ 300,902 |
693 |
0.92% |
$ 314,669 |
835 |
1.06% |
$ 301,424 |
656 |
0.86% |
| Savings & money market |
1,492,534 |
13,525 |
3.61% |
1,523,834 |
15,287 |
3.99% |
1,697,144 |
17,042 |
3.98% |
| Time deposits |
992,335 |
11,683 |
4.68% |
909,192 |
11,603 |
5.08% |
759,839 |
9,429 |
4.92% |
| Total interest-bearing deposits |
2,785,771 |
25,901 |
3.70% |
2,747,695 |
27,725 |
4.01% |
2,758,407 |
27,127 |
3.90% |
| FHLB advances and other borrowings |
240,000 |
2,295 |
3.80% |
240,065 |
2,297 |
3.81% |
257,880 |
2,387 |
3.67% |
| Subordinated debentures |
24,903 |
478 |
7.64% |
36,261 |
558 |
6.12% |
36,305 |
561 |
6.13% |
| Total interest-bearing liabilities |
3,050,674 |
28,674 |
3.74% |
3,024,021 |
30,580 |
4.02% |
3,052,592 |
30,075 |
3.91% |
| Noninterest-bearing liabilities |
756,636 |
|
|
744,025 |
|
|
759,413 |
|
|
| Shareholders’ equity |
329,219 |
|
|
322,910 |
|
|
306,857 |
|
|
| Total liabilities and shareholders’ equity |
$4,136,529 |
|
|
$4,090,956 |
|
|
$4,118,862 |
|
|
| Net interest spread |
|
|
1.38% |
|
|
1.16% |
|
|
1.04% |
| Net interest income (tax equivalent) / margin |
|
$22,471 |
2.25% |
|
$20,604 |
2.08% |
|
$19,073 |
1.92% |
| Less: tax-equivalent adjustment(2) |
|
13 |
|
|
13 |
|
|
13 |
|
| Net interest income |
|
$22,458 |
|
|
$20,591 |
|
|
$19,060 |
|
[Footnotes to table located on page 6]
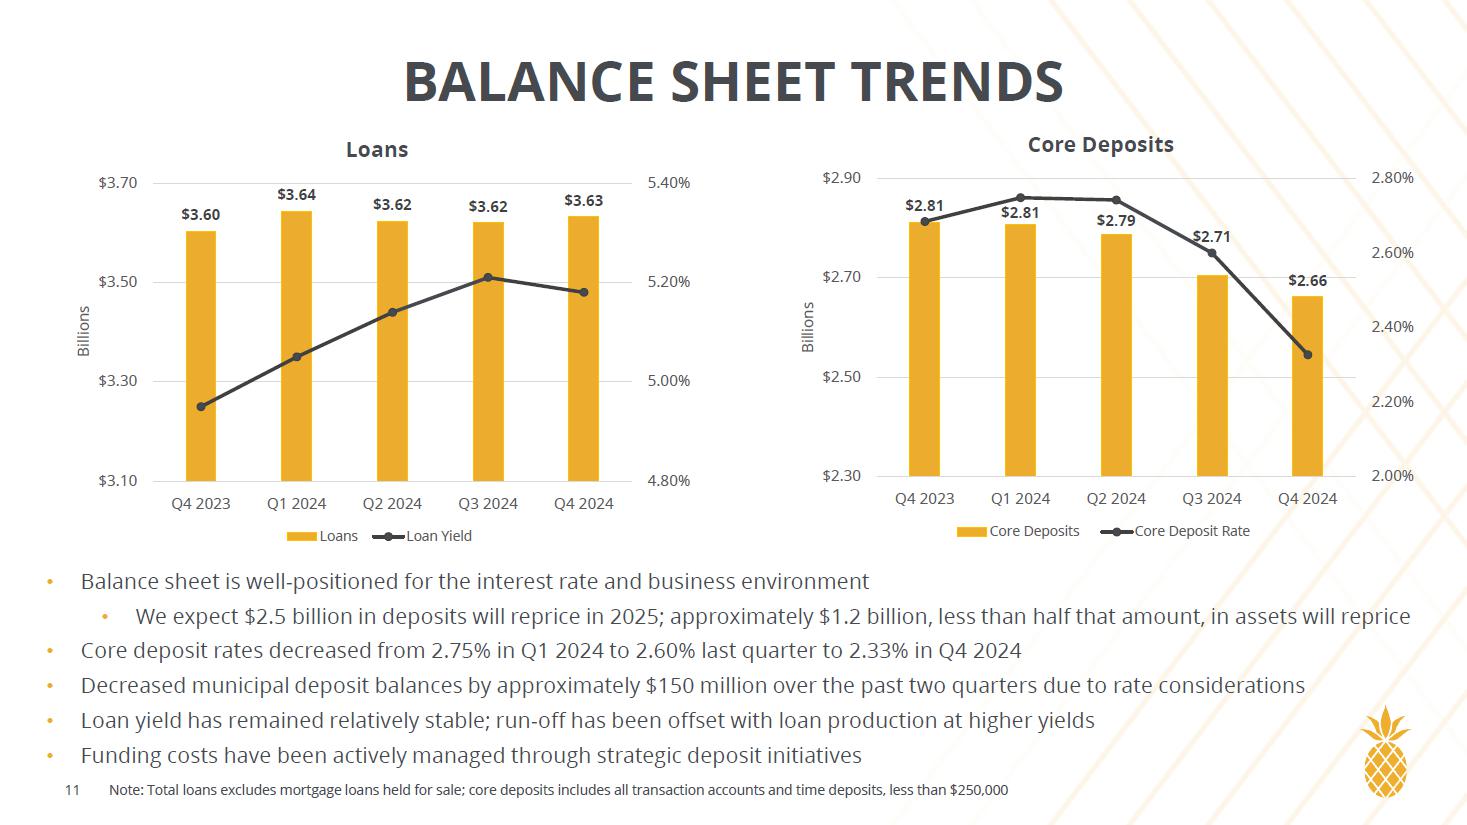
Net interest income was $22.5 million for the fourth quarter
of 2024, a $1.9 million increase from the third quarter of 2024, driven by a $1.9 million decrease in interest expense. The decrease in
interest expense was driven by a 31 basis point reduction in rate on our interest-bearing deposits over the previous quarter. In comparison
to the fourth quarter of 2023, net interest income increased $3.4 million, resulting primarily from an 18-basis point increase in the
average yield on our interest-earning assets. Our net interest margin, on a tax-equivalent basis, was 2.25% for the fourth quarter of
2024, a 17 basis point increase from 2.08% for the third quarter of 2024 and a 33 basis point increase from 1.92% for the fourth quarter
of 2023.
Balance sheets - Unaudited
| |
|
|
|
|
| |
|
Ending
Balance |
| |
|
December
31 |
September
30 |
June
30 |
March
31 |
December
31 |
| (in
thousands, except per share data) |
|
2024 |
2024 |
2024 |
2024 |
2023 |
| Assets |
|
|
|
|
|
|
| Cash and cash equivalents: |
|
|
|
|
|
|
| Cash and due from banks |
$ |
22,553 |
25,289 |
21,567 |
13,925 |
28,020 |
| Federal funds sold |
|
128,452 |
226,110 |
164,432 |
144,595 |
119,349 |
| Interest-bearing deposits with banks |
|
11,858 |
9,176 |
8,828 |
8,789 |
8,801 |
| Total cash and cash equivalents |
|
162,863 |
260,575 |
194,827 |
167,309 |
156,170 |
| Investment securities: |
|
|
|
|
|
|
| Investment securities available for sale |
|
132,127 |
134,597 |
121,353 |
125,996 |
134,702 |
| Other investments |
|
19,490 |
19,640 |
18,653 |
18,499 |
19,939 |
| Total investment securities |
|
151,617 |
154,237 |
140,006 |
144,495 |
154,641 |
| Mortgage loans held for sale |
|
4,565 |
8,602 |
14,759 |
11,842 |
7,194 |
| Loans (5) |
|
3,631,767 |
3,619,556 |
3,622,521 |
3,643,766 |
3,602,627 |
| Less allowance for credit losses |
|
(39,914) |
(40,166) |
(40,157) |
(40,441) |
(40,682) |
| Loans, net |
|
3,591,853 |
3,579,390 |
3,582,364 |
3,603,325 |
3,561,945 |
| Bank owned life insurance |
|
54,070 |
53,663 |
53,263 |
52,878 |
52,501 |
| Property and equipment, net |
|
88,794 |
90,158 |
91,533 |
93,007 |
94,301 |
| Deferred income taxes |
|
13,467 |
11,595 |
12,339 |
12,321 |
12,200 |
| Other assets |
|
20,364 |
16,411 |
20,758 |
20,527 |
16,837 |
| Total assets |
$ |
4,087,593 |
4,174,631 |
4,109,849 |
4,105,704 |
4,055,789 |
| Liabilities |
|
|
|
|
|
|
| Deposits |
$ |
3,435,765 |
3,518,825 |
3,459,869 |
3,460,681 |
3,379,564 |
| FHLB Advances |
|
240,000 |
240,000 |
240,000 |
240,000 |
275,000 |
| Subordinated debentures |
|
24,903 |
24,903 |
36,376 |
36,349 |
36,322 |
| Other liabilities |
|
56,481 |
64,365 |
54,856 |
53,418 |
52,436 |
| Total liabilities |
|
3,757,149 |
3,848,093 |
3,791,101 |
3,790,448 |
3,743,322 |
| Shareholders’ equity |
|
|
|
|
|
|
| Preferred stock - $.01 par value; 10,000,000 shares authorized |
|
- |
- |
- |
- |
- |
| Common Stock - $.01 par value; 10,000,000 shares authorized |
|
82 |
82 |
82 |
82 |
81 |
| Nonvested restricted stock |
|
(3,884) |
(4,219) |
(4,710) |
(5,257) |
(3,596) |
| Additional paid-in capital |
|
124,641 |
124,288 |
124,174 |
124,159 |
121,777 |
| Accumulated other comprehensive loss |
|
(11,472) |
(9,063) |
(11,866) |
(11,797) |
(11,342) |
| Retained earnings |
|
221,077 |
215,450 |
211,068 |
208,069 |
205,547 |
| Total shareholders’ equity |
|
330,444 |
326,538 |
318,748 |
315,256 |
312,467 |
| Total liabilities and shareholders’ equity |
$ |
4,087,593 |
4,174,631 |
4,109,849 |
4,105,704 |
4,055,789 |
| Common Stock |
|
|
|
|
|
|
| Book value per common share |
$ |
40.47 |
40.04 |
39.09 |
38.65 |
38.63 |
| Stock price: |
|
|
|
|
|
|
| High |
|
44.86 |
36.45 |
30.36 |
38.71 |
37.15 |
| Low |
|
33.26 |
27.70 |
25.70 |
29.80 |
25.16 |
| Period end |
|
39.75 |
34.08 |
29.24 |
31.76 |
37.10 |
| Common shares outstanding |
|
8,165 |
8,156 |
8,155 |
8,156 |
8,088 |
| |
|
|
|
|
|
|
|
[Footnotes to table located on page 6]
Asset quality measures
- Unaudited
| |
|
Quarter
Ended |
| |
|
December
31 |
September
30 |
June
30 |
March
31 |
December
31 |
| (dollars
in thousands) |
|
2024 |
2024 |
2024 |
2024 |
2023 |
| Nonperforming Assets |
|
|
|
|
|
|
| Commercial |
|
|
|
|
|
|
| Non-owner occupied RE |
$ |
7,641 |
7,904 |
7,949 |
1,410 |
1,423 |
| Commercial business |
|
1,016 |
838 |
829 |
488 |
319 |
| Consumer |
|
|
|
|
|
|
| Real estate |
|
1,908 |
2,448 |
1,875 |
1,380 |
985 |
| Home equity |
|
312 |
393 |
565 |
367 |
1,236 |
| Other |
|
- |
- |
- |
1 |
- |
| Total nonaccrual loans |
|
10,877 |
11,583 |
11,218 |
3,646 |
3,963 |
| Other real estate owned |
|
- |
- |
- |
- |
- |
| Total nonperforming assets |
$ |
10,877 |
11,583 |
11,218 |
3,646 |
3,963 |
| Nonperforming assets as a percentage of: |
|
|
|
|
|
|
| Total assets |
|
0.27% |
0.28% |
0.27% |
0.09% |
0.10% |
| Total loans |
|
0.30% |
0.32% |
0.31% |
0.10% |
0.11% |
| Classified assets/tier 1 capital plus allowance for credit losses |
|
4.25% |
4.35% |
4.22% |
3.99% |
4.25% |
| |
|
Quarter Ended |
| |
|
December 31 |
September 30 |
June 30 |
March 31 |
December 31 |
| (dollars in thousands) |
|
2024 |
2024 |
2024 |
2024 |
2023 |
| Allowance for Credit Losses |
|
|
|
|
|
|
| Balance, beginning of period |
$ |
40,166 |
40,157 |
40,441 |
40,682 |
41,131 |
| Loans charged-off |
|
(143) |
(118) |
(1,049) |
(424) |
(119) |
| Recoveries of loans previously charged-off |
|
141 |
127 |
15 |
183 |
310 |
| Net loans (charged-off) recovered |
|
(2) |
9 |
(1,034) |
(241) |
191 |
| Provision for (reversal of) credit losses |
|
(250) |
- |
750 |
- |
(640) |
| Balance, end of period |
$ |
39,914 |
40,166 |
40,157 |
40,441 |
40,682 |
| Allowance for credit losses to gross loans |
|
1.10% |
1.11% |
1.11% |
1.11% |
1.13% |
| Allowance for credit losses to nonaccrual loans |
|
366.94% |
346.78% |
357.95% |
1,109.13% |
1,026.58% |
| Net charge-offs (recoveries) to average loans QTD (annualized) |
|
0.00% |
0.00% |
0.11% |
0.03% |
(0.02%) |
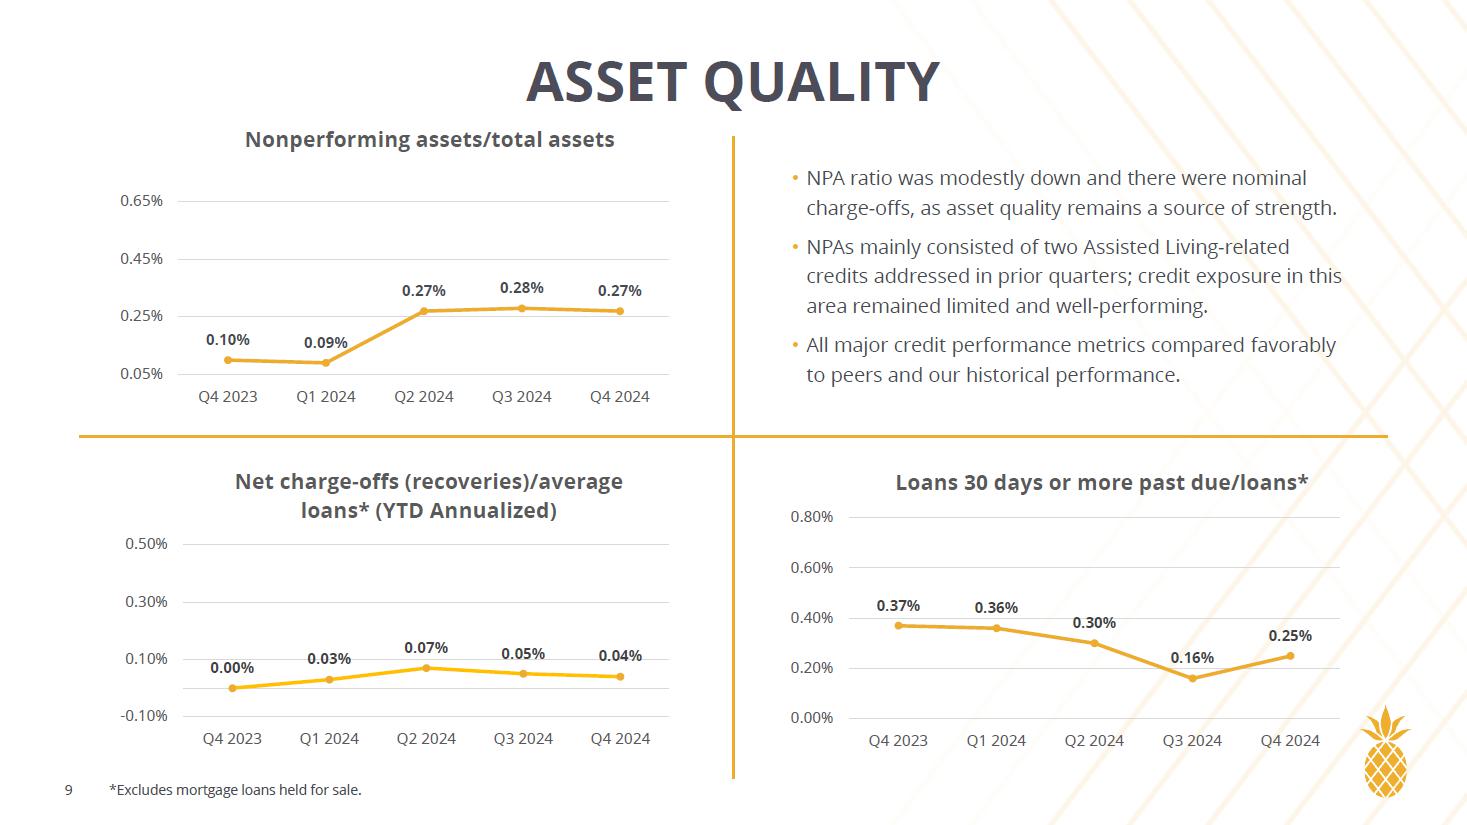
Total nonperforming assets decreased by $706 thousand during
the fourth quarter of 2024, representing 0.27% of total assets compared to 0.28% for the third quarter of 2024 and 0.10% for the fourth
quarter of 2023. While we added four new relationships to nonaccrual status during the fourth quarter of 2024, there were also seven relationships
which either returned to accrual status or paid off during the quarter. In addition, our classified asset ratio decreased to 4.25% for
the fourth quarter of 2024 from 4.35% in the third quarter of 2024 and remained unchanged at 4.25% in the fourth quarter of 2023.
At December 31, 2024, the allowance for credit losses was $39.9
million, or 1.10% of total loans, compared to $40.2 million, or 1.11% of total loans at September 30, 2024, and $40.7 million, or 1.13%
of total loans, at December 31, 2023. We had net charge-offs of $2 thousand, or 0.00% annualized, for the fourth quarter of 2024, compared
to net recoveries of $9 thousand for the third quarter of 2024 and net recoveries of $191 thousand for the fourth quarter of 2023. There
was a reversal of the provision for credit losses of $250 thousand for the fourth quarter of 2024, compared to no provision for credit
losses for the third quarter of 2024 and a reversal of the provision of credit losses of $640 thousand for the fourth quarter of 2023.
The provision reversal was driven by lower expected loss rates resulting from low charge-offs during the quarter and year.
LOAN COMPOSITION - Unaudited
| |
| |
|
Quarter Ended |
| |
|
December
31 |
September
30 |
June
30 |
March
31 |
December
31 |
| (dollars
in thousands) |
|
2024 |
2024 |
2024 |
2024 |
2023 |
| Commercial |
|
|
|
|
|
|
| Owner occupied RE |
$ |
651,597 |
642,608 |
642,008 |
631,047 |
631,657 |
| Non-owner occupied RE |
|
924,367 |
917,642 |
917,034 |
944,530 |
942,529 |
| Construction |
|
103,204 |
144,665 |
144,968 |
157,464 |
150,680 |
| Business |
|
556,117 |
521,535 |
527,017 |
520,073 |
500,161 |
| Total commercial loans |
|
2,235,285 |
2,226,450 |
2,231,027 |
2,253,114 |
2,225,027 |
| Consumer |
|
|
|
|
|
|
| Real estate |
|
1,128,629 |
1,132,371 |
1,126,155 |
1,101,573 |
1,082,429 |
| Home equity |
|
204,897 |
195,383 |
189,294 |
184,691 |
183,004 |
| Construction |
|
20,874 |
21,582 |
32,936 |
53,216 |
63,348 |
| Other |
|
42,082 |
43,770 |
43,109 |
51,172 |
48,819 |
| Total consumer loans |
|
1,396,482 |
1,393,106 |
1,391,494 |
1,390,652 |
1,377,600 |
| Total gross loans, net of deferred fees |
|
3,631,767 |
3,619,556 |
3,622,521 |
3,643,766 |
3,602,627 |
| Less—allowance for credit losses |
|
(39,914) |
(40,166) |
(40,157) |
(40,441) |
(40,682) |
| Total loans, net |
$ |
3,591,853 |
3,579,390 |
3,582,364 |
3,603,325 |
3,561,945 |
DEPOSIT COMPOSITION - Unaudited
| |
| |
|
Quarter Ended |
| |
|
December 31 |
September 30 |
June 30 |
March 31 |
December 31 |
| (dollars in thousands) |
|
2024 |
2024 |
2024 |
2024 |
2023 |
| Non-interest bearing |
$ |
683,081 |
689,749 |
683,291 |
671,708 |
674,167 |
| Interest bearing: |
|
|
|
|
|
|
| NOW accounts |
|
314,588 |
339,412 |
293,875 |
293,064 |
310,218 |
| Money market accounts |
|
1,438,530 |
1,423,403 |
1,562,786 |
1,603,796 |
1,605,278 |
| Savings |
|
31,976 |
29,283 |
28,739 |
32,248 |
31,669 |
| Time, less than $250,000 |
|
193,562 |
223,582 |
219,532 |
206,657 |
190,167 |
| Time and out-of-market deposits, $250,000 and over |
|
774,028 |
813,396 |
671,646 |
653,208 |
568,065 |
| Total deposits |
$ |
3,435,765 |
3,518,825 |
3,459,869 |
3,460,681 |
3,379,564 |
| Footnotes
to tables: |
|
| (1)
Total revenue is the sum of net interest income and noninterest income. |
| (2) The tax-equivalent
adjustment to net interest income adjusts the yield for assets earning tax-exempt income to a comparable yield on a taxable basis. |
| (3)
Annualized for the respective three-month period. |
| (4)
Noninterest expense divided by the sum of net interest income and noninterest income. |
| (5) Excludes mortgage
loans held for sale. |
| (6) Excludes out
of market deposits and time deposits greater than $250,000 totaling $774,028,000. |
| (7) December 31,
2024 ratios are preliminary. |
| (8) The common equity
tier 1 ratio is calculated as the sum of common equity divided by risk-weighted assets. |
(9) The tangible
common equity ratio is calculated as total equity less preferred stock divided by total assets. |
| (10) Includes mortgage
loans held for sale. |
About Southern First Bancshares
Southern
First Bancshares, Inc., Greenville, South Carolina is a registered bank holding company incorporated under the laws of South Carolina.
The company’s wholly owned subsidiary, Southern First Bank, is the second largest bank headquartered in South Carolina. Southern
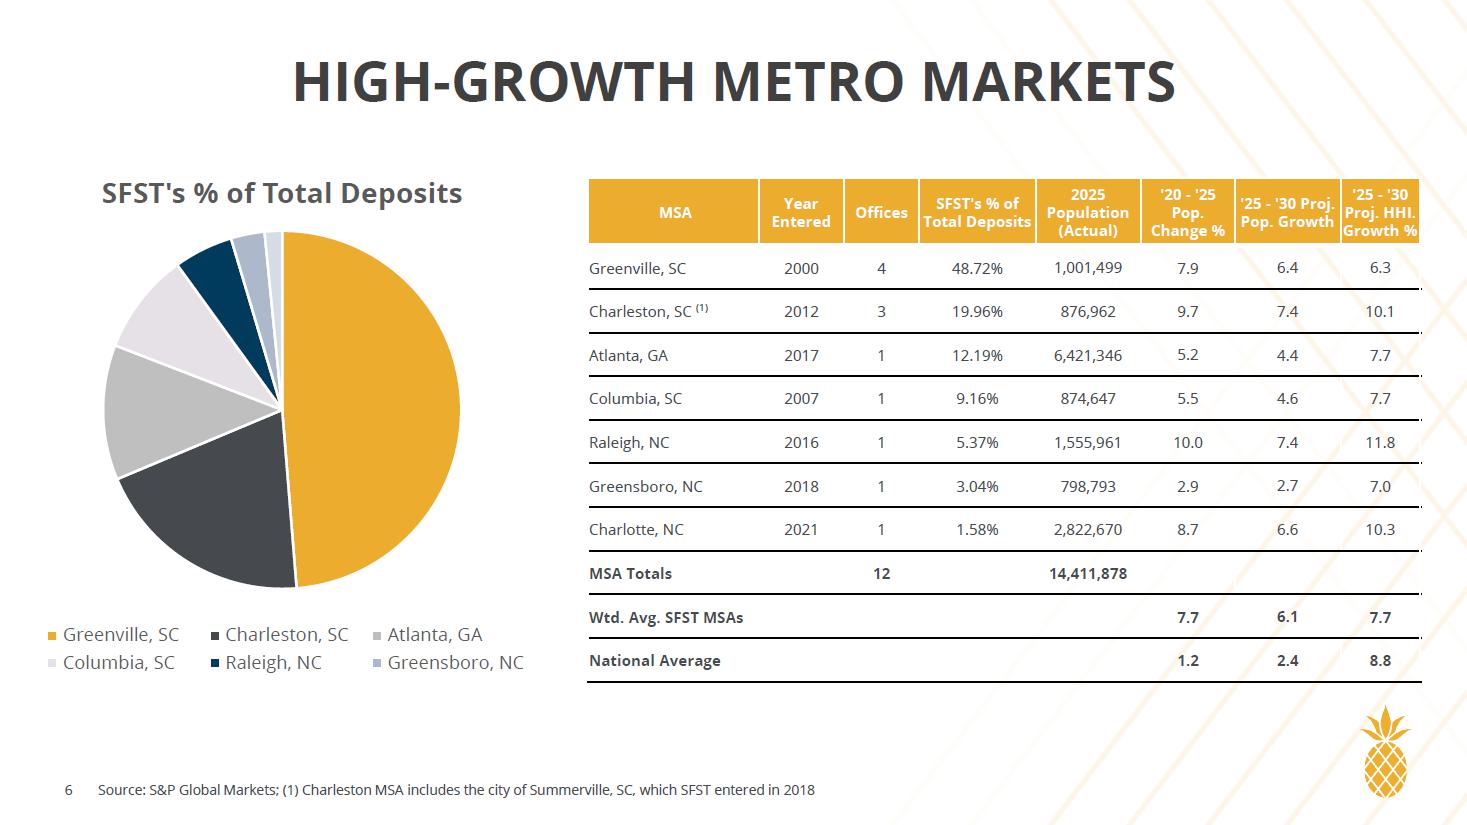
First Bank has been providing financial services since 1999 and now operates in 12 locations in the Greenville, Columbia, and Charleston
markets of South Carolina as well as the Charlotte, Triangle and Triad regions of North Carolina and Atlanta, Georgia. Southern First
Bancshares has consolidated assets of approximately $4.1 billion and its common stock is traded on The NASDAQ Global Market under the
symbol “SFST.” More information can be found at www.southernfirst.com.
FORWARD-LOOKING STATEMENTS
Certain statements in this news release contain “forward-looking
statements" within the meaning of the Private Securities Litigation Reform Act of 1995, such as statements relating to future plans
and expectations, and are thus prospective. Such forward-looking statements are identified by words such as “believe,”
“expect,” “anticipate,” “estimate,” “preliminary”, “intend,” “plan,”
“target,” “continue,” “lasting,” and “project,” as well as similar expressions. Such
statements are subject to risks, uncertainties, and other factors which could cause actual results to differ materially from future results
expressed or implied by such forward-looking statements. Although we believe that the assumptions underlying the forward-looking
statements are reasonable, any of the assumptions could prove to be inaccurate. Therefore, we can give no assurance that the results
contemplated in the forward-looking statements will be realized. The inclusion of this forward-looking information should not
be construed as a representation by our company or any person
that the future events, plans, or expectations contemplated by our company will be achieved.
The following factors, among others, could cause actual results
to differ materially from the anticipated results or other expectations expressed in the forward-looking statements: (1) competitive pressures
among depository and other financial institutions may increase significantly and have an effect on pricing, spending, third-party relationships
and revenues; (2) the strength of the United States economy in general and the strength of the local economies in which the company conducts
operations may be different than expected; (3) the rate of delinquencies and amounts of charge-offs, the level of allowance for credit
loss, the rates of loan and deposit growth as well as pricing of each product, or adverse changes in asset quality in our loan portfolio,
which may result in increased credit risk-related losses and expenses; (4) changes in legislation, regulation, policies, or administrative
practices, whether by judicial, governmental, or legislative action, including, but not limited to, changes affecting oversight of the
financial services industry or consumer protection; (5) the impact of changes to Congress and the office of the President on the regulatory
landscape and capital markets; (6) adverse conditions in the stock market, the public debt market and other capital markets (including
changes in interest rate conditions) could continue to have a negative impact on the company; (7) changes in interest rates, which may
continue to affect the company’s net income, interest expense, prepayment penalty income, mortgage banking income, and other future
cash flows, or the market value of the company’s assets, including its investment securities; (8) elevated inflation which may cause
adverse risk to the overall economy, and could indirectly pose challenges to our clients and to our business; (9) any increase in FDIC
assessments which have increased and may continue to increase our cost of doing business; and (10) changes in accounting principles, policies,
practices, or guidelines. Additional factors that could cause our results to differ materially from those described in the forward-looking
statements can be found in our reports (such as Annual Reports on Form 10-K, Quarterly Reports on Form 10-Q and Current Reports on Form
8-K) filed with the SEC and available at the SEC’s Internet site (http://www.sec.gov). All subsequent written and oral forward-looking
statements concerning the company or any person acting on its behalf is expressly qualified in its entirety by the cautionary statements
above. We do not undertake any obligation to update any forward-looking statement to reflect circumstances or events that occur after
the date the forward-looking statements are made, except as required by law.
FINANCIAL & MEDIA CONTACT:
ART SEAVER 864-679-9010
WEB SITE: www.southernfirst.com
Exhibit 99.2


v3.24.4
Cover
|
Jan. 28, 2025 |
| Entity Addresses [Line Items] |
|
| Document Type |
8-K
|
| Amendment Flag |
false
|
| Document Period End Date |
Jan. 28, 2025
|
| Entity File Number |
000-27719
|
| Entity Registrant Name |
Southern
First Bancshares, Inc.
|
| Entity Central Index Key |
0001090009
|
| Entity Tax Identification Number |
58-2459561
|
| Entity Incorporation, State or Country Code |
SC
|
| Entity Address, Address Line One |
6
Verdae Boulevard
|
| Entity Address, City or Town |
Greenville
|
| Entity Address, State or Province |
SC
|
| Entity Address, Postal Zip Code |
29607
|
| City Area Code |
864
|
| Local Phone Number |
679-9000
|
| Written Communications |
false
|
| Soliciting Material |
false
|
| Pre-commencement Tender Offer |
false
|
| Pre-commencement Issuer Tender Offer |
false
|
| Title of 12(b) Security |
Common Stock
|
| Trading Symbol |
SFST
|
| Security Exchange Name |
NASDAQ
|
| Entity Emerging Growth Company |
false
|
| Former Address [Member] |
|
| Entity Addresses [Line Items] |
|
| Entity Address, Address Line One |
100 Verdae Boulevard
|
| Entity Address, Address Line Two |
Suite 100
|
| Entity Address, City or Town |
Greenville
|
| Entity Address, State or Province |
SC
|
| X |
- DefinitionBoolean flag that is true when the XBRL content amends previously-filed or accepted submission.
| Name: |
dei_AmendmentFlag |
| Namespace Prefix: |
dei_ |
| Data Type: |
xbrli:booleanItemType |
| Balance Type: |
na |
| Period Type: |
duration |
|
| X |
- DefinitionFor the EDGAR submission types of Form 8-K: the date of the report, the date of the earliest event reported; for the EDGAR submission types of Form N-1A: the filing date; for all other submission types: the end of the reporting or transition period. The format of the date is YYYY-MM-DD.
| Name: |
dei_DocumentPeriodEndDate |
| Namespace Prefix: |
dei_ |
| Data Type: |
xbrli:dateItemType |
| Balance Type: |
na |
| Period Type: |
duration |
|
| X |
- DefinitionThe type of document being provided (such as 10-K, 10-Q, 485BPOS, etc). The document type is limited to the same value as the supporting SEC submission type, or the word 'Other'.
| Name: |
dei_DocumentType |
| Namespace Prefix: |
dei_ |
| Data Type: |
dei:submissionTypeItemType |
| Balance Type: |
na |
| Period Type: |
duration |
|
| X |
- DefinitionAddress Line 1 such as Attn, Building Name, Street Name
| Name: |
dei_EntityAddressAddressLine1 |
| Namespace Prefix: |
dei_ |
| Data Type: |
xbrli:normalizedStringItemType |
| Balance Type: |
na |
| Period Type: |
duration |
|
| X |
- DefinitionAddress Line 2 such as Street or Suite number
| Name: |
dei_EntityAddressAddressLine2 |
| Namespace Prefix: |
dei_ |
| Data Type: |
xbrli:normalizedStringItemType |
| Balance Type: |
na |
| Period Type: |
duration |
|
| X |
- Definition
+ References
+ Details
| Name: |
dei_EntityAddressCityOrTown |
| Namespace Prefix: |
dei_ |
| Data Type: |
xbrli:normalizedStringItemType |
| Balance Type: |
na |
| Period Type: |
duration |
|
| X |
- DefinitionCode for the postal or zip code
| Name: |
dei_EntityAddressPostalZipCode |
| Namespace Prefix: |
dei_ |
| Data Type: |
xbrli:normalizedStringItemType |
| Balance Type: |
na |
| Period Type: |
duration |
|
| X |
- DefinitionName of the state or province.
| Name: |
dei_EntityAddressStateOrProvince |
| Namespace Prefix: |
dei_ |
| Data Type: |
dei:stateOrProvinceItemType |
| Balance Type: |
na |
| Period Type: |
duration |
|
| X |
- DefinitionLine items represent financial concepts included in a table. These concepts are used to disclose reportable information associated with domain members defined in one or many axes to the table.
| Name: |
dei_EntityAddressesLineItems |
| Namespace Prefix: |
dei_ |
| Data Type: |
xbrli:stringItemType |
| Balance Type: |
na |
| Period Type: |
duration |
|
| X |
- DefinitionA unique 10-digit SEC-issued value to identify entities that have filed disclosures with the SEC. It is commonly abbreviated as CIK. Reference 1: http://www.xbrl.org/2003/role/presentationRef
-Publisher SEC
-Name Exchange Act
-Number 240
-Section 12
-Subsection b-2
| Name: |
dei_EntityCentralIndexKey |
| Namespace Prefix: |
dei_ |
| Data Type: |
dei:centralIndexKeyItemType |
| Balance Type: |
na |
| Period Type: |
duration |
|
| X |
- DefinitionIndicate if registrant meets the emerging growth company criteria. Reference 1: http://www.xbrl.org/2003/role/presentationRef
-Publisher SEC
-Name Exchange Act
-Number 240
-Section 12
-Subsection b-2
| Name: |
dei_EntityEmergingGrowthCompany |
| Namespace Prefix: |
dei_ |
| Data Type: |
xbrli:booleanItemType |
| Balance Type: |
na |
| Period Type: |
duration |
|
| X |
- DefinitionCommission file number. The field allows up to 17 characters. The prefix may contain 1-3 digits, the sequence number may contain 1-8 digits, the optional suffix may contain 1-4 characters, and the fields are separated with a hyphen.
| Name: |
dei_EntityFileNumber |
| Namespace Prefix: |
dei_ |
| Data Type: |
dei:fileNumberItemType |
| Balance Type: |
na |
| Period Type: |
duration |
|
| X |
- DefinitionTwo-character EDGAR code representing the state or country of incorporation.
| Name: |
dei_EntityIncorporationStateCountryCode |
| Namespace Prefix: |
dei_ |
| Data Type: |
dei:edgarStateCountryItemType |
| Balance Type: |
na |
| Period Type: |
duration |
|
| X |
- DefinitionThe exact name of the entity filing the report as specified in its charter, which is required by forms filed with the SEC. Reference 1: http://www.xbrl.org/2003/role/presentationRef
-Publisher SEC
-Name Exchange Act
-Number 240
-Section 12
-Subsection b-2
| Name: |
dei_EntityRegistrantName |
| Namespace Prefix: |
dei_ |
| Data Type: |
xbrli:normalizedStringItemType |
| Balance Type: |
na |
| Period Type: |
duration |
|
| X |
- DefinitionThe Tax Identification Number (TIN), also known as an Employer Identification Number (EIN), is a unique 9-digit value assigned by the IRS. Reference 1: http://www.xbrl.org/2003/role/presentationRef
-Publisher SEC
-Name Exchange Act
-Number 240
-Section 12
-Subsection b-2
| Name: |
dei_EntityTaxIdentificationNumber |
| Namespace Prefix: |
dei_ |
| Data Type: |
dei:employerIdItemType |
| Balance Type: |
na |
| Period Type: |
duration |
|
| X |
- DefinitionLocal phone number for entity.
| Name: |
dei_LocalPhoneNumber |
| Namespace Prefix: |
dei_ |
| Data Type: |
xbrli:normalizedStringItemType |
| Balance Type: |
na |
| Period Type: |
duration |
|
| X |
- DefinitionBoolean flag that is true when the Form 8-K filing is intended to satisfy the filing obligation of the registrant as pre-commencement communications pursuant to Rule 13e-4(c) under the Exchange Act. Reference 1: http://www.xbrl.org/2003/role/presentationRef
-Publisher SEC
-Name Exchange Act
-Number 240
-Section 13e
-Subsection 4c
| Name: |
dei_PreCommencementIssuerTenderOffer |
| Namespace Prefix: |
dei_ |
| Data Type: |
xbrli:booleanItemType |
| Balance Type: |
na |
| Period Type: |
duration |
|
| X |
- DefinitionBoolean flag that is true when the Form 8-K filing is intended to satisfy the filing obligation of the registrant as pre-commencement communications pursuant to Rule 14d-2(b) under the Exchange Act. Reference 1: http://www.xbrl.org/2003/role/presentationRef
-Publisher SEC
-Name Exchange Act
-Number 240
-Section 14d
-Subsection 2b
| Name: |
dei_PreCommencementTenderOffer |
| Namespace Prefix: |
dei_ |
| Data Type: |
xbrli:booleanItemType |
| Balance Type: |
na |
| Period Type: |
duration |
|
| X |
- DefinitionTitle of a 12(b) registered security. Reference 1: http://www.xbrl.org/2003/role/presentationRef
-Publisher SEC
-Name Exchange Act
-Number 240
-Section 12
-Subsection b
| Name: |
dei_Security12bTitle |
| Namespace Prefix: |
dei_ |
| Data Type: |
dei:securityTitleItemType |
| Balance Type: |
na |
| Period Type: |
duration |
|
| X |
- DefinitionName of the Exchange on which a security is registered. Reference 1: http://www.xbrl.org/2003/role/presentationRef
-Publisher SEC
-Name Exchange Act
-Number 240
-Section 12
-Subsection d1-1
| Name: |
dei_SecurityExchangeName |
| Namespace Prefix: |
dei_ |
| Data Type: |
dei:edgarExchangeCodeItemType |
| Balance Type: |
na |
| Period Type: |
duration |
|
| X |
- DefinitionBoolean flag that is true when the Form 8-K filing is intended to satisfy the filing obligation of the registrant as soliciting material pursuant to Rule 14a-12 under the Exchange Act. Reference 1: http://www.xbrl.org/2003/role/presentationRef
-Publisher SEC
-Name Exchange Act
-Number 240
-Section 14a
-Subsection 12
| Name: |
dei_SolicitingMaterial |
| Namespace Prefix: |
dei_ |
| Data Type: |
xbrli:booleanItemType |
| Balance Type: |
na |
| Period Type: |
duration |
|
| X |
- DefinitionTrading symbol of an instrument as listed on an exchange.
| Name: |
dei_TradingSymbol |
| Namespace Prefix: |
dei_ |
| Data Type: |
dei:tradingSymbolItemType |
| Balance Type: |
na |
| Period Type: |
duration |
|
| X |
- DefinitionBoolean flag that is true when the Form 8-K filing is intended to satisfy the filing obligation of the registrant as written communications pursuant to Rule 425 under the Securities Act. Reference 1: http://www.xbrl.org/2003/role/presentationRef
-Publisher SEC
-Name Securities Act
-Number 230
-Section 425
| Name: |
dei_WrittenCommunications |
| Namespace Prefix: |
dei_ |
| Data Type: |
xbrli:booleanItemType |
| Balance Type: |
na |
| Period Type: |
duration |
|
Southern First Bancshares (NASDAQ:SFST)
Historical Stock Chart
From Jan 2025 to Feb 2025

Southern First Bancshares (NASDAQ:SFST)
Historical Stock Chart
From Feb 2024 to Feb 2025
