New Concept Energy, Inc. Reports First Quarter 2018 Results
May 15 2018 - 4:30PM
Business Wire
New Concept Energy, Inc. (NYSE American: GBR), (the “Company” or
“NCE”) a Dallas-based oil and gas company, today reported a net
loss from continuing operations for the three months ended March
31, 2018 of $134,000 or ($0.07) per share, compared to net loss
from continuing operations of $172,000 or ($0.09) per share for the
three months ended March 31, 2017.
The Company reported a net loss of $134,000 for three months
ended March 31, 2018, as compared to net loss of $159,000 for the
similar period in 2017.
For the three months ended March 31, 2018, the Company recorded
oil and gas revenues of $204,000 as compared to $195,000 for the
comparable period of 2017.
For the three months ended March 31, 2018, the Company recorded
oil and gas operating expenses of $275,000 as compared to $256,000
for the comparable period of 2017. The increase was due to overall
increase in general operating expenses.
For the three months ended March 31, 2018, corporate general
& administrative expenses were $75,000 as compared to $100,000
for the comparable periods in 2016. The decrease was due to a
decrease in payroll expenses of $23,000 as well as other
administrative costs.
NEW CONCEPT ENERGY, INC. AND SUBSIDIARIES
CONSOLIDATED BALANCE SHEETS (amounts in thousands)
March 31, December 31,
2018 2017 Assets Current assets
Cash and cash equivalents $ 397 $ 419 Accounts receivable from oil
and gas sales 58 67 Current portion note receivable 47
36
Total current assets 502 522
Oil and natural gas properties (full cost accounting
method) Proved developed and undeveloped oil and gas
properties, net of depletion 2,669 2,721
Property and
equipment, net of depreciation Land, buildings and equipment -
oil and gas operations 647 661
Note Receivable
278 301
Total assets $ 4,096 $ 4,205
NEW CONCEPT ENERGY, INC. AND SUBSIDIARIES
CONSOLIDATED BALANCE SHEETS - CONTINUED (amounts in
thousands, except share amounts)
March 31, December 31, 2018
2017 Liabilities and
stockholders' equity Current liabilities Accounts
payable - (including $433 and $412 due to related parties in 2018
and 2017) $ 464 $ 446 Accrued expenses 58 29 Current portion of
long term debt 68 81
Total current
liabilities 590 556
Long-term debt Notes payable
less current portion 234 243 Asset retirement obligation
2,770 2,770
Total liabilities 3,594
3,569
Stockholders' equity Preferred stock, Series B
1 1 Common stock, $.01 par value; authorized, 100,000,000 shares;
issued and outstanding, 2,036,935 shares at March 31, 2018 and
December 31, 2017 21 21 Additional paid-in capital 59,000 59,000
Accumulated deficit
(58,520 )
(58,386 ) Total
shareholders' equity
502
636 Total liabilities &
equity $ 4,096 $ 4,205
NEW
CONCEPT ENERGY, INC AND SUBSIDIARIES CONSOLIDATED STATEMENT
OF OPERATIONS (unaudited) (amounts in thousands,
except per share data) For the
Three Months ended March 31, 2018
2017 Revenue Oil and gas operations,
net of royalties $ 204 $ 195 Total Revenues
204 195
Operating
expenses Oil and gas operations 275 256 Corporate general and
administrative 75 100 Total Operating
Expenses 350 356 Operating earnings
(loss) (146 ) (161 )
Other income (expense) Interest
income 7 4 Interest expense (6 ) (7 ) Other income (expense), net
11 (8 ) Expense 12 (11 )
Earnings (loss) from continuing operations (134 ) (172 )
Earnings from discontinued operations 0
13 Net income (loss) applicable to common shares $
(134 ) $ (159 ) Net (loss) per common share from continuing
operations $ (0.07 ) $ (0.09 ) Net income per common share
from discontinued operations $ - $ 0.01 Net
income (loss) per common share-basic and diluted $ (0.07 ) $ (0.08
) Weighted average common and equivalent shares outstanding
- basic 2,037 1,947
View source
version on businesswire.com: https://www.businesswire.com/news/home/20180515006598/en/
New Concept Energy Inc.Investor RelationsGene Bertcher,
800-400-6407info@newconceptenergy.com
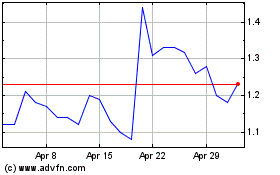
New Concept Energy (AMEX:GBR)
Historical Stock Chart
From May 2024 to Jun 2024

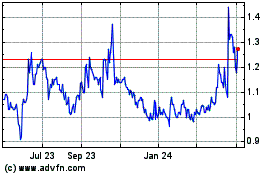
New Concept Energy (AMEX:GBR)
Historical Stock Chart
From Jun 2023 to Jun 2024
