BioSyent Releases Results for Q1 2018
May 30 2018 - 8:00AM

BioSyent Inc. (“BioSyent”) (TSX Venture:RX) released today a
summary of its financial results for the three months ended March
31, 2018. Key highlights include:
- First quarter (Q1) 2018 Net Revenues of $4,447,147 increased by
16% versus Q1 2017
- Q1 2018 Canadian Pharmaceutical Net Revenues of $3,765,638
increased by 12% versus Q1 2017 and International Pharmaceutical
Net Revenues of $565,841 increased by 90% versus Q1 2017
- Q1 2018 EBITDA1 of $1,477,767 increased by 24% versus Q1
2017
- Q1 2018 Net Income After Tax (NIAT) of $1,143,130 increased by
27% versus Q1 2017
- Q1 2018 NIAT percentage to Net Revenues of 26% compares to 24%
in Q1 2017
- Q1 2018 Fully Diluted EPS of $0.08 was $0.02 higher than Q1
2017 Fully Diluted EPS of $0.06
- Fully Diluted EPS for the Trailing Twelve Months ended March
31, 2018 was $0.38 as compared to $0.29 for the Trailing Twelve
Months ended March 31, 2017
- As at March 31, 2018, the Company had cash, cash equivalents,
and short term investments totalling $19,639,606 as compared to
$19,338,435 as at December 31, 2017 – a 2% increase
- Total Shareholders’ Equity increased by 6% from $22,212,927 at
December 31, 2017 to $23,436,253 at March 31, 2018
- Return on Equity for the Trailing Twelve Months ended March 31,
2018 was 26% as compared to 28% for the Trailing Twelve Months
ended March 31, 2017
“Q1 2018 was BioSyent’s 31st consecutive
profitable quarter,” remarked René Goehrum, President and CEO of
BioSyent. “Overall, we had a solid start to the year in our
Canadian and International pharmaceutical businesses and maintained
a healthy net profit margin of 26%. While we are pleased with the
sales growth in our International pharmaceutical business, we have
come to expect some quarterly variability in this business.
We are also pleased that subsequent to Q1 2018, four additional
Canadian hospital sites have recently adopted and ordered our
Cysview® product for blue-light cystoscopy.”
The CEO’s presentation on the Q1 2018 Results is
available at the following link: www.biosyent.com/q1-18/.
The Company’s Interim Unaudited Condensed
Consolidated Financial Statements and Management's Discussion and
Analysis for the three months ended March 31, 2018 and 2017 will be
posted on www.sedar.com on May 30, 2018.
The Interim Unaudited Condensed
Consolidated Financial Statements are available
at http://resource.globenewswire.com/Resource/Download/db6ef13a-24ab-43d0-b2b1-7f6f2654a99e.
The Management's Discussion and Analysis is
available
at http://resource.globenewswire.com/Resource/Download/877fee71-5dc2-4511-8677-59b824d29d8c.
The Company is also pleased to announce the
election of Mr. Joseph Arcuri, CPA, CA, to its Board of Directors
on May 29, 2018. Mr. Arcuri was elected to the Board by
shareholders at the Company’s recent Annual General Meeting to fill
a vacancy left by Mr. Paul Montador who retired and did not seek
re-election to the Board of Directors. Mr. Arcuri was
appointed to the Audit Committee of BioSyent’s Board of Directors
where he will serve as its Chair.
Mr. Arcuri is an accomplished senior executive
with extensive financial expertise. Mr. Arcuri presently
serves as Executive Vice President, Operations and Finance, Content
Group, at St. Joseph Communications, a marketing communications
firm. Mr. Arcuri previously served as Chief Operating and
Chief Financial Officer at TableRock Media Ltd., a streaming
service company. In 2012, Mr. Arcuri was Chief Financial
Officer of GlassBOX Television Inc., a television service provider.
Between 2007 and 2011, Mr. Arcuri was President of AOL Canada Inc.,
an internet service provider and previously led Bell Canada’s
managed services group. Mr. Arcuri started his professional
career with PricewaterhouseCoopers within its assurance group and
later transferred to its valuation, and mergers and acquisitions
service team.
“On behalf of the Board of Directors, I want to
express our gratitude to Mr. Paul Montador for his service on the
Board since 2011 and his contribution to the success of BioSyent,”
commented René Goehrum. “I am pleased to welcome Mr. Joseph Arcuri
to our Board of Directors. He brings extensive experience and
financial knowledge which will serve the Company well in Mr.
Arcuri’s role as Audit Committee Chair.”
The Company also wishes to announce that its
Board of Directors has passed a resolution to grant a total of
3,120 stock options to a director of BioSyent. The option
grant is made under the Company’s Incentive Stock Option Plan (“the
Plan”) approved by shareholders on May 29, 2018. Each option
entitles the optionee to purchase one common share of the Company
at an exercise price of $9.94. These options are
excerciseable for a period of ten years from the date of grant.
For a direct market quote for the TSX Venture
Exchange and other Company financial information please visit
www.tmxmoney.com.
About BioSyent Inc.
Listed on the TSX Venture Exchange under the
trading symbol “RX”, BioSyent is a profitable growth-oriented
specialty pharmaceutical company focused on in-licensing or
acquiring innovative pharmaceutical and other healthcare products
that have been successfully developed, are safe and effective, and
have a proven track record of improving the lives of
patients. BioSyent supports the healthcare professionals that
treat these patients by marketing its products through its
community, hospital and international business units.
As of the date of this press release, the
Company has 14,509,095 common shares issued and outstanding.
| BioSyent Inc. |
| Interim Unaudited Condensed Consolidated
Statements of Comprehensive Income |
| |
|
|
|
|
In Canadian Dollars |
Q1 2018 |
|
Q1 2017 |
|
% Change |
|
|
Net Revenues |
4,447,147 |
|
3,821,262 |
|
16 |
% |
|
Cost Of Goods Sold |
1,030,894 |
|
789,030 |
|
31 |
% |
|
Gross Profit |
3,416,253 |
|
3,032,232 |
|
13 |
% |
|
Operating Expenses and Finance Income |
1,922,554 |
|
1,849,805 |
|
4 |
% |
|
Net Income Before Tax |
1,493,699 |
|
1,182,427 |
|
26 |
% |
|
Tax (including Deferred Tax) |
350,569 |
|
280,871 |
|
25 |
% |
|
Net Income After Tax |
1,143,130 |
|
901,556 |
|
27 |
% |
|
Net Income After Tax % to Net Revenues |
26 |
% |
24 |
% |
|
|
EBITDA |
1,477,767 |
|
1,191,324 |
|
24 |
% |
|
EBITDA % to Net Revenues |
33 |
% |
31 |
% |
|
| |
|
|
|
|
|
- EBITDA –
is a Non-IFRS Financial Measure. The term EBITDA does not
have any standardized meaning under International Financial
Reporting Standards (IFRS) and therefore may not be comparable to
similar measures presented by other companies. The Company defines
EBITDA as earnings before interest income or expense, income taxes,
depreciation and amortization.
| BioSyent Inc. |
| Interim Unaudited Condensed Consolidated
Statements of Financial Position |
| |
|
|
|
|
|
|
| AS
AT |
|
March 31, 2018 |
December 31, 2017 |
% Change |
| ASSETS |
|
|
|
|
|
|
|
|
|
|
| Trade and other
receivables |
|
$ |
2,200,887 |
$ |
2,236,695 |
-2 |
% |
| Inventory |
|
|
1,193,960 |
|
908,825 |
31 |
% |
| Prepaid expenses and
deposits |
|
|
469,916 |
|
147,326 |
219 |
% |
| Income tax
recoverable |
|
|
- |
|
71,924 |
-100 |
% |
| Cash, cash equivalents
and short-term investments |
|
|
19,639,606 |
|
19,338,435 |
2 |
% |
| Current Assets |
|
|
23,504,369 |
|
22,703,205 |
4 |
% |
|
|
|
|
|
|
| Equipment |
|
|
288,382 |
|
290,926 |
-1 |
% |
| Intangible assets |
|
|
1,686,323 |
|
1,670,210 |
1 |
% |
| Loans receivable |
|
|
394,825 |
|
393,860 |
1 |
% |
| Deferred tax asset |
|
|
53,464 |
|
46,647 |
15 |
% |
| TOTAL NON CURRENT
ASSETS |
|
|
2,422,994 |
|
2,401,643 |
1 |
% |
| TOTAL ASSETS |
|
$ |
25,927,363 |
$ |
25,104,848 |
3 |
% |
| |
|
|
|
|
| LIABILITIES AND
SHAREHOLDERS' EQUITY |
|
|
|
|
| |
|
|
|
|
| Current
liabilities |
|
$ |
2,206,345 |
$ |
2,615,594 |
-16 |
% |
| Deferred tax
liability |
|
|
284,765 |
|
276,327 |
3 |
% |
| Long term debt |
|
|
- |
|
- |
0 |
% |
| Total Equity |
|
|
23,436,253 |
|
22,212,927 |
6 |
% |
| TOTAL LIABILITIES AND
SHAREHOLDERS' EQUITY |
|
$ |
25,927,363 |
$ |
25,104,848 |
3 |
% |
| |
|
|
|
|
|
|
|
For further information please
contact:
Mr. René C. GoehrumPresident and CEOBioSyent
Inc.Tel: (905) 206-0013E-Mail: investors@biosyent.comWeb:
www.biosyent.com
This press release may contain information or statements that
are forward-looking. The contents herein represent our judgment, as
at the release date, and are subject to risks and uncertainties
that may cause actual results or outcomes to be materially
different from the forward-looking information or statements.
Potential risks may include, but are not limited to, those
associated with clinical trials, product development, future
revenue, operations, profitability and obtaining regulatory
approvals.
Neither TSX Venture Exchange nor its Regulation Services
Provider (as that term is defined in the policies of the TSX
Venture Exchange) accepts responsibility for the adequacy or
accuracy of this press release.
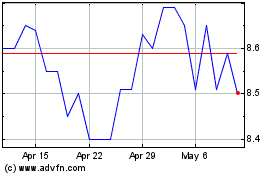
Biosyent (TSXV:RX)
Historical Stock Chart
From Mar 2024 to Apr 2024

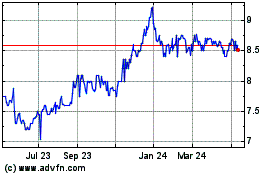
Biosyent (TSXV:RX)
Historical Stock Chart
From Apr 2023 to Apr 2024
