Comerica Marginally Beats on Earnings - Analyst Blog
April 16 2013 - 10:38AM
Zacks
Comerica Inc. (CMA) reported first quarter 2013
earnings of 70 cents per share, beating the Zacks Consensus
Estimate of 67 cents. Moreover, results surpassed the year-ago
quarter earnings per share of 68 cents.
Comerica’s results reflected reduced expenses. Further, growth in
average loans and improved credit metrics were positives. However,
a decline in revenues was the headwind.
The company reported a net income of $134.0 million, up 3% from
$130.0 million recorded in the prior quarter.
Comerica’s total revenue of $646 million in the quarter was down 2%
sequentially. However, it surpassed the Zacks Consensus Estimate of
$620 million.
Quarter in Detail
Comerica’s net interest income declined 2% sequentially to $416
million. The decline was mainly due to two lesser days of operation
in the reported quarter, lower loan yields due to shifts in the
loan portfolio mix, decline in LIBOR, lower accretion of the
purchase discount on the acquired loan portfolio and lower
reinvestment yields on mortgage-backed investment securities and a
decrease in average balances. These negatives were partly mitigated
by an increase in loan volumes and a decrease in funding costs.
Net interest margin went up by 1 basis point sequentially to 2.88%.
The sequential increase was mainly due to the benefit provided by a
decrease in excess liquidity and lower deposit costs, partially
offset by lower loan yields, lower accretion on the acquired loan
portfolio and lower yields on mortgage-backed investment
securities.
Average loans marginally grew 1% to $44.6 billion sequentially.
This was driven by an increase in commercial loans, partially
offset by a decrease in combined commercial mortgage and real
estate construction loans. Average deposits decreased 1% from the
prior quarter to $50.7, largely attributable to a decrease in non
interest-bearing deposits.
Comerica’s non-interest income came in at $200 million, down 2%
sequentially. The sequential decline was mainly due to decreases in
customer derivative income and commercial lending fees, partially
offset by a seasonal increase in service charges on deposit
accounts.
Non-interest expenses totaled $416 million, down 3% sequentially.
The decrease was mainly due to a decline in salaries expense and
severance expense, decreased net occupancy expense, lower
restructuring expenses and other real estate expense, partially
offset by an increase in employee benefits expense on the back of
higher pension expense.
Credit Quality
Credit quality showed improvement at Comerica. Net credit-related
charge-offs declined 35% sequentially and 47% year over year to $24
million.
Non-performing assets to total loans and foreclosed property stood
at 1.23% in the reported quarter compared with 1.29% in the prior
quarter and 2.14% in the year-ago quarter.
Provision for credit losses remained stable sequentially but
declined 27% year over year to $16 million. The allowance for loan
losses to total loans ratio was 1.37% as of Mar 31, 2013, stable
compared with Dec 31, 2012, but down from 1.64% as of Mar 31,
2012.
For the year 2013, Comerica expects stable provision for credit
losses, attributable to loan growth but somewhat offset by a
decline in non-performing loans and net charge-offs.
Capital Position
During the reported quarter, Comerica’s capital levels remained
strong. As of Mar 31, 2013, total assets and common shareholders'
equity were $63.5 billion and $7.0 billion compared with $64.3
billion and $7.1 billion, respectively, as of Dec 31, 2012.
As of Mar 31, 2013, Comerica's tangible common equity ratio was
9.86%, up 10 bps sequentially. Moreover, as of Mar 31, 2013, the
estimated Tier 1 common capital ratio moved up 23 bps sequentially
to 10.40%.
Capital Deployment Update
Comerica’s capital deployment initiatives through dividend payment
and share buybacks exhibit its capital strength. During the
reported quarter, Comerica bought back 2.1 million shares worth $71
million under its 2012 Capital Plan. This, combined with dividend,
resulted in a total payout of 77% of net income to shareholders in
the quarter. We expect such activities to further boost investors’
confidence in the stock.
Outlook 2013
Comerica has given an updated outlook for 2013. Given the
continuation of the current economic environment, the company’s
outlook for full year 2013 is a modest one. Compared to the
full-year 2012 level, management expects reduced net interest
income, attributable to a decline of $40 million-$50 million in
purchase accounting accretion and the effect of a low rate
environment, partially mitigated by loan growth.
Customer-driven non-interest income is projected to remain
relatively stable, reflecting cross-sell initiatives and selective
pricing adjustments, partially offset by regulatory pressures on
certain products, such as customer derivatives. Further,
non-interest expenses are anticipated to fall due to cost savings
based on tight expense control and no restructuring expenses.
Income tax expense is anticipated to be roughly 27.5% of pre-tax
income.
Comerica also anticipates continued growth in average loans, albeit
at a slower pace, with economic uncertainty impacting demand and a
continued focus on maintaining pricing and structure discipline in
a competitive environment.
Our Take
Going forward, we believe Comerica’s continuous geographic
diversification beyond its traditional and slower-growing Midwest
markets could drive growth over the next cycle. Revenue synergies
from the Sterling acquisition should augment top-line growth.
Yet, the company’s significant exposure to commercial real estate
markets, the unsettled economic environment, low interest rate and
stringent regulatory issues remain matters of concern.
Among other major banks, The Bank of New York Mellon
Corporation (BK) and Bank of America
Corporation (BAC) are scheduled to report their first
quarter 2013 results on Apr 17, whereas State Street
Corporation (STT) is scheduled to report on Apr 19.
Currently, Comerica carries a Zacks Rank #3 (Hold).
BANK OF AMER CP (BAC): Free Stock Analysis Report
BANK OF NY MELL (BK): Free Stock Analysis Report
COMERICA INC (CMA): Free Stock Analysis Report
STATE ST CORP (STT): Free Stock Analysis Report
To read this article on Zacks.com click here.
Zacks Investment Research
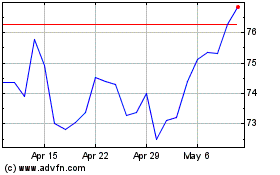
State Street (NYSE:STT)
Historical Stock Chart
From Jun 2024 to Jul 2024

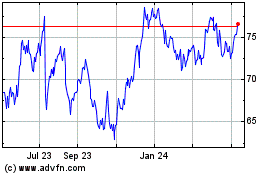
State Street (NYSE:STT)
Historical Stock Chart
From Jul 2023 to Jul 2024
