Broadridge Beats, Reaffirms Outlook - Analyst Blog
May 11 2011 - 6:30AM
Zacks
Broadridge Financial
Solutions Inc.’s (BR) third-quarter fiscal 2011 earnings
per share of 25 cents handily beat the Zacks Consensus Estimate of
19 cents and improved from 22 cents earned in the prior-year
quarter. Higher recurring revenue prompted the outperformance,
partially offset by higher operating expenses and tax rate.
Revenues
Total revenue in the third quarter
was $527.1 million, up 38.4% from $380.9 million in the year-ago
quarter and well ahead of the Zacks Consensus Estimate of $521.0
million. The improvement was driven by an increase in recurring
revenues from acquisitions, partially offset by lower contribution
from event-driven mutual fund proxy fee revenues. Mutual fund
event-driven revenues are highly cyclical in nature and
unpredictable, according to Broadridge. Positive currency
translation, net new businesses and an outsourcing services
agreement with Penson Worldwide Inc. (PNSN) also
aided the revenue growth.
Despite the outperformance,
Broadridge witnessed a downfall in recurring and event-driven
closed sales, which were compensated by improved client revenue
retention rate.
Segment
Revenues
The Investor Communication
Solutions segment generated $368.9 million in revenues, up 3.5%
from $356.5 million in the prior-year quarter. The increase was
attributable to higher recurring revenues from net new business and
revenue gains from acquisitions, with event-driven mutual fund
proxies being the dampener.
The Securities Processing Solutions
segment reported revenues of $153.9 million, up 15.2% from $133.6
million in the prior-year quarter. The increase was attributable to
the strength in new business, offset by the carryover impact of
fiscal 2009 client losses and price concessions.
Operating
Results
Total expenses in the quarter crept
up 7.6% year over year to $476.0 million. Pre-tax income was $51.1
million, up from $48.4 million in the year-earlier quarter. But,
pre-tax margin fell 300 basis points year over year to 9.7%.
Increased investment in acquisitions and lower event-driven mutual
fund proxy revenues were responsible for the margin
contraction.
Net income from continuing
operations increased 5.8% year over year to $32.6 million. Earnings
per share in the quarter rose 13.6% to 25 cents from 22 cents in
the year-ago quarter.
Balance Sheet & Share
Repurchase
Broadridge exited the quarter with
cash and cash equivalents of $151.3 million, down from $187.8
million in the prior quarter. Receivables increased 35.7% from the
previous quarter to $395.3 million. Long-term debt reduced to
$124.2 million from $324.2 million in the last quarter.
Broadridge repurchased 3.6 million
common shares at an average price of $22.82. Broadridge paid a
dividend of 15 cents per share during the quarter.
Guidance
For fiscal 2011, Broadridge
reiterated its earnings guidance of $1.30 to $1.40 per share.
Broadridge expects free cash flow (including costs related to the
Penson transaction and the International Business Machines
Inc. (IBM) data center services agreement) in the range of
$140.0 million to $200.0 million (previously $131.0–$189.0
million).
Our Take
Broadridge Financial posted a
decent third quarter and surpassed the Zacks Consensus Estimates on
both top and bottom lines. We believe that the sale of the Clearing
business will enable Broadridge to focus solely on revenue
opportunities associated with the securities processing and
outsourcing services businesses. Moreover, we remain optimistic on
Broadridge’s strategic acquisitions and potential product
launches.
However, we believe that weaker
market activity during the recession continues to impact the
company’s performance as can be inferred from the dull fiscal 2011
guidance. Management expects a weaker trend in the event-driven
mutual fund proxy revenue. Additionally, Broadridge faces
significant competition from companies such as HD Supply,
DST Systems Inc. (DST) and State Street
Corp. (STT), which have increased pricing pressure for the
company.
Currently, Broadridge has a Zacks
#3 Rank, implying a short-term Hold recommendation.
BROADRIDGE FINL (BR): Free Stock Analysis Report
DST SYSTEMS (DST): Free Stock Analysis Report
INTL BUS MACH (IBM): Free Stock Analysis Report
PENSON WORLDWD (PNSN): Free Stock Analysis Report
STATE ST CORP (STT): Free Stock Analysis Report
Zacks Investment Research
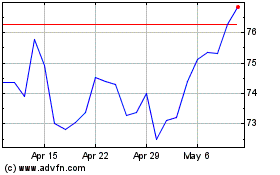
State Street (NYSE:STT)
Historical Stock Chart
From Jun 2024 to Jul 2024

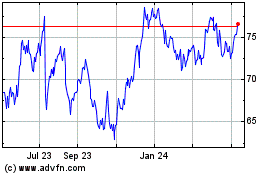
State Street (NYSE:STT)
Historical Stock Chart
From Jul 2023 to Jul 2024
