Regions Financial Corporation’s (RF)
fourth-quarter 2011 earnings from continuing operations came in at
9 cents per share, outshining the Zacks Consensus Estimate by 2
cents. Moreover, results compared favorably with 7 cents per share
reported in the prior quarter and 1 cent reported in prior-year
quarter.
Quarterly results benefited from improved net interest margin
and better credit quality backed by lower loan loss provisions and
reduced non-performing assets. Reported quarter represented the
company’s fifth consecutive quarterly profit after incurring losses
since the second quarter of 2009.
Net loss available to common shareholders, including goodwill
impairment charges of $731 million, was $602 million or 48 cents
per share. Results compared unfavorably with net income of $101.0
million or 8 cents per share reported in the prior quarter and
$36.0 million or 3 cents per share reported in the prior-year
quarter.
For the full year, income from continuing operations available
to common shareholders was $211 million or 17 cents per share.
Earnings per share for full year missed the Zacks Consensus
Estimate by 2 cents. Including goodwill impairment and a tax
benefit from the second quarter 2011 regulatory charge, net loss
available to common shareholders was $429 million or 34 cents per
share.
Performance in Detail
Total revenue came in at $1.4 billion, below the Zacks Consensus
Estimate of $1.6 billion. Moreover, revenue fell 0.5% sequentially
and 23.9% year over year.
For the full year, revenue was $5.6 billion, down 5.5% from $5.9
billion in 2010. Moreover, results significantly missed the Zacks
Consensus Estimate of $6.5 billion.
Regions reported pre-tax pre-provision net revenue of $485
million, down 5% sequentially, mainly attributed to expected
reduction in service charges. Moreover, revenue was down 39% year
over year. Including goodwill impairment, revenue came in at $232
million in the quarter.
Net interest income was $849 million, modestly in line with the
prior quarter and declined 1.6% year over year. Funding mix showed
an improvement as average low-cost deposits inched up as a
percentage of total deposits from 77.8% in the prior quarter to
79.2%.
Net interest margin of 3.08% was up 4 basis points (bps)
sequentially, gaining from lower deposit costs and decline in lower
average excess cash reserves at the Federal Reserve. However, these
benefits were partly offset by higher prepayments in the securities
portfolio coupled with the impact of maturing interest rate swaps.
Moreover, margin improved by 7 bps on a year over year
basis.
Regions’ non-interest income was $507 million, down 1.2%
sequentially and 44.9% year over year. Non-interest income included
$7 million in securities gains. Excluding securities gains,
non-interest income fell 2.7% sequentially, as service charges
declined $47 million sequentially as the Durbin Amendment rules was
implemented since October 2011.
Non-interest expense increased 32% sequentially to $1.1 billion,
due to goodwill impairment charges. Moreover, excluding goodwill
impairment, non-interest expenses increased 2% sequentially,
reflecting $16 million of expense related to Visa class B shares
litigation.
Credit Quality
Credit quality improved during the quarter at Regions. Inflows
of non-performing loans decreased 26% sequentially to $561 million.
Non-performing loans, excluding loans held for sale, declined
12%.
Net charge-offs decreased 36 bps sequentially and 106 bps year
over year to 2.16% of average loans. Moreover, non-performing
assets decreased 40 bps sequentially and 86 bps year over year to
3.83% of loans, foreclosed properties and non-performing loans held
for sale.
Provision for loan losses fell 16.9% sequentially and 56.7% year
over year to $295 million.
Capital Ratios
As of December 31, 2011, Regions’ Tier 1 capital ratio came in
at 13.2% compared with 12.8% in the prior quarter. Tier 1 common
risk-based ratio was 8.5%, up from 8.2% in the prior quarter. On a
Basel III pro-forma basis, Tier 1 common and Tier 1 capital ratios
were 7.7% and 11.3%, above the respective 7% and 8.5% minimum
requirements. The company’s loan-to-deposit ratio was 81.0% as of
the same date.
Recent Developments
In January 2012, Regions finally succeeded in selling its
securities brokerage arm, Morgan Keegan & Company Inc. The
company entered a stock purchase agreement with Raymond
James Financial Inc. (RJF) to sell Morgan Keegan for $930
million.
Under the terms of the deal, Regions would also receive a
dividend of $250 million from Morgan Keegan before closing, thereby
projecting $1.18 billion as the net amount of proceeds. The deal
awaits regulatory approvals and other customary closing conditions
and therefore, is expected to close during first quarter of 2012.
However, Morgan Asset Management and Regions Morgan Keegan Trust
are retained as part of Regions Wealth Management organization.
Following the divestiture, Regions aims to concentrate on its
core banking business while providing products and services to its
clients in a better way. Moreover, the company will have strong
revenue opportunities through a business relationship with Raymond
James, which would benefit the shareholders in the long run.
Our Take
We believe the company’s favorable funding mix, improved core
business performance, its expansion mode and strategies will
continue to yield profitable earnings in the upcoming quarters.
Moreover, improved credit quality also act as a positive catalyst
for the company.
While the de-risking measures at Regions are encouraging, the
upfront costs of such initiatives cannot be avoided. Additionally,
regulatory issues also remain a major area of concern.
Regions retain a Zacks #3 Rank, which translates into a
short-term Hold rating. Moreover, considering the fundamentals, we
maintain our long-term Neutral recommendation on the stock.
REGIONS FINL CP (RF): Free Stock Analysis Report
RAYMOND JAS FIN (RJF): Free Stock Analysis Report
To read this article on Zacks.com click here.
Zacks Investment Research
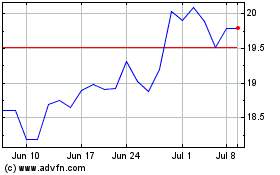
Regions Financial (NYSE:RF)
Historical Stock Chart
From Jul 2024 to Aug 2024

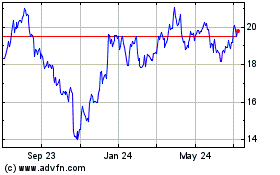
Regions Financial (NYSE:RF)
Historical Stock Chart
From Aug 2023 to Aug 2024
