PNC Profit Shoots, Top Line Topples - Analyst Blog
April 21 2011 - 2:00PM
Zacks
PNC Financial Services Group Inc.’s (PNC)
first-quarter 2011 adjusted earnings of $1.57 per share were ahead
of the Zacks Consensus Estimate of $1.37.
Results also compared favorably with adjusted earnings of 66
cents per share in the prior-year quarter. Consequently, reported
net income increased 24% year over year to $832 million.
However, earnings per share of 66 cents in the first quarter
2010 included a reduction of 50 cents per share related to the
redemption of TARP preferred shares.
A substantial contraction in the provision for credit losses, lower
non-interest expenses, a strong balance sheet and improved credit
quality were attributed to the results. However, revenues were
lower due to a challenging operating environment.
Total revenue came in at $3.63 billion, down 3.5% from $3.76
billion in the prior-year quarter, while slightly exceeding the
Zacks Consensus Estimate of $3.58 billion. The drop was due to
lower net interest income.
Net interest income for the reported quarter was $2.18 billion,
down 1.1% sequentially and 8.5% year over year. Net interest margin
climbed 1 basis point sequentially but dipped 30 basis points
year-over-year to 3.94%. The decrease in net interest income and
margin was attributed to lower purchase accounting accretion,
continued soft loan demand and the low interest rate environment,
which were partially offset by lower funding costs.
Non-interest income decreased 14.5% sequentially, but edged up 5.1%
year over year to $1.46 billion. In the reported quarter,
non-interest income included a gain of $160 million on 7.5 million
BlackRock Inc. (BLK) shares sold by PNC Financial
as part of BlackRock’s secondary common stock offering.
Additionally, the decline could be attributed to higher
residential mortgage fees, higher net gains on sales of securities
net of other-than-temporary impairments and a decrease in
repurchase reserves partially offset by lower corporate service
fees and a decline in service charges on deposits.
Non-interest expense for the reported quarter decreased 11.5%
sequentially and 2.0% year over year to $2.07 billion. The
sequential decline was seen primarily due to disciplined expense
management and elevated fourth quarter expense levels due to higher
residential mortgage expenses principally related to foreclosure
activities, the impact of integration costs and
compensation-related costs.
These declines were partially offset by a reversal of a portion
of an indemnification liability for certain Visa
Inc. (V) litigation of $38 million in the reported
quarter, compared with $76 million in prior quarter as well as
investments in the businesses. The year-over-year decline resulted
from lower integration costs and reversal of a portion of an
indemnification liability in the reported quarter partially offset
by investments in the businesses.
Credit quality significantly improved in the quarter.
Non-performing assets decreased 20% year over year to $5.3 billion,
mainly aided by lower commercial real estate non-performing loans
and lower residential real estate non-performing loans. The ratio
of non-performing assets to total assets decreased 43 basis points
year over year to 2.03%.
Net charge-offs plunged $158 million year over year to $533
million in the reported quarter. The provision for credit losses
during the quarter was $421 million, down 44% from $751 billion in
the prior-year quarter, principally driven by overall credit
quality improvement during 2010 and measures to reduce exposure
levels. This reflects PNC Financial’s return to a moderate risk
profile.
As of March 31, 2011, PNC’s Tier 1 common capital ratio was an
estimated 10.3%, up from 9.8% as on December 31, 2010 and 7.9% as
on March 31, 2010. The Tier 1 risk-based capital ratio
increased to an estimated 12.6% from 12.1% at the end of the prior
quarter and 10.3% at the end of the prior-year quarter. The
increase in the ratios was primarily due to retention of earnings
and lower risk-weighted assets.
Total assets under administration increased to $219 billion at
the end of the reported quarter from $212 billion at the end of
prior quarter and $209 billion at the end of year-ago quarter.
Capital Deployment Update
On April 7, 2011, the Board of PNC declared a 250% increase in
quarterly cash dividend and its intention to buy back up to $500
million of common stock during the remainder of 2011, following the
approval from Federal regulators under the Supervisory Capital
Assessment Program.
The company will now pay a quarterly cash dividend of 35 cents
per share on the common stock, up 25 cents per share from 10 cents
paid in the prior quarter. The new dividend is payable on May 5, to
shareholders of record as on April 18, 2011.
The share buyback would take place under its existing 25 million
share repurchase program in the open market or through privately
negotiated transactions. Currently, the company has 24.7 million
shares remaining. It has been in effect since October 4, 2007, and
has no expiry date. Additionally, PNC’s Board of Directors declared
a quarterly cash dividend on Series B, K and L preferred stock. Its
capital deployment efforts justify the company’s capital strength
and its commitment to return value to shareholders.
BLACKROCK INC (BLK): Free Stock Analysis Report
PNC FINL SVC CP (PNC): Free Stock Analysis Report
VISA INC-A (V): Free Stock Analysis Report
Zacks Investment Research
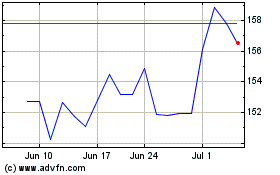
PNC Financial Services (NYSE:PNC)
Historical Stock Chart
From Oct 2024 to Nov 2024

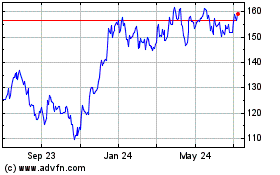
PNC Financial Services (NYSE:PNC)
Historical Stock Chart
From Nov 2023 to Nov 2024
