Stock Market News for March 15, 2012 - Market News
March 15 2012 - 5:06AM
Zacks
Markets swung up and down
throughout Wednesday to end at roughly the same level they started
the day at. On a day devoid of events, the markets struggled to
find a definite direction. However, despite the meager gains, the
Dow recorded its sixth-consecutive day of gains, thus also
registering the blue-chip index’s longest-winning streak since
February 2011.
The Dow Jones Industrial Average
(DJI) was up 0.1% to close at 13,194.10. The Standard & Poor
500 (S&P 500) gained a mere 0.1% to finish yesterday’s trading
session almost unchanged at 1,394.28. The tech-laden Nasdaq
Composite Index slipped 0.03% to settle at 3,040.73. The fear-gauge
CBOE Volatility Index (VIX) gained 3.5% to settle at 15.31.
Consolidated volumes on the New York Stock Exchange, the American
Stock Exchange and Nasdaq were 7.45 billion shares, lower than last
year's daily average of 7.84 billion. Declining stocks outpaced the
advancers on the NYSE; as for 72% of the decliners, only 26%
managed to move up. The remaining 2% of the stocks were left
unchanged.
Markets took a pause yesterday
after recording the biggest gains of the year so far on Tuesday.
The biggest rally of the year till now was spurred by a number of
events including encouraging consumer data and the central bank’s
outlook on the economy, which it said was “expanding moderately”.
Meanwhile, a large degree of attention was cornered by JP Morgan
Chase & Co.’s (NYSE:JPM) after it announced a dividend hike and
a share buyback plan worth $150 million. This was a bit of a
surprise, as it came ahead of the Fed’s announcement of its bank
stress test results.
Meanwhile, the central bank
released the results of its stress tests, originally scheduled for
Thursday, after the closing bell on Tuesday. Fifteen of the 19
banks under the scanner passed the Fed’s stress test. Subsequently,
financials posted decent gains, building on the gains already
garnered on Tuesday. The Financial SPDR Select Sector Fund (XLF)
moved up 0.1% yesterday while KBW Bank Index (BKX) jumped 1.3%.
Among the financial stocks, American Express Company (NYSE:AXP),
Bank of America (NYSE:BAC), U.S. Bancorp (NYSE:USB), Deutsche Bank
AG (NYSE:DB) and Wells Fargo & Company (NYSE:WFC) gained 3.5%,
4.1%, 1.5%, 1.5% and 0.1%, respectively.
However, Citigroup, Inc. (NYSE:C)
failed to pass the stress test and these results were reflected
through the 3.4% drop in its share prices yesterday. SunTrust
Banks, Inc. (NYSE:STI), Ally Financial and MetLife, Inc. (NYSE:MET)
were the other three that failed. Shares of Sun Trust jumped 4.6%
but MetLife slumped 5.8%.
Earlier during the day, reports
came in that a quake measuring as much as 6.8 on Richter scale had
struck the northern part of Japan. However, with no news of major
damage, US markets ignored these developments, and sectors like
energy were hardly affected. A little over a year ago on March 11,
2011, the earthquake and the subsequent tsunami had significantly
damaged nuclear plants, eventually affecting the energy sector.
Yesterday, Energy SPDR Select Sector Fund (XLE) slipped by a
percent and stocks including Chevron Corporation (NYSE:CVX), Exxon
Mobil Corporation (NYSE:XOM), ConocoPhillips (NYSE:COP) and
Schlumberger (NYSE:SLB) were down 0.5%, 1.0%, 0.3% and 1.0%,
respectively.
AMER EXPRESS CO (AXP): Free Stock Analysis Report
BANK OF AMER CP (BAC): Free Stock Analysis Report
CITIGROUP INC (C): Free Stock Analysis Report
CONOCOPHILLIPS (COP): Free Stock Analysis Report
CHEVRON CORP (CVX): Free Stock Analysis Report
DEUTSCHE BK AG (DB): Free Stock Analysis Report
JPMORGAN CHASE (JPM): Free Stock Analysis Report
METLIFE INC (MET): Free Stock Analysis Report
SCHLUMBERGER LT (SLB): Free Stock Analysis Report
SUNTRUST BKS (STI): Free Stock Analysis Report
US BANCORP (USB): Free Stock Analysis Report
EXXON MOBIL CRP (XOM): Free Stock Analysis Report
To read this article on Zacks.com click here.
Zacks Investment Research
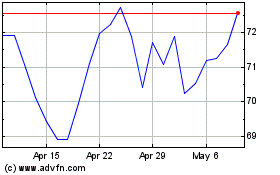
MetLife (NYSE:MET)
Historical Stock Chart
From May 2024 to Jun 2024

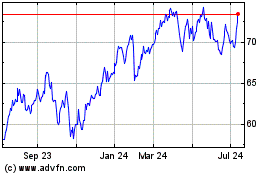
MetLife (NYSE:MET)
Historical Stock Chart
From Jun 2023 to Jun 2024
