NY false 0001952073 0001952073 2023-08-18 2023-08-18
UNITED STATES
SECURITIES AND EXCHANGE COMMISSION
Washington, D.C. 20549
FORM 8-K
CURRENT REPORT
Pursuant to Section 13 or 15(d)
of The Securities Exchange Act of 1934
Date of Report (Date of earliest event reported): August 18, 2023
MADISON SQUARE GARDEN ENTERTAINMENT CORP.
(Exact name of registrant as specified in its charter)
|
|
|
|
|
| Delaware |
|
001-41627 |
|
92-0318813 |
| (State or other jurisdiction of incorporation) |
|
(Commission File Number) |
|
(IRS Employer Identification No.) |
|
|
|
|
|
| 2 Penn Plaza, New York, New York |
|
10121 |
| (Address of principal executive offices) |
|
(Zip Code) |
Registrant’s telephone number, including area code: (212) 465-6000
Not Applicable
(Former name or former address, if changed since last report.)
Check the appropriate box below if the Form 8-K filing is intended to simultaneously satisfy the filing obligation of the registrant under any of the following provisions:
| |
☐ |
Written communications pursuant to Rule 425 under the Securities Act (17 CFR 230.425) |
| |
☐ |
Soliciting material pursuant to Rule 14a-12 under the Exchange Act (17 CFR 240.14a-12) |
| |
☐ |
Pre-commencement communications pursuant to Rule 14d-2(b) under the Exchange Act (17 CFR 240.14d-2(b)) |
| |
☐ |
Pre-commencement communications pursuant to Rule 13e-4(c) under the Exchange Act (17 CFR 240.13e-4(c)) |
Securities registered pursuant to Section 12(b) of the Act:
|
|
|
|
|
| Title of each class |
|
Trading Symbol(s) |
|
Name of each exchange on which registered |
| Class A Common Stock |
|
MSGE |
|
New York Stock Exchange |
Indicate by check mark whether the registrant is an emerging growth company as defined in Rule 405 of the Securities Act of 1933 (§230.405 of this chapter) or Rule 12b-2 of the Securities Exchange Act of 1934 (§240.12b-2 of this chapter).
Emerging growth company ☒
If an emerging growth company, indicate by check mark if the registrant has elected not to use the extended transition period for complying with any new or revised financial accounting standards provided pursuant to Section 13(a) of the Exchange Act. ☒
| Item 2.02 |
Results of Operations and Financial Condition. |
On August 18, 2023, Madison Square Garden Entertainment Corp. (the “Company”) announced its financial results for its fourth quarter and fiscal year ended June 30, 2023. A copy of the press release containing the announcement is included as Exhibit 99.1 to this Current Report on Form 8-K and is incorporated herein by reference.
The information furnished pursuant to this Item 2.02, including Exhibit 99.1, shall not be deemed “filed” for purposes of Section 18 of the Securities Exchange Act of 1934, as amended (the “Exchange Act”), or otherwise subject to the liabilities under that Section and shall not be deemed to be incorporated by reference into any filing of the Company under the Securities Act of 1933 (the “Securities Act”) or the Exchange Act, regardless of any general incorporation language in such filings.
| Item 7.01 |
Regulation FD Disclosure. |
Investor Presentation
On August 18, 2023, the Company also issued an investor presentation. The investor presentation is included as Exhibit 99.2 to this Current Report on Form 8-K and is incorporated herein by reference.
The information furnished pursuant to this Item 7.01, including Exhibit 99.2, shall not be deemed “filed” for purposes of Section 18 of the Exchange Act or otherwise subject to liabilities under that Section and shall not be deemed to be incorporated by reference into any filing of the Company under the Securities Act or the Exchange Act, regardless of any general incorporation language in such filings.
Forward-Looking Statements
This document may contain statements that constitute forward-looking statements within the meaning of the Private Securities Litigation Reform Act of 1995. Investors are cautioned that any such forward-looking statements are not guarantees of future performance or results and involve risks and uncertainties, and that actual results, developments or events may differ materially from those in the forward-looking statements as a result of various factors, including financial community perceptions of the Company and its business, operations, financial condition and the industries in which it operates and the factors described in the Company’s filings with the Securities and Exchange Commission, including the sections titled “Risk Factors” and “Management’s Discussion and Analysis of Financial Condition and Results of Operations” contained therein. The Company disclaims any obligation to update any forward-looking statements contained herein, except as may be required by law or applicable regulations.
| Item 9.01 |
Financial Statements and Exhibits. |
SIGNATURES
Pursuant to the requirements of the Securities Exchange Act of 1934, the Company has duly caused this report to be signed on its behalf by the undersigned hereunto duly authorized.
|
|
|
|
|
| MADISON SQUARE GARDEN ENTERTAINMENT CORP. (Company) |
|
|
| By: |
|
/s/ David F. Byrnes |
|
|
Name: |
|
David F. Byrnes |
|
|
Title: |
|
Executive Vice President and Chief Financial Officer |
Dated: August 18, 2023
Exhibit 99.1

MADISON SQUARE GARDEN ENTERTAINMENT CORP. REPORTS
FISCAL 2023 FOURTH QUARTER AND FULL YEAR RESULTS
Delivered First Full Year of Live Events at the Company’s Venues Since Fiscal 2019
Hosted More than 5.5 Million Guests at Nearly 900 Live Events in Fiscal 2023
$90 Million in MSGE Class A Shares Repurchased Since Becoming a Standalone Company in April 2023
Company Issues Fiscal 2024 Revenue, Operating Income and Adjusted Operating Income Guidance
NEW YORK, N.Y., August 18, 2023 - Madison Square Garden Entertainment Corp. (NYSE: MSGE) (“MSG Entertainment” or the
“Company”) today reported financial results for the fiscal fourth quarter and full-year ended June 30, 2023.
Fiscal 2023 marked the first
full year of live events at the Company’s portfolio of venues since the onset of the COVID-19 pandemic. The Company hosted more than 5.5 million guests at nearly 900 events across its venues during
the fiscal year. In addition, the Christmas Spectacular returned for 181 shows in its first full holiday season run in three years, generating record revenues for the production. In addition, suites and sponsorship revenues both exceeded pre-pandemic levels for fiscal 2023, reflecting robust corporate demand for the company’s live entertainment assets and brands.
The Company’s fiscal 2023 and 2022 results for all periods through the date of the spin-off (April 20, 2023) from
Sphere Entertainment Co. (“Sphere Entertainment”) are presented in accordance with generally accepted accounting principles (“GAAP”) for the preparation of carve-out financial statements.
These results (through April 20, 2023) do not include all of the expenses that would have been incurred by MSG Entertainment had it been a standalone company for the periods presented.
For fiscal 2023, the Company reported revenues of $851.5 million, an increase of $198.0 million, or 30%, as compared to the prior year. In addition,
the Company reported operating income of $105.0 million, an increase of $110.7 million, and adjusted operating income of $175.0 million, an increase of $95.9 million, both as compared to the prior year.(1)
Executive Chairman and CEO James L. Dolan said, “Throughout fiscal 2023, we saw robust demand
for our portfolio of live entertainment offerings. Looking ahead, we see this momentum carrying into fiscal 2024 and believe we are well positioned to generate ongoing growth and value creation for shareholders.”
Results for the Three and Twelve Months Ended June 30, 2023 and 2022:
|
|
|
|
|
|
|
|
|
|
|
|
|
|
|
|
|
|
|
|
|
|
|
|
|
|
|
|
|
|
|
|
|
| |
|
Three Months Ended |
|
|
Twelve Months Ended |
|
| |
|
June 30, |
|
|
Change |
|
|
June 30, |
|
|
Change |
|
| $ millions |
|
2023 |
|
|
2022 |
|
|
$ |
|
|
% |
|
|
2023 |
|
|
2022 |
|
|
$ |
|
|
% |
|
| Revenues |
|
$ |
147.9 |
|
|
$ |
178.3 |
|
|
$ |
(30.4 |
) |
|
|
(17 |
)% |
|
$ |
851.5 |
|
|
$ |
653.5 |
|
|
$ |
198.0 |
|
|
|
30 |
% |
| Operating Income (Loss) |
|
$ |
(21.8 |
) |
|
$ |
(5.5 |
) |
|
$ |
(16.3 |
) |
|
|
NM |
|
|
$ |
105.0 |
|
|
$ |
(5.6 |
) |
|
$ |
110.7 |
|
|
|
NM |
|
| Adjusted Operating Income (Loss) |
|
$ |
(0.8 |
) |
|
$ |
19.0 |
|
|
$ |
(19.8 |
) |
|
|
NM |
|
|
$ |
175.0 |
|
|
$ |
79.1 |
|
|
$ |
95.9 |
|
|
|
121 |
% |
Note: Amounts may not foot due to rounding. NM – Absolute percentages greater than 200% and comparisons from positive to
negative values or to zero values are considered not meaningful.
| (1) |
See page 4 of this earnings release for the definition of adjusted operating income (loss) included in the
discussion of non-GAAP financial measures. |
1
Summary of Reported Results of Operations for the Fiscal 2023 Fourth Quarter
For the fiscal 2023 fourth quarter, the Company reported revenues of $147.9 million, a decrease of $30.4 million, or 17%, as compared to the prior
year quarter.
In December 2022, the Company sold its controlling interest in Boston Calling Events LLC. Results for the fiscal 2023 fourth quarter
reflect the absence of $18.4 million of revenues related to the Boston Calling Music Festival recorded in the prior year quarter.
Revenues related
to the Company’s arena license agreements with the New York Knicks (“Knicks”) and New York Rangers (“Rangers”) decreased $15.5 million, primarily due the timing of the NHL 2021-22
regular season in the prior year, which resulted in the teams playing a combined eight fewer regular season games at the Madison Square Garden Arena (“The Garden”) in the fiscal 2023 fourth quarter and, to a lesser extent, the impact of
two fewer playoff games played at The Garden as compared to the prior year quarter. The $15.5 million decline in revenues consisted of a $10.0 million decrease in revenues subject to the sharing of economics with Madison Square Garden
Sports Corp. (“MSG Sports”), primarily reflecting lower Knicks and Rangers food, beverage and merchandise sales and suite license fee revenues, and a $5.5 million decrease in arena license fee revenues.
Advertising sales commissions decreased $3.9 million in the fiscal 2023 fourth quarter due to the termination of the Company’s advertising sales
representation agreement with MSG Networks which was effective December 31, 2022.
The overall decrease in revenues was partially offset by an
increase in event-related revenues of $8.1 million. The increase was primarily due to a higher number of events held at the Company’s venues, as compared to the prior year quarter.
Fiscal 2023 fourth quarter direct operating expenses of $102.5 million decreased $22.6 million, or 18%, as compared to the prior year quarter. The
decrease primarily reflects the absence of $19.4 million in expenses recorded in the prior year quarter related to the Boston Calling Music Festival and lower expenses of $6.2 million associated with the sharing of economics with MSG
Sports pursuant to the arena license agreements, partially offset by higher event-related expenses of $4.8 million.
Fiscal 2023 fourth quarter
selling, general and administrative expenses of $52.7 million increased $14.3 million, or 37%, as compared with the prior year quarter. Results for the entire fiscal 2022 fourth quarter reflect the allocation of corporate and
administrative costs based on the accounting requirements for the preparation of carve-out financial statements. These results do not include all of the expenses that would have been incurred by MSG
Entertainment had it been a standalone company for the fiscal 2022 fourth quarter. The fiscal 2023 fourth quarter reflects the impact of carve-out accounting for the first 20 days of the quarter through the
April 20, 2023 spin-off date and, thereafter, reflects the results of the Company on a fully standalone basis. This was the primary driver of the overall increase in selling, general and administrative
expenses, partially offset by the impact of the Company’s post-spin-off transition services agreement with Sphere Entertainment.
Fiscal 2023 fourth quarter operating loss increased by $16.3 million to a loss of $21.8 million, and adjusted operating income decreased by
$19.8 million to a loss of $0.8 million, both as compared to the prior year quarter. The decreases in operating income and adjusted operating income were primarily due to the decrease in revenues and higher selling, general and
administrative expenses, partially offset by lower direct operating expenses.
Financial Guidance
For fiscal year 2024, the Company currently expects the following:
| |
• |
|
Revenues of $900 million to $930 million. |
| |
• |
|
Operating income of $100 million to $110 million. |
| |
• |
|
Adjusted operating income of $160 million to $170
million(2). |
Other Matters
Since becoming a standalone company in April 2023, the Company has repurchased $90 million of MSGE Class A common stock from Sphere Entertainment
Co., the Company’s parent company prior to the spin-off, reducing Class A shares outstanding by approximately 6%. This includes (i) repurchasing $25 million, or 840,053 shares, of its
Class A common stock at a price of $29.76 per share during the fiscal fourth quarter and (ii) following the end of the quarter, accepting the repayment of the $65 million delayed draw term loan facility, including accrued fees and
interest, from Sphere Entertainment Co. with 1,922,750 shares of MSGE Class A common stock.
| (2) |
See appendix for a reconciliation of operating income to adjusted operating income for fiscal 2024 financial
guidance. |
2
For fiscal 2024, the Company remains focused on its capital allocation priorities of debt paydown and
opportunistically returning capital to shareholders.
An updated version of the MSG Entertainment investor presentation is now available at
investor.msgentertainment.com.
About Madison Square Garden Entertainment Corp.
Madison Square Garden Entertainment Corp. (MSG Entertainment) is a leader in live entertainment, delivering unforgettable experiences while forging deep
connections with diverse and passionate audiences. The Company’s portfolio includes a collection of world-renowned venues – New York’s Madison Square Garden, The Theater at Madison Square Garden, Radio City Music Hall, and Beacon
Theatre; and The Chicago Theatre – that showcase a broad array of sporting events, concerts, family shows, and special events for millions of guests annually. In addition, the Company features the original production, the Christmas
Spectacular Starring the Radio City Rockettes, which has been a holiday tradition for 89 years. More information is available at www.msgentertainment.com.
3
Non-GAAP Financial Measures
We define adjusted operating income (loss), which is a non-GAAP financial measure, as operating income (loss)
excluding (i) the impact of non-cash straight-line leasing revenue associated with the arena license agreements with MSG Sports, (ii) depreciation, amortization and impairments of property and
equipment, goodwill and other intangible assets, (iii) share-based compensation expense or benefit, (iv) restructuring charges or credits, (v) merger and acquisition-related costs, including litigation expenses, (vi) gains or
losses on sales or dispositions of businesses and associated settlements, (vii) the impact of purchase accounting adjustments related to business acquisitions, (viii) gains and losses related to the remeasurement of liabilities under the
executive deferred compensation plan, and (ix) amortization for capitalized cloud computing arrangement costs. We believe that given the length of the arena license agreements and resulting magnitude of the difference in leasing revenue
recognized and cash revenue received, the exclusion of non-cash leasing revenue provides investors with a clearer picture of the Company’s operating performance. We believe that this adjustment is
beneficial for other incremental reasons as well. This adjustment provides senior management, investors and analysts with important information regarding a long-term related party agreement with MSG Sports. In addition, this adjustment is included
under the Company’s debt covenant compliance calculations and is a component of the performance measures used to evaluate, and compensate, senior management of the Company. We believe that the exclusion of share-based compensation expense or
benefit allows investors to better track the performance of the various operating units of our business without regard to the settlement of an obligation that is not expected to be made in cash. We eliminate merger and acquisition-related costs,
when applicable, because the Company does not consider such costs to be indicative of the ongoing operating performance of the Company as they result from an event that is of a non-recurring nature, thereby
enhancing comparability. In addition, management believes that the exclusion of gains and losses related to the remeasurement of liabilities under the executive deferred compensation plan, provides investors with a clearer picture of the
Company’s operating performance given that, in accordance with U.S. generally accepted accounting principles, gains and losses related to the remeasurement of liabilities under the executive deferred compensation plan are recognized in
Operating (income) loss whereas gains and losses related to the remeasurement of the assets under the executive deferred compensation plan, which are equal to and therefore fully offset the gains and losses related to the remeasurement of
liabilities, are recognized in Other income (expense), net, which is not reflected in Operating income (loss).
We believe adjusted operating
income (loss) is an appropriate measure for evaluating the operating performance of the Company on a consolidated and combined basis. Adjusted operating income (loss) and similar measures with similar titles are common performance measures used by
investors and analysts to analyze our performance. Internally, we use revenues and adjusted operating income (loss) as the most important indicators of our business performance, and evaluate management’s effectiveness with specific reference to
these indicators. Adjusted operating income (loss) should be viewed as a supplement to and not a substitute for operating income (loss), net income (loss), cash flows from operating activities, and other measures of performance and/or liquidity
presented in accordance with GAAP. Since adjusted operating income (loss) is not a measure of performance calculated in accordance with GAAP, this measure may not be comparable to similar measures with similar titles used by other companies. For a
reconciliation of operating income (loss) to adjusted operating income (loss), please see page 6 of this release.
Forward-Looking Statements
This press release may contain statements that constitute forward-looking statements within the meaning of the Private Securities Litigation Reform
Act of 1995. Investors are cautioned that any such forward-looking statements are not guarantees of future performance or results and involve risks and uncertainties, and that actual results, developments or events may differ materially from those
in the forward-looking statements as a result of various factors, including financial community perceptions of the Company and its business, operations, financial condition and the industries in which it operates and the factors described in the
Company’s filings with the Securities and Exchange Commission, including the sections titled “Risk Factors” and “Management’s Discussion and Analysis of Financial Condition and Results of Operations” contained therein.
The Company disclaims any obligation to update any forward-looking statements contained herein.
4
# # #
Contacts:
Ari Danes, CFA
Senior Vice President, Investor Relations, Financial Communications & Treasury
Madison Square Garden Entertainment Corp.
(212) 465-6072
Justin Blaber
Vice President, Financial Communications
Madison Square Garden
Entertainment Corp.
(212) 465-6109
Grace Kaminer
Vice President, Investor Relations &
Treasury
Madison Square Garden Entertainment Corp.
(212) 631-5076
Conference Call Information:
The conference call will be Webcast live today at 10:00 a.m. ET at investor.msgentertainment.com
Conference call dial-in number is
888-660-6386 / Conference ID Number 8020251
Conference call
replay number is 800-770-2030 / Conference ID Number 8020251 until August 25, 2023
5
MADISON SQUARE GARDEN ENTERTAINMENT CORP.
CONDENSED CONSOLIDATED AND COMBINED STATEMENTS OF OPERATIONS
(In thousands, except per share data)
(Unaudited)
|
|
|
|
|
|
|
|
|
|
|
|
|
|
|
|
|
| |
|
Three Months Ended
June 30, |
|
|
Twelve Months Ended
June 30, |
|
| |
|
2023 |
|
|
2022 |
|
|
2023 |
|
|
2022 |
|
| Revenues |
|
$ |
147,935 |
|
|
$ |
178,340 |
|
|
$ |
851,496 |
|
|
$ |
653,490 |
|
| Direct operating expenses |
|
|
(102,531 |
) |
|
|
(125,103 |
) |
|
|
(499,929 |
) |
|
|
(417,301 |
) |
| Selling, general and administrative expenses |
|
|
(52,679 |
) |
|
|
(38,407 |
) |
|
|
(180,216 |
) |
|
|
(167,132 |
) |
| Depreciation and amortization |
|
|
(14,094 |
) |
|
|
(20,368 |
) |
|
|
(60,463 |
) |
|
|
(69,534 |
) |
| Gains, net on dispositions |
|
|
— |
|
|
|
— |
|
|
|
4,361 |
|
|
|
— |
|
| Restructuring charges |
|
|
(421 |
) |
|
|
— |
|
|
|
(10,241 |
) |
|
|
(5,171 |
) |
|
|
|
|
|
|
|
|
|
|
|
|
|
|
|
|
|
| Operating income (loss) |
|
|
(21,790 |
) |
|
|
(5,538 |
) |
|
|
105,008 |
|
|
|
(5,648 |
) |
| Interest income |
|
|
1,440 |
|
|
|
2,005 |
|
|
|
7,244 |
|
|
|
7,150 |
|
| Interest expense |
|
|
(13,814 |
) |
|
|
(13,306 |
) |
|
|
(51,869 |
) |
|
|
(53,110 |
) |
| Loss on extinguishment of debt |
|
|
— |
|
|
|
(35,629 |
) |
|
|
— |
|
|
|
(35,629 |
) |
| Other income (expense), net |
|
|
10,605 |
|
|
|
(21,291 |
) |
|
|
17,389 |
|
|
|
(49,033 |
) |
|
|
|
|
|
|
|
|
|
|
|
|
|
|
|
|
|
| Income (loss) from operations before income taxes |
|
|
(23,559 |
) |
|
|
(73,759 |
) |
|
|
77,772 |
|
|
|
(136,270 |
) |
| Income tax (expense) benefit |
|
|
(924 |
) |
|
|
70 |
|
|
|
(1,728 |
) |
|
|
70 |
|
|
|
|
|
|
|
|
|
|
|
|
|
|
|
|
|
|
| Net income (loss) |
|
|
(24,483 |
) |
|
|
(73,689 |
) |
|
|
76,044 |
|
|
|
(136,200 |
) |
| Less: Net loss attributable to nonredeemable noncontrolling interest |
|
|
— |
|
|
|
(2,285 |
) |
|
|
(553 |
) |
|
|
(2,864 |
) |
|
|
|
|
|
|
|
|
|
|
|
|
|
|
|
|
|
| Net income (loss) attributable to MSG Entertainment’s stockholders |
|
$ |
(24,483 |
) |
|
$ |
(71,404 |
) |
|
$ |
76,597 |
|
|
$ |
(133,336 |
) |
|
|
|
|
|
|
|
|
|
|
|
|
|
|
|
|
|
| Earnings (loss) per share attributable to MSG Entertainment’s stockholders: |
|
|
|
|
|
|
|
|
|
|
|
|
|
|
|
|
| Basic |
|
$ |
(0.47 |
) |
|
$ |
(1.38 |
) |
|
$ |
1.48 |
|
|
$ |
(2.58 |
) |
| Diluted |
|
$ |
(0.47 |
) |
|
$ |
(1.38 |
) |
|
$ |
1.47 |
|
|
$ |
(2.58 |
) |
|
|
|
|
|
| Weighted-average number of shares of common stock: |
|
|
|
|
|
|
|
|
|
|
|
|
|
|
|
|
| Basic |
|
|
51,819 |
|
|
|
51,768 |
|
|
|
51,819 |
|
|
|
51,768 |
|
| Diluted |
|
|
51,819 |
|
|
|
51,768 |
|
|
|
52,278 |
|
|
|
51,768 |
|
6
MADISON SQUARE GARDEN ENTERTAINMENT CORP.
ADJUSTMENTS TO RECONCILE OPERATING INCOME (LOSS) TO
ADJUSTED OPERATING INCOME (LOSS)
(in thousands)
(Unaudited)
The following is a
description of the adjustments to operating income (loss) in arriving at adjusted operating income as described in this earnings release:
| |
• |
|
Non-cash portion of arena license fees from MSG Sports.
This adjustment removes the impact of non-cash straight-line leasing revenue associated with the arena license agreements with MSG Sports. |
| |
• |
|
Share-based compensation. This adjustment eliminates the compensation expense relating to restricted stock
units and stock options granted under the Company’s Employee Stock Plan, Sphere Entertainment’s Employee Stock Plan, the Company’s Non-Employee Director Plan and Sphere Entertainment’s Non-Employee Director Plan in all periods. |
| |
• |
|
Depreciation and amortization. This adjustment eliminates depreciation and amortization of property and
equipment and intangible assets in all periods. |
| |
• |
|
Restructuring charges. This adjustment eliminates costs related to termination benefits provided to
employees as part of the Company’s full-time workforce reductions. |
| |
• |
|
Gains (loss), net on dispositions. This adjustment eliminates
non-cash impairment charges and the impact of gains or losses from the disposition of assets or businesses in all periods. |
| |
• |
|
Amortization for capitalized cloud computing arrangement costs. This adjustment eliminates amortization of
capitalized cloud computing arrangement costs. |
| |
• |
|
Remeasurement of deferred compensation plan liabilities. This adjustment eliminates the impact of gains
and losses related to the remeasurement of liabilities under the executive deferred compensation plan. |
|
|
|
|
|
|
|
|
|
|
|
|
|
|
|
|
|
| |
|
Three Months Ended
June 30, |
|
|
Twelve Months Ended
June 30, |
|
| $ thousands |
|
2023 |
|
|
2022 |
|
|
2023 |
|
|
2022 |
|
| Operating income (loss) |
|
$ |
(21,790 |
) |
|
$ |
(5,538 |
) |
|
$ |
105,008 |
|
|
$ |
(5,648 |
) |
| Non-cash portion of arena license fees from MSG Sports(1) |
|
|
(1,467 |
) |
|
|
(3,792 |
) |
|
|
(26,545 |
) |
|
|
(27,754 |
) |
| Share-based compensation |
|
|
7,541 |
|
|
|
7,878 |
|
|
|
29,521 |
|
|
|
37,746 |
|
| Depreciation and amortization |
|
|
14,094 |
|
|
|
20,368 |
|
|
|
60,463 |
|
|
|
69,534 |
|
| Restructuring charges |
|
|
421 |
|
|
|
— |
|
|
|
10,241 |
|
|
|
5,171 |
|
| Gains, net on dispositions |
|
|
— |
|
|
|
— |
|
|
|
(4,361 |
) |
|
|
— |
|
| Amortization for capitalized cloud computing arrangement costs |
|
|
431 |
|
|
|
27 |
|
|
|
600 |
|
|
|
39 |
|
| Remeasurement of deferred compensation plan liabilities |
|
|
(11 |
) |
|
|
46 |
|
|
|
121 |
|
|
|
46 |
|
|
|
|
|
|
|
|
|
|
|
|
|
|
|
|
|
|
| Adjusted operating income (loss) |
|
$ |
(781 |
) |
|
$ |
18,989 |
|
|
$ |
175,048 |
|
|
$ |
79,134 |
|
|
|
|
|
|
|
|
|
|
|
|
|
|
|
|
|
|
| (1) |
This adjustment represents the non-cash portion of operating lease
revenue related to the Company’s Arena License Agreements with MSG Sports. Pursuant to GAAP, recognition of operating lease revenue is recorded on a straight-line basis over the term of the agreement based upon the value of total future
payments under the arrangement. As a result, operating lease revenue is comprised of a contractual cash component plus or minus a non-cash component for each period presented. Operating income on a GAAP basis
includes lease income of (i) $2,290 and $41,524 of revenue collected in cash for the three and twelve months ended June 30, 2023, respectively, and $5,483 and $40,319 of revenue collected in cash for the three and twelve months ended
June 30, 2022, respectively, and (ii) a non-cash portion of $1,467 and $26,545 for the three and twelve months ended June 30, 2023, respectively, and $3,792 and $27,754 for the three and twelve
months ended June 30, 2022, respectively. |
7
MADISON SQUARE GARDEN ENTERTAINMENT CORP.
CONDENSED CONSOLIDATED AND COMBINED BALANCE SHEETS
(in thousands)
|
|
|
|
|
|
|
|
|
| |
|
June 30, |
|
| |
|
2023 |
|
|
2022 |
|
| ASSETS |
|
|
|
|
|
|
|
|
| Current Assets: |
|
|
|
|
|
|
|
|
| Cash and cash equivalents and restricted cash |
|
$ |
84,355 |
|
|
$ |
62,573 |
|
| Accounts receivable, net |
|
|
63,898 |
|
|
|
102,501 |
|
| Related party receivables, current |
|
|
69,466 |
|
|
|
96,938 |
|
| Prepaid expenses and other current assets |
|
|
77,562 |
|
|
|
79,441 |
|
|
|
|
|
|
|
|
|
|
| Total current assets |
|
|
295,281 |
|
|
|
341,453 |
|
| Non-Current Assets: |
|
|
|
|
|
|
|
|
| Property and equipment, net |
|
|
628,888 |
|
|
|
696,079 |
|
| Right-of-use lease
assets |
|
|
235,790 |
|
|
|
271,154 |
|
| Goodwill |
|
|
69,041 |
|
|
|
69,041 |
|
| Intangible assets, net |
|
|
63,801 |
|
|
|
65,439 |
|
| Other non-current assets |
|
|
108,356 |
|
|
|
83,535 |
|
|
|
|
|
|
|
|
|
|
| Total assets |
|
$ |
1,401,157 |
|
|
$ |
1,526,701 |
|
|
|
|
|
|
|
|
|
|
| LIABILITIES AND DEFICIT |
|
|
|
|
|
|
|
|
| Current Liabilities: |
|
|
|
|
|
|
|
|
| Accounts payable, accrued and other current liabilities |
|
$ |
214,725 |
|
|
$ |
221,961 |
|
| Related party payables, current |
|
|
47,281 |
|
|
|
72,683 |
|
| Long-term debt, current |
|
|
16,250 |
|
|
|
8,762 |
|
| Operating lease liabilities, current |
|
|
36,529 |
|
|
|
39,006 |
|
| Deferred revenue |
|
|
225,855 |
|
|
|
202,678 |
|
|
|
|
|
|
|
|
|
|
| Total current liabilities |
|
|
540,640 |
|
|
|
545,090 |
|
| Non-Current Liabilities: |
|
|
|
|
|
|
|
|
| Long-term debt, net of deferred financing costs |
|
|
630,184 |
|
|
|
654,912 |
|
| Operating lease liabilities, non-current |
|
|
219,955 |
|
|
|
254,114 |
|
| Deferred tax liabilities, net |
|
|
23,518 |
|
|
|
23,253 |
|
| Other non-current liabilities |
|
|
56,332 |
|
|
|
50,921 |
|
|
|
|
|
|
|
|
|
|
| Total liabilities |
|
|
1,470,629 |
|
|
|
1,528,290 |
|
|
|
|
|
|
|
|
|
|
| Commitments and contingencies |
|
|
|
|
|
|
|
|
| Deficit: |
|
|
|
|
|
|
|
|
| Class A Common Stock(a) |
|
|
450 |
|
|
|
— |
|
| Class B Common Stock(b) |
|
|
69 |
|
|
|
— |
|
| Additional paid-in capital |
|
|
17,727 |
|
|
|
— |
|
| Treasury stock at cost (840 shares as of June 30, 2023) |
|
|
(25,000 |
) |
|
|
— |
|
| Sphere Entertainment Co. investment |
|
|
— |
|
|
|
33,265 |
|
| Accumulated deficit |
|
|
(28,697 |
) |
|
|
— |
|
| Accumulated other comprehensive loss |
|
|
(34,021 |
) |
|
|
(34,740 |
) |
|
|
|
|
|
|
|
|
|
| Total MSG Entertainment stockholders’ deficit |
|
|
(69,472 |
) |
|
|
(1,475 |
) |
| Nonredeemable noncontrolling interests |
|
|
— |
|
|
|
(114 |
) |
|
|
|
|
|
|
|
|
|
| Total deficit |
|
|
(69,472 |
) |
|
|
(1,589 |
) |
|
|
|
|
|
|
|
|
|
| Total liabilities and deficit |
|
$ |
1,401,157 |
|
|
$ |
1,526,701 |
|
|
|
|
|
|
|
|
|
|
| (a) |
Class A Common Stock, $0.01 par value per share, 120,000 shares authorized; 45,024 shares outstanding as of
June 30, 2023. |
| (b) |
Class B Common Stock, $0.01 par value per share, 30,000 shares authorized; 6,867 shares outstanding as of
June 30, 2023. |
8
MADISON SQUARE GARDEN ENTERTAINMENT CORP.
SELECTED CASH FLOW INFORMATION
(in thousands)
(Unaudited)
|
|
|
|
|
|
|
|
|
| |
|
Twelve Months Ended
June 30, |
|
| |
|
2023 |
|
|
2022 |
|
| Net cash provided by operating activities |
|
$ |
135,694 |
|
|
$ |
95,351 |
|
| Net cash provided by investing activities |
|
|
30,305 |
|
|
|
45,440 |
|
| Net cash used in financing activities |
|
|
(144,217 |
) |
|
|
(396,287 |
) |
|
|
|
|
|
|
|
|
|
| Net increase (decrease) in cash, cash equivalents and restricted cash |
|
|
21,782 |
|
|
|
(255,496 |
) |
| Cash, cash equivalents and restricted cash, beginning of period |
|
|
62,573 |
|
|
|
318,069 |
|
|
|
|
|
|
|
|
|
|
| Cash, cash equivalents and restricted cash, end of period |
|
$ |
84,355 |
|
|
$ |
62,573 |
|
|
|
|
|
|
|
|
|
|
9
MADISON SQUARE GARDEN ENTERTAINMENT CORP.
APPENDIX
FISCAL 2024
FINANCIAL GUIDANCE
ADJUSTMENTS TO RECONCILE OPERATING INCOME TO
ADJUSTED OPERATING INCOME
(in millions)
|
|
|
| |
|
Fiscal Year 2024 |
| Operating income |
|
$100 - $110 |
| Non-cash portion of arena license fees from MSG
Sports |
|
(25) |
| Depreciation and amortization |
|
55 |
| Share-based compensation |
|
30 |
| Gains, net on dispositions |
|
— |
| Amortization for capitalized cloud computing costs |
|
— |
|
|
|
| Adjusted operating income |
|
$160 - $170 |
|
|
|
10

Exhibit 99.2 AUGUST 2023

SAFE HARBOUR Madison Square Garden Entertainment Corp. (the Company )
has filed with the Securities and Exchange Commission an Annual Report on Form 10-K for the year ended June 30, 2023. The Annual Report contains extensive disclosure about the Company and its business, including selected historical financial
information and risk factors that an investor should consider before deciding whether to invest in securities of the Company. This presentation may contain statements that constitute forward looking statements within the meaning of the Private
Securities Litigation Reform Act of 1995. Such statements include, but are not limited to, certain expectations, goals, projections, and benefits. Words or phrases “expects,” “anticipates,” “believes,”
“estimates,” “may,” “will,” “should,” “could,” “potential,” “continue,” “intends,” “plans,” and similar words and terms used in the
discussion of future operating and future financial performance identify forward looking statements. Investors are cautioned that any such forward looking statements are not guarantees of future performance or results and are subject to known and
unknown risks, uncertainties and other factors. Actual results, developments or events may differ materially from those in the forward looking statements as a result of various factors, including, but not limited to, the performance of the Company
and its business and operations, its financial condition, factors affecting the industries in which it operates and the factors described in the Annual Report, including the sections titled “Risk Factors” and “Management’s
Discussion and Analysis of Financial Condition and Results of Operations” contained therein. Forward looking statements speak only as of the date they are made. The Company disclaims any obligation to update or revise any forward-looking
statements contained herein, whether written or oral, that may be made from time to time, whether as a result of new information, future developments or for any other reason, except to the extent required by law. Investors should not place undue
reliance on such forward-looking statements and should not regard the inclusion of such statements as representations by the Company that its plans and objectives will be achieved or realized. Investors are further advised to consult any further
disclosures by the Company in its subsequent filings with the Securities and Exchange Commission. 2

NON-GAAP FINANCIAL MEASURES We define adjusted operating income (loss)
(“AOI”), which is a non-GAAP financial measure, as operating income (loss) excluding (i) the impact of non- cash straight-line leasing revenue associated with the Arena License Agreements with Madison Square Garden Sports Corp. ( MSG Sp
orts ), (ii) depreciation, amortization and impairments of property and equipment, goodwill and intangible assets, (iii) share -based compensation expense, (iv) restructuring charges or credits, (v) merger and acquisition-related costs, including
litigation expenses, (vi) gains or losses on sales or dispositions of businesses and associated settlements, (vii) the impact of purchase accounting adjustments related to business acquisitions, (viii) gains and losses related to the remeasurement
of liabilities under the executive deferred compensation plan, and (ix) amortization for capitalized clo ud computing arrangement costs. We believe that given the length of the Arena License Agreements and resulting magnitude of the difference in
leasing revenue recognized and cash revenue received, the exclusion of non-cash leasing revenue provides investors with a clearer picture of the Company's operating performance. Management believes that this adjustment is beneficial for other
incremental reasons as well. This adjustment provides senior management, investors and analysts with important information regarding a long-term related party agreement with MSG Sports. In addition, this adjustment is included under the Company's
debt covenant compliance calculation and is a component of the performance measures used to evaluate, and compensat e senior management of the Company. We believe that the exclusion of share-based compensation expense or benefit allows investors to
better track the performance of our business without regard to the settlement of an obligation that is not expected to be made in cash. We elimin ate merger and acquisition-related costs, when applicable, because the Company does not consider such
costs to be indicative of the ongoing operating performance of the Company as they result from an event that is of a non-recurring nature, thereby enhancing comparability. In addition, management believes that the exclusion of gains and losses
related to the remeasurement of liabilities under the executive deferred compensation plan, provides investors with a clearer picture of the Company's operating performance given that, in accordance with GAAP, gains and losses related to the r
emeasurement of liabilities under the executive deferred compensation plan are recognized in Operating (income) loss whereas gains and losses related to the remeasurement of the assets under the executive deferred compensation plan, which are equal
to and therefore fully offset the gains and losses related to the remeasurement of liabilities, are recognized in Other income (expense), net, which is not reflected in Operating incom e (loss). We believe AOI is an appropriate measure for
evaluating the operating performance of the Company on a consolidated and combin ed basis. AOI and similar measures with similar titles are common performance measures used by investors and analysts to analyze our performanc e. Internally, we use
revenues and AOI as the most important indicators of our business performance, and evaluate management’s effectiveness with s pecific reference to these indicators. AOI should be viewed as a supplement to and not a substitute for operating
income (loss), net income (loss) , cash flows from operating activities, and other measures of performance and/or liquidity presented in accordance with U.S. generally accepted accountin g principles (“GAAP”). Since AOI is not a measure
of performance calculated in accordance with GAAP, this measure may not be comparable to similar m easures with similar titles used by other companies. For a reconciliation from Operating Income (U.S. GAAP Basis) to AOI please refer to the appen dix
within this presentation. 3

LEGENDARY ICONIC COMPELLING OPPORTUNITIES BRANDS VENUES 4

OVERVIEW OF MSG ENTERTAINMENT SPIN-OFF ◼ On April 20, 2023, MSG
Entertainment (NYSE: MSGE) was spun-off by Sphere Entertainment Co. ◼ ~67% of shares were distributed to shareholders, while 33% were retained by Sphere Entertainment Co. (1) ◼ As of August 18, 2023, Sphere Entertainment Co. retained 17%
of total shares outstanding ◼ Spin-off created a pure-play live entertainment company, poised to benefit from strong demand for shared experiences 1 SPHERE ENTERTAINMENT CO. IS REQUIRED BY APPLICABLE TAX RULES TO DISPOSE OF THE RETAINED
INTEREST WITHIN A FIXED PERIOD OF TIM E, WHICH MAY 5 OCCUR THROUGH A SERIES OF STEPS INCLUDING SALES, EXCHANGE OFFERS OR PRO RATA DISTRIBUTIONS

KEY INVESTMENT HIGHLIGHTS ENDURING PROFITABLE WORLD-CLASS POPULARITY OF
BUSINESS ENTERTAINMENT POISED FOR CHRISTMAS VENUES SPECTACULAR GROWTH SUBSTANTIAL POTENTIAL FOR PRESENCE IN ONGOING NEW YORK MARKET RETURN OF CAPITAL 6

OUR PORTFOLIO 7

5 ICONIC VENUES ~900 LIVE EVENTS ACROSS NEW YORK AND CHICAGO IN FISCAL
2023 5.5+ MILLION GUESTS IN FISCAL 2023 35 YEAR DEALS 89 YEARS TO HOST HOME GAMES FOR OF THE CHRISTMAS SPECTACULAR NEW YORK KNICKS & RANGERS STARRING THE RADIO CITY ROCKETTES 8

MADISON SQUARE GARDEN “The World’s Most Famous Arena”
1 #1 grossing venue of its size in the world ~21,000 seat maximum capacity 1 BILLBOARD MAGAZINE AS OF YEAR END 2022 9

THE THEATER RADIO CITY MUSIC HALL 1 AT MADISON SQUARE GARDEN #3
grossing venue of its size in the world Versatile venue in central New York City location New York City and national landmark ~5,600 seat maximum capacity ~6,000 seat maximum capacity 1 BILLBOARD MAGAZINE AS OF YEAR END 2022 10
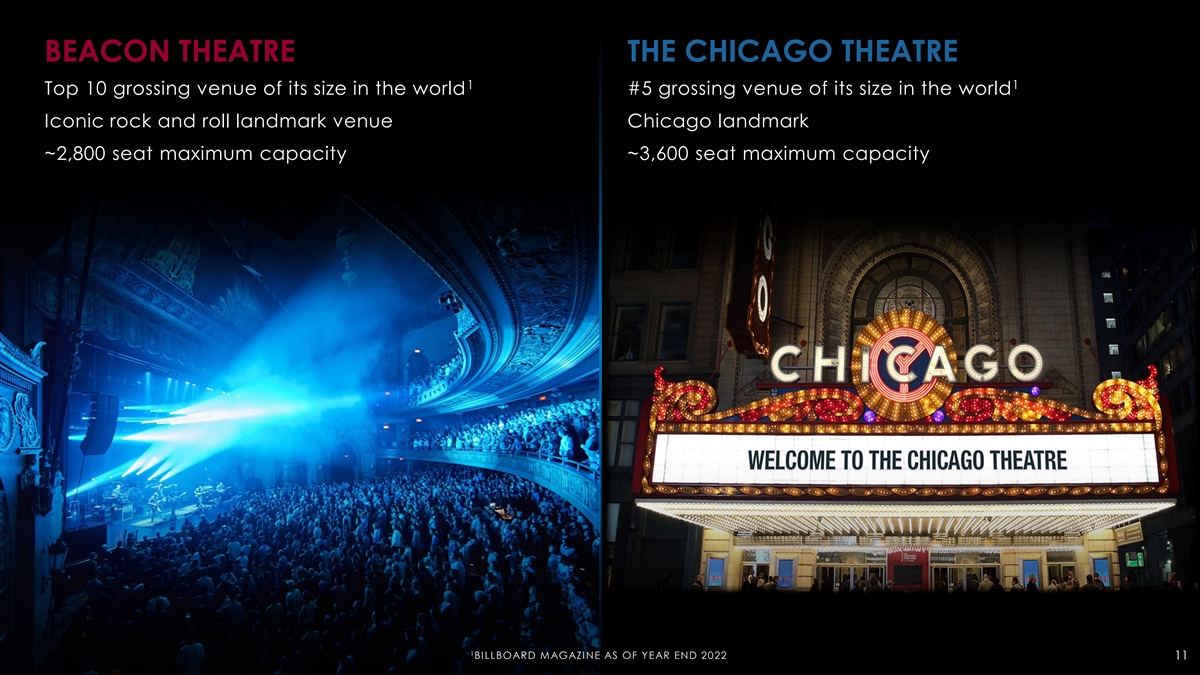
BEACON THEATRE THE CHICAGO THEATRE 1 1 Top 10 grossing venue of its
size in the world #5 grossing venue of its size in the world Iconic rock and roll landmark venue Chicago landmark ~2,800 seat maximum capacity ~3,600 seat maximum capacity 1 BILLBOARD MAGAZINE AS OF YEAR END 2022 11

CHRISTMAS SPECTACULAR STARRING THE RADIO CITY ROCKETTES Own the Radio
City Rockettes and Christmas Spectacular brands 89 years of New York’s cherished holiday tradition 12

VALUABLE REAL ESTATE HOLDINGS O U R V E N U E S VENUE MARKET SIZE NEW
YORK CITY ~1.1M SQ. FT. BUILDING NEW YORK CITY PART OF THE GARDEN CHICAGO ~73K SQ. FT. BUILDING VENUE MARKET SIZE EXPIRATION 1 NEW YORK CITY ~577K SQ. FT. BUILDING 2038 2 NEW YORK CITY ~57K SQ. FT. BUILDING 2036 1 RADIO CITY MUSIC HALL’S LEASE
EXPIRES IN 2038 WITH AN OPTION TO RENEW FOR AN ADDITIONAL TEN YEARS 13 2 BEACON THEATRE’S LEASE EXPIRES IN 2036 WITH AN OPTION TO RENEW FOR AN ADDITIONAL TEN YEARS LEASED OWNED

OUR BUSINESS 14

SUBSTANTIAL PRESENCE IN NEW YORK CITY METRO AREA T H E E N T E R T A I
N M E N T C A P I T A L O F T H E W O R L D 23 MILLION+ 56 MILLION+ 1 2 POPULATION ANNUAL TOURISTS HOME TO GREATEST # RANKED #1 OF 210 4 3 OF FORTUNE 500 COMPANIES DESIGNATED MARKET AREAS #1 CONCERT MARKET 5 IN THE U.S. 1 NEW-YORK-NEWARK (UNITED
STATES CENSUS BUREAU) 2 NYC & COMPANY FY22 REPORT 3 FORTUNE 500 COMPANIES BY REGION REPORT 2022 4 TRACKED BY NIELSEN RESEARCH 5 15 2023 POLLSTAR CONCERT MARKET RANKINGS (AS OF DECEMBER 2022)

ESTABLISHED LEADER IN LIVE U N I Q U E A P P R O A C H D R I V E S B O
O K I N G S U C C E S S OPPORTUNITIES UNMATCHED EXPERIENCES• Grow per-event revenue and profitability • World-class facilities and operations • Drive repeat visitation to increase • Leveraging innovative technology
sell-through ARTIST-FIRST APPROACH • Talent-friendly venues and service • Increase venue utilization • Exclusive recurring programming • Exploring new event types ESTABLISHED RELATIONSHIPS • Deep industry connections
• Improve revenue and engagement across assets • Promoter agnostic • Enable tailored offerings and cross- • Large and growing proprietary promotion to drive sell-through customer database 16

THE ENDURING POPULARITY OF THE CHRISTMAS SPECTACULAR 8 9 Y E A R S O F
N E W Y O R K ’ S C H E R I S H E D H O L I D A Y T R A D I T I O N PAID ATTENDANCE TOTAL REVENUE IN MILLIONS $ IN MILLIONS $132 $130 $128 1.1 1.1 1.1 1.1 1.0 1.0 1.0 1.0 1.0 1.0 $114 1.0 0.9 $109 $102 $101 $95 $93 $90 $84 $82 $56 0.4 1 1 FY10
FY11 FY12 FY13 FY14 FY15 FY16 FY17 FY18 FY19 FY20 FY22 FY23 FY10 FY11 FY12 FY13 FY14 FY15 FY16 FY17 FY18 FY19 FY20 FY22 FY23 1 1 FY10 FY11 FY12 FY13 FY14 FY15 FY16 FY17 FY18 FY19 FY20 FY21 FY22 FY23 Number of Shows 204 212 215 209 210 205 204 197
200 210 199 0 101 181 1 FY 2021 PRODUCTION CANCELLED DUE TO THE IMPACT OF COVID -19 AND FY 2022 PRODUCTION RUN ENDED EARLY DUE TO OMICRON COVID -19 VARIANT 17

VALUABLE LONG-TERM ARENA LICENSE AGREEMENTS WITH MSG SPORTS M A D I S O
N S Q U A R E G A R D E N S E R V E S A S H O M E T O M A R Q U E E S P O R T S F R A N C H I S E S A R E N A L I C E N S E F E E C A S H P A Y M E N T S $ I N M I L L I O N S Knicks Rangers $107 ORIGINAL NBA “ORIGINAL SIX T E A M N H L T E A
M $80 $46 35 YEAR DEALS STARTING IN FY2021 $59 $34 88 PRE / REGULAR 3% ANNUAL $42 $25 SEASON GAMES $40 1 ESCALATORS PER YEAR $18 $17 $61 $46 ARENA LICENSE AGREEMENTS INCLUDE ADDITIONAL REVENUE AND $34 2 $24 $23 PROFIT-SHARING BETWEEN THE COMPANY AND
MSG SPORTS FY22 FY23 FY35 FY45 FY55 1 FOR ARENA LICENSE FEES UNDER THE ARENA LICENSE AGREEMENTS WITH MSG SPORTS 18 2 INCLUDES SUITES, FOOD, BEVERAGE AND MERCHANDISE AND SHARED SPONSORSHIP AND SIGNAGE ASSETS

STRONG MARKETING PARTNERSHIP TRACK RECORD S P O N S O R S H I P R E L A
T I O N S H I P S D E L I V E R C O M P E L L I N G V A L U E INNOVATIVE MARKETING PARTNERSHIP OFFERINGS • Sought-after entertainment brands • Significant exposure in NYC • Cross-selling opportunities with MSG Sports VALUABLE
MULTI-YEAR PARTNERSHIPS • Signature and Marquee partners represent majority of sponsorship revenue ATTRACTIVE GROWTH OPPORTUNITIES • Utilizing integrated approach to renew existing partners • Targeting emerging and underpenetrated
verticals • Selectively expanding reach through outdoor signage 19

EXCEPTIONAL HOSPITALITY OFFERINGS D E L I V E R I N G F I R S T - C L A
S S E X P E R I E N C E S WIDE ARRAY OF PREMIUM PRODUCTS 21 58 EVENT LEVEL LEXUS LEVEL • Over 100 premium hospitality offerings SUITES SUITES • Range of exclusive private spaces, first-class amenities and premier seating locations PRIME
POSITIONING IN NEW YORK CITY • Primarily licensed to corporate customers • Multi-year agreements for majority of suites 18 CAESARS SPORTSBOOK INFOSYS • Partnership with MSG Sports offers access to premium LOUNGE LEVEL SUITES live
sporting events POISED FOR GROWTH • Strength of product and content offerings bolsters ongoing renewal and new sales activity • Plan to explore enhancing and expanding offerings, creating new monetization opportunities THE SUITE HUB LOFT
SIXTEEN • Two new event-level suite offerings expected in FY24 20

FINANCIAL OVERVIEW 21

DIVERSIFIED REVENUE BASE F I S C A L 2 0 2 3 R E P O R T E D R E V E N
U E M I X SPONSORSHIP, 1 SIGNAGE, & SUITES 31% FISCAL 2023 FOOD, BEVERAGE & REVENUE MERCHANDISE $851M 18% TICKETING & VENUE LICENSE FEES 42% ARENA LICENSE 2 AGREEMENTS 8% 1 INCLUDES ADVERTISING SALES COMMISSIONS REVENUE ($8.8M) UNDER THE
ADVERTISING SALES REPRESENTATION AGREEMENT WITH MSG NETWORKS , 22 2 WHICH WAS TERMINATED EFFECTIVE DECEMBER 31, 2022. INCLUDES OTHER REVENUE FROM LEASES AND SUBLEASES

FISCAL 2024 FINANCIAL GUIDANCE KEY DRIVERS OF FISCAL 2024 GUIDANCE
IMPROVING VENUE UTILIZATION FISCAL 2024 REVENUE • Low double-digit percentage growth in events in bookings business $900M-$930M BUILDING ON THE SUCCESS OF CHRISTMAS SPECTACULAR • Increasing sell-through and number of shows 1 OPERATING
INCOME GROWING MARKETING PARTNERSHIPS AND PREMIUM HOSPITALITY $100M-$110M • Robust new sales and renewal activity • Introducing two new event-level suite offerings 1 ADJUSTED OPERATING INCOME AGREEMENTS WITH MSG SPORTS •
Contractual annual escalators in arena license fees $160M-$170M 2 • Growth in revenues subject to sharing of economics with MSG Sports NOTE: M REPRESENTS DOLLARS IN MILLIONS 1 PLEASE REFER TO SLIDE NUMBER 3 FOR OUR DISCUSSION ON NON -GAAP
FINANCIAL MEASURES AND THE APPENDIX FOR A RECONCILIATION FROM OPER ATING INCOME (U.S. GAAP BASIS) TO AOI 23 2 INCLUDES SUITES, FOOD, BEVERAGE AND MERCHANDISE AND SHARED SPONSORSHIP AND SIGNAGE ASSETS

BALANCE SHEET SNAPSHOT P O T E N T I A L F O R O N G O I N G R E T U R
N O F C A P I T A L CAPITAL ALLOCATION PRIORITIES • Focus on debt paydown and opportunistic return of capital 5 TOTAL DEBT OUTSTANDING $659M to shareholders 1 • $90M Class A Shares repurchased since April 2023 6 CASH AND CASH EQUIVALENTS
$76M • $160M remaining under share repurchase authorization NET DEBT $583M WELL POSITIONED FOR CASH GENERATION 2 • FY2024 AOI Guidance $160M-$170M 7 3 NET DEBT LEVERAGE 3.4x – 3.6x • FY2024 estimated net interest payments
$45M-$50M • Capital expenditure plans primarily 4 maintenance-related • Minimal cash taxpayer through FY2026 NOTE: M REPRESENTS DOLLARS IN M ILLIONS 1 INCLU DES (A) $25M SHARE REPU RCHASE FROM SPHERE ENTERTAINMENT CO. AND (B) ACCEPTING
THE REPAYM ENT OF THE $65M DELAYED DRAW TER M LOAN FACILITY, INCLU DING ACCRU ED FEES AND 2 INTEREST, FROM SPHERE ENTERTAINMENT CO. WITH SHARES OF CLASS A COM MON STOCK PLEASE REFER TO SLIDE NU MBER 3 FOR OU R DISCU SSION ON NON -GAAP FINANCIAL M
EASU RES AND THE 3 4 APPENDIX FOR A RECONCILIATION FROM OPERATING INCOME (U .S. GAAP BASIS) TO AOI NET OF INTEREST INCOME RENOVATIONS OF THE GARDEN, BEACON THEATRE, AND RADIO CITY M U SIC HALL 5 6 7 WERE COM PLETED IN 2013, 2009, AND 1999,
RESPECTIVELY TOTAL DEBT OU TSTANDI NG AT 6/30/23 U NRESTRICTED CASH AND CASH EQU IVALENTS AT 6/30/23 BASED ON FISCAL 2024 AOI GU IDANCE 24 RANGE

APPENDIX 25

APPENDIX F Y 2 0 2 4 G U I D A N C E R E C O N C I L I A T I O N O F O
P E R A T I N G I N C O M E T O A D J U S T E D O P E R A T I N G I N C O M E PROJECTED FY2024 OPERATING INCOME (U.S.GAAP) $100M-$110M Non-cash portion of Arena License fees from MSGS $(25)M Depreciation and Amortization $55M Share-based
compensation $30M 1 PROJECTED FY2024 ADJUSTED OPERATING INCOME $160M-$170M NOTE: M REPRESENTS DOLLARS IN MILLIONS 1 26 PLEASE REFER TO SLIDE NUMBER 3 FOR OUR DISCUSSION ON NON -GAAP FINANCIAL MEASURES.

27
v3.23.2
| X |
- DefinitionBoolean flag that is true when the XBRL content amends previously-filed or accepted submission.
| Name: |
dei_AmendmentFlag |
| Namespace Prefix: |
dei_ |
| Data Type: |
xbrli:booleanItemType |
| Balance Type: |
na |
| Period Type: |
duration |
|
| X |
- DefinitionFor the EDGAR submission types of Form 8-K: the date of the report, the date of the earliest event reported; for the EDGAR submission types of Form N-1A: the filing date; for all other submission types: the end of the reporting or transition period. The format of the date is YYYY-MM-DD.
| Name: |
dei_DocumentPeriodEndDate |
| Namespace Prefix: |
dei_ |
| Data Type: |
xbrli:dateItemType |
| Balance Type: |
na |
| Period Type: |
duration |
|
| X |
- DefinitionThe type of document being provided (such as 10-K, 10-Q, 485BPOS, etc). The document type is limited to the same value as the supporting SEC submission type, or the word 'Other'.
| Name: |
dei_DocumentType |
| Namespace Prefix: |
dei_ |
| Data Type: |
dei:submissionTypeItemType |
| Balance Type: |
na |
| Period Type: |
duration |
|
| X |
- DefinitionAddress Line 1 such as Attn, Building Name, Street Name
| Name: |
dei_EntityAddressAddressLine1 |
| Namespace Prefix: |
dei_ |
| Data Type: |
xbrli:normalizedStringItemType |
| Balance Type: |
na |
| Period Type: |
duration |
|
| X |
- Definition
+ References
+ Details
| Name: |
dei_EntityAddressCityOrTown |
| Namespace Prefix: |
dei_ |
| Data Type: |
xbrli:normalizedStringItemType |
| Balance Type: |
na |
| Period Type: |
duration |
|
| X |
- DefinitionCode for the postal or zip code
| Name: |
dei_EntityAddressPostalZipCode |
| Namespace Prefix: |
dei_ |
| Data Type: |
xbrli:normalizedStringItemType |
| Balance Type: |
na |
| Period Type: |
duration |
|
| X |
- DefinitionName of the state or province.
| Name: |
dei_EntityAddressStateOrProvince |
| Namespace Prefix: |
dei_ |
| Data Type: |
dei:stateOrProvinceItemType |
| Balance Type: |
na |
| Period Type: |
duration |
|
| X |
- DefinitionA unique 10-digit SEC-issued value to identify entities that have filed disclosures with the SEC. It is commonly abbreviated as CIK. Reference 1: http://www.xbrl.org/2003/role/presentationRef
-Publisher SEC
-Name Exchange Act
-Number 240
-Section 12
-Subsection b-2
| Name: |
dei_EntityCentralIndexKey |
| Namespace Prefix: |
dei_ |
| Data Type: |
dei:centralIndexKeyItemType |
| Balance Type: |
na |
| Period Type: |
duration |
|
| X |
- DefinitionIndicate if registrant meets the emerging growth company criteria. Reference 1: http://www.xbrl.org/2003/role/presentationRef
-Publisher SEC
-Name Exchange Act
-Number 240
-Section 12
-Subsection b-2
| Name: |
dei_EntityEmergingGrowthCompany |
| Namespace Prefix: |
dei_ |
| Data Type: |
xbrli:booleanItemType |
| Balance Type: |
na |
| Period Type: |
duration |
|
| X |
- DefinitionCommission file number. The field allows up to 17 characters. The prefix may contain 1-3 digits, the sequence number may contain 1-8 digits, the optional suffix may contain 1-4 characters, and the fields are separated with a hyphen.
| Name: |
dei_EntityFileNumber |
| Namespace Prefix: |
dei_ |
| Data Type: |
dei:fileNumberItemType |
| Balance Type: |
na |
| Period Type: |
duration |
|
| X |
- DefinitionTwo-character EDGAR code representing the state or country of incorporation.
| Name: |
dei_EntityIncorporationStateCountryCode |
| Namespace Prefix: |
dei_ |
| Data Type: |
dei:edgarStateCountryItemType |
| Balance Type: |
na |
| Period Type: |
duration |
|
| X |
- DefinitionThe exact name of the entity filing the report as specified in its charter, which is required by forms filed with the SEC. Reference 1: http://www.xbrl.org/2003/role/presentationRef
-Publisher SEC
-Name Exchange Act
-Number 240
-Section 12
-Subsection b-2
| Name: |
dei_EntityRegistrantName |
| Namespace Prefix: |
dei_ |
| Data Type: |
xbrli:normalizedStringItemType |
| Balance Type: |
na |
| Period Type: |
duration |
|
| X |
- DefinitionThe Tax Identification Number (TIN), also known as an Employer Identification Number (EIN), is a unique 9-digit value assigned by the IRS. Reference 1: http://www.xbrl.org/2003/role/presentationRef
-Publisher SEC
-Name Exchange Act
-Number 240
-Section 12
-Subsection b-2
| Name: |
dei_EntityTaxIdentificationNumber |
| Namespace Prefix: |
dei_ |
| Data Type: |
dei:employerIdItemType |
| Balance Type: |
na |
| Period Type: |
duration |
|
| X |
- DefinitionLocal phone number for entity.
| Name: |
dei_LocalPhoneNumber |
| Namespace Prefix: |
dei_ |
| Data Type: |
xbrli:normalizedStringItemType |
| Balance Type: |
na |
| Period Type: |
duration |
|
| X |
- DefinitionBoolean flag that is true when the Form 8-K filing is intended to satisfy the filing obligation of the registrant as pre-commencement communications pursuant to Rule 13e-4(c) under the Exchange Act. Reference 1: http://www.xbrl.org/2003/role/presentationRef
-Publisher SEC
-Name Exchange Act
-Number 240
-Section 13e
-Subsection 4c
| Name: |
dei_PreCommencementIssuerTenderOffer |
| Namespace Prefix: |
dei_ |
| Data Type: |
xbrli:booleanItemType |
| Balance Type: |
na |
| Period Type: |
duration |
|
| X |
- DefinitionBoolean flag that is true when the Form 8-K filing is intended to satisfy the filing obligation of the registrant as pre-commencement communications pursuant to Rule 14d-2(b) under the Exchange Act. Reference 1: http://www.xbrl.org/2003/role/presentationRef
-Publisher SEC
-Name Exchange Act
-Number 240
-Section 14d
-Subsection 2b
| Name: |
dei_PreCommencementTenderOffer |
| Namespace Prefix: |
dei_ |
| Data Type: |
xbrli:booleanItemType |
| Balance Type: |
na |
| Period Type: |
duration |
|
| X |
- DefinitionTitle of a 12(b) registered security. Reference 1: http://www.xbrl.org/2003/role/presentationRef
-Publisher SEC
-Name Exchange Act
-Number 240
-Section 12
-Subsection b
| Name: |
dei_Security12bTitle |
| Namespace Prefix: |
dei_ |
| Data Type: |
dei:securityTitleItemType |
| Balance Type: |
na |
| Period Type: |
duration |
|
| X |
- DefinitionName of the Exchange on which a security is registered. Reference 1: http://www.xbrl.org/2003/role/presentationRef
-Publisher SEC
-Name Exchange Act
-Number 240
-Section 12
-Subsection d1-1
| Name: |
dei_SecurityExchangeName |
| Namespace Prefix: |
dei_ |
| Data Type: |
dei:edgarExchangeCodeItemType |
| Balance Type: |
na |
| Period Type: |
duration |
|
| X |
- DefinitionBoolean flag that is true when the Form 8-K filing is intended to satisfy the filing obligation of the registrant as soliciting material pursuant to Rule 14a-12 under the Exchange Act. Reference 1: http://www.xbrl.org/2003/role/presentationRef
-Publisher SEC
-Name Exchange Act
-Section 14a
-Number 240
-Subsection 12
| Name: |
dei_SolicitingMaterial |
| Namespace Prefix: |
dei_ |
| Data Type: |
xbrli:booleanItemType |
| Balance Type: |
na |
| Period Type: |
duration |
|
| X |
- DefinitionTrading symbol of an instrument as listed on an exchange.
| Name: |
dei_TradingSymbol |
| Namespace Prefix: |
dei_ |
| Data Type: |
dei:tradingSymbolItemType |
| Balance Type: |
na |
| Period Type: |
duration |
|
| X |
- DefinitionBoolean flag that is true when the Form 8-K filing is intended to satisfy the filing obligation of the registrant as written communications pursuant to Rule 425 under the Securities Act. Reference 1: http://www.xbrl.org/2003/role/presentationRef
-Publisher SEC
-Name Securities Act
-Number 230
-Section 425
| Name: |
dei_WrittenCommunications |
| Namespace Prefix: |
dei_ |
| Data Type: |
xbrli:booleanItemType |
| Balance Type: |
na |
| Period Type: |
duration |
|
Madison Square Garden En... (NYSE:MSGE)
Historical Stock Chart
From Apr 2024 to May 2024

Madison Square Garden En... (NYSE:MSGE)
Historical Stock Chart
From May 2023 to May 2024
