HP Inc. Down Over 16% After 1Q Sales Miss Estimates -- Data Talk
February 28 2019 - 11:07AM
Dow Jones News
HP Inc. (HPQ) is currently at $20.00, down $3.85 or 16.12%
-- Would be lowest close since Jan. 3, 2019, when it closed at
$19.93
-- On pace for largest percent decrease since Aug. 19, 2011,
when it fell 20.03%
- Earlier Thursday, Bank of America cut its rating on HP to
underperform from buy and BMO Capital cut its price target for HP
to $20.00/share from $22.00, Benzinga reported
-- On Wednesday, HP Inc. reported that sales missed Wall Street
targets in the first quarter, weighed down by the
weaker-than-expected sales of printing supplies to commercial
customers
-- Currently down three consecutive days; down 16.33% over this
period
-- Worst three day stretch since the three days ending Aug. 23,
2011, when it fell 16.84%
-- Down 9.19% month-to-date; on pace for worst month since
December 2018 when it fell 11.04%
-- Down 2.22% year-to-date
-- Down 34.66% from its all-time closing high of $30.62 on July
13, 2000
-- Traded as low as $19.80; lowest intraday level since Jan. 3,
2019, when it hit $19.70
-- Down 16.98% at today's intraday low; largest intraday percent
decrease since Aug. 19, 2011, when it fell as much as 22.91%
-- Worst performer in the S&P 500 today
-- Fifth most active stock in the S&P 500 today
All data as of 10:27:29 AM
Source: Dow Jones Market Data, FactSet
(END) Dow Jones Newswires
February 28, 2019 10:52 ET (15:52 GMT)
Copyright (c) 2019 Dow Jones & Company, Inc.
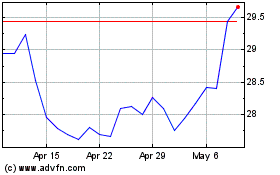
HP (NYSE:HPQ)
Historical Stock Chart
From Jun 2024 to Jul 2024

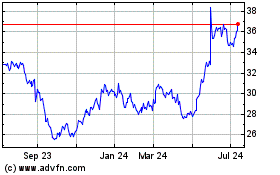
HP (NYSE:HPQ)
Historical Stock Chart
From Jul 2023 to Jul 2024
