SECURITIES AND EXCHANGE COMMISSION
WASHINGTON, D.C. 20549
SCHEDULE 13E-3
TRANSACTION STATEMENT UNDER SECTION 13(e) OF THE
SECURITIES EXCHANGE ACT OF 1934 AND
RULE 13e-3 THEREUNDER
Rule 13e-3 Transaction Statement
Under Section 13(e) of the Securities Exchange Act of 1934
HOLLY ENERGY PARTNERS, L.P.
(Name of the Issuer)
Holly Energy
Partners, L.P.
HF Sinclair Corporation
Navajo Pipeline Co., L.P.
Holly Apple Holdings LLC
Holly Logistic Services, L.L.C.
HEP Logistics Holdings, L.P.
(Names of Persons Filing Statement)
Common Units
(Title of
Class of Securities)
435763 10 7
(CUSIP Number of Class of Securities)
|
|
|
| Vaishali S. Bhatia
Executive Vice President, General Counsel and
Secretary HF Sinclair
Corporation 2828 N. Harwood St., Suite 1300
Dallas, Texas 75201 (214)
871-3555 |
|
Vaishali S. Bhatia
Executive Vice President, General Counsel and
Secretary Holly Energy
Partners, L.P. 2828 N. Harwood St., Suite 1300
Dallas, Texas 75201 (214)
871-3555 |
(Name, Address, and Telephone Numbers of Person Authorized to Receive Notices and Communications on Behalf of
the Persons Filing Statement)
With copies to
|
|
|
| Alan J. Bogdanow
Katherine Terrell Frank
E. Ramey Layne
Vinson & Elkins L.L.P.
Trammell Crow Center 2001
Ross Avenue, Suite 3900 Dallas, Texas 75201
(214) 220-7700 |
|
Hillary H. Holmes
Tull R. Florey Gibson,
Dunn & Crutcher LLP 811 Main Street, Suite 3000
Houston, Texas 77002
(346) 718-6600 |
This statement is filed in connection with (check the appropriate box):
|
|
|
|
|
| a. |
|
☒ |
|
The filing of solicitation materials or an information statement subject to Regulation 14A, Regulation 14C or Rule 13e-3(c) under the Securities Exchange Act of 1934. |
|
|
|
| b. |
|
☒ |
|
The filing of a registration statement under the Securities Act of 1933. |
|
|
|
| c. |
|
☐ |
|
A tender offer. |
|
|
|
| d. |
|
☐ |
|
None of the above. |
Check the following box if the soliciting materials or information statement referred to in checking box (a) are
preliminary copies: ☒
Check the following box if the filing is a final amendment reporting the results of the transaction: ☐
Neither the SEC nor any state securities regulatory agency has approved or disapproved the Merger, passed upon the merits or fairness of the Merger or
passed upon the adequacy or accuracy of the disclosure in this document. Any representation to the contrary is a criminal offense.
INTRODUCTION
This Rule 13e-3 Transaction Statement on Schedule 13E-3 (this
“Transaction Statement”), together with the exhibits hereto, is being filed with the U.S. Securities and Exchange Commission (the “SEC”) pursuant to Section 13(e) of the Securities Exchange Act of 1934, as amended (the
“Exchange Act”), by: (i) Holly Energy Partners, L.P., a Delaware limited partnership (“HEP”) and the issuer of the common units representing limited partner interests in HEP (“HEP Common Units,” and the holders of
HEP Common Units, the “HEP Unitholders”) that are subject to the Rule 13e-3 transaction; (ii) HF Sinclair Corporation, a Delaware corporation (“HF Sinclair”); (iii) Navajo Pipeline
Co., L.P., a Delaware limited partnership and an indirect wholly owned subsidiary of HF Sinclair (“HoldCo”); (iv) Holly Logistic Services, L.L.C., a Delaware limited liability company, the general partner (the “General Partner”)
of HEP Logistics Holdings, L.P. (“HLH”); (v) HLH, a Delaware limited partnership and the general partner of HEP; and (vi) Holly Apple Holdings LLC, a wholly owned subsidiary of HoldCo (“Merger Sub”). Collectively, the
persons filing this Transaction Statement are referred to as the “filing persons.”
This Transaction Statement relates to the Agreement and Plan
of Merger, dated as of August 15, 2023 (as the same may be amended or supplemented from time to time, the “Merger Agreement”), by and among HF Sinclair, HEP, HoldCo, the General Partner, HLH and Merger Sub, pursuant to which Merger
Sub will merge with and into HEP, with HEP surviving as an indirect, wholly owned subsidiary of HF Sinclair (the “Merger”).
Under the terms of
the Merger Agreement, at the effective time of the Merger, each outstanding HEP Common Unit other than the HEP Common Units owned by HF Sinclair, HoldCo, HLH, the General Partner and their respective affiliates, will be converted into the right to
receive (i) 0.315 (the “Exchange Ratio”) shares of common stock, par value $0.01 per share, of HF Sinclair (the “HF Sinclair Common Stock” and such issuance, the “HF Sinclair Stock Issuance”) and (ii) $4.00 in cash,
without interest (the “Cash Consideration” and, together with the shares of HF Sinclair Common Stock to be issued in the Merger, the “Merger Consideration”). The receipt of Merger Consideration in exchange for HEP Common Units
held by the HEP Unitholders other than HF Sinclair and its subsidiaries pursuant to the Merger will be a taxable transaction to U.S. Holders. See “United States Federal Income Tax Consequences” in the Joint Proxy Statement/Prospectus (as
defined below).
The Merger will become effective upon the filing of a properly executed certificate of merger with the Secretary of State of the State of
Delaware or at such later date and time as may be agreed by HF Sinclair and HEP in writing and set forth in the certificate of merger.
HF Sinclair will
not issue any fractional shares in the Merger. Instead, each holder of HEP Common Units that are converted pursuant to the Merger Agreement who otherwise would have received a fraction of a share of HF Sinclair Common Stock will be entitled to
receive, in lieu thereof, a cash payment (without interest and rounded to the nearest cent) in an amount equal to the product of (i) the aggregated amount of the fractional interest in shares of HF Sinclair Common Stock to which such holder
would otherwise be entitled to receive pursuant to the Merger Agreement and (ii) an amount equal to the average of the volume weighted average price per share of HF Sinclair Common Stock on the New York Stock Exchange (the “NYSE”) (as
reported by Bloomberg L.P., or, if not reported therein, in another authoritative source mutually selected by HF Sinclair and the General Partner) on each of the ten consecutive trading days ending with the complete trading day immediately prior to
the closing date of the Merger.
Holders of shares of HF Sinclair Common Stock prior to the Merger will continue to own their existing shares of HF
Sinclair Common Stock. In connection with the Merger, (i) HLH’s non-economic general partner interest in HEP, (ii) HLH’s special general partner interest in HEP (the “Special General
Partner Interest”), and (iii) the HEP Common Units owned by HF Sinclair and its subsidiaries, including HoldCo, will not be cancelled, will not be converted into the Merger Consideration and will remain outstanding following the Merger as
a non-economic general partner interest in HEP, a Special General Partner Interest in HEP and as HEP Common Units, respectively.
The closing of the Merger will take place on the third business day after the satisfaction or waiver of the conditions set forth in the Merger Agreement
(other than conditions that by their nature are to be satisfied at the closing but subject to the satisfaction or waiver of those conditions), or at such other place, date and time as HF Sinclair and HEP may agree.
1
The conflicts committee (the “HF Sinclair Conflicts Committee”) of the board of directors of HF
Sinclair (the “HF Sinclair Board”) has unanimously (i) determined that the Merger Agreement and the various transactions contemplated by the Merger Agreement, including the Merger and the HF Sinclair Stock Issuance (the
“Transactions”), are advisable and in the best interests of HF Sinclair and the HF Sinclair Stockholders, (ii) approved the Merger Agreement and the Transactions, including the Merger and the HF Sinclair Stock Issuance, on the terms
and subject to the conditions set forth in the Merger Agreement, (iii) recommended that the HF Sinclair Board approve the Merger Agreement and the Transactions, including the Merger and the HF Sinclair Stock Issuance, on the terms and subject
to the conditions set forth in the Merger Agreement, and (iv) resolved and recommended that the HF Sinclair Board resolve, to (a) direct that the HF Sinclair Stock Issuance be submitted to a vote of the HF Sinclair Stockholders for
approval at the HF Sinclair Special Meeting and (b) recommend approval of the HF Sinclair Stock Issuance by the HF Sinclair Stockholders at the HF Sinclair Special Meeting (as defined below).
The HF Sinclair Board (acting, in part, based upon the recommendation of the HF Sinclair Conflicts Committee) has unanimously (i) determined that the
Merger Agreement and the Transactions, including the Merger and the HF Sinclair Stock Issuance, are advisable and in the best interests of HF Sinclair and the HF Sinclair Stockholders, (ii) approved the Merger Agreement and the Transactions,
including the Merger and the HF Sinclair Stock Issuance, on the terms and subject to the conditions set forth in the Merger Agreement, (iii) directed that the HF Sinclair Stock Issuance be submitted to a vote of the HF Sinclair Stockholders for
approval at the HF Sinclair Special Meeting and (iv) resolved to recommend approval of the HF Sinclair Stock Issuance by the HF Sinclair Stockholders at the HF Sinclair Special Meeting.
The conflicts committee (the “HEP Conflicts Committee”) of the board of directors of the General Partner (the “GP Board”) has unanimously
and in good faith (i) determined that the Merger Agreement and the transactions contemplated thereby, including the Merger, are in the best interests of HEP, including the HEP Unitholders other than HF Sinclair, HoldCo, HLH, the General Partner
and their respective Affiliates (the “HEP Unaffiliated Unitholders”), (ii) approved the Merger Agreement and the transactions contemplated thereby, including the Merger (the foregoing constituting “Special Approval” for all
purposes of the Second Amended and Restated Agreement of Limited Partnership of HEP, dated as of October 31, 2017, as may be further amended, modified or supplemented from time to time, including Section 7.9(a) thereof) on the terms and
subject to the conditions set forth in the Merger Agreement, (iii) recommended that the GP Board approve the Merger Agreement and the transactions contemplated thereby, including the Merger, on the terms and subject to the conditions set forth
in the Merger Agreement, and (iv) resolved and recommended that the GP Board resolve to (a) direct that the Merger Agreement and the Merger be submitted to a vote of the HEP Unitholders for approval and (b) recommend approval of the
Merger Agreement and the Merger by the HEP Unitholders at the HEP Special Meeting (as defined below).
The GP Board (acting, in part, based upon the
recommendation of the HEP Conflicts Committee) has unanimously and in good faith (i) determined that the Merger Agreement and the transactions contemplated thereby, including the Merger, are in the best interests of HEP, including the HEP
Unaffiliated Unitholders, (ii) approved the Merger Agreement and the transactions contemplated thereby, including the Merger, on the terms and subject to the conditions set forth in the Merger Agreement, (iii) directed that the Merger
Agreement and the Merger be submitted to a vote of the HEP Unitholders for approval and (iv) resolved to recommend approval of the Merger Agreement and the Merger by the HEP Unitholders at the HEP Special Meeting.
In connection with the Merger, HF Sinclair will hold a special meeting of its stockholders (as the same may be adjourned or postponed, the “HF Sinclair
Special Meeting”), and HEP will hold a special meeting of its unitholders (as the same may be adjourned or postponed, the “HEP Special Meeting”).
At the HF Sinclair Special Meeting, the HF Sinclair Stockholders will be asked to consider and vote on proposals to (i) approve the issuance of shares of
HF Sinclair Common Stock to HEP Unitholders pursuant to the Merger Agreement (the “HF Sinclair Stock Issuance Proposal”) and (ii) approve the adjournment of the HF Sinclair Special Meeting to a later date or dates, if necessary or
appropriate, to solicit additional proxies in the event there are not sufficient votes at the time of the HF Sinclair Special Meeting to approve the HF Sinclair Stock Issuance Proposal. The approval by the HF Sinclair Stockholders of the HF Sinclair
Stock Issuance Proposal is required by the NYSE rules relating to issuances of securities to certain related parties.
2
At the HEP Special Meeting, the HEP Unitholders will be asked to consider and vote on proposals to
(i) approve the Merger Agreement and the transactions contemplated thereby (the “Merger Proposal”) and (ii) approve the adjournment of the HEP Special Meeting to a later date or dates, if necessary or appropriate, to solicit
additional proxies in the event there are not sufficient votes at the time of the HEP Special Meeting to approve the Merger Proposal. Pursuant to the Merger Agreement, HF Sinclair has agreed that it will vote, or cause to be voted, all HEP Common
Units then owned beneficially or of record by HF Sinclair or any of its subsidiaries in favor of the Merger Proposal. HF Sinclair currently holds approximately 47% of the issued and outstanding HEP Common Units through its subsidiaries, along with
the non-economic general partner interest and the Special General Partner Interest.
Concurrently with the filing
of this Transaction Statement, HF Sinclair is filing with the SEC a Registration Statement on Form S-4, which includes a joint proxy statement/prospectus of HF Sinclair and HEP (the “Joint Proxy
Statement/Prospectus”) in connection with the Merger Agreement and the transactions contemplated thereby. A copy of the Joint Proxy Statement/Prospectus is attached hereto as Exhibit (a)(1). A copy of the Merger Agreement is attached as Annex A
to the Joint Proxy Statement/Prospectus. All references in this Transaction Statement to Items numbered 1001 to 1016 are references to Items contained in Regulation M-A under the Exchange Act.
Pursuant to General Instruction F to Schedule 13E-3, the information contained in the Joint Proxy
Statement/Prospectus, including all annexes thereto, is expressly incorporated herein by reference in its entirety and responses to each item herein are qualified in their entirety by the information contained in the Joint Proxy Statement/Prospectus
and the annexes thereto. The cross-references below are being supplied pursuant to General Instruction G to Schedule 13E-3 and show the location in the Joint Proxy Statement/Prospectus of the information
required to be included in response to the items of Schedule 13E-3. As of the date hereof, the Joint Proxy Statement/Prospectus is in preliminary form and is subject to completion. Terms used but not defined in this Transaction Statement have the
meanings given to them in the Joint Proxy Statement/Prospectus. As of the date hereof, the Joint Proxy Statement/Prospectus is in preliminary form and is subject to completion or amendment.
All information concerning HEP contained in, or incorporated by reference into, this Transaction Statement was supplied by HEP. Similarly, all information
concerning any other filing person contained in, or incorporated by reference into, this Transaction Statement was supplied by such filing person.
| ITEM 1. |
SUMMARY TERM SHEET |
Regulation M-A Item 1001
The information set forth in the Joint Proxy Statement/Prospectus under the following captions is incorporated herein by reference:
“Summary Term Sheet”
“Questions and Answers”
| ITEM 2. |
SUBJECT COMPANY INFORMATION |
Regulation M-A Item 1002
| (a) |
Name and Address. The information set forth in the Joint Proxy Statement/Prospectus under the following
captions is incorporated herein by reference: |
“Summary Term Sheet—The Parties”
“The Parties”
| (b) |
Securities. The information set forth in the Joint Proxy Statement/Prospectus under the following
captions is incorporated herein by reference: |
“Special Meeting of HEP Unitholders”
“Special Factors—Interests of Certain Persons in the Merger”
“Special Factors—Treatment of HEP Equity Awards”
“Comparative Market Prices and Cash Dividend/Distribution Information”
| (c) |
Trading Market and Price. The information set forth in the Joint Proxy Statement/Prospectus under the
following caption is incorporated herein by reference: |
“Comparative Market Prices and Cash
Dividend/Distribution Information”
3
| (d) |
Dividends. The information set forth in the Joint Proxy Statement/Prospectus under the following caption
is incorporated herein by reference: |
“Comparative Market Prices and Cash Dividend/Distribution
Information”
| (e) |
Prior Public Offerings. The information set forth in the Joint Proxy Statement/Prospectus under the
following caption is incorporated herein by reference: |
“Prior Public Offerings”
| (f) |
Prior Stock Purchases. The information set forth in the Joint Proxy Statement/Prospectus under the
following caption is incorporated herein by reference: |
“Comparative Market Prices and Cash
Dividend/Distribution Information”
| ITEM 3. |
IDENTITY AND BACKGROUND OF FILING PERSON |
Regulation M-A Item 1003
| (a) through (b) |
Name and Address; Business and Background of Entities. HEP is the issuer of the equity securities that
are the subject of the Rule 13e-3 transaction reported hereby. |
The information
set forth in the Joint Proxy Statement/Prospectus under the following captions is incorporated herein by reference:
“Summary Term
Sheet—The Parties”
“The Parties”
“Where You Can Find More Information”
| (c) |
Business and Background of Natural Persons. The information set forth in the Joint Proxy
Statement/Prospectus under the following captions is incorporated herein by reference: |
“Business and Background
of Natural Persons”
“Where You Can Find More Information”
| ITEM 4. |
TERMS OF THE TRANSACTION |
Regulation M-A Item 1004
| (a) |
Material Terms. The information set forth in the Joint Proxy Statement/Prospectus under the following
captions is incorporated herein by reference: |
“Summary Term Sheet”
“Questions and Answers”
“Special Factors—Overview of Special Factors”
“Special Factors—Effects of the Merger”
“Special Factors—Background of the Merger”
“Special Factors—Resolution of Conflicts of Interest; Standards of Conduct and Modification of Duties”
“Special Factors—Position of HF Sinclair, HoldCo and Merger Sub as to the Fairness of the Merger”
“Special Factors—Purpose and Reasons of the Parent Entities for the Merger”
“Special Factors—Primary Benefits and Detriments of the Merger”
“Special Factors—Recommendations of the HF Sinclair Conflicts Committee and the HF Sinclair Board and their Reasons for the
Merger”
4
“Special Factors—Recommendations of the HEP Conflicts Committee and the GP
Board and the Reasons for their Recommendations”
“Special Factors—No Appraisal Rights”
“Special Factors—Listing of HF Sinclair Common Stock to be Issued in the Merger; Delisting and Deregistration of HEP Common
Units”
“Special Factors—Accounting Treatment of the Merger”
“Special Factors—Interests of Certain Persons in the Merger”
“Special Factors—Treatment of HEP Equity Awards”
“The Merger Agreement”
“Comparison of the Rights of the HF Sinclair Stockholders and the HEP Unitholders”
“Special Meeting of HF Sinclair Stockholders”
“Special Meeting of HEP Unitholders”
“United States Federal Income Tax Consequences”
“Annex A: Merger Agreement”
| (c) |
Different Terms. The information set forth in the Joint Proxy Statement/Prospectus under the following
captions is incorporated herein by reference: |
“Summary Term Sheet”
“Questions and Answers”
“Special Factors—Overview of Special Factors”
“Special Factors—Interests of Certain Persons in the Merger”
“Special Factors—Provisions for HEP Unaffiliated Unitholders”
“Special Factors—No Appraisal Rights”
“The Merger Agreement”
“Annex A: Merger Agreement”
| (d) |
Appraisal Rights. The information set forth in the Joint Proxy Statement/Prospectus under the following
captions is incorporated herein by reference: |
“Summary Term Sheet—No Appraisal Rights”
“Questions and Answers”
“Special Factors—No Appraisal Rights”
| (e) |
Provisions for Unaffiliated Security Holders. The information set forth in the Joint Proxy
Statement/Prospectus under the following caption is incorporated herein by reference: |
“Special
Factors—Provisions for HEP Unaffiliated Unitholders”
| (f) |
Eligibility for Listing or Trading. The information set forth in the Joint Proxy Statement/Prospectus
under the following captions is incorporated herein by reference: |
“Summary Term Sheet—Listing of HF
Sinclair Common Stock to be Issued in the Merger; Delisting and Deregistration of HEP Common Units”
“Special
Factors—Listing of HF Sinclair Common Stock to be Issued in the Merger; Delisting and Deregistration of HEP Common Units”
“The Merger Agreement—NYSE Listing, Delisting and Deregistration”
| ITEM 5. |
PAST CONTACTS, TRANSACTIONS, NEGOTIATIONS AND AGREEMENTS |
Regulation M-A Item 1005
| (a) |
Transactions. The information set forth in the Joint Proxy Statement/Prospectus under the following
captions is incorporated herein by reference: |
“Summary Term Sheet”
“The Parties”
5
“Special Factors—Interests of Certain Persons in the Merger”
“Past Contacts, Transactions, Negotiations and Agreements”
“Where You Can Find More Information”
| (b) through (c) |
Significant Corporate Events; Negotiations or Contacts. The information set forth in the Joint Proxy
Statement/Prospectus under the following captions is incorporated herein by reference: |
“Summary Term
Sheet”
“Special Factors—Overview of Special Factors”
“Special Factors—Background of the Merger”
“Special Factors—Position of HF Sinclair, HoldCo and Merger Sub as to the Fairness of the Merger”
“Special Factors—Recommendations of the HF Sinclair Conflicts Committee and the HF Sinclair Board and their Reasons for the
Merger”
“Special Factors—Recommendations of the HEP Conflicts Committee and the GP Board and the Reasons for their
Recommendations”
“Special Factors—Financing of the Merger”
“Special Factors—Interests of Certain Persons in the Merger”
“The Merger Agreement”
“Past Contacts, Transactions, Negotiations and Agreements”
“Annex A: Merger Agreement”
| (e) |
Agreements Involving the Subject Company’s Securities. The information set forth in the Joint Proxy
Statement/Prospectus under the following captions is incorporated herein by reference: |
“Summary Term
Sheet”
“Questions and Answers”
“Special Factors—Effects of the Merger”
“Special Factors—Interests of Certain Persons in the Merger”
“Special Factors—Treatment of HEP Equity Awards”
“The Merger Agreement”
“Comparative Market Prices and Cash Dividend/Distribution Information”
“Past Contacts, Transactions, Negotiations and Agreements”
“Where You Can Find More Information”
“Annex A: Merger Agreement”
| ITEM 6. |
PURPOSES OF THE TRANSACTION AND PLANS OR PROPOSALS. |
Regulation M-A Item 1006
| (b) |
Use of Securities Acquired. The information set forth in the Joint Proxy Statement/Prospectus under the
following captions is incorporated herein by reference: |
“Summary Term Sheet”
“Questions and Answers”
“Special Factors—Overview of Special Factors”
“Special Factors—Effects of the Merger”
“Special Factors—Purpose and Reasons of the Parent Entities for the Merger”
“Special Factors—Primary Benefits and Detriments of the Merger”
“Special Factors—Financing of the Merger”
“Special Factors—Listing of HF Sinclair Common Stock to be Issued in the Merger; Delisting and Deregistration of HEP Common
Units”
“Special Factors—Interests of Certain Persons in the Merger”
“The Merger Agreement”
6
“Annex A: Merger Agreement”
| (c)(1) through (8) |
Plans. The information set forth in the Joint Proxy Statement/Prospectus under the following captions is
incorporated herein by reference: |
“Summary Term Sheet”
“Questions and Answers”
“Comparative Market Prices and Cash Dividend/Distribution Information”
“Special Factors—Effects of the Merger”
“Special Factors—Background of the Merger”
“Special Factors—Position of HF Sinclair, HoldCo and Merger Sub as to the Fairness of the Merger”
“Special Factors—Primary Benefits and Detriments of the Merger”
“Special Factors—Purpose and Reasons of the Parent Entities for the Merger”
“Special Factors—Recommendations of the HF Sinclair Conflicts Committee and the HF Sinclair Board and their Reasons for the
Merger”
“Special Factors—Recommendations of the HEP Conflicts Committee and the GP Board and the Reasons for their
Recommendations”
“Special Factors—Interests of Certain Persons in the Merger”
“Special Factors—Financing of the Merger”
“Special Factors—Listing of HF Sinclair Common Stock to be Issued in the Merger; Delisting and Deregistration of HEP Common
Units”
“The Merger Agreement”
“Special Meeting of HF Sinclair Stockholders”
“Special Meeting of HEP Unitholders”
“Annex A: Merger Agreement”
| ITEM 7. |
PURPOSES, ALTERNATIVES, REASONS AND EFFECTS |
Regulation M-A Item 1013
| (a) |
Purposes. The information set forth in the Joint Proxy Statement/Prospectus under the following captions
is incorporated herein by reference: |
“Summary Term Sheet”
“Questions and Answers”
“Special Factors—Effects of the Merger”
“Special Factors—Background of the Merger”
“Special Factors—Position of HF Sinclair, HoldCo and Merger Sub as to the Fairness of the Merger”
“Special Factors—Primary Benefits and Detriments of the Merger”
“Special Factors—Purpose and Reasons of the Parent Entities for the Merger”
“Special Factors—Recommendations of the HF Sinclair Conflicts Committee and the HF Sinclair Board and their Reasons for the
Merger”
“Special Factors—Recommendations of the HEP Conflicts Committee and the GP Board and the Reasons for their
Recommendations”
“Special Factors—Interests of Certain Persons in the Merger”
| (b) |
Alternatives. The information set forth in the Joint Proxy Statement/Prospectus under the following
captions is incorporated herein by reference: |
“Summary Term Sheet”
“Special Factors—Background of the Merger”
“Special Factors—Position of HF Sinclair, HoldCo and Merger Sub as to the Fairness of the Merger”
“Special Factors—Primary Benefits and Detriments of the Merger”
“Special Factors—Purpose and Reasons of the Parent Entities for the Merger”
7
“Special Factors—Recommendations of the HF Sinclair Conflicts Committee and
the HF Sinclair Board and their Reasons for the Merger”
“Special Factors—Recommendations of the HEP Conflicts
Committee and the GP Board and the Reasons for their Recommendations”
“Special Factors—Financial Advisor Discussion
Materials Provided to HF Sinclair”
“Special Factors—Opinion of the Financial Advisor to the HEP Conflicts
Committee”
“Annex B: Opinion of Intrepid Partners, LLC”
| (c) |
Reasons. The information set forth in the Joint Proxy Statement/Prospectus under the following captions
is incorporated herein by reference: |
“Summary Term Sheet”
“Questions and Answers”
“Special Factors—Effects of the Merger”
“Special Factors—Background of the Merger”
“Special Factors—Position of HF Sinclair, HoldCo and Merger Sub as to the Fairness of the Merger”
“Special Factors—Primary Benefits and Detriments of the Merger”
“Special Factors—Purpose and Reasons of the Parent Entities for the Merger”
“Special Factors—Recommendations of the HF Sinclair Conflicts Committee and the HF Sinclair Board and their Reasons for the
Merger”
“Special Factors—Recommendations of the HEP Conflicts Committee and the GP Board and the Reasons for their
Recommendations”
“Special Factors—Financial Advisor Discussion Materials Provided to HF Sinclair”
“Special Factors—Opinion of the Financial Advisor to the HEP Conflicts Committee”
“Special Factors—Interests of Certain Persons in the Merger”
“Annex B: Opinion of Intrepid Partners, LLC”
| (d) |
Effects. The information set forth in the Joint Proxy Statement/Prospectus under the following captions
is incorporated herein by reference: |
“Summary Term Sheet”
“Questions and Answers”
“Special Factors—Effects of the Merger”
“Special Factors—Background of the Merger”
“Special Factors—Position of HF Sinclair, HoldCo and Merger Sub as to the Fairness of the Merger”
“Special Factors—Primary Benefits and Detriments of the Merger”
“Special Factors—Purpose and Reasons of the Parent Entities for the Merger”
“Special Factors—Recommendations of the HF Sinclair Conflicts Committee and the HF Sinclair Board and their Reasons for the
Merger”
“Special Factors—Recommendations of the HEP Conflicts Committee and the GP Board and the Reasons for their
Recommendations”
“Special Factors—Interests of Certain Persons in the Merger”
“Special Factors—Financing of the Merger”
“Special Factors—Listing of HF Sinclair Common Stock to be Issued in the Merger; Delisting and Deregistration of HEP Common
Units”
“The Merger Agreement”
“United States Federal Income Tax Consequences”
“Annex A: Merger Agreement”
8
| ITEM 8. |
FAIRNESS OF THE TRANSACTION |
Regulation M-A Item 1014
| (a) through (b) |
Fairness; Factors Considered in Determining Fairness. Barclays Capital, Inc. (“Barclays”) was
not requested to, and it did not, provide to HF Sinclair or any other person any (i) opinion (whether as to the fairness of any consideration, including, without limitation, the Merger Consideration, or otherwise), (ii) valuation of HEP for the
purpose of assessing the fairness of the Merger Consideration to any person, or (iii) recommendation as to how to vote or act on any matters relating to the proposed Merger or otherwise. Barclay’s discussion materials dated August 14,
2023 should not be construed as creating any fiduciary duty on Barclays’ part to HF Sinclair or any other person and such materials are not intended to be, and do not constitute, a recommendation to HF Sinclair or any other person in respect of
the Merger, including as to how any HEP Unitholder should act or vote in respect of the Merger Proposal or as to how any HF Sinclair Stockholder should act or vote in respect of the HF Sinclair Stock Issuance Proposal. |
The information set forth in the Joint Proxy Statement/Prospectus under the following captions is incorporated herein by reference:
“Summary Term Sheet”
“Special Factors—Background of the Merger”
“Special Factors—Position of HF Sinclair, HoldCo and Merger Sub as to the Fairness of the Merger”
“Special Factors—Primary Benefits and Detriments of the Merger”
“Special Factors—Purpose and Reasons of the Parent Entities for the Merger”
“Special Factors—Recommendations of the HF Sinclair Conflicts Committee and the HF Sinclair Board and their Reasons for the
Merger”
“Special Factors—Recommendations of the HEP Conflicts Committee and the GP Board and the Reasons for their
Recommendations”
“Special Factors—Opinion of the Financial Advisor to the HEP Conflicts Committee”
“Special Factors—Financial Advisor Discussion Materials Provided to HF Sinclair”
“Special Factors—Interests of Certain Persons in the Merger”
“Annex B: Opinion of Intrepid Partners, LLC”
| (c) |
Approval of Security Holders. The information set forth in the Joint Proxy Statement/Prospectus under
the following captions is incorporated herein by reference: |
“Questions and Answers”
“Special Factors—Primary Benefits and Detriments of the Merger”
“Special Factors—Purpose and Reasons of the Parent Entities for the Merger”
“Special Factors—Recommendations of the HEP Conflicts Committee and the GP Board and the Reasons for their Recommendations”
“The Merger Agreement—HEP Unitholder Approval”
“Special Meeting of HEP Unitholders”
| (d) |
Unaffiliated Representative. The information set forth in the Joint Proxy Statement/Prospectus under the
following captions is incorporated herein by reference: |
“Summary Term Sheet”
“Special Factors—Effects of the Merger”
“Special Factors—Background of the Merger”
“Special Factors—Recommendations of the HEP Conflicts Committee and the GP Board and their Reasons for the Merger”
“Special Factors—Opinion of the Financial Advisor to the HEP Conflicts Committee”
“Special Factors—Interests of Certain Persons in the Merger”
“The Merger Agreement”
“Annex B: Opinion of Intrepid Partners, LLC”
9
| (e) |
Approval of Directors. The information set forth in the Joint Proxy Statement/Prospectus under the
following captions is incorporated herein by reference: |
“Summary Term Sheet”
“Questions and Answers”
“Special Factors—Background of the Merger”
“Special Factors—Recommendations of the HEP Conflicts Committee and the GP Board and the Reasons for their Recommendations”
“Special Factors—Recommendations of the HF Sinclair Conflicts Committee and the HF Sinclair Board and their Reasons for
the Merger”
“Special Factors—Position of HF Sinclair, HoldCo and Merger Sub as to the Fairness of the Merger”
| (f) |
Other Offers. Not Applicable. |
| ITEM 9. |
REPORTS, OPINIONS, APPRAISALS AND CERTAIN NEGOTIATIONS |
Regulation M-A Item 1015
| (a) through (b) |
Report, Opinion or Appraisal; Preparer and Summary of the Report, Opinion or Appraisal. The discussion
materials prepared by Barclays and provided to HF Sinclair, the HF Sinclair Conflicts Committee and the HF Sinclair Board, dated as of August 14, 2023, are set forth as Exhibit (c)(2) and incorporated herein by reference. The discussion
materials prepared by Intrepid Partners, LLC and provided to the HEP Conflicts Committee, dated as of June 1, 2023, June 26, 2023, July 13, 2023, July 14, 2023, July 24, 2023, July 27, 2023, August 2, 2023,
August 9, 2023, August 11, 2023 and August 15, 2023 are set forth as Exhibits (c)(3)(A) through (c)(3)(J) hereto and are incorporated herein by reference. |
The information set forth in the Joint Proxy Statement/Prospectus under the following captions is incorporated herein by reference:
“Summary Term Sheet—Effects of the Merger”
“Summary Term Sheet—Position of HF Sinclair, HoldCo and Merger Sub as to the Fairness of the Merger”
“Special Factors—Purpose and Reasons of the Parent Entities for the Merger”
“Summary Term Sheet—Recommendations of the HF Sinclair Conflicts Committee and the HF Sinclair Board and their Reasons for the
Merger”
“Summary Term Sheet—Recommendations of the HEP Conflicts Committee and the GP Board and the Reasons for
their Recommendations”
“Summary Term Sheet—Financial Advisor Discussion Materials Provided to HF Sinclair”
“Summary Term Sheet—Opinion of the Financial Advisor to the HEP Conflicts Committee”
“Special Factors—Effects of the Merger”
“Special Factors—Background of the Merger”
“Special Factors—Opinion of the Financial Advisor to the HEP Conflicts Committee”
“Special Factors—Position of HF Sinclair, HoldCo and Merger Sub as to the Fairness of the Merger”
“Special Factors—Recommendations of the HF Sinclair Conflicts Committee and the HF Sinclair Board and their Reasons for the
Merger”
“Special Factors—Recommendations of the HEP Conflicts Committee and the GP Board and the Reasons for their
Recommendations”
“Special Factors—Financial Advisor Discussion Materials Provided to HF Sinclair”
“Special Factors—Fees and Expenses”
“Where You Can Find More Information”
“Annex B: Opinion of Intrepid Partners, LLC”
The written opinion of Intrepid Partners, LLC is attached to the Joint Proxy Statement/Prospectus as Annex B and is incorporated herein by
reference.
10
| (c) |
Availability of Documents. The reports, opinions or appraisals referenced in this Item 9 are filed
herewith and will be made available for inspection and copying at the principal executive offices of HF Sinclair and HEP during its regular business hours by any interested equity security holder of HEP Common Units or by any representative who has
been so designated in writing upon written request and at the expense of the requesting security holder. |
| ITEM 10. |
SOURCE AND AMOUNTS OF FUNDS OR OTHER CONSIDERATION |
Regulation M-A Item 1007
| (a) through (b),(d) |
Source of Funds; Conditions; Borrowed Funds. The information set forth in the Joint Proxy
Statement/Prospectus under the following captions is incorporated herein by reference: |
“Summary Term
Sheet—The Merger Consideration”
“Summary Term Sheet—The Merger Agreement”
“Summary Term Sheet—Fees and Expenses”
“Summary Term Sheet—Financing of the Merger”
“Special Factors—Background of the Merger”
“Special Factors—Recommendations of the HEP Conflicts Committee and the GP Board and the Reasons for their Recommendations”
“Special Factors—Interests of Certain Persons in the Merger”
“Special Factors—Fees and Expenses”
“Special Factors—Financing of the Merger”
| (c) |
Expenses. The information set forth in the Joint Proxy Statement/Prospectus under the following captions
is incorporated herein by reference: |
“Summary Term Sheet—Fees and Expenses”
“Summary Term Sheet—Financing of the Merger”
“Special Factors—Fees and Expenses”
“Special Factors—Financing of the Merger”
“Special Meeting of HF Sinclair Stockholders—Solicitation of Proxies”
“Special Meeting of HEP Unitholders—Solicitation of Proxies”
“The Merger Agreement—Effect of Termination; Termination Expenses”
| ITEM 11. |
INTEREST IN SECURITIES OF THE SUBJECT COMPANY |
Regulation M-A Item 1008
| (a) through (b) |
Securities Ownership; Securities Transactions. The information set forth in the Joint Proxy
Statement/Prospectus under the following captions is incorporated herein by reference: |
“Summary Term
Sheet—The Parties”
“Summary Term Sheet—The Merger”
“The Parties”
“Special Factors—Effects of the Merger”
“Special Factors—Interests of Certain Persons in the Merger”
“Special Factors—Treatment of HEP Equity Awards”
“Special Factors—Certain Beneficial Owners of HEP Common Units”
“The Merger Agreement”
“Comparative Market Prices and Cash Dividend/Distribution Information”
| ITEM 12. |
THE SOLICITATION OR RECOMMENDATION |
Regulation M-A Item 1012
| (d) |
Intent to Tender or Vote in a Going-Private Transaction. The information set forth in the Joint Proxy
Statement/Prospectus under the following captions is incorporated herein by reference: |
11
“Questions and Answers”
“Special Meeting of HEP Unitholders”
| (e) |
Recommendations of Others. The information set forth in the Joint Proxy Statement/Prospectus under the
following captions is incorporated herein by reference: |
“Summary Term Sheet”
“Questions and Answers”
“Special Factors—Position of HF Sinclair, HoldCo and Merger Sub as to the Fairness of the Merger”
“Special Factors—Purpose and Reasons of the Parent Entities for the Merger”
“Special Factors—Recommendations of the HF Sinclair Conflicts Committee and the HF Sinclair Board and their Reasons for the
Merger”
“Special Factors—Recommendations of the HEP Conflicts Committee and the GP Board and the Reasons for their
Recommendations”
“Special Factors—Interests of Certain Persons in the Merger”
“The Merger Agreement—Conditions to Completion of the Merger”
| ITEM 13. |
FINANCIAL INFORMATION |
Regulation M-A Item 1010
| (a) |
Financial Statements. The information set forth in the Joint Proxy Statement/Prospectus under the
following captions is incorporated herein by reference: |
“Special Factors—Effects of the Merger”
“Selected Historical Consolidated Financial Data of HEP”
“Where You Can Find More Information”
HEP’s Annual Report on Form 10-K for the year ended December 31, 2022 and Quarterly Report
on Form 10-Q for the quarterly period ended June 30, 2023 are incorporated herein by reference.
| (b) |
Pro Forma Information. Not applicable. |
| ITEM 14. |
PERSONS/ASSETS, RETAINED, EMPLOYED, COMPENSATED OR USED |
Regulation M-A Item 1009
| (a) through (b) |
Solicitations or Recommendations; Employees and Corporate Assets. The information set forth in the Joint
Proxy Statement/Prospectus under the following captions is incorporated herein by reference: |
“Summary Term
Sheet”
“Questions and Answers”
“Special Factors—Background of the Merger”
“Special Factors—Position of HF Sinclair, HoldCo and Merger Sub as to the Fairness of the Merger”
“Special Factors—Recommendations of the HF Sinclair Conflicts Committee and the HF Sinclair Board and their Reasons for the
Merger”
“Special Factors—Recommendations of the HEP Conflicts Committee and the GP Board and the Reasons for their
Recommendations”
“Special Factors—Interests of Certain Persons in the Merger”
“Special Factors—Fees and Expenses”
12
| ITEM 15. |
ADDITIONAL INFORMATION |
Regulation M-A Item 1011
| (c) |
Golden Parachute Compensation. The information set forth in the Joint Proxy Statement/Prospectus under
the following caption is incorporated herein by reference. |
“Special Factors—Interests of Certain Persons
in the Merger”
“Special Factors—No Golden Parachute Compensation Payable to the HEP Named Executive Officers in
Connection with the Merger”
| (c) |
Other Material Information. The information set forth in the Joint Proxy Statement/Prospectus, including
all annexes thereto, is incorporated herein by reference. |
Regulation M-A Item 1016
|
|
|
| Exhibit No. |
|
Description |
|
|
| (a)(1) |
|
Joint Proxy Statement/Prospectus of HF Sinclair Corporation and Holly Energy Partners, L.P. (incorporated herein by reference to the Registration
Statement on Form S-4 of HF Sinclair Corporation filed with the SEC concurrently with this Transaction Statement). |
|
|
| (a)(2) |
|
Joint Letter to the Stockholders of HF Sinclair Corporation and the Unitholders of Holly Energy Partners, L.P. (incorporated herein by reference
to the Joint Proxy Statement/Prospectus). |
|
|
| (a)(5) |
|
Form of Proxy Card and Voting Instructions for the HEP Special Meeting (incorporated herein by reference to the Joint Proxy Statement/Prospectus).
|
|
|
| (a)(6) |
|
Notice of Special Meeting of Unitholders of Holly Energy Partners, L.P. (incorporated herein by reference to the Joint Proxy Statement/Prospectus).
|
|
|
| (a)(7) |
|
Press Release of Holly Energy Partners, L.P. dated May
4, 2023 (incorporated herein by reference to Exhibit 99.1 to Holly Energy Partners, L.P.’s Current Report on Form 8-K filed with the SEC on May 4, 2023 (File No.
001-32225)). |
|
|
| (a)(8) |
|
Press Release of HF Sinclair Corporation dated May
4, 2023 (incorporated herein by reference to Exhibit 99.1 to HF Sinclair Corporation’s Current Report on Form 8-K filed with the SEC on May 4, 2023 (File No.
001-41325)). |
|
|
| (a)(9) |
|
Earnings Release of HF Sinclair Corporation dated May
4, 2023 (incorporated herein by reference to Exhibit 99.1 to HF Sinclair Corporation’s Current Report on Form 8-K filed with the SEC on May 4, 2023 (File No.
001-41325)). |
|
|
| (a)(10) |
|
Communication to Employees of Holly Energy Partners, L.P. from the Chief Executive Officer and President of Holly Energy Partners, L.P., dated
May 4, 2023 (incorporated herein by reference to Holly Energy Partners, L.P.’s Communication pursuant to Rule 425 of the Securities Act filed with the SEC on May 4, 2023 (File
No. 001-32225)). |
|
|
| (a)(11) |
|
Communication to Employees of HF Sinclair Corporation from HF Sinclair Corporation, dated May
4, 2023 (incorporated herein by reference to HF Sinclair Corporation’s Communication pursuant to Rule 425 of the Securities Act filed with the SEC on May 4, 2023 (File No. 001-32225)).
|
|
|
| (a)(12) |
|
Excerpt of the Joint Earnings Call Transcript held on May
4, 2023 (incorporated herein by reference to Holly Energy Partners, L.P.’s Communication pursuant to Rule 425 of the Securities Act filed with the SEC on May 5, 2023 (File No. 001-32225)).
|
|
|
| (a)(13) |
|
Letter to certain employees of Holly Energy Partners, L.P., dated August
16, 2023 (incorporated herein by reference to Exhibit 99.1 to Holly Energy Partners, L.P.’s Current Report on Form 8-K filed with the SEC on August
16, 2023 (File No. 001-32225)). |
13
|
|
|
| Exhibit No. |
|
Description |
|
|
| (a)(14) |
|
Letter to certain employees of HF Sinclair Corporation and Holly Energy Partners, L.P., dated August
16, 2023 (incorporated herein by reference to Exhibit 99.1 to HF Sinclair Corporation’s Current Report on Form 8-K filed with the SEC on August 16, 2023 (File No.
001-41325)). |
|
|
| (a)(15) |
|
Joint Press Release of HF Sinclair Corporation and Holly Energy Partners, L.P., dated August
16, 2023 (incorporated herein by reference to Exhibit 99.1 to HF Sinclair Corporation’s Current Report on Form 8-K filed with the SEC on August 16, 2023 (File No.
001-41325)). |
|
|
| (c)(1) |
|
Opinion of Intrepid Partners, LLC (incorporated herein by reference to Annex B of the Joint Proxy Statement/Prospectus).
|
|
|
| (c)(2) |
|
Discussion materials prepared by Barclays Capital, Inc., dated August 14, 2023, for the Board of Directors of HF Sinclair Corporation. |
|
|
| (c)(3)(A) |
|
Discussion materials prepared by Intrepid Partners, LLC, dated June 1, 2023, for the Conflicts Committee of the Board of Directors of Holly Logistic Services, L.L.C. |
|
|
| (c)(3)(B) |
|
Discussion materials prepared by Intrepid Partners, LLC, dated June 26, 2023, for the Conflicts Committee of the Board of Directors of Holly Logistic Services, L.L.C. |
|
|
| (c)(3)(C) |
|
Discussion materials prepared by Intrepid Partners, LLC, dated July 13, 2023, for the Conflicts Committee of the Board of Directors of Holly Logistic Services, L.L.C. |
|
|
| (c)(3)(D) |
|
Discussion materials prepared by Intrepid Partners, LLC, dated July 14, 2023, for the Conflicts Committee of the Board of Directors of Holly Logistic Services, L.L.C. |
|
|
| (c)(3)(E) |
|
Discussion materials prepared by Intrepid Partners, LLC, dated July 24, 2023, for the Conflicts Committee of the Board of Directors of Holly Logistic Services, L.L.C. |
|
|
| (c)(3)(F) |
|
Discussion materials prepared by Intrepid Partners, LLC, dated July 27, 2023, for the Conflicts Committee of the Board of Directors of Holly Logistic Services, L.L.C. |
|
|
| (c)(3)(G) |
|
Discussion materials prepared by Intrepid Partners, LLC, dated August 2, 2023, for the Conflicts Committee of the Board of Directors of Holly Logistic Services, L.L.C. |
|
|
| (c)(3)(H) |
|
Discussion materials prepared by Intrepid Partners, LLC, dated August 9, 2023, for the Conflicts Committee of the Board of Directors of Holly Logistic Services, L.L.C. |
|
|
| (c)(3)(I) |
|
Discussion materials prepared by Intrepid Partners, LLC, dated August 11, 2023, for the Conflicts Committee of the Board of Directors of Holly Logistic Services, L.L.C. |
|
|
| (c)(3)(J) |
|
Presentation prepared by Intrepid Partners, LLC, dated August 15, 2023, for the Conflicts Committee of the Board of Directors of Holly Logistic Services, L.L.C. |
|
|
| (d)(1) |
|
Agreement and Plan of Merger, dated August
15, 2023, by and among HF Sinclair Corporation, Navajo Pipeline Co., L.P., Holly Apple Holdings LLC, Holly Energy Partners, L.P., HEP Logistics Holdings, L.P., and Holly Logistic Services, L.L.C. (included as Annex A to the Joint Proxy Statement/Prospectus
and incorporated herein by reference). |
|
|
| (d)(2) |
|
Unitholders Agreement, dated as of August
2, 2021, by and among Holly Energy Partners, L.P., Holly Logistic Services, L.L.C., Navajo Pipeline Co., L.P., The Sinclair Companies, and the unitholders set forth on Schedule I thereto, as may be amended from time to time (incorporated herein by reference
to Exhibit 10.1 to Holly Energy Partners, L.P.’s Current Report on Form 8-K (File No. 001-32225) filed with the SEC on August 3, 2021). |
|
|
| (f)(1) |
|
Second Amended and Restated Agreement of the Limited Partnership of Holly Energy Partners, L.P. (incorporated herein by reference
to Exhibit 3.1 to Holly Energy Partners, L.P.’s Current Report on Form 8-K (File No. 001-32225) filed with the SEC on November 1, 2017). |
|
|
| (f)(2) |
|
Delaware Code Title 6 § 17-212. |
|
|
| (g) |
|
None. |
|
|
| 107 |
|
Filing Fee Table. |
14
SIGNATURES
After due inquiry and to the best of each of the undersigned’s knowledge and belief, each of the undersigned certifies that the
information set forth in this statement is true, complete and correct.
Dated as of September 22, 2023
|
|
|
| HF SINCLAIR CORPORATION |
|
|
| By: |
|
/s/ Atanas H. Atanasov |
| Name: |
|
Atanas H. Atanasov |
| Title: |
|
Executive Vice President and Chief Financial Officer |
|
| NAVAJO PIPELINE CO., L.P. |
|
|
| By: |
|
/s/ Atanas H. Atanasov |
| Name: |
|
Atanas H. Atanasov |
| Title: |
|
Executive Vice President and Chief Financial Officer |
|
| HOLLY APPLE HOLDINGS LLC |
|
|
| By: |
|
/s/ Atanas H. Atanasov |
| Name: |
|
Atanas H. Atanasov |
| Title: |
|
Executive Vice President and Chief Financial Officer |
|
| HOLLY ENERGY PARTNERS, L.P. |
|
|
| By: |
|
HEP LOGISTICS HOLDINGS, L.P., |
|
|
its General Partner |
|
|
| By: |
|
HOLLY LOGISTIC SERVICES, L.L.C., |
|
|
its General Partner |
|
|
| By: |
|
/s/ Michael C. Jennings |
| Name: |
|
Michael C. Jennings |
| Title: |
|
Chief Executive Officer and President |
|
| HOLLY LOGISTIC SERVICES, L.L.C. |
|
|
| By: |
|
/s/ Michael C. Jennings |
| Name: |
|
Michael C. Jennings |
| Title: |
|
Chief Executive Officer and President |
|
| HEP LOGISTICS HOLDINGS, L.P. |
|
|
| By: |
|
HOLLY LOGISTIC SERVICES, L.L.C., |
|
|
its General Partner |
|
|
| By: |
|
/s/ Michael C. Jennings |
| Name: |
|
Michael C. Jennings |
| Title: |
|
Chief Executive Officer and President |
15

Exhibit (c)(2) Board Presentation August 14, 2023

Apple | Proposal Summary Spot Price Initial Offer Initial Offer 1st HEP
Counteroffer DINO Revised Proposal 2nd HEP Counteroffer 2nd DINO Revised Proposal Undisturbed Price Current Price Current Price Current Price Current Price Current Price as of 5/3/23 as of 8/11/23 as of 8/11/23 as of 8/11/23 as of 8/11/23 as of
8/11/23 DINO Spot Price $41.91 $59.34 $59.34 $59.34 $59.34 $59.34 Exchange Ratio 0.3714x 0.3714x 0.3714x 0.3150x 0.3714x 0.3150x Stock Consideration per Unit $15.57 $22.04 $22.04 $18.69 $22.04 $18.69 Cash Consideration per Unit - - 7.00 3.50 4.00
4.00 Total Consideration per Unit $15.57 $22.04 $29.04 $22.19 $26.04 $22.69 Implied Exchange Ratio 0.3714x 0.3714x 0.4894x 0.3740x 0.4388x 0.3824x (1) Premium / (Discount) to Undisturbed Spot Price as of 5/3/23 (2.2%) 38.4% 82.4% 39.4% 63.6% 42.5%
(2) Premium / (Discount) to Spot Price as of 8/11/23 (28.4%) 1.4% 33.6% 2.1% 19.8% 4.4% Total Unaffiliated Units Outstanding (mm) 67.0 67.0 67.0 67.0 67.0 67.0 Total Stock Consideration ($mm) $1,042 $1,476 $1,476 $1,252 $1,476 $1,252 Total Cash
Consideration ($mm) - - 469 234 268 268 Total Consideration ($mm) $1,042 $1,476 $1,945 $1,486 $1,744 $1,520 Total DINO Shares Issued (mm) 24.9 24.9 24.9 21.1 24.9 21.1 30-Day VWAP Initial Offer Initial Offer 1st HEP Counteroffer DINO Revised
Proposal 2nd HEP Counteroffer 2nd DINO Revised Proposal Undisturbed Price Current Price Current Price Current Price Current Price Current Price as of 5/3/23 as of 8/11/23 as of 8/11/23 as of 8/11/23 as of 8/11/23 as of 8/11/23 DINO 30-Day VWAP
$45.97 $50.73 $50.73 $50.73 $50.73 $50.73 Exchange Ratio 0.3714x 0.3714x 0.3714x 0.3150x 0.3714x 0.3150x Stock Consideration per Unit $17.07 $18.84 $18.84 $15.98 $18.84 $15.98 Cash Consideration per Unit - - 7.00 3.50 4.00 4.00 Total Consideration
per Unit $17.07 $18.84 $25.84 $19.48 $22.84 $19.98 Implied Exchange Ratio 0.3714x 0.3714x 0.5094x 0.3840x 0.4502x 0.3938x (3) Premium / (Discount) to Undisturbed 30-Day VWAP as of 5/3/23 - 10.4% 51.4% 14.1% 33.8% 17.0% (4) Premium / (Discount) to
30-Day VWAP as of 8/11/23 (14.7%) (5.8%) 29.2% (2.6%) 14.2% (0.1%) Total Unaffiliated Units Outstanding (mm) 67.0 67.0 67.0 67.0 67.0 67.0 Total Stock Consideration ($mm) $1,143 $1,262 $1,262 $1,070 $1,262 $1,070 Total Cash Consideration ($mm) - -
469 234 268 268 Total Consideration ($mm) $1,143 $1,262 $1,731 $1,305 $1,530 $1,338 Total DINO Shares Issued (mm) 24.9 24.9 24.9 21.1 24.9 21.1 1. Undisturbed Spot Price as of 5/3/23: $15.92 per unit. 2. Spot Price as of 8/11/23: $21.74 per unit. 3.
Undisturbed 30-Day VWAP as of 5/3/23: $17.07 per unit. 4. 30-Day VWAP as of 8/11/23: $20.00 per unit. 1

HEP | Relative Trading Performance Trading Performance: Last Twelve
Months (2) Recent Trading HEP - Peer HEP Peer AMZ MLP (3) Performance Median Adj. HEP - AMZ Adj. Median Index (1) 30-Day 33.4% 17.7% 26.2% 13.8% (20.1%) (8.5%) 2.1% 9.5% (8.5%) 3.9% 48.2% OKE/MMP Announcement (5/12/2023) 32.1% 30.2% 22.3% 1.9%
(0.5%) - 20.6% 1.9% 9.7% Initial Offer Announcement (5/3/23) 36.6% 36.4% 27.5% 41.6% (5.9%) 0.1% 1.0% 23.4% 0.1% 9.1% YTD 14.4% 20.0% 22.5% 10.8% (5.6%) (2.6%) 10.4% 29.7% (2.6%) 9.2% 24.4% 20.5% 13.4% 17.2% (22.4%) 3.9% 15.8% 31.9% 3.9% 11.0% Last
Twelve Months (Indexed Price Performance) Initial Offer Announcement (Pre-Market Open on 5/4/2023) OKE / MMP Announcement (5/12/2023) Source: FactSet as of 8/11/2023. 1. Represents trading days. 2. Magellan reflects performance to unaffected date of
Oneok transaction, 5/12/2023. 3. HEP Peers include DKL, NS and PAA. Note: MMP not included in HEP Peer Median. 2

HEP / DINO | Historical Exchange Ratio Analysis Number of DINO shares per
HEP unit “Heads-Up” Exchange Ratio (HEP / DINO) Initial Offer Announcement (Pre-Market Open on 5/4/2023) 2nd HEP Counter (VWAP) (1) 0.4502x 2nd HEP Counter (2) (Spot) 0.4388x 2nd DINO Revised Proposal 0.3824x Current 0.3664x 1-Year VWAP
0.3618x Implied Premium Analysis Implied Premium / Discount to Heads-Up Historical Prices / Heads-Up Exchange Ratio HEP DINO Exchange $21.74 $22.69 $23.91 $26.04 $26.09 $28.26 0.3664x 0.3824x 0.4030x 0.4388x 0.4396x 0.4763x (3) Period ($/unit)
($/share) Ratio - 4.4% 10.0% 19.8% 20.0% 30.0% - 4.4% 10.0% 19.8% 20.0% 30.0% Current (8/11/2023) $21.74 $59.34 0.3664x - 4.4% 10.0% 19.8% 20.0% 30.0% - 4.4% 10.0% 19.8% 20.0% 30.0% Undisturbed Price (5/3/2023) $15.92 $41.91 0.3799x 36.6% 42.5%
50.2% 63.6% 63.9% 77.5% (3.6%) 0.7% 6.1% 15.5% 15.7% 25.4% Offer Price (30-day VWAP as of 5/3/2023) $17.07 $45.97 0.3714x 27.3% 32.9% 40.1% 52.5% 52.8% 65.5% (1.4%) 3.0% 8.5% 18.1% 18.4% 28.2% 5-Day VWAP $20.70 $57.87 0.3577x 5.0% 9.6% 15.5% 25.8%
26.0% 36.5% 2.4% 6.9% 12.7% 22.7% 22.9% 33.2% 10-Day VWAP $20.37 $55.13 0.3694x 6.7% 11.4% 17.4% 27.8% 28.1% 38.8% (0.8%) 3.5% 9.1% 18.8% 19.0% 28.9% 20-Day VWAP $20.14 $52.69 0.3823x 7.9% 12.6% 18.7% 29.3% 29.5% 40.3% (4.2%) 0.0% 5.4% 14.8% 15.0%
24.6% 30-Day VWAP $20.00 $50.73 0.3943x 8.7% 13.4% 19.6% 30.2% 30.4% 41.3% (7.1%) (3.0%) 2.2% 11.3% 11.5% 20.8% 60-Day VWAP $19.18 $46.69 0.4108x 13.4% 18.3% 24.7% 35.8% 36.0% 47.4% (10.8%) (6.9%) (1.9%) 6.8% 7.0% 15.9% 1-Year VWAP $18.32 $50.64
0.3618x 18.7% 23.9% 30.5% 42.1% 42.4% 54.3% 1.3% 5.7% 11.4% 21.3% 21.5% 31.7% 2-Year VWAP $17.96 $44.57 0.4029x 21.1% 26.4% 33.2% 45.0% 45.3% 57.4% (9.1%) (5.1%) 0.0% 8.9% 9.1% 18.2% 5-Year VWAP $19.01 $41.27 0.4605x 14.4% 19.4% 25.8% 37.0% 37.3%
48.7% (20.4%) (17.0%) (12.5%) (4.7%) (4.5%) 3.4% 52-Week High $21.74 $66.19 0.3284x - 4.4% 10.0% 19.8% 20.0% 30.0% 11.5% 16.4% 22.7% 33.6% 33.9% 45.0% Research Analyst Target $20.00 $60.00 0.3333x 8.7% 13.5% 19.6% 30.2% 30.4% 41.3% 9.9% 14.7% 20.9%
31.6% 31.9% 42.9% Source: FactSet as of 8/11/2023. nd nd 2 DINO 2 HEP 1. Reflecting 0.3714x exchange ratio on DINO’s 30-day VWAP of $50.73 as of 8/11/2023 plus $4.00 cash per unit. (4) (2) 2. Reflecting 0.3714x exchange ratio on DINO’s
share price of $59.34 as of 8/11/2023 plus $4.00 cash per unit. Revised Proposal Counterproposal 3. 5-day, 10-day, 20-day, 30-day and 60-day reflecting trading days. 1-year, 2-year and 3-year reflecting calendar days. nd 4. 2 DINO revised proposal
of $22.69 per unit reflecting 0.3150x exchange ratio on DINO’s share price of $59.34 as of 8/11/2023 plus $4.00 cash per unit. 3 Better for HEP Better for DINO

DINO | Relative Valuation (1) EV / EBITDA (EV / EBITDA) 2023E 2024E 2025E
EV / 2023E EBITDA EV / 2024E EBITDA Median: 4.7x 6.5x 6.9x EV / 2025E EBITDA 8.5x 9.0x 8.0x 7.9x 7.3x 6.8x 6.8x 6.9x 6.7x 6.5x 6.6x 5.9x 5.8x 5.4x 5.4x 5.3x 5.2x 6.0x 4.8x 4.9x 4.7x 4.7x 4.6x 4.0x 3.8x 2.8x 3.0x 0.0x (2) Price / Parent CFPS (Price /
Parent CFPS) 2023E 2024E 2025E Price / 2023E Parent CFPS Median: 4.6x 5.9x 7.6x Price / 2024E Parent CFPS Price / 2025E Parent CFPS 8.9x 9.0x 7.8x 7.8x 7.7x 7.6x 7.6x 7.4x 6.6x 6.2x 5.9x 5.9x 5.9x 5.9x 5.6x 5.5x 5.4x 5.3x 6.0x 4.9x 4.7x 4.6x 4.5x
3.9x 3.6x 2.8x 3.0x 0.0x Consolidated Debt / 1. 1x 1.5x 1.6x 1.1x 1.5x 3.1x 0.8x 0.6x (3) 2023E EBITDA Consolidated Net Debt / 2023E 0.7x 1.0x 0.9x 0.7x 0.8x 2.2x 0.4x (0.0)x (4) EBITDA Source: Management projections, company filings, FactSet, and
Wall Street research as of 8/11/2023. 1. DINO EBITDA reflecting management estimates. Peers per FactSet consensus. 2. DINO and peers reflecting FactSet consensus. Adj. CFPS is adjusted to remove third-party distributions to unaffiliated MLP public
unitholders. Adj. CFPS based on Adj. CFFO per share based on shares outstanding from Management projections. Remaining peers calculated from median consensus. 3. Calculated as current Consolidated Debt / Projected Consolidated EBITDA. 4. Calculated
as Consolidated Debt less Cash / Projected Consolidated EBITDA. 4

HEP | Relative Valuation EV / EBITDA Debt + Pref. / EBITDA 2022A 2023E
2023E-2025E Debt + Pref. / 2022A EBITDA 1.7% 3.5% 3.3% 0.4% 3.7% EBITDA CAGR Median: 4.9x 4.1x Debt + Pref. / 2023E EBITDA 7.0x 2023E 2024E 2025E EV / 2023E EBITDA Median: 8.7x 8.2x 8.4x 6.0x 5.6x 5.5x EV / 2024E EBITDA 12.0x 10.3x 5.0x 4.5x 9.9x EV
/ 2025E EBITDA 9.6x 9.3x 9.6x 4.5x 10.0x 9.3x 9.2x 4.3x 8.6x 8.7x 3.7x 8.1x 3.8x 7.8x 4.0x 8.0x 8.0x 7.4x 7.2x 3.5x 3.4x 3.2x 6.9x 3.0x 6.0x 2.0x 4.0x 2.0x 1.0x 0.0x 0.0x Latest Quarterly Distribution Yield Levered FCF Yield LQA DCF 2023E Levered
FCF Yield 2023E 2024E 2025E 1.9x 2.3x 1.4x 1.3x 2.7x Coverage Median: 10.9% 13.9% 13.4% 2024E Levered FCF Yield 20% 12.0% Median: 8.7% 17.5% 2025E Levered FCF Yield 16.4% 16.8% 10.3% 9.6% 14.0% 13.8% 15% 13.4% 13.1% 12.7% 9.0% 7.6% 11.3% 11.9% 7.0%
10.8% 11.1% 10.7% 6.4% 10.1% 10% 6.0% 5% 3.0% NA 0.0% 0% Source: HEP per company filing and DINO Management forecast. Peers per Public filings, FactSet, and Wall Street research as of 8/11/2023. Magellan share price as of the unaffected date of the
Oneok acquisition, 5/12/2023. 5

HEP | Indicative Purchase Price Ratio Analysis Indicative Purchase Price
Ratio Analysis nd nd 2 DINO 2 HEP (1) (2) Revised Proposal Counterproposal ($ in millions, except per share data) DINO SQ HEP SQ 6/30/23 6/30/23 Illutrative Purchase Price Price as of 8/11/23 $59.34 $21.74 $22.69 $23.91 $26.04 $26.09 $28.26 Implied
Premium / (Discount) to HEP Spot Price as of 8/11/23 4% 10% 20% 20% 30% Diluted Shares / Units Oustanding 186.0 126.6 126.6 126.6 126.6 126.6 126.6 Total Equity Value $11,037 $2,752 $2,873 $3,027 $3,297 $3,303 $3,578 Total Debt (Consolidated) 3,214
1,506 1,506 1,506 1,506 1,506 1,506 Preferred Equity - 63 63 63 63 63 63 Non-Controlling Interest 1,452 69 69 69 69 69 69 Cash (Consolidated) (1,204) (8) (8) (8) (8) (8) (8) Enterprise Value $14,499 $4,382 $4,502 $4,657 $4,926 $4,932 $5,207 Public
Units Outstanding 67.0 67.0 67.0 67.0 67.0 67.0 Total Value of Public Units $1,456 $1,520 $1,602 $1,744 $1,747 $1,893 Implied Exchange Ratio 0.3664x 0.3824x 0.4030x 0.4388x 0.4396x 0.4763x Precedent Premium Premium / Discount to: Median Mean Current
8/11/23 - - 4.4% 10.0% 19.8% 20.0% 30.0% 12.6% 13.9% Unaffected Price 41.6% 36.6% 42.5% 50.2% 63.6% 63.9% 77.5% 52-Week High (10.3%) - 4.4% 10.0% 19.8% 20.0% 30.0% Research Analyst Target (1.1%) 8.7% 13.5% 19.6% 30.2% 30.4% 41.3% Trading Comparables
DINO SQ HEP SQ Peer Peer Transaction (3) (3) Enterprise Value as a Multiple of: Data Data Median Mean Comparables EBITDA 2023E $3,030 4.8x $458 9.6x 9.8x 10.2x 10.8x 10.8x 11.4x 8.6x 8.8x 10.1x 2024E 2,662 5.4x 477 9.2x 9.4x 9.8x 10.3x 10.3x 10.9x
8.2x 8.4x 10.1x 2025E 2,698 5.4x 474 9.3x 9.5x 9.8x 10.4x 10.4x 11.0x 8.4x 8.3x Equity Value as a Multiple of: Earnings per Share 2023E $9.15 6.5x $2.08 10.5x 10.9x 11.5x 12.5x 12.6x 13.6x 10.9x 10.7x 2024E 7.58 7.8x 2.36 9.2x 9.6x 10.2x 11.1x 11.1x
12.0x 10.8x 10.4x 2025E 7.75 7.7x 2.44 8.9x 9.3x 9.8x 10.7x 10.7x 11.6x 10.0x 10.1x Yield Analysis: Dividends LQA $1.80 3.0% $1.40 6.4% 6.2% 5.9% 5.4% 5.4% 5.0% 8.6% 8.6% 2023E 1.80 3.0% 1.40 6.4% 6.2% 5.9% 5.4% 5.4% 5.0% 2024E 1.80 3.0% 1.40 6.4%
6.2% 5.9% 5.4% 5.4% 5.0% 2025E 1.80 3.0% 1.40 6.4% 6.2% 5.9% 5.4% 5.4% 5.0% YE Leverage Total Debt / EBITDA 2022A $3,214 0.7x $1,506 3.6x 3.6x 3.6x 3.6x 3.6x 3.6x 4.9x 4.7x 2023E 3,214 1.1x 1,506 3.3x 3.3x 3.3x 3.3x 3.3x 3.3x 4.1x 4.0x Source:
Projections per DINO Management. Market data as of 8/11/2023. Balance sheet data reflect DINO / HEP Q2 2023 10-Q filings. nd 1. 2 DINO revised proposal of $22.69 per unit reflecting 0.3150x exchange ratio on DINO’s share price of $59.34 as of
8/11/2023 plus $4.00 cash per unit. 2. Second HEP counterproposal of $26.04 per unit reflecting 0.3714x exchange ratio on DINO’s share price of $59.34 as of 8/11/2023 plus $4.00 cash per unit. 3. Peers include DKL, MMP, NS and PAA.
6

Appendix

Apple | Proposal Summary Key Events — On May 4, 2023, HF Sinclair
(DINO) offered to acquire all outstanding publicly held common units of Holly Energy Partners (HEP) at a fixed exchange ratio of 0.3714 newly issued shares of DINO Common Stock per each HEP unit w Offer derived using the 30-day volume weighted
average prices for each security as of market close on May 3, 2023 — Following DINO’s initial proposal, ¡ On July 14, 2023, the Conflicts Committee of HEP responded with a counterproposal consisting of 0.3714 exchange ratio plus
$7.00 in cash per HEP unit 1 w The counterproposal implies a total per unit consideration of $24.16 based on DINO’s share price as of 7/14/2023 ¡ On July 21, 2023, DINO responded with a revised proposal comprised of 0.3150 exchange
ratio plus $3.50 in cash 2 w The revised proposal implies a total per unit consideration of $18.92 based on DINO’s share price on 7/21/2023 nd ¡ On July 28, 2023, the Conflicts Committee of HEP responded with a 2 counterproposal
consisting of 0.3714 exchange ratio plus $4.00 in cash per HEP unit 3 nd w The 2 counterproposal implies a total per unit consideration of $23.16 based on DINO’s share price as of 7/28/2023 nd 4¡ On August 11, 2023, DINO responded
with a 2 revised proposal comprised of 0.3150 exchange ratio plus $4.00 in cash per HEP unit nd w The 2 revised proposal implies a total per unit consideration of $22.69 based on DINO’s share price as of 8/11/2023 Summary of Proposals
– Spot Offer Price Implied Premium to HEP Unit Price as of: Total Consideration per Equity Consideration (2) Date Exchange Ratio Cash Consideration Unit HEP Closing Price DINO Closing Price 5/3/23 7/14/23 7/21/23 7/28/23 8/11/23 Proposal (1)
Initial DINO Offer 5/4/23 0.3714x $0.00 $15.57 $15.92 $41.91 (2.2%) N/A N/A N/A N/A 1st HEP Counterproposal 7/14/23 0.3714x $7.00 $24.16 $18.87 $46.21 51.8% 28.0% N/A N/A N/A 1st DINO Revised Proposal 7/21/23 0.3150x $3.50 $18.92 $18.97 $48.96 18.9%
0.3% (0.3%) N/A N/A 2nd HEP Counterproposal 7/28/23 0.3714x $4.00 $23.16 $19.18 $51.60 45.5% 22.8% 22.1% 20.8% N/A 2nd DINO Revised Proposal 8/11/23 0.3150x $4.00 $22.69 $21.74 $59.34 42.5% 20.3% 19.6% 18.3% 4.4% Summary of Proposals – 30-Day
VWAP Offer Price Implied Premium to HEP 30-Day VWAP as of: Total Consideration per Equity Consideration (3) Date Exchange Ratio Cash Consideration Unit (30-Day VWAP) HEP 30-Day VWAP DINO 30-Day VWAP 5/3/23 7/14/23 7/21/23 7/28/23 8/11/23 Proposal
(1) Initial DINO Offer 5/4/23 0.3714x $0.00 $17.07 $17.07 $45.97 (0.0%) N/A N/A N/A N/A 1st HEP Counterproposal 7/14/23 0.3714x $7.00 $23.57 $18.24 $44.62 38.1% 29.2% N/A N/A N/A 1st DINO Revised Proposal 7/21/23 0.3150x $3.50 $17.75 $18.38 $45.24
4.0% (2.7%) (3.4%) N/A N/A 2nd HEP Counterproposal 7/28/23 0.3714x $4.00 $21.14 $18.64 $46.16 23.8% 15.9% 15.0% 13.4% N/A 2nd DINO Revised Proposal 8/11/23 0.3150x $4.00 $19.98 $20.00 $50.73 17.0% 9.5% 8.7% 7.2% (0.1%) 1. Offer delivered pre-market
open on 5/4/23. DINO and HEP closing prices reflecting prices as of unaffected date of 5/3/2023. 2. Total consideration per unit equal to DINO closing price multiplied by exchange ratio, plus cash consideration when applicable. 3. Total
consideration per unit (30-day VWAP) equal to DINO 30-day VWAP multiplied by exchange ratio, plus cash consideration when applicable. 7

HEP | Equity Analyst Price Targets (1) (2) Research Price Targets
Premium / (Discount) % to Current Price ($ / share) Median Analyst Target Price Premium / (Discount) to: Current Price (8%) (3) Current: Current: $55.41 $15.59 $70.00 30.0% $65.00 Current: $42.73 $60.00 17% 20.0% 22% 12% $50.00 $47.00 10.0% 10%
$40.00 Current: $21.00 0.0% Current $15.25 $30.00 Price: $19.00 $21.74 (3%) $20.00 (10.0%) $17.00 $20.00 $17.00 (8%) Median (22%) Price (20.0%) $10.00 Target: $20.00 $0.00 (30.0%) Analyst 1 Analyst 2 Analyst 3 8/9/2023 8/3/2023 7/11/2023 Analyst
Recommendation 0 2 1 4 Buy ✓ 1 1 3 2 Hold ~ 0 1 0 0 Sell O 1 4 4 6 Source: FactSet as of 8/11/2023. 1. Includes available reports from reputable brokers that have provided a price target. 2. Peer group price targets reflect average analyst
price target. 3. Reflects unaffected price from 5/12/2023 prior to Oneok acquisition. 8

DINO | Equity Analyst Price Targets (1) (2) Research Price Targets
Premium / (Discount) % to Current Price Price Targets ($ / share) Median Analyst Target Price Premium / (Discount) to: Current Price 1% Current: Current: Current: Current: Current: Current: Current: $149.75 $116.64 $139.06 $36.55 $28.28 $49.84
$37.02 $152.00 $125.00 $150.00 $80.00 50% $70.00 40% Median $70.00 Analyst: $63.00 $61.00 $60.00 $60.00 $60.00 30% $56.00 $60.00 $57.00 $54.00 Current 20% DINO: $48.00 $50.00 $59.34 $44.00 8% 7% 18% 10% 1% 2% $37.00 $40.00 Peers 6% (4%) 0% Median:
3% $31.00 (0%) (0%) 1% $30.00 $26.00 (4%) (10%) (6%) (8%) (9%) $20.00 (15%) (20%) $10.00 (30%) (26%) $0.00 (40%) 1 2 3 4 5 6 7 8 9 10 11 12 13 14 15 16 Analyst 1 Analyst 2 Analyst 3 Analyst 4 Analyst 5 Analyst 6 Analyst 7 Analyst 8 Analyst 9 8/10/23
8/8/23 8/4/23 8/4/23 8/3/23 8/3/23 8/3/23 7/18/23 7/6/23 Analyst Recommendation 9 7 10 0 1 2 3 Buy ✓✓✓✓✓ 2 3 1 3 5 6 1 Hold ~ ~ ~ ~ 0 0 0 0 2 0 0 Sell Source: FactSet as of 8/11/2023. 11 10 11 3 8 8 4 1. Includes
available reports from reputable brokers since Q1’23 earnings release that have provided a price target. 2. Peer group price targets reflect median analyst price target. 9

HEP | Comparable Transaction Analysis Selected MLP Buy-in Transactions
Total Initial Initial Premium Paid Premium Paid - (2) (3) Announced Transaction Enterprise Value Price Premium Final (Days Prior to Initial Ann.) (Days Prior to Final Ann.) EV / FY+1 30-Day 30-Day (1) Date Acquirer Target Value ($MM) Acquirer Target
Offered Offered Price 1-Day 1-Day EBITDA Consideration Process VWAP VWAP 8/17/2022 $3,783 $68,412 $14,229 $34.75 0.0% $41.75 20.1% 24.0% 6.2% 8.2% 8.4x 100% Cash Ann. then Negotiate (4) 7/28/2022 $579 $7,229 $1,690 $15.14 13.4% $17.66 32.3% 11.0%
(3.4%) 9.9% 7.3x Cash and Unit Exchange Ann. then Negotiate 7/6/2022 $131 NA $824 $17.90 (0.3%) $25.00 39.3% 42.8% 2.8% 8.6% 10.3x 100% Cash Ann. then Negotiate 4/22/2022 $400 NA $595 $3.32 0.9% $4.65 41.3% 42.7% 40.9% 40.7% 11.1x 100% Cash Ann.
then Negotiate (5) 2/11/2022 $2,608 $237,598 $9,749 $12.89 0.0% $15.85 23.0% 23.5% 9.6% 11.6% 12.6x 100% Cash Ann. then Negotiate 10/27/2021 $3,466 $16,829 $13,076 $32.57 0.0% $41.11 4.8% 7.6% 4.8% 7.6% 9.7x 100% Unit Exchange Negotiate then Ann.
(6) 8/5/2021 $874 $126,182 $1,694 $13.01 0.0% $15.12 16.2% 8.9% 17.1% 17.2% 9.7x 100% Unit Exchange Ann. then Negotiate (7) 2/5/2021 $1,149 $201,401 $2,872 $12.47 0.0% $14.56 16.7% 18.7% (3.3%) 5.8% 7.4x 100% Unit Exchange Ann. then Negotiate (8)
10/5/2020 $2,829 $74,892 $3,361 $27.31 5.4% $30.95 19.5% 15.1% 0.6% (0.7%) 10.1x 100% Unit Exchange Ann. then Negotiate 7/27/2020 $693 $4,419 $1,312 $8.38 4.5% $8.47 28.1% 29.1% 28.1% 29.1% 7.3x 100% Unit Exchange Negotiate then Ann. 11/26/2018 $536
NA $1,246 $38.00 4.4% $41.00 12.6% 9.5% 12.6% 9.5% 10.6x 100% Cash Negotiate then Ann. 11/8/2018 $8,965 $7,251 $12,230 $43.77 5.0% $50.33 7.6% 14.3% 7.6% 14.3% 11.2x 100% Unit Exchange Negotiate then Ann. 10/18/2018 $1,850 $50,344 $3,660 $40.00
10.7% $42.25 6.0% 10.2% 6.0% 10.2% 10.2x 100% Cash Negotiate then Ann. 9/19/2018 $2,634 $86,611 $6,683 $17.75 0.0% $18.22 2.6% 8.8% 0.5% 1.0% 29.6x 100% Unit Exchange Ann. then Negotiate (9) 8/1/2018 $60,345 $26,932 $80,353 $21.32 5.0% $23.59 11.2%
17.5% 11.2% 17.5% 7.0x 100% Unit Exchange Negotiate then Ann. (10) 5/29/2018 $300 $5,332 $3,262 $21.86 (1.1%) $21.86 (1.1%) 9.2% (1.1%) 9.2% 6.2x 100% Unit Exchange Tender Offer (11) 5/17/2018 $4,779 $123,056 $27,256 $33.10 0.0% $40.00 20.8% 18.4%
5.7% 6.8% 14.3x 100% Unit Exchange Ann. then Negotiate (12) 5/17/2018 $10,010 $121,978 $14,694 $10.08 0.0% $11.48 13.9% 16.4% 2.1% 0.3% 10.1x 100% Unit Exchange Ann. then Negotiate 5/17/2018 $15,105 $29,816 $55,383 $36.94 5.2% $40.89 6.4% 11.2% 6.4%
11.2% 11.8x 100% Unit Exchange Negotiate then Ann. 3/27/2018 $3,224 $3,418 $4,942 $41.34 (0.5%) $35.42 0.6% (8.1%) 0.6% (8.1%) 6.3x 100% Unit Exchange Negotiate then Ann. Source: Price data per FactSet. Transaction value and consideration paid based
on public filings, company press releases, and investor presentations. 1. Transaction value includes only un-affiliated and proportional net debt. 2. Premium paid to initial announcement represents the premium based on the final agreed upon price
relative to the original offer’s unaffected date. 3. Premium paid to final announcement represents the premium based on the final agreed upon price relative to the final announcement’s unaffected date. 4. Initial price offered not yet
disclosed. Transaction value and premium reflect unaffected DINO price as of 7/27/2022. Initial announcement date reflects filing of Schedule 13D/A on June 24, 2022. 5. Shell / Shell Midstream Partners LP based on revised offer announced 7/25/2022.
Premium paid based on closing price prior to original announcement on 2/11/2022. 6. BP / BP Midstream Partners LP based on revised offer announced 12/20/2021. Premium paid based on closing price prior to original announcement on 8/4/2021. 7. Chevron
/ Noble Midstream Partners based on revised offer announced 3/5/2021. Premium paid based on closing price prior to original announcement on 2/4/2021. 8. TC Energy / TC Pipeline based on revised offer announced 12/15/2020. Premium paid based on
closing price prior to original announcement on 10/5/2020. 9. Dominion Energy / Dominion Energy Midstream based on revised offer announced 11/23/2018. Premium paid based on closing price prior to original announcement on 9/8/2018. 10. Reflects the
5/29/18 exchange offer; CVI announced it would exercise the call right on 1/17/19. 11. Enbridge / Spectra premiums based on revised offer announced on 8/24/2018. Enbridge price performance based on original announcement on 5/17/2018. 12. Enbridge /
Enbridge Energy Partners based on revised offer announced 9/18/2018. Enbridge price performance based on original announcement on 5/17/2018. 10

HEP | Comparable Transaction Analysis (Cont’d) Selected MLP Buy-in
Transactions Total Initial Initial Premium Paid Premium Paid (2) (3) Announced Transaction Enterprise Value Price Premium Final (Days Prior to Initial Ann.) (Days Prior to Final Ann.) EV / FY+1 30-Day 30-Day (1) Date Acquirer Target Value ($MM)
Acquirer Target Offered Offered Price 1-Day 1-Day EBITDA Consideration Process VWAP VWAP 11/8/2017 $173 $3,189 $845 $11.80 3.0% $13.92 3.0% 11.5% 3.0% 11.5% 4.6x 100% Unit Exchange Negotiate then Ann. 8/29/2017 $736 NA $736 $14.50 0.4% $16.50 15.2%
12.4% 15.2% 12.4% 12.3x 100% Cash Negotiate then Ann. 5/18/2017 $651 NA $963 $20.00 20.1% $20.00 20.1% 20.4% 20.1% 20.4% 12.3x 100% Cash Tender Offer 4/4/2017 $157 NA $594 $16.80 5.8% $17.30 5.8% 5.6% 5.8% 5.6% 9.1x 100% Cash Tender Offer 3/2/2017
$781 NA $1,470 $18.75 1.9% $19.50 6.0% 5.6% 4.3% 3.4% 9.3x 100% Cash Ann. then Negotiate 1/27/2017 $1,656 $77,129 $1,656 $6.25 (4.6%) $8.00 (8.6%) 1.8% (8.6%) 1.8% 11.0x 100% Cash Negotiate then Ann. 11/1/2016 $5,180 $77,381 $9,684 $15.75 2.9%
$17.00 11.1% 16.0% 6.3% 5.2% 18.0x 100% Cash Ann. then Negotiate Premium Paid Premium Paid (2) (3) Initial (Days Prior to Initial Ann.) (Days Prior to Final Ann.) Premium 30-Day 30-Day EV / FY+1 1-Day 1-Day Offered VWAP VWAP EBITDA Mean 3.0% 13.9%
15.0% 7.5% 10.0% 10.7x Selected MLP Median 0.9% 12.6% 12.4% 5.8% 9.2% 10.1x Transactions From High 20.1% 41.3% 42.8% 40.9% 40.7% 29.6x 2016 - 2023 YTD Low (4.6%) (8.6%) (8.1%) (8.6%) (8.1%) 4.6x Selected Mean 1.9% 10.8% 12.8% 6.0% 8.8% 10.4x 100%
Stock MLP Median 0.0% 9.4% 12.9% 3.9% 8.4% 9.7x Transactions From High 5.4% 28.1% 29.1% 28.1% 29.1% 29.6x 2016 - 2023 YTD Low (1.1%) (1.1%) (8.1%) (3.3%) (8.1%) 4.6x Mean 1.8% 24.2% 22.4% 9.4% 13.7% 9.6x Selected MLP Median 0.0% 21.6% 21.1% 5.5%
9.3% 9.7x Transactions From High 13.4% 41.3% 42.8% 40.9% 40.7% 12.6x 2021 - 2023 YTD Low (0.3%) 4.8% 7.6% (3.4%) 5.8% 7.3x Source: Price data per FactSet. Transaction value and consideration paid based on public filings, company press releases, and
investor presentations. HEP data per DINO Management forecast. 1. Transaction value includes only un-affiliated and proportional net debt. 2. Premium paid to initial announcement represents the premium based on the final agreed upon price relative
to the original offer’s unaffected date. 3. Premium paid to final announcement represents the premium based on the final agreed upon price relative to the final offer’s unaffected date. 11

DINO | Comparable Companies DINO Trading Comparables ($ in millions,
except per share values) Peer Median Stock Price as of 8/11/2023 $59.34 $149.75 $116.64 $139.06 $49.84 $36.55 $28.28 $37.02 Diluted Shares Outstanding 186 403 451 353 130 103 67 63 Total Equity Value $11,037 $60,400 $52,586 $49,107 $6,465 $3,758
$1,907 $2,332 Total Debt 3,214 27,650 18,730 11,323 1,469 1,597 2,874 595 Cash 1,204 11,454 6,705 5,075 1,517 751 848 191 Net Debt 2,010 16,196 12,025 6,248 (48) 846 2,026 404 (1) Minority Interest 1,452 12,434 -- -- -- 549 396 -- Enterprise Value
$14,499 $89,030 $64,611 $55,355 $6,417 $5,153 $4,329 $2,736 Enterprise Value to: 2023E EBITDA 4.8x 5.2x 5.3x 4.0x 2.8x 4.7x 4.6x 4.9x 4.7x 2024E EBITDA 5.4x 7.3x 6.5x 5.8x 3.8x 6.8x 5.9x 6.8x 6.5x 2025E EBITDA 5.4x 7.9x 6.7x 6.9x 4.7x 8.0x 6.6x 8.5x
6.9x 2023E EBIT 6.2x 6.3x 6.3x 5.0x 3.4x 6.4x 8.0x 6.9x 6.3x 2024E EBIT 7.5x 10.0x 7.8x 8.2x 5.7x 10.1x 11.9x 11.7x 10.0x 2025E EBIT 7.4x 11.1x 8.2x 10.3x 8.3x 10.9x 16.9x 14.8x 10.9x Equity Value to: 2023E CFFO 5.3x 4.6x 5.9x 4.5x 3.6x 4.0x 2.6x
3.9x 4.0x 2024E CFFO 6.1x 5.6x 6.7x 5.8x 4.7x 6.2x 4.0x 6.9x 5.8x 2025E CFFO 6.9x 5.5x 6.9x 6.3x 5.3x 7.5x 4.1x 7.3x 6.3x 2023E Net Income 6.5x 7.0x 7.6x 6.0x 5.3x 7.8x 8.4x 6.2x 7.0x 2024E Net Income 7.8x 10.9x 9.2x 10.2x 7.8x 14.9x 22.6x 12.1x
10.9x 2025E Net Income 7.7x 10.0x 9.5x 13.2x 10.9x 19.2x N/M 17.2x 12.1x Source: DINO Management, Company filings, FactSet, Wall Street research and investor presentations as of 8/11/2023. DINO balance sheet data reflects Q2 2023 10-Q filing. 1.
Reflects market value of public interest in MLP. Does not include preferred equity held by subsidiaries. 12

HEP | Comparable Companies HEP Trading Comparables ($ in millions except
per unit data) Peer Median (1) Unit Price as of 8/11/23 $21.74 $42.73 $15.59 $55.41 $15.25 % of 52-week high (Close) 100% 68% 87% 99% 100% 93% Fully Diluted Units Outstanding 127 44 111 202 698 Total Equity Value $2,752 $1,862 $1,729 $11,198 $10,650
Debt 1,506 1,754 2,897 5,000 8,087 Preferred Equity 63 - 1,059 - 2,666 Noncontrolling Interest 69 - - - - Cash (8) ( 8) (4) ( 128) (933) Enterprise Value $4,382 $3,608 $5,682 $16,070 $20,471 Enterprise Value / 2023E EBITDA 9.6 x 9.3 x 7.4 x 10.3 x
8.1 x 8.7 x 2024E EBITDA 9.2 x 8.6 x 7.2 x 9.9 x 7.8 x 8.2 x 2025E EBITDA 9.3 x 8.7 x 6.9 x 9.6 x 8.0 x 8.4 x Valuation Metrics LQA Yield 6.4% 9.6% 10.3% 7.6% 7.0% 8.6% 2023E Yield 6.4% 9.7% 10.3% 7.6% 7.0% 8.6% 2024E Yield 6.4% 10.0% 10.3% 7.7%
8.0% 9.0% 2025E Yield 6.4% 10.7% 10.3% 7.7% 9.0% 9.6% 2023E DCF Yield 12.1% 14.1% 23.7% 11.1% 14.7% 14.4% 2024E DCF Yield 12.7% 16.6% 23.3% 11.6% 17.4% 17.0% 2025E DCF Yield 13.1% NA 24.4% 12.1% 17.0% 17.0% 2023E FCF Yield 11.9% 10.7% 16.8% 10.1%
11.1% 10.9% 2024E FCF Yield 12.7% 14.0% 16.4% 10.8% 13.8% 13.9% 2025E FCF Yield 13.1% NA 17.5% 11.3% 13.4% 13.4% 2023E EPS $2.08 $3.91 $1.81 $5.08 $1.22 $3.91 2024E EPS 2.36 4.67 1.43 5.22 1.39 4.67 2025E EPS 2.44 4.89 1.59 5.46 1.32 4.89 Coverage
2023E Coverage 1.87 x 1.46 x 2.31 x 1.46 x 2.10 x 1.78 x 2024E Coverage 1.97 x 1.66 x 2.27 x 1.51 x 2.18 x 1.92 x 2025E Coverage 2.03 x NA 2.38 x 1.56 x 1.89 x 1.89 x Credit Statistics Debt / 2022A EBITDA 3.6 x 5.6 x 4.0 x 3.5 x 3.2 x 3.7 x Debt /
2023E EBITDA 3.3 x 4.5 x 3.8 x 3.2 x 3.2 x 3.5 x Debt + Pref / 2023A EBITDA 3.8 x 5.6 x 5.5 x 3.5 x 4.3 x 4.9 x Debt + Pref / 2023E EBITDA 3.4 x 4.5 x 4.5 x 3.2 x 3.7 x 4.1 x Source: DINO Management, Company filings, FactSet, Wall Street research
and investor presentations as of 8/11/2023. HEP balance sheet data reflects Q2 2023 10-Q filing. 1. Magellan unaffected share price as of 5/12/2023 prior to Oneok acquisition. 13

Disclaimer The preceding pages contain material that was provided to the
Board of Directors (the “Board”) of HF Sinclair Corporation (the “Company”) by Barclays Capital Inc. (“Barclays”). The accompanying material and any Barclays presentation related to the material was compiled or
prepared on a confidential basis solely for consideration by the Board and no part of it may be reproduced, distributed or transmitted without the prior written consent of Barclays. The information contained in this material was obtained from the
Company and/or publicly available sources, and Barclays has relied upon such information without independent verification thereof and does not assume any liability for any such information. These materials are being provided in connection with an
actual corporate engagement and may not be used or relied upon for any purpose other than as specifically contemplated by a written agreement with Barclays. Moreover, any information provided herein was not prepared for or intended for use by any
individual for personal, family or household purposes. Any estimates, historical financial information, projections and other information contained herein have been prepared by management of the Company or were obtained from publicly available
sources (approved for Barclays’ use by the Company) or are based upon such estimates and projections. With respect to such estimates and projections, Barclays has assumed that they have been reasonably prepared on a basis reflecting the best
currently available estimates, projections and judgment of the management of the Company. The projections contained herein may or may not be achieved and differences between projected results and those actually achieved may be material. No
representation or warranty, expressed or implied, is made as to the accuracy or completeness of such information and nothing contained herein is, or shall be relied upon as, a promise or representation, whether as to the past or the future. The
analysis contained herein is based on current market conditions which are subject to change and Barclays assumes no obligation to update or otherwise revise these materials. Nothing in these materials shall be deemed to constitute a recommendation
or investment, legal, tax, financial, accounting or other advice. Because these materials were prepared for use in the context of a presentation to the Board, these materials are incomplete without reference to, and should be assessed solely in
conjunction with, the oral briefing provided by Barclays to the Board (in their capacity as directors and not in any individual capacity and is not for the benefit of any individual, including any individual officer, director, shareholder or any
other person). These materials were not prepared for or intended for use by any individual for personal, family or household purposes nor were they prepared to comply with the disclosure standards under state and federal securities laws or any other
applicable laws and, to the extent the material may be considered by readers not as familiar with the business and affairs of the Company as the Board, none of the Company, Barclays, their respective affiliates or any of their respective legal or
financial advisors or accountants takes any responsibility for the accuracy or completeness of any of the material if used by persons other than the Board. These materials are not intended to provide the sole basis for evaluation of the proposed
corporate transaction and do not purport to contain all information that may be required and should not be considered a recommendation with respect to the proposed corporate transaction. Barclays has not made or obtained any evaluations or
appraisals of the assets or liabilities of the Company or any other party to any corporate transaction or any of their respective affiliates and has no obligation to evaluate the solvency of the Company or any other party to any transaction under
any state or federal laws relating to bankruptcy, insolvency or similar matters. The analyses contained herein do not purport to be appraisals nor do they necessarily reflect the prices at which businesses or securities actually may be sold or
purchased. Barclays’ role in any due diligence review is limited solely to performing such a review as it shall deem necessary to support its own advice and analysis and shall not be on behalf of the Company, the Board or any individual
officer, director, shareholder or any other person. Barclays, its subsidiaries and affiliates engage in a wide range of businesses from investment and commercial banking, lending, asset management and other financial and non-financial services. In
the ordinary course of its business, Barclays and its affiliates may actively trade and effect transactions in the equity, debt and/or other securities (and any derivatives thereof) and financial instruments (including loans and other obligations)
of the Company for its own account and for the accounts of its customers and, accordingly, may at any time hold long or short positions and investments in such securities and financial instruments or in other financial products and instruments.
Unless otherwise expressly agreed or provided for in other applicable Barclays disclosures governing such corporate transactions or required by law or regulation, Barclays conducts these activities as principal and executes its principal
transactions as an arm’s length counterparty. Barclays does not act as a fiduciary in relation to these corporate transactions. These materials do not constitute investment advice nor do they form part of an offer to sell or purchase, or the
solicitation of an offer to sell or purchase, any securities or any of the businesses or assets described herein or an offer of financing or an offer or recommendation to enter into any corporate transaction described herein. Barclays Capital Inc.
is the United States investment bank of Barclays Bank PLC. Barclays Bank PLC is authorised by the Prudential Regulation Authority and regulated by the Financial Conduct Authority and the Prudential Regulation Authority (Financial Services Register
No. 122702). Registered in England. Registered No. 1026167. Registered office: 1 Churchill Place, London E14 5HP. Copyright Barclays Bank PLC, 2023 (all rights reserved). 14
PRE PREL LIMINA IMINARY RY W WO ORKING RKING DRAF DRAFT T –
– S SUB UBJECT JECT TO TO FURTHE FURTHER R RE REV VIE IEW W A AND ND MOD MODIFICA IFICATIO TION N Exhibit (c)(3)(A) PROJECT APPLE DISCUSSION MATERIALS June 1, 2023

PRELIMINARY WORKING DRAFT – SUBJECT TO FURTHER REVIEW AND
MODIFICATION Intrepid Transaction Team Team Member Experience Selected Work Experience • Intrepid: 2015 – Present (Co-Founder & CEO) Skip McGee • Barclays: 2008 – 2014 (CEO, Americas) 30+ years Co-Founder & CEO
• Lehman Brothers: 1993 – 2008 (Head of Global Investment Banking) • Intrepid: 2017 – Present (Head of Midstream) John Nesland • UBS: 2011 – 2017 (Head of Midstream and Downstream) Managing Director 24 years
• Barclays: 2008 – 2011 (Managing Director) Head of Midstream • Lehman Brothers: 1999 – 2008 (Managing Director) • Intrepid: 2019 – Present (Head of M&A) Greg Sommer Managing Director• Deutsche Bank:
2010 – 2018 (Global Co-Head of Natural Resources Group) 30+ years Head of M&A • Citi: 1997 – 2010 (Managing Director, Head of Energy M&A) John Ed McGee• Intrepid: 2017 – Present 9 years Senior Vice President
• Deutsche Bank: 2014 – 2017 Visesh Keerty • Intrepid: 2018 – Present 5 years Vice President Jennifer Trieschman• Intrepid: 2022 – Present 3 years Associate• Citi: 2020 – 2022 Will McLeroy 2
years• Intrepid: 2021 – Present Analyst 1

PRELIMINARY WORKING DRAFT – SUBJECT TO FURTHER REVIEW AND
MODIFICATION Preliminary Near-term Timeline and Next Steps th Week of May 29 : ▪ Committee, GDC, MNAT and IFP kick-off meeting to discuss initial observations th Week of June 5 : ▪ Meeting with DINO/HEP to review the Proposal and
commence due diligence – Establish VDR protocol and follow-up due diligence procedures ▪ IFP to commence modeling work/transaction analyses ▪ GDC to commence legal due diligence th Week of June 13 : ▪ IFP to evaluate
projections and develop preliminary valuation framework ▪ Follow-up due diligence and Q&A th Week of June 20 : ▪ IFP/GDC to present diligence findings; IFP to present preliminary valuation to Conflicts Committee ▪ Committee to
deliberate; IFP to incorporate Committee feedback into the analysis ▪ Committee, GDC and IFP to formulate optimal response to DINO – Propose specific counteroffer or reject the Proposal on the basis it is inadequate th Week of June 27
and Beyond: ▪ Negotiations to occur, analyses to be refined and continued work on transaction documentation 2

PRELIMINARY WORKING DRAFT – SUBJECT TO FURTHER REVIEW AND
MODIFICATION Summary Due Diligence Topics and Documents ▪ DINO’s strategic rationale for the Proposal; rationale for consideration mix General ▪ HEP strategic alternatives considered in advance of the Proposal and Proposal ▪
Material communication with HEP investors (including the Sinclair Family) leading up to, and after, the date of the Proposal ▪ Detailed business update on DINO and HEP’s business segments/assets ▪ Review of historical dropdown
transactions ▪ Detailed review of HEP’s contract structure and customers mix by business segments/assets Business and – Review of contract expirations, re-contracting events, rate redetermination, etc. Commercial – Review of
contracts and agreements between DINO and HEP rd – Review of DINO vs. 3 party revenue/margin contribution ▪ Identify any go-forward opportunities (e.g., traditional oil & gas and energy transition growth projects) and challenges
(e.g., maintenance, environmental, competition, etc.) ▪ Receive detailed DINO and HEP financial projection models ▪ Evaluate projections vs. Wall Street research projections and expectations from prior projection models; Financial
determine if alternative assumptions / sensitivity scenarios are required ▪ Understand key assumptions for the proposed transaction (including cash tax impacts to DINO) 3

Volume (000) Volume (000) PRELIMINARY WORKING DRAFT – SUBJECT TO
FURTHER REVIEW AND MODIFICATION HEP and DINO Trading Analysis Since Proposal HEP Price Performance and Volume Since Proposal DINO Price Performance and Volume Since Proposal $19.00 8,000 $48.00 8,000 LT&S: +12% $47.00 7,000 7,000 $18.00 HEP:
$17.37 $46.00 +9% 6,000 6,000 XR: $17.00 $45.00 XR: +8% +8% 5,000 SMID Cap. 5,000 $44.00 Refining: $16.00 +6% $15.92 $43.00 4,000 4,000 DINO: MMP/OKE $42.39 $15.00 Large Cap. Announcement +1% $42.00 Refining: 3,000 3,000 (0%) $41.91 Unaffected
30-Day ADTV: 2,547 $41.00 $14.00 2,000 2,000 $40.00 983,200-unit $13.00 1,000 trade at $16.44 1,000 $39.00 Small Cap MLPs: Unaffected 30-Day ADTV: 90 (21%) $38.00 -- $12.00 -- Volume DINO Volume HEP Exchange Ratio Large Cap. Refining LT&S Peers
Small Cap MLP Peers SMID Cap. Refining Unaffected 30-Day ADTV (in '000s) Exchange Ratio Unaffected 30-Day ADTV (in '000s) Note: Market data as of May 30, 2023. LT&S Peers include: DKL, MMP, NS, PAA. Small Cap MLP peers include CAPL, GEL, GLP,
MMLP, USDP. Large Cap Refining peers include MPC, PSX, 4 VLO. SMID Cap Refining peers include CVI, DK, PARR, PBF. Source: FactSet, company disclosure. Unit Price ($) | Indexed to HEP Share Price ($) | Indexed to DINO

PRELIMINARY WORKING DRAFT – SUBJECT TO FURTHER REVIEW AND
MODIFICATION Exchange Ratio Analysis | HEP / DINO The spot exchange ratio has traded up 10% vs. the Proposal Exchange Ratio Analysis Proposal vs. 0.460x Unaffected Date Exchange Ratio Ref. Period Current (05/30/23) 0.4098x (9.4%) (5/3/2023) VWAP
Since Proposal 0.4142x (10.3%) 0.440x Unaffected Close (05/03/2023) 0.3799x (2.2%) Unaffected 30-Day VWAP 0.3719x (0.1%) Unaffected 90-Day VWAP 0.3648x 1.8% Unaffected 180-Day VWAP 0.3419x 8.6% 0.420x Unaffected 1-Year VWAP 0.3475x 6.9% Benefits HEP
0.4098x 0.400x 0.380x 0.3799x 0.3719x 0.3714x 0.3648x 0.360x 0.3475x 0.340x 0.3419x 0.320x Benefits DINO 0.300x 0.280x May-22 Aug-22 Oct-22 Jan-23 Mar-23 May-23 HEP/DINO Unaffected 30-Day VWAP Unaffected 90-Day VWAP Unaffected 180-Day VWAP
Unaffected 1-Year VWAP Proposal Unaffected Close (5/3/23) 5 Note: Market data as of May 30, 2023. Source: FactSet.

PRELIMINARY WORKING DRAFT – SUBJECT TO FURTHER REVIEW AND
MODIFICATION Comparison of the Proposal to Precedent Transactions Premiums HEP Trading Metrics and Proposal Implied Premium/(Discount) Unaffected 10-Day VWAP 20-Day VWAP 30-Day VWAP 60-Day VWAP 90-Day VWAP 52-Wk High 52-Wk Low Reference Metric:
0.3799x 0.3872x 0.3804x 0.3719x 0.3677x 0.3648x 0.4378x 0.2850x Proposal Implied Premium/(Discount) vs. All-Equity MLP Buy-In Precedent Transaction Premiums 261% 34% 25% 25% 24% 24% 22% 30% 27% 7% 10% 9% 8% 9% 7% 7% 14% 2% 1% (0%) (2%) (2%) (4%)
(3%) 0% (1%) (1%) 1% 1% (11%) (15%) (61%) Proposal Implied Premium/(Discount) vs. All MLP Buy-In Precedent Transaction Premiums 261% 56% 49% 47% 47% 43% 35% 32% 30% 12% 12% 11% 11% 10% 10% 10% 14% 1% 2% (0%) (2%) (2%) (4%) (1%) (3%) 0% (10%) (9%)
(4%) 1% (15%) (61%) Precedents (High-Low Range) Precedents (Mean) Precedents (Median) Proposal 6 Note: Market data as of May 30, 2023. Source: Company disclosure, Wall Street research, FactSet.

PRELIMINARY WORKING DRAFT – SUBJECT TO FURTHER REVIEW AND
MODIFICATION Implied Premiums and Valuation Metrics at Various Exchange Ratios HEP Consolidated DINO Proposal Proposal Precedents ($mm, unless per unit data) (Unaffected) (Current) Current Current Median HEP/DINO Exchange Ratio 0.3714x 0.3714x
0.4098x 0.4000x 0.4250x 0.4500x 0.4750x 0.5000x 0.5250x 0.5500x $42.39 Implied HEP Unit Price (@ Current DINO) $15.57 $15.74 $17.37 $16.96 $18.02 $19.08 $20.14 $21.20 $22.25 $23.31 Metric Implied Prem./(Disc.) to Current (as of 5/30/23) 0.4098x (9%)
(9%) -- (2%) 4% 10% 16% 22% 28% 34% Initial Proposal 0.3714x -- -- 10% 8% 14% 21% 28% 35% 41% 48% VWAP Since Proposal 0.4142x (10%) (10%) (1%) (3%) 3% 9% 15% 21% 27% 33% Unaffected Close (as of 5/3/23) 0.3799x (2%) (2%) 8% 5% 12% 18% 25% 32% 38% 45%
10% Unaffected 10-Day VWAP 0.3872x (4%) (4%) 6% 3% 10% 16% 23% 29% 36% 42% 9% Unaffected 20-Day VWAP 0.3804x (2%) (2%) 8% 5% 12% 18% 25% 31% 38% 45% 7% Unaffected 30-Day VWAP 0.3719x (0%) (0%) 10% 8% 14% 21% 28% 34% 41% 48% 8% Unaffected 60-Day VWAP
0.3677x 1% 1% 11% 9% 16% 22% 29% 36% 43% 50% 7% Unaffected 90-Day VWAP 0.3648x 2% 2% 12% 10% 17% 23% 30% 37% 44% 51% 9% Unaffected 52-week High (05/03/22) 0.4378x (15%) (15%) (6%) (9%) (3%) 3% 8% 14% 20% 26% (11%) Unaffected 52-week Low (11/15/22)
0.2850x 30% 30% 44% 40% 49% 58% 67% 75% 84% 93% 27% Units Unit Ownership DINO 59.6 $928 $939 $1,036 $1,011 $1,074 $1,137 $1,201 $1,264 $1,327 $1,390 (1) Unaffiliated Public 67.0 $1,042 $1,054 $1,163 $1,136 $1,207 $1,277 $1,348 $1,419 $1,490 $1,561
(1) (x) Total Units/Shares Outstanding 126.6 192.3 Total Equity Value $1,971 $1,993 $2,199 $2,147 $2,281 $2,415 $2,549 $2,683 $2,817 $2,952 $8,152 (+) Debt 1,552 3,259 (2) (+) Non-Controlling Interests -- 1,163 (-) Cash (7) (1,365) (+) Class B
Profit Sharing Interest 62 -- Total Enterprise Value $3,576 $3,599 $3,805 $3,753 $3,887 $4,021 $4,155 $4,289 $4,423 $4,558 $11,210 LT&S / Small (3) Metric Cap Metric TEV/'23E EBITDA $449 8.0x 8.0x 8.5x 8.4x 8.7x 9.0x 9.3x 9.5x 9.8x 10.1x 9.5x /
7.5x $3,017 3.7x TEV/'24E EBITDA 464 7.7x 7.8x 8.2x 8.1x 8.4x 8.7x 9.0x 9.3x 9.5x 9.8x 8.9x / 7.2x 2,658 4.2x (4) 2023E DCF Yield $327 16.6% 16.4% 14.9% 15.2% 14.3% 13.5% 12.8% 12.2% 11.6% 11.1% 15.8% / 17.2% $1,796 19.3% (4) 2024E DCF Yield 344
17.4% 17.2% 15.6% 16.0% 15.1% 14.2% 13.5% 12.8% 12.2% 11.6% 17.2% / 27.1% 1,768 19.0% (5) 2023E FCF Yield $319 16.2% 16.0% 14.5% 14.9% 14.0% 13.2% 12.5% 11.9% 11.3% 10.8% 10.2% / 11.1% $1,333 14.3% (5) 2024E FCF Yield 269 13.6% 13.5% 12.2% 12.5%
11.8% 11.1% 10.5% 10.0% 9.5% 9.1% 13.2% / 16.7% 1,168 12.5% LQA Dist. / Div. Yield $1.40 9.0% 8.9% 8.1% 8.3% 7.8% 7.3% 7.0% 6.6% 6.3% 6.0% 7.6% / 6.1% $1.80 4.2% Debt/LTM EBITDA $438 3.5x 4.0x / 4.4x $5,294 0.6x Note: Market data as of May 30, 2023.
Balance sheet data as of March 31, 2023. For illustrative purposes, (3) LT&S peers include: DKL, MMP, NS, PAA. Small Cap peers include CAPL, GEL, GLP, capitalization excludes finance leases. MMLP, USDP. (1) Includes 116,154 phantom units and
43,365 performance units outstanding as of March 31, 2023. (4) Represents Cash Flow from Operations. 7 (2) HEP cash flow metrics are shown net to HEP and therefore NCI is excluded from TEV. DINO (5) Calculated as Cash Flow from Operations less
capex. NCI reflects the current market value of HEP units not held by DINO Source: Company disclosure, Wall Street research, FactSet.

PRELIMINARY WORKING DRAFT – SUBJECT TO FURTHER REVIEW AND
MODIFICATION Proposal-Implied HEP Metrics vs. Public Trading Companies Metrics based on Proposal and DINO's unaffected share price of $41.91 (1) TEV/2023E EBITDA (x) TEV / 2024E EBITDA (x) `23E - `25E EBITDA Growth (%) Proposal 10.7x 8.0x at Current
6.5% 9.9x 7.8x 9.7x DINO: 9.5x 6.1% 8.9x 8.0x 7.7x 7.3x 5.4% 7.5x 8.3x 8.1x 7.2x 3.8% 6.8x 6.4x 1.1% 1.6% 1.5% HEP LT&S Small-Cap MLPs HEP LT&S Small-Cap MLPs HEP LT&S Small-Cap MLPs (At Proposal) (At Proposal) (At Proposal) 2023E DCF
Yield (%) LQA Dividend Yield (%) Debt / LTM EBITDA (x) 27.3% 16.4% 4.8x 4.7x 8.9% 19.1% 4.4x 16.6% 3.5x 4.0x 4.3x 17.2% 9.0% 8.6% 15.8% 8.4% 3.4x 14.6% 7.6% 6.1% 11.8% 7.2% 1.0% HEP LT&S Small-Cap MLPs HEP LT&S Small-Cap MLPs HEP LT&S
Small-Cap MLPs (At Proposal) (At Proposal) th th 25 to 75 Percentile Peer Median Note: Market data as of May 30, 2023. LT&S Peers include: DKL, MMP, NS, PAA. Small-Cap MLPs include: CAPL, GEL, GLP, MMLP, USDP. 8 (1) Small Cap MLP EBITDA Growth
reflects ’23E – ’24E EBITDA Growth for CAPL, GLP, MMLP, and USDP due to lack of 2025E estimates. Source: FactSet, company disclosure.

PRELIMINARY WORKING DRAFT – SUBJECT TO FURTHER REVIEW AND
MODIFICATION DINO Metrics vs. Public Trading Companies DINO metrics based on current share price and HEP metrics based on the Proposal and DINO’s unaffected share price TEV/2023E EBITDA (x) TEV / 2024E EBITDA (x) LQA Dividend Yield (%) 6.3x
HEP HEP HEP 6.0x 5.1x 5.3x 8.0x 7.7x 9.0% 5.0x 5.6x 4.1x 4.2x 3.7x 5.0% 4.2x 4.0x 4.2% 4.1% 3.2x 3.7% 2.9x 2.9% 2.4x 3.3% 1.6% DINO Large Cap. SMID Cap. DINO Large Cap. SMID Cap. DINO Large Cap. SMID Cap. Refiners Refiners Refiners Refiners Refiners
Refiners 2023E CFFO Yield (%) 2024E CFFO Yield (%) Net Debt / LTM EBITDA (x) HEP HEP HEP (Already Consolidated) (1) (1) 16.6% 17.4% 3.5x 31.4% 29.7% 22.8% 1.0x 28.3% 27.9% 19.3% 19.7% 26.2% 19.0% 0.6x 18.1% 18.6% 23.4% 0.6x 16.5% 0.4x 16.5% 0.3x
0.4x DINO Large Cap. SMID Cap. DINO Large Cap. SMID Cap. DINO Large Cap. SMID Cap. Refiners Refiners Refiners Refiners Refiners Refiners th th 25 to 75 Percentile Peer Median Note: Market data as of May 30, 2023. Large Cap Refining peers include
MPC, PSX, VLO. SMID Cap Refining peers include CVI, DK, PARR, PBF. 9 (1) Reflects DCF yield. Source: FactSet, company disclosure.

PRELIMINARY WORKING DRAFT – SUBJECT TO FURTHER REVIEW AND
MODIFICATION Illustrative DINO “Cash Firepower” Analysis ▪ The tables below illustrate the amount of cash consideration DINO could utilize in a transaction, subject to various constraints: − Minimum Cash: management has
publicly cited $500mm minimum cash balance vs. 3/31/23 balance of $1,365mm − Maximum Leverage: 65% Net Debt / Total Capitalization covenant; public target of ~1x gross leverage (consolidated) − For reference, the PBF / PBFX transaction
consisted of ~50% stock / 50% cash consideration ▪ At HEP's current quarterly distribution of $0.35/unit, DINO receives $21mm/quarter in distributions from HEP ▪ DINO 2023E free cash flow is $1.3bn, per consensus estimates Illustrative
Cash Firepower Under Various DINO Funding Assumptions 1.0x PF 1.0x PF (1) (1) Proposal $500mm PF Cash Gross Leverage Net Leverage Cash ($mm | $/unit) -- $865mm | $12.92/unit $2,035mm | $30.38/unit $3,400mm | $50.76/unit DINO PF Leverage 0.6x 0.6x
1.0x 1.3x DINO PF Net Leverage 0.4x 0.5x 0.7x 1.0x DINO PF Net Debt / Cap. 14% 20% 25% 31% Note: Market data as of unaffected date (May 3, 2023). 10 (1) Assumes all cash consideration is funded through new debt. Source: Company disclosure,
FactSet.

PRELIMINARY WORKING DRAFT – SUBJECT TO FURTHER REVIEW AND
MODIFICATION APPENDIX 11

PRELIMINARY WORKING DRAFT – SUBJECT TO FURTHER REVIEW AND
MODIFICATION Select Research Analyst Commentary Since Announcement Select Commentary | Broker and Credit Research “[We believe it is] a starting point for negotiation. DINO follows the “However with DINO trading down 8% and HEP down 2%
the market majority of its refining peers with the MLP buy-in, while we take a appears to be signaling the probability of a higher bid noting similar wait-and-see approach on its ultimate value creation. Further on the patterns for other such deals.
Strategically, the deal logic is sound, as it corporate structure, under new leadership, management continues to receive removes value leakage in the form of HEP’s 8.6% distribution yield, and questions on the potential unlock of value of the
Lubes business, which it preserves cash for the parent co.” appears receptive to, but perhaps only after certain organic initiatives are May 4, 2023 completed” “From DINO’s perspective, we think the buy-in will help to
simplify the May 8, 2023 corporate structure and lower some costs. HEP has indicated its independent conflict committee will “review, evaluate and negotiate” the transaction, “DINO announced today a non-binding offer to purchase
all outstanding which leaves the possibility that the exchange ratio could change units of HEP in a bid to simplify the company’s corporate structure, reduce modestly, in our view. We think the simplification makes sense, as the costs, and
further optimize its portfolio. Consolidating the MLP into the original intent for the MLP no longer holds water given changes in corporate structure has historically been viewed as positive, in our capital market access and investor
preferences” view.” May 4, 2023 May 4, 2023 “The deal may simplify structure but in our view there are no real “We would view this transaction as supportive of the company’s credit synergies so it would be dilutive for
DINO shareholders. Based on ratio quality because it will streamline its corporate structure and reduce of 0.3714, we estimate DINO will have to issue 24.8M new shares which some cash leakage at HEP associated with its status as a public entity.
equates to 12.7% increase in share count. If DINO raises the bid by 10% to Our rating on DINO is unchanged because it reflects our view of the close this deal (as we have seen with some prior transactions), then enterprise on a consolidated basis,
including HEP.” ratio would move to 0.40.” May 4, 2023 May 4, 2023 “The ratings of HF Sinclair are unchanged by its offer to acquire the “The deal looks less attractive on an EV/EBITDA multiple, with DINO publicly held common
units of HEP. HEP’s debt is already consolidated trading at ~5x our 2025 normalized EBITDA and HEP at >8x. The on HF Sinclair's balance sheet and factored into our credit analysis of HF discrepancy between the two methodologies is due to
HEP distributing a Sinclair… HEP’s ratings are not likely to be downgraded given the portion of FCF. We believe FCF is more representative of the deal's likelihood that the proposed acquisition will close.” value.” May 8,
2023 May 4, 2023 12 Source: Wall Street research, Bloomberg, FactSet.

PRELIMINARY WORKING DRAFT – SUBJECT TO FURTHER REVIEW AND
MODIFICATION HEP Wall Street Research Summary Selected HEP Target Price and Ratings Research Analyst Perspectives Pre-Announcement Post-Announcement EBITDA $449 Broker Date Target Rating Updated? Target Rating ’23E – ’25E CAGR:
1.1% 2023E $441 $460 (n=2) $464 Citi 4/5/23 $20 Hold Yes $17 Hold 2024E $448 $480 (n=2) $459 2025E (n=1) Barclays 4/4/23 $18 Sell No $18 Sell $400 $450 $500 $550 Distributable Cash Flow $327 ’23E – ’25E CAGR: N/A JP Morgan 3/8/23
$19 Sell No $18 Sell 2023E $318 $336 (n=2) $344 2024E $328 $356 (n=2) Raymond James 2/24/23 $23 Buy Yes $20 Buy 2025E (n=0) $250 $350 $450 Max $23 1 Buy $20 1 Buy Distribution per Unit $1.47 ’23E – ’25E CAGR: 12.1% 2023E $1.40
$1.55 Median (4 Brokers) $20 1 Hold $18 1 Hold (n=2) $1.61 2024E $1.40 $1.75 Mean (4 Brokers) $20 2 Sell $18 2 Sell (n=2) $1.85 2025E Min $18 $17 (n=1) $1.00 $1.25 $1.50 $1.75 $2.00 $2.25 Consensus Estimate 13 Note: Market data as of May 30, 2023.
Source: Wall Street research, FactSet.

PRELIMINARY WORKING DRAFT – SUBJECT TO FURTHER REVIEW AND
MODIFICATION DINO Wall Street Research Summary Selected DINO Selected Target Price and Ratings Research Analyst Perspectives (1) Fully-Consolidated EBITDA Pre-Announcement Post-Announcement $3,017 2023E $2,674 $3,473 Broker Date Target Rating
Updated? Target Rating (n=10) $2,658 Piper Sandler & Co. 5/1/23 $73 Buy Yes $59 Buy 2024E $2,354 $3,372 (n=10) Mizuho Capital 4/20/23 $68 Buy Yes $56 Buy $2,442 2025E $2,109 $2,741 RBC Capital 4/19/23 $66 Buy Yes $59 Buy (n=4) $1,500 $2,000
$2,500 $3,000 $3,500 $4,000 $4,500 $5,000 Wells Fargo 4/18/23 $52 Buy Yes $48 Buy Cash Flow from Operations $1,796 Goldman Sachs 4/18/23 $58 Buy Yes $56 Buy 2023E $1,544 $2,310 (n=7) Scotiabank 4/13/23 $57 Buy Yes $57 Buy $1,768 2024E $1,606 $1,980
Cowen 4/13/23 $50 Hold Yes $44 Hold (n=7) $1,592 TPH &Co. 4/10/23 $56 Buy Yes $50 Buy 2025E $1,536 $1,613 (n=3) Barclays 4/9/23 $55 Hold No $55 Hold $1,000 $1,500 $2,000 $2,500 $3,000 Dividend per Share JP Morgan 4/5/23 $57 Hold Yes $57 Hold
$1.80 ’23E – ’25E CAGR: 4.4% 2023E $1.80 $1.82 (n=9) Max $73 7 Buy $59 7 Buy $1.90 2024E $1.79 $2.00 Median (10 Brokers) $57 3 Hold $56 3 Hold (n=9) $1.96 Mean (10 Brokers) $59 0 Sell $54 0 Sell 2025E $1.79 $2.20 (n=5) Min $50 $44
$1.25 $1.75 $2.25 $2.75 Consensus Estimate Note: Market data as of May 30, 2023. 14 (1) Illustratively includes ~53% of HEP consensus EBITDA to all DINO research estimates. Source: Wall Street research, FactSet.

PRELIMINARY WORKING DRAFT – SUBJECT TO FURTHER REVIEW AND
MODIFICATION Disclaimer These materials have been prepared by Intrepid Partners, LLC (“Intrepid”) for the Conflicts Committee (the “Committee”) of the Board of Directors of Holly Logistic Services, L.L.C. (the “General
Partner”), the ultimate general partner of Holly Energy Partners, L.P. (“HEP”), to whom such materials are directly addressed and delivered. These materials are confidential and may not be used or relied upon by any other person or
for any purpose other than as specifically contemplated by a written agreement with Intrepid. These materials have been developed by and are proprietary to Intrepid and were prepared exclusively for the benefit and internal use of the Committee in
connection with evaluating the Proposed Transaction with HEP and HF Sinclair Corporation (“DINO”). These materials are based upon information provided by or on behalf of the management of DINO and the General Partner, from public
sources, or otherwise reviewed by Intrepid. Intrepid has relied upon and assumes no responsibility for independent investigation or verification of such information and has relied upon such information being complete and accurate in all material
respects. To the extent such information includes estimates and forecasts of future performance prepared by or reviewed with management of DINO or the General Partner and/or other potential transaction participants or obtained from public sources,
Intrepid has assumed that such estimates and forecasts have been reasonably prepared on bases reflecting the best currently available estimates and judgments of management of DINO, and the General Partner or such other potential transaction
participants (or, with respect to estimates and forecasts obtained from public sources, represent reasonable estimates). Actual results may differ materially from such estimates and forecasts. No representation or warranty, express or implied, is
made as to the accuracy or completeness of such information, and nothing contained herein is, or shall be relied upon as, a representation or warranty, whether as to the past, the present or the future. The materials and related commentary are not
intended to provide the only basis for evaluating, and should not be considered a recommendation with respect to, the consideration paid, the proposed transaction or any transaction or other matter. These materials are also subject to the
qualifications and limitations described in any accompanying written opinion letter. These materials were compiled on a confidential basis solely for use by the Committee and may not be relied on by any other party (including stakeholders in either
entity), even if such parties are provided a copy of these materials. These materials were prepared without a view to public disclosure or filing thereof under state or federal laws, and may not be redistributed, reproduced, distributed, passed to
others, transmitted, quoted or referred to, in whole or in part, without the prior written permission of Intrepid in accordance with the terms of our engagement letter with the Committee. These materials speak only as of the date on the cover and
Intrepid assumes no obligation to update these materials or inform any recipient of changed circumstances, events or information. These materials were prepared for a specific use by specific persons and were not prepared to conform with any
disclosure standards under securities laws or otherwise. In the ordinary course of its business, each of Intrepid and its affiliates may actively trade or hold the securities of DINO, HEP or other parties involved in a proposed transaction for its
own account or for the account of its customers and, accordingly, may at any time hold a long or short position in such securities. Intrepid will receive a fee in connection with delivery of an opinion relating to the proposed transaction. These
materials do not constitute, nor do they form part of, an offer or solicitation to sell or purchase any securities or instruments and are not a commitment by Intrepid or any of its affiliates to provide, arrange or underwrite any financing for any
transaction or to purchase any security in connection therewith. These materials may not reflect information known to other professionals in other business areas of Intrepid and its affiliates. Intrepid and its affiliates do not provide legal,
regulatory, accounting, bankruptcy, securities or tax advice. Any statements contained herein as to tax matters were neither written nor intended by Intrepid or its affiliates to be used and cannot be used by any taxpayer for the purpose of avoiding
tax penalties that may be imposed on such taxpayer. Each person should seek legal, regulatory accounting and tax advice based on his, her or its particular circumstances from independent advisors regarding the evaluation and impact of any
transactions or matters described herein.

PRE PREL LIMINA IMINARY RY W WO ORKING RKING DRAF DRAFT T –
– S SUB UBJECT JECT TO TO FURTHE FURTHER R RE REV VIE IEW W A AND ND MOD MODIFICA IFICATIO TION N Exhibit (c)(3)(B) PROJECT APPLE DISCUSSION MATERIALS June 26, 2023

PRELIMINARY WORKING DRAFT – SUBJECT TO FURTHER REVIEW AND
MODIFICATION Table of Contents I. Situation Update 2 II. Review of Management Projections 8 Tab A: HEP 9 Tab B: DINO 14 III. Appendix 21 1

PRELIMINARY WORKING DRAFT – SUBJECT TO FURTHER REVIEW AND
MODIFICATION I. SITUATION UPDATE 2

PRELIMINARY WORKING DRAFT – SUBJECT TO FURTHER REVIEW AND
MODIFICATION Market Performance and Implied Proposal | “Then” vs. “Now” 5/3/23 (“Then”) 6/21/23 (“Now”) Change (%) DINO Unit Price $41.91 $44.54 +6.3% HEP Unit Price $15.92 $18.24 +14.6% Spot Exchange
Ratio 0.3799x 0.4095x +7.8% Implied Value at Proposal (0.3714x) $15.57 $16.54 +6.3% (2.2%) (9.3%) Premium / Discount vs. HEP Price (2.2%) +3.9% Premium / Discount vs. Unaff. HEP price HEP Peers | LT&S +15.4% HEP Peers | Small Cap. (19.1%) DINO
Peers | Large Cap. +1.1% DINO Peers | SMID Cap. +8.8% Note: Market data as of June 21, 2023. LT&S Peers include: DKL, NS, PAA. Small Cap MLP peers include CAPL, GEL, GLP, MMLP, USDP. Large Cap Refining peers include MPC, PSX, VLO. SMID 3 Cap
Refining peers include CVI, DK, PARR, PBF, VTNR. Source: FactSet, public disclosure. Peer Trading Perf.

Volume (000) Volume (000) PRELIMINARY WORKING DRAFT – SUBJECT TO
FURTHER REVIEW AND MODIFICATION HEP and DINO Trading Analysis Since Proposal HEP Price Performance and Volume Since Proposal DINO Price Performance and Volume Since Proposal $48.00 8,000 $19.00 8,000 LT&S: HEP: +15% $18.24 +15% $47.00 SMID Cap.
7,000 7,000 Refining: $18.00 +9% XR: $46.00 +8% 6,000 6,000 DINO: $17.00 XR: $45.00 $44.54 +8% +6% 5,000 5,000 $44.00 Large Cap. $16.00 Refining: +1% $15.92 $43.00 4,000 4,000 MMP/OKE $15.00 $42.00 Announcement 3,000 3,000 Unaffected 30-Day $41.91
ADTV: 2,547 $41.00 $14.00 2,000 2,000 $40.00 $13.00 1,000 1,000 983,200-unit Small Cap. $39.00 trade at $16.44 MLPs: (19%) Unaffected 30-Day ADTV: 90 $12.00 -- $38.00 -- Volume DINO Volume HEP LT&S Peers Small Cap. MLP Peers Exchange Ratio Large
Cap. Refining SMID Cap. Refining Unaffected 30-Day ADTV (in '000s) Exchange Ratio Unaffected 30-Day ADTV (in '000s) Note: Market data as of June 21, 2023. LT&S Peers include: DKL, NS, PAA. Small Cap. MLP peers include CAPL, GEL, GLP, MMLP, USDP.
Large Cap. Refining peers include MPC, PSX, VLO. 4 SMID Cap. Refining peers include CVI, DK, PARR, PBF, VTNR. Source: FactSet, company disclosure. Unit Price ($) | Indexed to HEP Share Price ($) | Indexed to DINO

PRELIMINARY WORKING DRAFT – SUBJECT TO FURTHER REVIEW AND
MODIFICATION Exchange Ratio Analysis | HEP / DINO The spot exchange ratio has traded up 10% vs. the Proposal Exchange Ratio Analysis Proposal vs. 0.460x Unaffected Date Exchange Ratio Ref. Period Current (06/21/23) 0.4095x (9.3%) (5/3/2023) VWAP
Since Proposal 0.4136x (10.2%) 0.440x Unaffected Close (05/03/2023) 0.3799x (2.2%) Unaffected 30-Day VWAP 0.3719x (0.1%) Unaffected 90-Day VWAP 0.3648x 1.8% Unaffected 180-Day VWAP 0.3419x 8.6% 0.420x Unaffected 1-Year VWAP 0.3475x 6.9% Benefits HEP
0.4095x 0.400x 0.380x 0.3799x 0.3719x 0.3714x 0.3648x 0.360x 0.3475x 0.3419x 0.340x 0.320x Benefits DINO 0.300x 0.280x Jun-22 Sep-22 Nov-22 Jan-23 Apr-23 Jun-23 HEP/DINO Unaffected 30-Day VWAP Unaffected 90-Day VWAP Unaffected 180-Day VWAP
Unaffected 1-Year VWAP Proposal Unaffected Close (5/3/23) 5 Note: Market data as of June 21, 2023. Source: FactSet, public disclosure.

PRELIMINARY WORKING DRAFT – SUBJECT TO FURTHER REVIEW AND
MODIFICATION Summary of Intrepid’s Due Diligence to Date ▪ May 26, 2023 – Intrepid provides initial due diligence and data request list to DINO/HEP ▪ June 12, 2023 – in-person management presentation with DINO/HEP
management ▪ June 13, 2023 – Intrepid receives access to the virtual dataroom ▪ June 13, 2023 – DINO/HEP provide initial responses to Intrepid’s due diligence items ▪ June 15, 2023 – call between Intrepid
and Barclays to discuss data requests ▪ June 16, 2023 – Intrepid provides follow-up due diligence and data request items to DINO/HEP ▪ June 22, 2023 – call between Intrepid and DINO/HEP to discuss the financial forecast,
model assumptions/drivers and other remaining financial diligence items ▪ As of June 22, 2023, Intrepid and Gibson Dunn have submitted ~120 due diligence and data request items, of which ~80 have been addressed ▪ Remaining key diligence
items include: – Additional DINO forecast detail – Supporting detail for certain forecast assumptions – Sensitivity analysis 6

PRELIMINARY WORKING DRAFT – SUBJECT TO FURTHER REVIEW AND
MODIFICATION Key Diligence Focus Areas & Value Drivers (1) Segment Key Financial Stats Selected Diligence Topics ▪ Crack spread assumptions and comparison vs. benchmarks (e.g., Gulf Coast 3-2-1, DINO West/MidCon Indicators) ▪
’23E – ’28E EBITDA: $9.9bn (58% of total)▪ Utilization and capture rates vs. historical performance Refining ▪ “Mid-cycle” EBITDA: ▪ Turnaround schedule, capital requirements and impact on throughput /
$1.34bn/yr. utilization ▪ Hydrogen supply to Navajo refiner vs. Cheyenne RD unit ▪ ’23E – ’28E EBITDA: ▪ Crack spread assumptions and comparison vs. benchmarks (e.g., DINO $2.4bn (14% of total) Group I, II, III
Base Oil Indicators) Lubricants ▪ ’23E – ’28E EBITDA ▪ McKinsey improvements to EBITDA (16% of total lubricants EBITDA) CAGR: 7% ▪ ’23E – ’28E EBITDA: $2.4bn (14% of total)▪ Volume and rate
assumptions HEP ▪ ’23E – ’28E EBITDA ▪ Contract expirations / renewals CAGR: 3% ▪ ’23E – ’28E EBITDA: ▪ EBITDA growth from ($74mm) in ’22A to $400mm in ’28E $1.9bn (11% of
total) Renewables ▪ Pricing assumptions, including RINs, BTC/PTC and LCFS ▪ ’23E – ’28E EBITDA ▪ Utilization and capture rates CAGR: 40% ▪ ’23E – ’28E EBITDA: $0.5bn (3% of total)▪
EBITDA growth from $63mm in ’22A to $112mm in ’28E Marketing ▪ ’23E – ’28E EBITDA ▪ Volumetric growth CAGR: 13% 7 (1) Segment contribution includes segment G&A; excludes corporate, other, and
eliminations. Source: DINO management.

PRELIMINARY WORKING DRAFT – SUBJECT TO FURTHER REVIEW AND
MODIFICATION II. REVIEW OF MANAGEMENT PROJECTIONS 8

PRELIMINARY WORKING DRAFT – SUBJECT TO FURTHER REVIEW AND
MODIFICATION TAB A: HEP 9

PRELIMINARY WORKING DRAFT – SUBJECT TO FURTHER REVIEW AND
MODIFICATION Key Forecast Assumptions – HEP • Projection model includes bottoms-up revenue build by segment (i.e., pipelines, terminals, refinery processing units), including a breakout of affiliate vs. third-party revenues •
Projected throughput volumes are implied by DINO refining model assumptions and management estimates for third-party volumes – Downtime and turnarounds derived from historical performance and planned turnarounds (typically 5-year cycle)
Revenue • All contracts are renewed at similar rates and volumes, with the exception of the Malaga and Roadrunner contracts – Malaga – ~$9.5mm annual revenue impact – Roadrunner – ~$6mm annual revenue impact •
Contract rates escalated at 13.5% PPI in July 2023 and 2% PPI in following years, subject to individual contract inflation caps • $272mm of capex from 2023E – 2028E • No growth capex other than $3mm in 1H23A for Moriarty terminal
butane blending project – Future growth opportunities mentioned in the Management Presentation are excluded (gasoline storage at Cheyenne; butane transloading at Cedar City) • Maintenance capex of $30mm – $32mm per year •
Turnaround capex of $3mm and $30mm in 2024E (El Dorado hydrogen unit) and 2028E (Woods Cross crude unit), respectively Capital • $7mm of capex in 2023E related to Osage Pipeline release Assumptions – Oil release in July 2022 and resumed
operations in 3Q22; remediation efforts are underway • $40mm of aggregate capex related to bring the Midcon Product system to desired operating condition from 2024E – 2027E ($10mm p.a.) – Estimates for actual capex could range from
$20mm – $60mm and work is ongoing – ~$1.5mm EBITDA impact to HEP, or implied ~27x investment multiple – Alternatively, the shutdown cost is $4mm (subject to further diligence) 10

PRELIMINARY WORKING DRAFT – SUBJECT TO FURTHER REVIEW AND
MODIFICATION Key Forecast Assumptions – HEP (Cont’d) • Quarterly distributions held flat at $0.35/unit ($1.40/unit annualized) throughout forecast – Coverage ratio peaks at 2.3x in 2027E and averages 2.1x during the forecast
period • Capex and distributions are fully-funded by cash flow Financing • All excess cash used to repay RCF ($652mm balance as of 3/31/2023A); cash builds on balance sheet thereafter Assumptions – Gross and net leverage reach 1.7x
and 0.6x, respectively by year-end 2028E • Bonds are refinanced at similar rates • $15mm minimum cash balance • Quarterly projections provided through 2023E and annually through 2028E • Equity earnings expected to reach
~$25mm in 2025E and remain flat thereafter Other – Distributions from equity method investments assumed to equal equity earnings 11

PRELIMINARY WORKING DRAFT – SUBJECT TO FURTHER REVIEW AND
MODIFICATION HEP | Financial Projection Summary Adjusted EBITDA and Distributable Cash Flow ($mm) Capex ($mm) ’23E – ’28E EBITDA CAGR: 2.2% ’23E – ’28E DCF CAGR: 3.7% $511 $497 $477 $480 $474 $77 $458 $415 $62 $25
$400 $44 $398 $42 $42 $42 $41 $378 $30 $360 $349 $21 $0 $332 $10 $10 $10 $10 $307 $10 $3 $31 $31 $32 $32 $32 $32 $30 2022A 2023E 2024E 2025E 2026E 2027E 2028E 2022A 2023E 2024E 2025E 2026E 2027E 2028E Maintenance Capex Growth & JV Investment
Adjusted EBITDA Distributable Cash Flow Turnaround Capital MidCon Capital DPU ($) and Coverage (x) Leverage – End of Period (x) 3.8x 2.1x 2.3x 2.2x 2.0x 2.0x 1.9x 3.1x 1.7x 2.5x $1.40 $1.40 $1.40 $1.40 $1.40 $1.40 $1.40 2.1x 1.9x 1.8x 1.7x
3.7x 3.0x 2.5x 2.1x 1.6x 1.1x 0.6x 2022A 2023E 2024E 2025E 2026E 2027E 2028E 2022A 2023E 2024E 2025E 2026E 2027E 2028E Gross Leverage Net Leverage Distribution Per Unit Coverage 12 Source: Management guidance, public disclosure.

PRELIMINARY WORKING DRAFT – SUBJECT TO FURTHER REVIEW AND
MODIFICATION HEP | Estimates Summary: 2023E – 2028E Adjusted EBITDA ($mm) Distributable Cash Flow ($mm) # of Brokers 3 3 2 0 0 0 # of Brokers 2 2 0 0 0 0 $511 $497 $480 $480 $400 $475 $398 $460 $477 $474 $378 $458 $360 $463 $466 $356 $447 $415
$457 $336 $448 $349 $435 $332 $307 $313 $313 $289 $271 2022A 2023E 2024E 2025E 2026E 2027E 2028E 2022A 2023E 2024E 2025E 2026E 2027E 2028E (1) Total Capex ($mm) Distribution per Unit ($/unit) # of Brokers 2 2 0 0 0 0 # of Brokers 2 2 1 1 1 1
Includes $30mm of Turnaround Capital $77 $1.81 $1.66 Includes $25mm of $1.73 $1.58 $1.51 $1.65 $1.63 Turnaround Capital $62 $1.40 $1.49 $1.60 $1.46 $1.40 $1.40 $1.40 $1.40 $1.40 $1.40 $40 $1.40 $1.40 $42 $42 $42 $38 $44 $41 $39 $36 $35 $38 2022A
2023E 2024E 2025E 2026E 2027E 2028E 2022A 2023E 2024E 2025E 2026E 2027E 2028E Management Consensus Broker Estimate Range Note: Market data as of June 21, 2023. 13 (1) Includes maintenance capex, growth capex and turnaround capital. Source: Company
disclosure, Management guidance, Wall Street research.

PRELIMINARY WORKING DRAFT – SUBJECT TO FURTHER REVIEW AND
MODIFICATION TAB B: DINO 14

PRELIMINARY WORKING DRAFT – SUBJECT TO FURTHER REVIEW AND
MODIFICATION Key Forecast Assumptions – DINO • Forecast based on a bottoms-up build for each of DINO’s seven refineries • EBITDA forecast based on refinery-specific assumptions for (i) crude and product advantages (net of
logistics costs) (ii) capture rates (iii) throughput rate and (iv) opex – Crude/product advantages and capture rates held flat during the forecast period – Opex is escalated at 2% annually Refining • Throughput volumes vary by
refinery and are impacted by turnarounds – Detailed turnaround schedule provided through 2028E • Includes $35mm of asphalt / trucking EBITDA in 2023E; grown at 3% CAGR through 2028E • SG&A escalated annually at 2% •
Volumes forecasted to grow at 10% annually through 2028E • Marketing EBITDA forecast driven by rack uplift and credit card margin Marketing – Rack uplift margin and credit card margin held flat at $0.05/gal and $0.01/gal, respectively
• SG&A escalated annually at 2% • Forecast based on a bottoms-up build for each of DINO’s three RD units • Includes location-specific assumptions for (i) volume (ii) capture rate and (iii) opex – Artesia assumes
large throughput increase in 2024E (37%) and steady annual growth thereafter (~2%) – Cheyenne assumes large throughput increase in 2024E (21%) and flat volume thereafter Renewables – Parco assumes steady growth (~1.5% per year) through
the forecast – For all RD units, capture rate increases from 50% in 2023E to 70% in 2024E and 80% in 2025E and beyond • Opex escalates at varying rates around ~2% • SG&A escalated annually at 2% 15

PRELIMINARY WORKING DRAFT – SUBJECT TO FURTHER REVIEW AND
MODIFICATION Key Forecast Assumptions – DINO (Cont’d) • Forecast is derived from base oil and finished product margin • Base oil sales volume declines at 5% CAGR through the forecast period • Finished product volumes
increase at 1% CAGR, with declines in third-party finished volumes offset by internal volumes – Internal volumes grow at 10% annually through 2025E and 5% annually thereafter Lubricants • Capture rate held flat at 80% through the
forecast • Opex and SG&A escalates at 2% annually • McKinsey identified improvements increase EBITDA by $33mm in 2024E, $65mm in 2025E and $98mm thereafter – Additional detail requested in diligence • $44mm of
discretionary capex in 2023E and $100mm per year in 2024E and beyond – Assumes no credit for growth capex spend (subject to further diligence) Capital Program • Sustaining capex (excl. HEP) averages $737mm per year and includes
turnarounds – Detailed turnaround schedule has been provided • Certain add-backs to HEP Adjusted EBITDA are eliminated in consolidation (e.g., sales-type lease and tariff cash flow) • DINO to receive $2mm related to the UNEV class
B units in 2023E; no additional cash flow forecasted Other • SG&A is included at the segment level; unallocated portion of ~$40mm per year is listed separately • Pro forma synergies estimated at $4mm in 2023E and $5mm in 2024E;
escalated at 2% annually thereafter 16

PRELIMINARY WORKING DRAFT – SUBJECT TO FURTHER REVIEW AND
MODIFICATION Historical and Projected Gulf Coast 3-2-1 Crack Spread Reflects refinery crude yield based on two barrels of gasoline and one barrel of diesel for every three barrels of crude input Historical and Forecasted Yield ($/Bbl) 15 -'19 Avg.
2020A 2021A 2022A 2023 YTD 2023E 2024E 2025E $15.87 $9.02 $17.93 $36.79 $32.12 Historical Performance $70 DINO Forecast Assumptions $25.00 $22.00 $21.00 (1) Implied by Futures Markets $26.12 $22.40 $21.51 th April 20 , 2020 WTI crude closes at
(~$38) $60 $50 $40 Limited futures contracts data available after 2025 $30 $20.00 $20 (2) DINO’s Publicly-stated Mid-cycle Assumption: $14 $10 $0 Jan-15 Oct-17 Aug-20 May-23 Mar-26 Dec-28 Historical Performance DINO Forecast Assumptions
Implied by Futures Markets DINO Mid-Cycle Assumption Note: Market data as of June 21, 2023. (1) Reflects average of remaining days in 2023. 17 (2) Reflects Gulf Coast 3-2-1 of $10 plus Brent/WTI spread of $4. Source: Management guidance, FactSet,
CME Group.

PRELIMINARY WORKING DRAFT – SUBJECT TO FURTHER REVIEW AND
MODIFICATION DINO | Consolidated Financial Projection Summary (1) EBITDA ($mm) (2) Corp/Other: ($38) ($39) ($39) ($40) ($41) ($42) $4,620 $3,191 $2,886 $2,842 $2,602 $2,670 $2,661 $377 $391 $414 $395 $397 $428 $319 $441 $445 $360 $410 $75 $437
$1,307 $400 $395 $258 $361 $62 $2,395 $391 $1,798 $112 $1,685 $70 $1,328 $1,361 $100 $1,318 $79 $89 ($194) 2020A 2021A 2022A 2023E 2024E 2025E 2026E 2027E 2028E Refining Marketing Renewables Lubricants HEP Capex (incl. Turnarounds) ($mm) $1,020
$1,028 $946 $30 $887 $44 $851 $828 $42 $62 $42 $705 $44 $42 $682 $100 $10 $100 $100 $100 $425 $100 $936 $802 $745 $687 $689 $563 2020A 2021A 2022A 2023E 2024E 2025E 2026E 2027E 2028E DINO Sustaining DINO Discretionary HEP Discretionary HEP
Sustaining (3) Unlevered FCF ($mm) $3,938 $2,171 $2,000 $1,965 $1,896 $1,774 $1,810 $279 ($619) 2020A 2021A 2022A 2023E 2024E 2025E 2026E 2027E 2028E (1) Historical metrics are as presented by management. (2) Adjusted to reflect full consolidation
of HEP. 18 (3) Calculated as EBITDA less Capex (incl. Turnarounds). Source: Management, Company disclosure.

PRELIMINARY WORKING DRAFT – SUBJECT TO FURTHER REVIEW AND
MODIFICATION DINO | Consolidated Estimates Summary: 2023E – 2028E (1)(2) EBITDA ($mm) # of Brokers 11 10 4 2 1 0 $4,620 $3,473 $3,371 $3,191 $2,758 $2,994 $2,842 $2,602 $2,670 $2,886 $2,661 $2,666 $2,396 $2,228 $2,723 $2,018 $2,354 $2,096
$1,725 $1,808 2022A 2023E 2024E 2025E 2026E 2027E 2028E Capex ($mm) # of Brokers 3 3 2 1 1 0 $1,045 $1,020 $946 $1,019 $887 $920 $990 $851 $828 $879 $831 $808 $705 $757 $808 $682 $727 2022A 2023E 2024E 2025E 2026E 2027E 2028E Management Consensus
Broker Estimate Range Note: Market data as of June 21, 2023. (1) Historical metrics are as presented in the Management Presentation. 19 (2) 2023E Management EBITDA adjusted to fully consolidate HEP. Consensus and broker estimate ranges adjusted to
include ~53% of respective HEP EBITDA metrics. Source: Company disclosure, Management guidance, Wall Street research.

PRELIMINARY WORKING DRAFT – SUBJECT TO FURTHER REVIEW AND
MODIFICATION DINO | Turnaround Schedule Total Turnaround Duration (days) 382 382 45 45 35 35 62 62 253 45 44 44 49 49 74 154 152 (1) 42 45 45 45 37 29 34 27 27 42 36 34 75 75 55 47 39 2023E 2024E 2025E 2026E 2027E 2028E Puget Sound Navajo Woods
Cross El Dorado PCLI Parco Casper Tulsa 20 Source: Management guidance. (1) Duration for additional required turnaround has not been determined by management.

PRELIMINARY WORKING DRAFT – SUBJECT TO FURTHER REVIEW AND
MODIFICATION III. APPENDIX 21

PRELIMINARY WORKING DRAFT – SUBJECT TO FURTHER REVIEW AND
MODIFICATION HEP | Financial Forecast Detail '23E-'28E ($ in millions, except where noted) 1Q23A 2Q23E 3Q23E 4Q23E 2023E 2024E 2025E 2026E 2027E 2028E CAGR (+) Third Party Revenue $26 $29 $30 $33 $119 $128 $130 $132 $134 $137 2.9% (+) DINO Revenue
117 113 130 128 489 511 511 516 533 546 2.2% Total Revenue $143 $143 $160 $162 $608 $639 $641 $649 $667 $683 2.4% (-) Operating Expenses (52) (60) (59) (54) (224) (239) (247) (248) (250) (252) (-) Sales, General & Administrative (5) (5) (4) (4)
(18) (19) (20) (20) (20) (20) (1) (+) Other 1 2 3 4 10 14 17 17 17 17 Book EBITDA $88 $79 $101 $107 $375 $395 $391 $397 $414 $428 (+) Income from Sales-type Leases 20 23 23 23 89 89 87 87 87 87 (+) Tariffs -- 1 1 1 3 6 8 8 8 8 (-) Adjusted Operating
Expenses -- (3) (3) (3) (10) (13) (13) (13) (13) (13) (2) (+/-) Other 0 -- -- -- 0 -- -- -- -- -- Adjusted EBITDA $108 $100 $121 $128 $458 $477 $474 $480 $497 $511 2.2% (-) Maint. & Turnaround Capex (2) (7) (12) (9) (30) (44) (42) (42) (42) (62)
(-) Interest Expense (26) (24) (26) (23) (99) (84) (71) (60) (55) (50) (-) Tariffs -- (1) (1) (1) (3) (6) (8) (8) (8) (8) (+) Opex Adjustment -- 3 3 3 10 13 13 13 13 13 (-) Taxes (0) (0) (0) (0) (0) (1) (1) (1) (1) (1) (3) (+/-) Other 4 (2) (2) (2)
(3) (6) (5) (5) (5) (5) Distributable Cash Flow $84 $68 $84 $96 $332 $349 $360 $378 $400 $398 3.7% (-) Growth Capex (5) (3) (1) (1) (10) -- -- -- -- -- (+) Tariffs -- 1 1 1 3 6 8 8 8 8 (-) Changes in Net Working Capital (15) 25 (10) (5) (5) 6 (1)
(2) (2) (2) (4) (+/-) Other (7) 8 1 8 10 14 12 12 12 12 Levered Free Cash Flow $57 $100 $74 $99 $330 $375 $380 $397 $419 $417 Per Unit Metrics Distribution per Unit $0.35 $0.35 $0.35 $0.35 $1.40 $1.40 $1.40 $1.40 $1.40 $1.40 --% DCF per Unit $0.66
$0.54 $0.66 $0.76 $2.62 $2.76 $2.85 $2.98 $3.16 $3.15 3.7% Coverage 1.9x 1.5x 1.9x 2.2x 1.9x 2.0x 2.0x 2.1x 2.3x 2.2x Balance Sheet and Credit Metrics Cash $7 $15 $15 $15 $15 $15 $15 $118 $360 $600 Debt 1,540 1,492 1,462 1,408 1,408 1,209 1,006 889
889 889 Net Debt 1,533 1,477 1,447 1,393 1,393 1,194 991 771 529 289 Total Debt / LTM EBITDA 3.5x 3.4x 3.3x 3.1x 3.1x 2.5x 2.1x 1.9x 1.8x 1.7x Net Debt / LTM EBITDA 3.5x 3.4x 3.2x 3.0x 3.0x 2.5x 2.1x 1.6x 1.1x 0.6x (1) Reflects Equity in Earnings
from Join Ventures, Income Attributable to NCI and gains on asset sales. (2) Reflects adjustments to NCI. (3) Reflects reimbursables, stock-based compensation and other cash adjustments. 22 (4) Reflects other cash reconciling items. Source:
Management guidance.

PRELIMINARY WORKING DRAFT – SUBJECT TO FURTHER REVIEW AND
MODIFICATION DINO | Financial Forecast Detail Pricing Forecast 2023E 2024E 2025E 2026E 2027E 2028E ($ in millions, except where noted) WTI $/bbl $83.00 $80.00 $78.00 $78.00 $78.00 $78.00 Gulf Coast WTI 3-2-1 $/bbl 25.00 22.00 21.00 20.00 20.00 20.00
Renewable Diesel Indicator $/gal $1.74 $1.95 $2.14 $2.24 $2.24 $2.24 VGO Based Base Oil Crack Group I $/bbl $40.00 $33.00 $25.00 $24.00 $24.00 $24.00 Group II $/bbl 45.00 36.00 28.00 27.00 27.00 27.00 Group III $/bbl 130.00 120.00 110.00 100.00
100.00 100.00 Marketing Rack Uplift Margin $/gal $0.05 $0.05 $0.05 $0.05 $0.05 $0.05 Gross Margin 2023E 2024E 2025E 2026E 2027E 2028E Refining $4,409 $3,852 $3,780 $3,465 $3,540 $3,542 Marketing 85 94 103 114 125 138 Renewables 213 399 506 538 545
553 Lubricants 763 813 872 908 922 935 Total Gross Margin $5,471 $5,158 $5,261 $5,025 $5,133 $5,168 Opex (2,215) (2,260) (2,305) (2,351) (2,398) (2,446) SG&A (404) (412) (421) (429) (438) (446) Corporate, Other & Eliminations EBITDA (38)
(39) (39) (40) (41) (42) DINO EBITDA Excluding HEP $2,814 $2,447 $2,495 $2,204 $2,256 $2,233 HEP Book EBITDA $375 $395 $391 $397 $414 $428 DINO Adds Back UNEV Class B NCI 2 -- -- -- -- -- HEP EBITDA $377 $395 $391 $397 $414 $428 DINO Consolidated
EBITDA $3,191 $2,842 $2,886 $2,602 $2,670 $2,661 EBITDA by Segment Refining $2,395 $1,798 $1,685 $1,328 $1,361 $1,318 Marketing 62 70 79 89 100 112 Renewables 75 258 361 391 395 400 Lubricants 319 360 410 437 441 445 HEP 377 395 391 397 414 428 (-)
Corporate, Other & Eliminations (38) (39) (39) (40) (41) (42) Consolidated EBITDA $3,191 $2,842 $2,886 $2,602 $2,670 $2,661 Capex by Segment DINO Discretionary $44 $100 $100 $100 $100 $100 DINO Sustaining 936 802 745 687 563 689 DINO Total Capex
980 902 845 787 663 789 HEP Discretionary 10 -- -- -- -- -- HEP Sustaining 30 44 42 42 42 62 (1) DINO Consolidated Capex $1,020 $946 $887 $828 $705 $851 (1) Capex includes turnaround capital. 23 Source: Management guidance.

PRELIMINARY WORKING DRAFT – SUBJECT TO FURTHER REVIEW AND
MODIFICATION Comparison of Management vs. Consensus | DINO Refining Refining Throughput (kb/d) Gross Refining Margin ($/bbl) # of Brokers 5 5 3 2 2 0 # of Brokers 8 8 5 3 3 1 680 684 677 $26.78 667 661 659 665 659 659 659 $21.10 647 657 $19.38 643
631 647 647 647 $19.33 633 $16.84 620 635 $15.23 $15.23 $15.23 $15.23 $16.47 $17.95 618 $15.57 $14.56 $15.14 $14.60 $13.41 $13.69 $14.52 $13.61 608 $12.51 $12.60 $12.42 $10.54 2022A 2023E 2024E 2025E 2026E 2027E 2028E 2022A 2023E 2024E 2025E 2026E
2027E 2028E Refining Opex ($/bbl) Refining EBITDA ($mm) # of Brokers 6 6 4 2 1 1 # of Brokers 2 2 2 1 1 0 $8.98 $8.63 $8.63 $8.65 $8.60 $4,179 $8.46 $7.96 $8.18 $8.15 $7.69 $8.02 $7.83 $7.75 $8.29 $7.45 $7.39 $7.43 $6.70 $6.18 $6.25 $6.22 $2,222
$2,395 $2,037 $1,684 $1,615 $1,798 $1,685 $1,328 $1,318 $1,361 $1,591 $1,853 $1,399 $1,497 $883 $794 $1,183 2022A 2023E 2024E 2025E 2026E 2027E 2028E 2022A 2023E 2024E 2025E 2026E 2027E 2028E Management Consensus Broker Estimate Range 24 Note:
Market data as of June 21, 2023. Source: Bloomberg, Management guidance.

PRELIMINARY WORKING DRAFT – SUBJECT TO FURTHER REVIEW AND
MODIFICATION Segment Detail – DINO Refining (West Region) Key Takeaways Crack Spread – West Indicator ($/Bbl) $56.68 • The charts to the right compare the key forecast drivers for the West $45.16 Region refineries vs. historical
$33.65 results $31.15 $30.42 $30.64 $29.62 $28.62 $28.62 $28.63 $37.07 – Includes five refineries (Puget $26.99 $26.50 $19.52 Sound, Navajo, Parco, Woods $25.38 $18.18 Cross, Casper) and represents $21.61 $15.99 62% of DINO’s total
refining capacity – Further diligence required to 2019A 2020A 2021A 2022A 2023E 2024E 2025E 2026E 2027E 2028E confirm historical calculations are comparable to projections Capture Rate (%) • West Indicator: WTI-based 3-2-1 Mid-cycle
capture rate (DINO Investor Presentation) crack spread benchmark specific to DINO’s West Region refineries, as 76% 78% 78% 78% 78% 78% 78% 69% publicly calculated and reported 64% 66% monthly by DINO 64% 53% 70% 60% – Reflects regional
pricing of 59% 50% 59% 57% gasoline and diesel 48% – Excludes impact of RINs – Long-term, mid-cycle assumption of ~$29/Bbl is within historical range, but 2019A 2020A 2021A 2022A 2023E 2024E 2025E 2026E 2027E 2028E ~19% higher than 2019A
• Capture Rate: Ratio of (i) realized Throughput (MBbls/d) & Utilization (%) gross margin to (ii) benchmark Mid-cycle utilization (DINO Investor Presentation) crack spread 89% 81% 86% 83% 94% – Projected levels are above 70% 376 90%
90% 90% 88% 88% 85% “mid-cycle” levels in DINO 347 public investor presentations 340 – 78% capture rate has not been consistently achieved since 2019 158 149 375 375 375 367 370 357 120 155 • Utilization: Ratio of (i) crude
138 114 148 charge to (ii) refinery capacity 129 111 – Projected utilization is above historical performance 2015-2019 2020A 2021A 2022A 2023E 2024E 2025E 2026E 2027E 2028E th th (1) Historical Range (25 – 75 Percentile) Average 25 (1)
Based on quarterly data, except crack spread data, which is monthly. Source: Management guidance, Public disclosure.

PRELIMINARY WORKING DRAFT – SUBJECT TO FURTHER REVIEW AND
MODIFICATION Segment Detail – DINO Refining (MidCon Region) Key Takeaways Crack Spread – MidCon Indicator ($/Bbl) • The charts to the right compare the key forecast drivers for the $41.05 MidCon Region refineries vs. historical
results $33.18 – Includes two refineries (El $25.85 $20.19 $22.86 $21.86 $19.22 $20.88 $20.86 $20.86 Dorado and Tulsa) and represents 38% of DINO’s total $17.81 $23.47 $16.03 $8.72 refining capacity $15.59 $8.57 $13.24 – Further
diligence required to $7.55 confirm historical calculations 2015 - 2019 2020A 2021A 2022A 2023E 2024E 2025E 2026E 2027E 2028E are comparable to projections • MidCon Indicator: WTI-based Capture Rate (%) 3-2-1 crack spread benchmark specific to
DINO’s MidCon Mid-cycle capture rate (DINO Investor Presentation) 85% 82% Region refineries, as publicly 75% 75% 75% 75% 75% 75% 69% calculated and reported monthly by 75% 59% 70% DINO 64% 59% – Reflects regional pricing of 64% 62% 51%
gasoline and diesel – Excludes impact of RINs 41% 36% – Long-term, mid-cycle assumption of ~$21/Bbl is within historical range, but 2015 - 2019 2020A 2021A 2022A 2023E 2024E 2025E 2026E 2027E 2028E ~30% higher than 2015-2019 average
Throughput (MBbls/d) & Utilization (%) • Capture Rate: Ratio of (i) realized gross margin to (ii) benchmark crack spread Mid-cycle utilization (DINO Investor Presentation) 109% 100% – Projected levels are above 70% 99% 93% 305 294
“mid-cycle” levels in DINO 109% 109% 109% 293 273 105% 102% 101% 299 public investor presentations 276 274 257 294 – 75% capture rate has not been 273 94% 252 248 consistently achieved since 2019 283 283 283 266 273 262 •
Utilization: Ratio of (i) crude charge to (ii) refinery capacity – Projected utilization is above historical performance 2015 - 2019 2020A 2021A 2022A 2023E 2024E 2025E 2026E 2027E 2028E th th (1) Historical Range (25 – 75 Percentile)
Average 26 (1) Based on quarterly data, except crack spread data, which is monthly. Source: Management guidance, Public disclosure.

PRELIMINARY WORKING DRAFT – SUBJECT TO FURTHER REVIEW AND
MODIFICATION Segment Detail – DINO Lubricants Key Takeaways VGO Based Base Oil Crack – Group 1 ($/Bbl) $114 • Lubricants cracks experienced dramatic $91 volatility coming out of $65 COVID in 2021 and 2022 $73 $54 $40 $32 $26 $33
• Long-term projections for $43 $25 $24 $24 $24 $22 $21 Group 1 and 2 are largely $13 $10 within pre-COVID ranges '17-'19 Avg. 2020A 2021A 2022A 2023E 2024E 2025E 2026E 2027E 2028E • Group 3 cracks are projected to remain above VGO Based
Base Oil Crack – Group 2 ($/Bbl) pre-2021 $122 $97 $76 $75 $60 $45 $34 $36 $28 $28 $27 $27 $27 $44 $21 $20 $14 $8 '17-'19 Avg. 2020A 2021A 2022A 2023E 2024E 2025E 2026E 2027E 2028E VGO Based Base Oil Crack – Group 3 ($/Bbl) $169 $146
$141 $130 $120 $129 $110 $100 $100 $100 $125 $115 $69 $54 $59 $50 $51 $44 '17-'19 Avg. 2020A 2021A 2022A 2023E 2024E 2025E 2026E 2027E 2028E th th (1) 25 – 75 Percentile Average 27 (1) Based on monthly data. Source: Management guidance, Public
disclosure.

PRELIMINARY WORKING DRAFT – SUBJECT TO FURTHER REVIEW AND
MODIFICATION Segment Detail – DINO Lubricants (Cont’d) Key Takeaways Volume (Kbpd) th th (1) 25 – 75 Percentile Average • Management forecasts growing EBITDA despite 35.5 34.4 34.3 34.7 decreasing volumes 34.0 32.7 32.5 31.0
• Projections include 32.4 31.9 31.6 30.4 26.3 26.2 26.3 26.1 25.8 25.5 separate EBITDA add- back for “McKinsey Identified Improvements” – Represents > 20% of forecasted EBITDA by 2028E – McKinsey adjustments are
subject to further 2016 - 2019 2020A 2021A 2022A 2023E 2024E 2025E 2026E 2027E 2028E diligence EBITDA ($mm) McKinsey Identified Improvements $445 $441 $437 $410 $383 $360 $98 $98 $98 $65 $331 $319 $33 $157 $345 $343 $348 $134 $339 $328 2016 - 2019
2020A 2021A 2022A 2023E 2024E 2025E 2026E 2027E 2028E 28 (1) Based on quarterly data. Source: Management guidance, Public disclosure.

PRELIMINARY WORKING DRAFT – SUBJECT TO FURTHER REVIEW AND
MODIFICATION Comparison of Management vs. Consensus | DINO Lubricants Lubricants & Specialty Products Segment EBITDA ($mm) # of Brokers 3 3 2 0 0 0 $445 $441 $437 $410 $383 $360 $331 $325 $319 $300 $299 $306 $290 $282 $280 February 2019: $266
$266 Acquired Sonneborn for $655mm at a 9.9x multiple (7.7x incl. synergies) $157 $122 $121 2018A 2019A 2020A 2021A 2022A 2023E 2024E 2025E 2026E 2027E 2028E Management Consensus Broker Estimate Range 29 Note: Market data as of June 21, 2023.
Source: Bloomberg, Enverus, Management guidance.

PRELIMINARY WORKING DRAFT – SUBJECT TO FURTHER REVIEW AND
MODIFICATION Segment Detail – DINO Renewables Key Takeaways Renewable Diesel Indicator ($/Bbl) • Large step-change in EBITDA forecasted in $2.24 $2.24 $2.24 $2.14 $2.02 $1.95 2024E $1.74 $1.78 – Driven by a combination of volume,
capture rate $1.40 and improved profitability from exhaustion of legacy 2022A 2023E 2024E 2025E 2026E 2027E 2028E high-priced feedstocks Volume (MMgal) • Capture rate estimated at 304 309 296 300 292 50% in 2023E, 70% in 245 2024E and 80% in
2025E and beyond 136 2022A 2023E 2024E 2025E 2026E 2027E 2028E EBITDA ($mm) $391 $395 $400 $361 $258 $75 ($74) 2022A 2023E 2024E 2025E 2026E 2027E 2028E th th (1) 25 – 75 Percentile Average 30 (1) Based on monthly data. Source: Management
guidance, Public disclosure.

PRELIMINARY WORKING DRAFT – SUBJECT TO FURTHER REVIEW AND
MODIFICATION Comparison of Management vs. Consensus | DINO Renewables Renewable Segment EBITDA ($mm) # of Brokers 4 4 3 1 1 1 $400 $395 $391 $361 $268 $265 $258 $263 $261 $262 $211 $195 $103 $107 $75 $57 $45 $34 ($74) 2022A 2023E 2024E 2025E 2026E
2027E 2028E Management Consensus Broker Estimate Range 31 Note: Market data as of June 21, 2023. Source: Bloomberg, Management guidance.

PRELIMINARY WORKING DRAFT – SUBJECT TO FURTHER REVIEW AND
MODIFICATION Segment Detail – DINO Marketing Key Takeaways Volume (MMgal) 2,318 • Volumes are forecasted to 2,108 grow at 10% annually 1,916 1,742 1,583 – Management indicated 1,439 1,118 the additional volume could come from a mix
of NTIs and market share gains • Rack uplift and credit card 2022A 2023E 2024E 2025E 2026E 2027E 2028E margins are held flat Gross Margin ($mm) $138 $125 $114 $103 $94 $85 $66 2022A 2023E 2024E 2025E 2026E 2027E 2028E EBITDA ($mm) $112 $100
$89 $79 $70 $63 $62 2022A 2023E 2024E 2025E 2026E 2027E 2028E 32 Source: Management guidance, Company disclosure.

PRELIMINARY WORKING DRAFT – SUBJECT TO FURTHER REVIEW AND
MODIFICATION Key Forecast Assumptions – DINO Commodity Price Assumptions Refining 2023E 2024E 2025E 2026E 2027E 2028E WTI $/bbl $83.00 $80.00 $78.00 $78.00 $78.00 $78.00 Gulf Coast WTI 3-2-1 $/bbl 25.00 22.00 21.00 20.00 20.00 20.00 D6 RIN
$/RIN 1.43 1.65 1.69 1.78 1.78 1.78 D5 RIN $/RIN 1.51 1.73 1.78 1.87 1.87 1.87 3-2-1 RIN Cost $/bbl $5.06 $5.83 $5.98 $6.29 $6.29 $6.29 Gulf Coast WTI 3-2-1, net RINs $/bbl $19.94 $16.17 $15.02 $13.71 $13.71 $13.71 Renewables 2023E 2024E 2025E 2026E
2027E 2028E BOHO Spread $/gal ($2.31) ($2.64) ($2.72) ($2.85) ($2.85) ($2.85) D4 RIN $/RIN 1.54 1.76 1.81 1.90 1.90 1.90 LCFS $/t 100.00 140.00 180.00 200.00 200.00 200.00 BTC / PTC $/gal 1.00 1.00 1.00 1.00 1.00 1.00 Renewable Diesel Indicator
$/gal $1.74 $1.95 $2.14 $2.24 $2.24 $2.24 Lubricants 2023E 2024E 2025E 2026E 2027E 2028E VGO Based Base Oil Crack Group I $/bbl $40.00 $33.00 $25.00 $24.00 $24.00 $24.00 Group II $/bbl 45.00 36.00 28.00 27.00 27.00 27.00 Group III $/bbl 130.00
120.00 110.00 100.00 100.00 100.00 Base Oil Crack $/bbl $59.59 $51.26 $42.87 $40.09 $40.09 $40.09 33 Source: Management guidance.

PRELIMINARY WORKING DRAFT – SUBJECT TO FURTHER REVIEW AND
MODIFICATION Disclaimer These materials have been prepared by Intrepid Partners, LLC (“Intrepid”) for the Conflicts Committee (the “Committee”) of the Board of Directors of Holly Logistic Services, L.L.C. (the “General
Partner”), the ultimate general partner of Holly Energy Partners, L.P. (“HEP”), to whom such materials are directly addressed and delivered. These materials are confidential and may not be used or relied upon by any other person or
for any purpose other than as specifically contemplated by a written agreement with Intrepid. These materials have been developed by and are proprietary to Intrepid and were prepared exclusively for the benefit and internal use of the Committee in
connection with evaluating the Proposed Transaction with HEP and HF Sinclair Corporation (“DINO”). These materials are based upon information provided by or on behalf of the management of DINO and the General Partner, from public
sources, or otherwise reviewed by Intrepid. Intrepid has relied upon and assumes no responsibility for independent investigation or verification of such information and has relied upon such information being complete and accurate in all material
respects. To the extent such information includes estimates and forecasts of future performance prepared by or reviewed with management of DINO or the General Partner and/or other potential transaction participants or obtained from public sources,
Intrepid has assumed that such estimates and forecasts have been reasonably prepared on bases reflecting the best currently available estimates and judgments of management of DINO, and the General Partner or such other potential transaction
participants (or, with respect to estimates and forecasts obtained from public sources, represent reasonable estimates). Actual results may differ materially from such estimates and forecasts. No representation or warranty, express or implied, is
made as to the accuracy or completeness of such information, and nothing contained herein is, or shall be relied upon as, a representation or warranty, whether as to the past, the present or the future. The materials and related commentary are not
intended to provide the only basis for evaluating, and should not be considered a recommendation with respect to, the consideration paid, the proposed transaction or any transaction or other matter. These materials are also subject to the
qualifications and limitations described in any accompanying written opinion letter. These materials were compiled on a confidential basis solely for use by the Committee and may not be relied on by any other party (including stakeholders in either
entity), even if such parties are provided a copy of these materials. These materials were prepared without a view to public disclosure or filing thereof under state or federal laws, and may not be redistributed, reproduced, distributed, passed to
others, transmitted, quoted or referred to, in whole or in part, without the prior written permission of Intrepid in accordance with the terms of our engagement letter with the Committee. These materials speak only as of the date on the cover and
Intrepid assumes no obligation to update these materials or inform any recipient of changed circumstances, events or information. These materials were prepared for a specific use by specific persons and were not prepared to conform with any
disclosure standards under securities laws or otherwise. In the ordinary course of its business, each of Intrepid and its affiliates may actively trade or hold the securities of DINO, HEP or other parties involved in a proposed transaction for its
own account or for the account of its customers and, accordingly, may at any time hold a long or short position in such securities. Intrepid will receive a fee in connection with delivery of an opinion relating to the proposed transaction. These
materials do not constitute, nor do they form part of, an offer or solicitation to sell or purchase any securities or instruments and are not a commitment by Intrepid or any of its affiliates to provide, arrange or underwrite any financing for any
transaction or to purchase any security in connection therewith. These materials may not reflect information known to other professionals in other business areas of Intrepid and its affiliates. Intrepid and its affiliates do not provide legal,
regulatory, accounting, bankruptcy, securities or tax advice. Any statements contained herein as to tax matters were neither written nor intended by Intrepid or its affiliates to be used and cannot be used by any taxpayer for the purpose of avoiding
tax penalties that may be imposed on such taxpayer. Each person should seek legal, regulatory accounting and tax advice based on his, her or its particular circumstances from independent advisors regarding the evaluation and impact of any
transactions or matters described herein.

PR PRELIM ELIMINAR INARY Y WOR WORKING KING DRAF DRAFT T – –
SUBJECT SUBJECT TO TO FUR FURTHE THER REV R REVIEW IEW AND AND MOD MODIFICAT IFICATION ION Exhibit (c)(3)(C) PROJECT APPLE DISCUSSION MATERIALS July 13, 2023

PRELIMINARY WORKING DRAFT – SUBJECT TO FURTHER REVIEW AND
MODIFICATION Table of Contents I. Summary of Management’s Financial Projections 5 II. Preliminary Valuation Analysis 10 III. Illustrative Sensitivity Analysis 14 IV. Evaluation of the Proposal 18 V. Proposed Next Steps 27 VI. Appendix 29
1

PRELIMINARY WORKING DRAFT – SUBJECT TO FURTHER REVIEW AND
MODIFICATION Executive Summary ▪ Intrepid has prepared the following materials for the Conflicts Committee of the Board of Directors of Holly Logistic Services, L.L.C. (the “Committee”), the ultimate general partner of Holly Energy
Partners, L.P. ( “HEP”), regarding the proposed acquisition of all the common units representing limited partner interests in HEP not already owned by HF Sinclair Corporation (“DINO”) (the “Proposed Transaction”)
– DINO currently owns 59.6 million HEP common units (47.1% of the fully-diluted common units outstanding) and the non- economic general partner of HEP – The unaffiliated unitholders own 67.0 million HEP common units (~$1.1bn of equity
value at the unaffected unit price of $15.92) ▪ Prior to market open on May 4, 2023, HEP announced the receipt of a non-binding proposal from DINO to acquire all of the outstanding common units of HEP not beneficially owned by DINO (the
“Proposal”) – The Proposal offered consideration of 0.3714 newly-issued DINO common shares for each HEP common unit – Equates to 11% pro forma ownership for legacy HEP unitholders – The Proposal implied an “at
market” offer based on HEP’s and DINO’s unaffected 30-day VWAP prices and a ~2% discount based on closing prices as of the unaffected date ▪ Since receipt of the Proposal, Intrepid and Gibson Dunn have conducted extensive due
diligence on both HEP and DINO, including a review of the assets, the financial forecast and other documents/information provided in the virtual data room and via DINO’s advisors ▪ The materials herein include: – A summary of
HEP’s and DINO’s projections, along with certain sensitivity analyses – A preliminary valuation analysis of HEP and DINO – An evaluation of the Proposal and potential counterproposal considerations – Proposed next steps
– Supplemental analyses in the appendix 2

PRELIMINARY WORKING DRAFT – SUBJECT TO FURTHER REVIEW AND
MODIFICATION Executive Summary (continued) ▪ HEP has traded up ~17.2% (from $15.92 to $18.66) since receipt of the Proposal – LT&S peers have traded up ~14% – Research analysts have revised one-year forward target prices to $17
– $20 ▪ DINO’s proposed exchange ratio of 0.3714 implies $16.81 per HEP unit, which implies a ~10% discount to HEP’s current unit price – Prior to the receipt of the proposal, the year-to-date HEP/DINO exchange ratio
ranged from 0.3315x to 0.3929x and the 1-year VWAP exchange ratio averaged 0.3475x ▪ Every 0.025x of exchange ratio equates to ~$76mm of value ($1.13/unit) to HEP’s unaffiliated unitholders; HEP’s unaffiliated unitholders will
experience dilution to their LQA distribution of $1.40/unit (DINO yields 4.0%; HEP yields 7.5%) ▪ While management has put forth reasonable projection estimates, it is important to understand the potential value impact (+ or -) of the
sensitivities discussed herein – Requesting cash as a component of the transaction consideration can de-risk future underperformance/volatility, but also can diminish outperformance/upside value 3 Note: Market data as of July 10, 2023.
LT&S peers include NS, DKL and PAA. Source: FactSet, public disclosure.

PRELIMINARY WORKING DRAFT – SUBJECT TO FURTHER REVIEW AND
MODIFICATION Market Performance and Implied Proposal | “Then” vs. “Now” 5/3/23 (“Then”) 7/10/23 (“Now”) Change (%) $41.91 $45.27 +8.0% DINO Unit Price HEP Unit Price $15.92 $18.66 +17.2% 0.3799x
0.4122x +8.5% Spot Exchange Ratio Prem. / Disc. of Proposal to Spot XR (2.2%) (9.9%) Prem. / Disc. of Proposal to Unaff. 30-d VWAP XR (0.1%) Implied Value at Proposal (0.3714x) $15.57 $16.81 +8.0% Prem. / Disc. vs. HEP Price (2.2%) (9.9%) (2.2%)
+5.6% Prem. / Disc. vs. Unaff. HEP price HEP Peers | LT&S +14.1% (4.8%) HEP Peers | Small Cap. DINO Peers | Large Cap. +5.6% +16.7% DINO Peers | SMID Cap. Note: Market data as of July 10, 2023. LT&S Peers include: DKL, NS, PAA. Small Cap.
MLP peers include CAPL, GEL, GLP. Large Cap. Refining peers include MPC, PSX, VLO. SMID Cap. Refining peers 4 include CVI, DK, PARR, PBF, VTNR. Source: FactSet, public disclosure. Peer Trading Perf.

PRELIMINARY WORKING DRAFT – SUBJECT TO FURTHER REVIEW AND
MODIFICATION I. SUMMARY OF MANAGEMENT’S FINANCIAL PROJECTIONS 5

PRELIMINARY WORKING DRAFT – SUBJECT TO FURTHER REVIEW AND
MODIFICATION HEP | Summary of Management’s Financial Projections Adjusted EBITDA and Distributable Cash Flow ($mm) Capex ($mm) ’23E – ’28E EBITDA CAGR: 2.2% ’23E – ’28E DCF CAGR: 3.7% $511 $497 $477 $480
$474 $77 $458 $415 $62 $25 $400 $44 $398 $42 $42 $42 $41 $378 $30 $360 $349 $21 $0 $332 $10 $10 $10 $10 $307 $10 $3 $31 $31 $32 $32 $32 $32 $30 2022A 2023E 2024E 2025E 2026E 2027E 2028E 2022A 2023E 2024E 2025E 2026E 2027E 2028E Maintenance Capex
Growth & JV Investment Adjusted EBITDA Distributable Cash Flow Turnaround Capital MidCon Capital DPU ($/unit) and Coverage (x) Leverage – End of Period (x) 3.8x 2.1x 2.3x 2.2x 2.0x 2.0x 1.9x 3.1x 1.7x 2.5x $1.40 $1.40 $1.40 $1.40 $1.40
$1.40 $1.40 2.1x 1.9x 1.8x 1.7x 3.7x 3.0x 2.5x 2.1x 1.6x 1.1x 0.6x 2022A 2023E 2024E 2025E 2026E 2027E 2028E 2022A 2023E 2024E 2025E 2026E 2027E 2028E Gross Leverage Net Leverage Distribution Per Unit Coverage 6 Source: Management guidance, public
disclosure.

PRELIMINARY WORKING DRAFT – SUBJECT TO FURTHER REVIEW AND
MODIFICATION HEP | Management vs. Research Estimates Summary Adjusted EBITDA ($mm) Distributable Cash Flow ($mm) # of Brokers 3 3 2 0 0 0 # of Brokers 2 2 0 0 0 0 $511 $497 $480 $480 $400 $475 $398 $460 $477 $474 $378 $458 $360 $463 $466 $356 $447
$415 $457 $336 $448 $349 $435 $332 $307 $313 $313 $289 $271 2022A 2023E 2024E 2025E 2026E 2027E 2028E 2022A 2023E 2024E 2025E 2026E 2027E 2028E (1) Total Capex ($mm) Distribution per Unit ($/unit) # of Brokers 2 2 0 0 0 0 # of Brokers 2 2 1 1 1 1
Includes $30mm of Turnaround Capital $77 $1.81 $1.66 Includes $25mm of $1.73 $1.58 $1.51 $1.65 $1.63 Turnaround Capital $62 $1.40 $1.49 $1.60 $1.46 $1.40 $1.40 $1.40 $1.40 $1.40 $1.40 $40 $1.40 $1.40 $42 $42 $42 $38 $44 $41 $39 $36 $35 $38 2022A
2023E 2024E 2025E 2026E 2027E 2028E 2022A 2023E 2024E 2025E 2026E 2027E 2028E Management Consensus Broker Estimate Range Note: Market data as of July 10, 2023. 7 (1) Includes maintenance capex, growth capex and turnaround capital. Source: Company
disclosure, Management guidance, Wall Street research.

PRELIMINARY WORKING DRAFT – SUBJECT TO FURTHER REVIEW AND
MODIFICATION DINO | Summary of Management’s Consolidated Financial Projections (1) Management Consolidated EBITDA vs. Research Estimates ($mm) # of Brokers 11 10 4 2 1 0 $4,620 $3,473 $3,371 $2,886 $3,191 $2,842 $2,661 $2,670 $2,602 $2,994
$2,758 $2,666 $2,396 $2,228 $2,723 $2,018 $1,307 $2,354 $2,096 $1,808 $1,725 ($194) 2020A 2021A 2022A 2023E 2024E 2025E 2026E 2027E 2028E Management Consolidated EBITDA by Segment ($mm) (2) Corp/Other: ($38) ($39) ($39) ($40) ($41) ($42) $4,620
$3,191 $2,886 $2,842 $2,670 $2,661 $377 $2,602 $391 $395 $414 $397 $319 $428 $410 $360 $75 $441 $445 $437 $1,307 $62 $258 $361 $391 $395 $400 $2,395 $70 $79 $1,798 $1,685 $1,328 $1,361 $1,318 $89 $100 $112 ($194) 2020A 2021A 2022A 2023E 2024E 2025E
2026E 2027E 2028E Refining Marketing Renewables Lubricants HEP (3) Management Consolidated Unlevered FCF ($mm) Capex: ($425) ($1,028) ($682) ($1,020) ($946) ($887) ($828) ($705) ($851) $3,938 $2,171 $2,000 $1,965 $1,896 $1,774 $1,810 $279 ($619)
2020A 2021A 2022A 2023E 2024E 2025E 2026E 2027E 2028E (1) Historical metrics are as presented by management. Consensus and broker estimate ranges adjusted to (3) Calculated as EBITDA less Capex (incl. Turnarounds). 8 include ~53% of respective HEP
EBITDA metrics. Source: Management, Company disclosure. (2) Adjusted to reflect full consolidation of HEP.

PRELIMINARY WORKING DRAFT – SUBJECT TO FURTHER REVIEW AND
MODIFICATION DINO | Management vs. Research Estimates Summary Refining Segment EBITDA ($mm) # of Brokers 7 6 4 2 1 0 $4,179 $2,380 $2,395 $1,939 $1,790 $1,790 $1,798 $2,158 $1,685 $1,723 $1,662 $1,361 $1,328 $1,318 $1,309 $1,354 $1,261 $1,036 $641
$733 2022A 2023E 2024E 2025E 2026E 2027E 2028E Lubricants & Specialty Products Segment EBITDA ($mm) # of Brokers 6 6 4 2 1 0 $456 $452 $396 $441 $445 $437 $383 $410 $337 $360 $355 $339 $319 $293 $315 $331 $254 $254 $250 $250 2022A 2023E 2024E
2025E 2026E 2027E 2028E Renewable Segment EBITDA ($mm) # of Brokers 6 6 4 2 1 0 $400 $391 $395 $320 $361 $313 $301 $272 $258 $225 $222 $197 $131 $91 $150 $150 $112 $75 $18 ($74) 2022A 2023E 2024E 2025E 2026E 2027E 2028E Management Case Consensus
Wall Street Research 9 Note: For select broker reports, EBITDA is interpolated from segment EBIT. Source: Management projections, Wall Street research.

PRELIMINARY WORKING DRAFT – SUBJECT TO FURTHER REVIEW AND
MODIFICATION II. PRELIMINARY VALUATION ANALYSIS 10

PRELIMINARY WORKING DRAFT – SUBJECT TO FURTHER REVIEW AND
MODIFICATION HEP | Preliminary Valuation Analysis (1) Methodology Metric Reference Range Implied Unit Price ($) Unaffected 52-Week Trading Range Unaffected: $15.92 $15.66 $20.00 Trading Range Low (7/6/22) – High (6/6/22) (2) Implied Proposal:
$16.81 (3) Unaffected Unit Price Target Range $18.00 $23.00 (Low – Median – High) $20.00 Wall Street Current: $18.66 Research (3) Post-Announcement Unit Price Target Range $17.00 $20.00 (Low – Median – High) $18.00 Discounted
WACC: 10.25% – 8.50% PV of Unlevered FCF $20.86 $26.94 Cash Flow Term. Mult.: 7.25x – 8.75x Distribution Ke: 13.00% – 8.75% PV of LP DPU $13.54 $18.77 Discount Model Term. Yield: 9.00% – 7.00% Trading (4) Range of Metrics
Various $15.48 $20.41 Comparables Precedent (4) Range of Metrics Various $18.11 $23.58 Transactions Precedent Unaffected Close: 10% – 25% $17.51 $19.90 Premiums Paid $15.92 $5 $10 $15 $20 $25 $30 $35 Note: Market data as of July 10, 2023. (1)
Based on $1,477mm of net debt as of June 30, 2023E, per Management estimates. (2) Based on current DINO share price and 0.3714x exchange ratio. (3) Forward target price. 11 (4) Reflects average low and average high implied unit price. Source:
Management projections, Wall Street research, Bloomberg, FactSet. For Reference Only

PRELIMINARY WORKING DRAFT – SUBJECT TO FURTHER REVIEW AND
MODIFICATION DINO | Preliminary Valuation Analysis Methodology Metric Reference Range Implied Share Price ($) Unaffected: $41.91 Unaffected 52-Week Trading Range $41.63 $65.61 Trading Range Current: $45.27 Low (5/2/22) – High (11/22/22) (1)
Unaffected Unit Price Target Range $50.00 $73.00 (Low – Median – High) $58.00 Wall Street Research (1) Post-Announcement Unit Price Target Range $40.00 $62.00 (Low – Median – High) $57.00 Discounted WACC: 10.25% – 9.00%
(2) PV of Unlevered FCF $52.35 $64.18 Cash Flow Term. Mult.: 4.5x – 5.5x Trading (3) Range of Metrics Various $41.70 $57.34 Comparables $0 $20 $40 $60 $80 Note: Market data as of July 10, 2023. (1) Forward target price. (2) Based on $1,700mm
of net debt as of June 30, 2023E and NCI based on midpoint of HEP DCF analysis. 12 (3) Reflects average low and average high implied unit price; based on $1,700mm of net debt as of June 30, 2023E and NCI based on HEP’s current unit price.
Source: Management projections, Wall Street research, Bloomberg. For Reference Only

PRELIMINARY WORKING DRAFT – SUBJECT TO FURTHER REVIEW AND
MODIFICATION Exchange Ratio Analysis Methodology Implied HEP Unit Price Implied DINO Share Price Implied Exchange Ratio HEP/DINO Proposal: 0.3714x Market Trading Unaffected 52-Week Low (11/15/22) – High (5/3/22) 0.2850x 0.4378x Exchange Ratio
Current: 0.4122x Wall Street Research $18.00 – $23.00 $50.00 – $73.00 0.2466x 0.4600x 0.3448x (Unaffected) Wall Street $17.00 – $20.00 $40.00 – $62.00 Research (Post- 0.2742x 0.5000x 0.3158x Announcement) Trading $15.48
– $20.41 $41.70 – $57.34 0.2700x 0.4894x Comparables Discounted Cash $20.86 – $26.94 $52.35 – $64.18 0.3249x 0.5146x Flow (1) Precedent $18.11 – $23.58 $41.70 – $57.34 0.3159x 0.5655x Transactions Precedent
Unaffected Exchange Ratio (0.3799x): 0.4178x 0.4748x Premiums Paid 10% – 25% Premium 0.0000x 0.2000x 0.4000x 0.6000x 0.8000x Note: Market data as of July 10, 2023. 13 (1) DINO share price range based on comparable company trading range.
Source: Management guidance, FactSet, Bloomberg. For Reference Only

PRELIMINARY WORKING DRAFT – SUBJECT TO FURTHER REVIEW AND
MODIFICATION III. ILLUSTRATIVE SENSITIVITY ANALYSIS 14

PRELIMINARY WORKING DRAFT – SUBJECT TO FURTHER REVIEW AND
MODIFICATION Summary of Illustrative Sensitivity Analyses At the Committee’s request, Intrepid performed illustrative sensitivity analyses Description ▪ MidCon region utilization is over 100% throughout the entire forecast period ▪
West region utilization increases from 85% to 90% by 2027E and held flat thereafter Utilization (1) ▪ Sensitivity reflects 5% reduction in all refineries beginning in 2024E; ~$202mm ann. EBITDA ▪ Near- and medium-term assumptions are
in-line with current futures markets Refining ▪ DINO’s public disclosure states a $14/Bbl mid-cycle crack ($10 Gulf Coast 3-2-1 Crack spread + $4 Crack (2) spread between WTI and Brent) Spread ▪ Sensitivity reflects a reduction in
the Gulf Coast 3-2-1 Crack spread from 2026E to 2028E; every (1) $1/Bbl of crack spread equates to ~$184mm of annual EBITDA ▪ Forecast includes uplift from “McKinsey adjustments” related to potential commercial improvements (e.g.,
pricing strategy, SKU rationalization) Lubricants▪ Management’s public commentary has indicated $250mm mid-cycle EBITDA ▪ Sensitivity excludes cash flows from McKinsey adjustments; ~$390mm of cumulative EBITDA from 2H23E through
2028E ▪ Profitability drivers are highly volatile and include BOHO spread, D4 RIN price, LCFS price and blenders’/producers’ tax credit ▪ Management projections include a large uptick in volume in 2024E, followed by gradual
1%-2% annual Renewables increases in utilization (1Q23A utilization was <50%) ▪ Sensitivity reflects Wall Street research consensus average EBITDA from 2024E to 2027E and held flat thereafter; ~$616mm of cumulative EBITDA from 2H23E through
2028E ▪ Minimal value impact (3% of aggregate forecasted EBITDA) Marketing ▪ No sensitivity analyzed ▪ Volumes and cash flows are dependent on DINO’s refining segment, but largely protected by MVC and other contract
provisions HEP ▪ 5% utilization reduction of DINO has cumulative EBITDA impact of ~$57mm from 2H23E through 2028E (1) Reflects 2028E EBITDA impact. 15 (2) Reduced for applicable RIN costs, per DINO management. Source: DINO and HEP management,
FactSet, Wall Street research, Bloomberg.

PRELIMINARY WORKING DRAFT – SUBJECT TO FURTHER REVIEW AND
MODIFICATION Illustrative Sensitivity Analyses | Comparison vs. Management’s Projections Refining EBITDA ($bn) – Utilization Sensitivity Lubricants EBITDA ($bn) Utilization Cum. EBITDA ∆ = $955mm Cum. EBITDA ∆ = $390mm $4.18
97% 97% 97% $0.45 $0.44 95% $0.44 93% $0.41 93% 92% 92% 92% 92% $0.38 91% $0.36 $0.35 $0.34 $0.34 90% $0.34 $0.33 $2.40 $0.33 $0.32 88% $1.80 $1.68 $1.59 $1.49 $1.36 $1.33 $1.32 $1.18 $1.14 $1.13 $0.47 2021A 2022A 2023E 2024E 2025E 2026E 2027E 2028E
2021A 2022A 2023E 2024E 2025E 2026E 2027E 2028E Refining EBITDA ($bn) – Crack Spread Sensitivity Renewables EBITDA ($bn) Gulf Coast 3-2-1 Cum. EBITDA ∆ = $547mm Cum. EBITDA ∆ = $616mm $60 $4.18 $0.40 $0.40 $0.39 $50 $0.36 $0.27
$0.27 $40 $0.26 $0.22 $0.23 $0.20 $2.40 $30 $0.08 $1.80 $1.68 $20 $20 $1.36 $1.33 $1.32 $19 $1.18 $1.15 $1.13 $10 $0.47 ($0.06) ($0.07) -- 2021A 2022A 2023E 2024E 2025E 2026E 2027E 2028E 2021A 2022A 2023E 2024E 2025E 2026E 2027E 2028E Management
Sensitivity Note: Market data as of July 10, 2023. 16 (1) Includes maintenance capex, growth capex and turnaround capital. Source: Company disclosure, Management guidance, Wall Street research. Gulf Coast 3-2-1 Crack Spread ($/Bbl)

PRELIMINARY WORKING DRAFT – SUBJECT TO FURTHER REVIEW AND
MODIFICATION Illustrative Sensitivity Analyses | Impacts to DINO and HEP Impact to DINO Impact to HEP Cumulative 2028E Cumulative 2028E EBITDA Impact EBITDA Impact NPV Impact EBITDA Impact EBITDA Impact NPV Impact X-Ratio Impact (2H23E –
2028E) (Terminal Year) at DCF Midpoint (2H23E – 2028E) (Terminal Year) at DCF Midpoint at DCF Midpoint ($mm) ($mm) ($/share) ($mm) ($mm) ($/unit) (x) Status Quo $15,320 $2,661 $58.11 $2,688 $511 $23.79 0.4094x (1) (1) ($1,012) ($202) ($5.97)
($57) ($18) ($1.02) +0.0272x Utilization (5% Decrease) (7%) (8%) (10%) (2%) (4%) (4%) +7% Refining ($547) ($184) ($4.41) +0.0336x Crack Spread ($1 Decrease) (4%) (7%) (8%) +8% ($390) ($98) ($2.69) +0.0199x Lubricants (Excludes McKinsey Adj.) (3%)
(4%) (5%) +5% ($616) ($127) ($3.88) +0.0293x Renewables (Per Consensus Est.) (4%) (5%) (7%) +7% ($2,535) ($601) ($16.73) ($57) ($18) ($1.02) +0.1407x (2) Cumulative Impact (17%) (23%) (29%) (2%) (4%) (4%) +34% (1) Inclusive of impact to HEP.
Refining EBITDA impact of $955mm during 2H23E – 2028E and $184mm in 2028E. 17 (2) Includes compounding effects from multiple sensitivities. Source: DINO and HEP management, FactSet, Wall Street research, Bloomberg.

PRELIMINARY WORKING DRAFT – SUBJECT TO FURTHER REVIEW AND
MODIFICATION IV. EVALUATION OF THE PROPOSAL 18

PRELIMINARY WORKING DRAFT – SUBJECT TO FURTHER REVIEW AND
MODIFICATION Exchange Ratio Analysis | HEP / DINO The spot exchange ratio has traded up 11% vs. the Proposal Exchange Ratio Analysis | Unaffected LTM to Current Proposal vs. 0.460x Unaffected Date Exchange Ratio Ref. Period Current (07/10/23)
0.4122x (9.9%) (5/3/2023) VWAP Since Proposal 0.4125x (10.0%) 0.440x Unaffected Close (05/03/2023) 0.3799x (2.2%) Unaffected 30-Day VWAP 0.3719x (0.1%) Unaffected 90-Day VWAP 0.3648x 1.8% Unaffected 180-Day VWAP 0.3419x 8.6% 0.420x Unaffected 1-Year
VWAP 0.3475x 6.9% Benefits HEP 0.4122x Unaffected 1-Year High 0.4378x (15.2%) Unaffected 1-Year Low 0.2850x 30.3% 0.400x 0.380x 0.3799x 0.3719x 0.3714x 0.3648x 0.360x 0.3475x 0.3419x 0.340x 0.320x Benefits DINO 0.300x 0.280x May-22 Jul-22 Oct-22
Jan-23 Apr-23 Jul-23 HEP/DINO Unaffected 30-Day VWAP Unaffected 90-Day VWAP Unaffected 180-Day VWAP Unaffected 1-Year VWAP Proposal Unaffected Close (5/3/23) 19 Note: Market data as of July 10, 2023. Source: FactSet, public disclosure.

PRELIMINARY WORKING DRAFT – SUBJECT TO FURTHER REVIEW AND
MODIFICATION Implied Premiums and Valuation Metrics at Various Exchange Ratios HEP Consolidated DINO Proposal Proposal Precedents ($mm, unless per unit data) (Unaffected) (Current) Current Current (1) 0.3714x 0.3714x 0.4122x 0.4000x 0.4250x 0.4500x
0.4750x 0.5000x Median HEP/DINO Exchange Ratio $45.27 Implied HEP Unit Price (@ Current DINO) $15.57 $16.81 $18.66 $18.11 $19.24 $20.37 $21.50 $22.64 Metric Implied Prem./(Disc.) to Current (as of 7/10/23) 0.4122x (10%) (10%) -- (3%) 3% 9% 15% 21%
Initial Proposal 0.3714x -- -- 11% 8% 14% 21% 28% 35% VWAP Since Proposal 0.4125x (10%) (10%) (0%) (3%) 3% 9% 15% 21% Unaffected Close (as of 5/3/23) 0.3799x (2%) (2%) 9% 5% 12% 18% 25% 32% 10% Unaffected 10-Day VWAP 0.3872x (4%) (4%) 6% 3% 10% 16%
23% 29% 9% Unaffected 20-Day VWAP 0.3804x (2%) (2%) 8% 5% 12% 18% 25% 31% 7% Unaffected Unaffected 30-Day VWAP 0.3719x (0%) (0%) 11% 8% 14% 21% 28% 34% 8% Metrics Unaffected 60-Day VWAP 0.3677x 1% 1% 12% 9% 16% 22% 29% 36% 7% Unaffected 90-Day VWAP
0.3648x 2% 2% 13% 10% 17% 23% 30% 37% 9% Unaffected 52-week High (05/03/22) 0.4378x (15%) (15%) (6%) (9%) (3%) 3% 8% 14% (11%) Unaffected 52-week Low (11/15/22) 0.2850x 30% 30% 45% 40% 49% 58% 67% 75% 27% Units Unit Ownership DINO 59.6 $928 $1,003
$1,113 $1,080 $1,147 $1,215 $1,282 $1,350 (2) Unaffiliated Public 67.0 $1,042 $1,126 $1,250 $1,213 $1,288 $1,364 $1,440 $1,516 (3) (x) Total Units/Shares Outstanding 126.6 193.9 Total Equity Value $1,971 $2,129 $2,362 $2,292 $2,436 $2,579 $2,722
$2,866 $8,780 (+) Debt 1,492 3,200 (4) (+) Non-Controlling Interests -- 1,250 (-) Cash (15) (1,500) Total Enterprise Value $3,448 $3,606 $3,839 $3,769 $3,913 $4,056 $4,199 $4,343 $11,730 LT&S / Small (5) Metric Cap. MLP Metric TEV/'23E EBITDA
$458 7.5x 7.9x 8.4x 8.2x 8.6x 8.9x 9.2x 9.5x 8.4x / 7.1x $3,191 3.7x TEV/'24E EBITDA 477 7.2x 7.6x 8.0x 7.9x 8.2x 8.5x 8.8x 9.1x 8.2x / 6.9x 2,842 4.1x 2023E DCF Yield $332 16.8% 15.6% 14.0% 14.5% 13.6% 12.9% 12.2% 11.6% 16.5% / 16.7% 2024E DCF
Yield 349 17.7% 16.4% 14.8% 15.2% 14.3% 13.5% 12.8% 12.2% 18.1% / 17.6% (7) (6) (8) 2023E FCF Yield $322 16.3% 15.1% 13.6% 14.0% 13.2% 12.5% 11.8% 11.2% 11.6% / 10.7% $2,171 5.4x (7) (6) (8) 2024E FCF Yield 349 17.7% 16.4% 14.8% 15.2% 14.3% 13.5%
12.8% 12.2% 14.1% / 13.1% 1,896 6.2x LQA Dist. / Div. Yield $1.40 9.0% 8.3% 7.5% 7.7% 7.3% 6.9% 6.5% 6.2% 7.9% / 8.4% $1.80 4.0% Debt/LTM EBITDA $434 3.4x 4.4x / 4.4x $4,119 0.8x Note: Market data as of July 10, 2023. Balance sheet data as of June
30, 2023E. For illustrative purposes, NCI reflects the current market value of HEP units not held by DINO. capitalization excludes finance leases. (5) LT&S peers include: DKL, NS, PAA. Small Cap. peers include CAPL, GEL, GLP. (1) Precedents
include all equity parent-MLP buy-in transactions. (6) Reflects DCF less growth capex. (2) Includes 116,154 phantom units and 43,365 performance units. (7) Reflects unlevered free cash flow (“UFCF”) and calculated as EBITDA less capex.
20 (3) Reflects fully diluted units and shares. (8) Reflects TEV / UFCF. (4) HEP cash flow metrics are shown net to HEP and therefore NCI is excluded from TEV. DINO Source: Company disclosure, Wall Street research, FactSet.

PRELIMINARY WORKING DRAFT – SUBJECT TO FURTHER REVIEW AND
MODIFICATION Implied Premium to HEP Valuation at Various Exchange Ratios | 0% Cash Assumes 100% equity consideration Market Trading Comparable Company Analysis Discounted Cash Flow Analysis $45.27 $41.70 $52.35 Current Low Low DINO Unaffected $41.91
Midpoint $49.52 Midpoint $58.11 Standalone Unaff. 30-d VWAP $45.98 High $57.34 High $64.18 0.3714x 0.4000x 0.4500x 0.5000x 0.3714x 0.4000x 0.4500x 0.5000x 0.3714x 0.4000x 0.4500x 0.5000x All-in XR Cash (1) (1) (1) Cash Consid. $-- $-- $-- $-- Cash
Consid. $-- $-- $-- $-- Cash Consid. $-- $-- $-- $-- Consideration Equity XR 0.3714x 0.4000x 0.4500x 0.5000x 0.3714x 0.4000x 0.4500x 0.5000x 0.3714x 0.4000x 0.4500x 0.5000x Current $16.81 $18.11 $20.37 $22.64 Low $15.49 $16.68 $18.76 $20.85 Low
$19.44 $20.94 $23.56 $26.18 Implied HEP Unit Price Unaffected 15.57 16.76 18.86 20.96 Midpoint 18.39 19.81 22.28 24.76 Midpoint 21.58 23.24 26.15 29.05 (“Gets”) Unaff. 30-d VWAP 17.08 18.39 20.69 22.99 High 21.29 22.93 25.80 28.67 High
23.84 25.67 28.88 32.09 $18.66 $15.48 $20.86 Current Low Low Standalone HEP Unaffected 15.92 Midpoint 17.94 Midpoint 23.79 Unit Price (“Has”) 17.10 20.41 26.94 Unaff. 30-d VWAP High High Current (9.9%) (3.0%) 9.2% 21.3% Low 0.0% 7.7%
21.2% 34.7% Low (6.8%) 0.4% 13.0% 25.5% Implied Premium Unaffected (2.2%) 5.3% 18.5% 31.6% Midpoint 2.5% 10.4% 24.2% 38.0% Midpoint (9.3%) (2.3%) 9.9% 22.1% (“Gets” vs. “Has”) Unaff. 30-d VWAP (0.1%) 7.6% 21.0% 34.5% High
4.3% 12.4% 26.4% 40.5% High (11.5%) (4.7%) 7.2% 19.1% Note: Market data as of July 10, 2023. 21 (1) Determined by current DINO share price and all-in exchange ratio. Source: FactSet, public disclosure.

PRELIMINARY WORKING DRAFT – SUBJECT TO FURTHER REVIEW AND
MODIFICATION Implied Premium to HEP Valuation at Various Exchange Ratios | 25% Cash Assumes 25% cash consideration based on DINO’s current share price Market Trading Comparable Company Analysis Discounted Cash Flow Analysis $45.27 $41.70
$52.35 Current Low Low DINO Unaffected $41.91 Midpoint $49.52 Midpoint $58.11 Standalone Unaff. 30-d VWAP $45.98 High $57.34 High $64.18 0.3714x 0.4000x 0.4500x 0.5000x 0.3714x 0.4000x 0.4500x 0.5000x 0.3714x 0.4000x 0.4500x 0.5000x All-in XR Cash
(1) (1) (1) Cash Consid. $4.20 $4.53 $5.09 $5.66 Cash Consid. $4.20 $4.53 $5.09 $5.66 Cash Consid. $4.20 $4.53 $5.09 $5.66 Consideration Equity XR 0.2786x 0.3000x 0.3375x 0.3750x 0.2786x 0.3000x 0.3375x 0.3750x 0.2786x 0.3000x 0.3375x 0.3750x
Current $16.81 $18.11 $20.37 $22.64 Low $15.82 $17.04 $19.17 $21.30 Low $18.79 $20.23 $22.76 $25.29 Implied HEP Unit Price Unaffected 15.88 17.10 19.24 21.38 Midpoint 18.00 19.38 21.80 24.23 Midpoint 20.39 21.96 24.70 27.45 (“Gets”)
Unaff. 30-d VWAP 17.01 18.32 20.61 22.90 High 20.17 21.73 24.44 27.16 High 22.08 23.78 26.75 29.73 $18.66 $15.48 $20.86 Current Low Low Standalone HEP Unaffected 15.92 Midpoint 17.94 Midpoint 23.79 Unit Price (“Has”) 17.10 20.41 26.94
Unaff. 30-d VWAP High High Current (9.9%) (3.0%) 9.2% 21.3% Low 2.2% 10.1% 23.8% 37.6% Low (9.9%) (3.0%) 9.1% 21.3% Implied Premium Unaffected (0.3%) 7.4% 20.8% 34.3% Midpoint 0.3% 8.0% 21.5% 35.0% Midpoint (14.3%) (7.7%) 3.9% 15.4%
(“Gets” vs. “Has”) Unaff. 30-d VWAP (0.5%) 7.1% 20.5% 33.9% High (1.2%) 6.5% 19.8% 33.1% High (18.0%) (11.7%) (0.7%) 10.3% Note: Market data as of July 10, 2023. 22 (1) Determined by current DINO share price and all-in
exchange ratio. Source: FactSet, public disclosure.

PRELIMINARY WORKING DRAFT – SUBJECT TO FURTHER REVIEW AND
MODIFICATION Implied Premium to HEP Valuation at Various Exchange Ratios | 50% Cash Assumes 50% cash consideration based on DINO’s current share price Market Trading Comparable Company Analysis Discounted Cash Flow Analysis $45.27 $41.70
$52.35 Current Low Low DINO Unaffected $41.91 Midpoint $49.52 Midpoint $58.11 Standalone Unaff. 30-d VWAP $45.98 High $57.34 High $64.18 0.3714x 0.4000x 0.4500x 0.5000x 0.3714x 0.4000x 0.4500x 0.5000x 0.3714x 0.4000x 0.4500x 0.5000x All-in XR Cash
(1) (1) (1) Cash Consid. $8.41 $9.05 $10.19 $11.32 Cash Consid. $8.41 $9.05 $10.19 $11.32 Cash Consid. $8.41 $9.05 $10.19 $11.32 Consideration Equity XR 0.1857x 0.2000x 0.2250x 0.2500x 0.1857x 0.2000x 0.2250x 0.2500x 0.1857x 0.2000x 0.2250x 0.2500x
Current $16.81 $18.11 $20.37 $22.64 Low $16.15 $17.39 $19.57 $21.74 Low $18.13 $19.52 $21.97 $24.41 Implied HEP Unit Price Unaffected 16.19 17.44 19.62 21.80 Midpoint 17.60 18.96 21.33 23.70 Midpoint 19.20 20.68 23.26 25.84 (“Gets”)
Unaff. 30-d VWAP 16.95 18.25 20.53 22.81 High 19.05 20.52 23.09 25.65 High 20.33 21.89 24.63 27.36 $18.66 $15.48 $20.86 Current Low Low Standalone HEP Unaffected 15.92 Midpoint 17.94 Midpoint 23.79 Unit Price (“Has”) 17.10 20.41 26.94
Unaff. 30-d VWAP High High Current (9.9%) (3.0%) 9.2% 21.3% Low 4.3% 12.4% 26.4% 40.4% Low (13.1%) (6.4%) 5.3% 17.0% Implied Premium Unaffected 1.7% 9.5% 23.2% 36.9% Midpoint (1.9%) 5.6% 18.8% 32.1% Midpoint (19.3%) (13.1%) (2.2%) 8.6%
(“Gets” vs. “Has”) Unaff. 30-d VWAP (0.9%) 6.7% 20.1% 33.4% High (6.6%) 0.5% 13.1% 25.7% High (24.6%) (18.7%) (8.6%) 1.6% Note: Market data as of July 10, 2023. 23 (1) Determined by current DINO share price and all-in
exchange ratio. Source: FactSet, public disclosure.

PRELIMINARY WORKING DRAFT – SUBJECT TO FURTHER REVIEW AND
MODIFICATION Illustrative Consideration Mix Scenario Analysis All-In Exchange Ratio Proposal Current 0.3714x 0.4000x 0.4122x 0.4250x 0.4500x 0.4750x 0.5000x Prem./(Disc.) to Unaff. 30-d VWAP (0.3719x) (0%) 8% 11% 14% 21% 28% 34% Prem./(Disc.) to
Unaff. Close (0.3799x) (2%) 5% 9% 12% 18% 25% 32% Prem./(Disc.) to Current (0.4122x) (10%) (3%) -- 3% 9% 15% 21% Implied HEP Unit Price @ DINO Current Price ($45.27) $16.81 $18.11 $18.66 $19.24 $20.37 $21.50 $22.64 Prem./(Disc.) to Unaff. 30-d VWAP
($17.10) (2%) 6% 9% 13% 19% 26% 32% Prem./(Disc.) to Unaff. Close ($15.92) 6% 14% 17% 21% 28% 35% 42% Prem./(Disc.) to Current ($18.66) (10%) (3%) -- 3% 9% 15% 21% Implied Cash Consideration (% of Total) -- -- -- -- -- -- -- -- $2 12% 11% 11% 10%
10% 9% 9% $4 24% 22% 21% 21% 20% 19% 18% $6 36% 33% 32% 31% 29% 28% 27% $8 48% 44% 43% 42% 39% 37% 35% $10 59% 55% 54% 52% 49% 47% 44% $12 71% 66% 64% 62% 59% 56% 53% Implied Equity Exchange Ratio (x) -- 0.3714x 0.4000x 0.4122x 0.4250x 0.4500x
0.4750x 0.5000x $2 0.3272x 0.3558x 0.3680x 0.3808x 0.4058x 0.4308x 0.4558x $4 0.2830x 0.3116x 0.3238x 0.3366x 0.3616x 0.3866x 0.4116x $6 0.2389x 0.2675x 0.2797x 0.2925x 0.3175x 0.3425x 0.3675x $8 0.1947x 0.2233x 0.2355x 0.2483x 0.2733x 0.2983x
0.3233x $10 0.1505x 0.1791x 0.1913x 0.2041x 0.2291x 0.2541x 0.2791x $12 0.1063x 0.1349x 0.1471x 0.1599x 0.1849x 0.2099x 0.2349x Note: Market data as of July 10, 2023. 24 (1) Based on DINO’s current share price. Source: FactSet, public
disclosure. Cash Consid. ($/Unit) Cash Consid. ($/Unit)

PRELIMINARY WORKING DRAFT – SUBJECT TO FURTHER REVIEW AND
MODIFICATION Illustrative Pro Forma Leverage Analysis Illustratively assumes transaction at 20% premium to unaffected HEP unit price; any cash consideration illustratively funded with balance sheet cash Illustrative Status Quo and Pro Leverage
Overview (6/30/23E Balance Sheet) Status Quo DINO Pro Forma - HEP Buy-In DINO DINO/HEP $ in millions, unless otherwise noted Deconsolidated HEP Consoldiated 100% Equity 75% Equity 50% Equity Cash $1,485 $15 $1,500 $1,500 $1,180 $860 Debt: Revolver
Drawn $ -- $592 $592 $592 $592 $592 Revolver Capacity 1,650 1,200 2,850 2,850 2,850 2,850 Revolver Availability 1,648 608 2,256 2,256 2,256 2,256 Liquidity 3,133 623 3,756 3,756 3,756 3,756 Bonds 1,708 900 2,608 2,608 2,608 2,608 Total Debt $1,708
$1,492 $3,200 $3,200 $3,200 $3,200 Net Debt $223 $1,477 $1,700 $1,700 $2,020 $2,340 (1) LTM EBITDA $3,797 $434 $4,119 $4,119 $4,119 $4,119 (1) 2023E EBITDA 2,816 458 3,191 3,191 3,191 3,191 Credit Metrics: Total Debt / LTM EBITDA 0.45x 3.44x 0.78x
0.78x 0.78x 0.78x Total Debt / 2023E EBITDA 0.61x 3.26x 1.00x 1.00x 1.00x 1.00x Net Debt / LTM EBITDA 0.06x 3.40x 0.41x 0.41x 0.49x 0.57x Net Debt / 2023E EBITDA 0.08x 3.23x 0.53x 0.53x 0.63x 0.73x Note: LTM EBITDA as of June 30, 2023E.
Illustratively assumes no synergy credit for pro forma DINO leverage calculations. 25 (1) Certain adjustments to HEP EBITDA are eliminated in consolidation. Source: FactSet, management guidance.

PRELIMINARY WORKING DRAFT – SUBJECT TO FURTHER REVIEW AND
MODIFICATION DINO | Pro Forma Net Leverage Sensitivity Analysis Consolidated Net Debt / LTM EBITDA at Varying Transaction Consideration Mixes and Premiums % Equity Consideration Exchanged Implied Unit Price 100% 90% 80% 70% 60% 50% 0% $15.92 0.41x
0.44x 0.46x 0.49x 0.52x 0.54x 5% $16.72 0.41x 0.44x 0.47x 0.49x 0.52x 0.55x 10% $17.51 0.41x 0.44x 0.47x 0.50x 0.53x 0.56x 15% $18.31 0.41x 0.44x 0.47x 0.50x 0.53x 0.56x 20% $19.10 0.41x 0.44x 0.47x 0.51x 0.54x 0.57x 25% $19.90 0.41x 0.45x 0.48x
0.51x 0.54x 0.57x 30% $20.70 0.41x 0.45x 0.48x 0.51x 0.55x 0.58x 35% $21.49 0.41x 0.45x 0.48x 0.52x 0.55x 0.59x 26 Note: Assumes consolidated net debt of $1.7bn as of 6/30/23E and $4.1bn of consolidated LTM EBITDA. Source: FactSet, public
disclosure. Premium to the Unaffected HEP Unit Price

PRELIMINARY WORKING DRAFT – SUBJECT TO FURTHER REVIEW AND
MODIFICATION V. PROPOSED NEXT STEPS 27

PRELIMINARY WORKING DRAFT – SUBJECT TO FURTHER REVIEW AND
MODIFICATION Proposed Next Steps ▪ Discuss any additional diligence aspects and/or sensitivity requests ▪ Determine the Committee’s acceptable range of transaction outcomes (i.e., exchange ratio, implied unit price/premium and
cash/stock mix) and develop negotiation strategy – Add cash consideration: Lock-in partial premium and de-risk downside / diminish upside; proceeds to defray tax burden o Would be a departure from the structure of the original offer; we do not
know DINO’s disposition towards using cash in a transaction o Likely to subject the Proposed Transaction to the heightened disclosure requirements of Rule 13(e)-3, including filing advisor discussion materials with the SEC – 100% equity
consideration: Premium subject to DINO share price volatility and capture all (1) upside/downside risk; DINO’s stock is ~80x more liquid vs. HEP so HEP unitholders could sell immediately / more easily o All-stock counteroffer aligns with
initial offer, though both cash and DINO stock are taxable to unitholders o Our analysis indicates DINO is undervalued relative to HEP ▪ Prepare letter outlining terms of counterproposal Note: Market data as of July 10, 2023. 28 (1) Based on
unaffected 30-day ADTV of $117.1mm and $1.5mm for DINO and HEP, respectively. Source: FactSet.

PRELIMINARY WORKING DRAFT – SUBJECT TO FURTHER REVIEW AND
MODIFICATION VI. APPENDIX 29

PRELIMINARY WORKING DRAFT – SUBJECT TO FURTHER REVIEW AND
MODIFICATION HEP | Comparable Public Company Trading Analysis (5) (3) Unit Market TEV/EBITDA LP DCF Yield Dist. Yield LP Dist. Coverage Lev. (LTM EBITDA) '23E - '25E CAGR Trading Liq. (1) (2) (4) Company Price Cap TEV 2023E 2024E 2023E 2024E LQA
2023E 2023E 2024E Debt Adj. Debt EBITDA Distr. 30-day ADTV Plains All American $14.51 $10.1 $20.3 7.9x 7.7x 16.5% 18.1% 7.4% 7.4% 2.2x 2.1x 3.1x 4.2x 1.2% 14.4% $48.9 Delek Logistics Partners 52.00 2.3 4.0 10.3x 9.5x 13.2% 14.7% 7.9% 8.0% 1.7x 1.8x
4.8x 4.8x 8.2% 3.4% 2.0 NuStar Energy 17.19 1.9 6.2 8.4x 8.2x 18.9% 21.5% 9.3% 9.3% 2.0x 2.3x 4.4x 5.9x 1.5% 0.3% 5.2 Genesis Energy 9.64 1.2 5.6 7.1x 6.9x 28.0% 27.3% 6.2% 6.2% 4.5x 4.4x 4.8x 5.9x 5.4% 5.3% 5.6 Global Partners 30.30 1.0 2.3 6.8x
6.4x 16.7% 17.6% 8.4% 8.7% 1.8x 1.8x 2.3x 2.6x 6.1% 3.0% 2.1 CrossAmerica Partners 18.80 0.7 1.5 9.8x 9.2x 14.2% 15.2% 11.2% 11.2% 1.3x 1.4x 4.4x 4.5x 6.5% -- 0.6 Mean - All (6 Companies) 8.4x 8.0x 17.9% 19.1% 8.4% 8.5% 2.2x 2.3x 4.0x 4.6x 4.8% 4.4%
$10.7 Median - All (6 Companies) 8.1x 8.0x 16.6% 17.8% 8.1% 8.4% 1.9x 1.9x 4.4x 4.7x 5.8% 3.2% $3.7 Mean - LT&S (3 Companies) 8.9x 8.5x 16.2% 18.1% 8.2% 8.2% 2.0x 2.1x 4.1x 5.0x 3.7% 6.0% $18.7 Median - LT&S (3 Companies) 8.4x 8.2x 16.5%
18.1% 7.9% 8.0% 2.0x 2.1x 4.4x 4.8x 1.5% 3.4% $5.2 Mean - Small Cap. MLPs (3 Companies) 7.9x 7.5x 19.6% 20.0% 8.6% 8.7% 2.5x 2.5x 3.8x 4.3x 6.0% 2.8% $2.8 Mean - Small Cap. MLPs (3 Companies) 7.1x 6.9x 16.7% 17.6% 8.4% 8.7% 1.8x 1.8x 4.4x 4.5x 6.1%
3.0% $2.1 (6) Holly Energy Partners (Proposal) $16.81 $2.1 $3.6 7.9x 7.6x 15.6% 16.4% 8.3% 8.3% 1.9x 2.0x 3.4x 3.4x 1.7% -- $1.5 (6) Holly Energy Partners (Current) $18.66 $2.4 $3.8 8.4x 8.0x 14.0% 14.8% 7.5% 7.5% 1.9x 2.0x 3.4x 3.4x 1.7% -- $1.5
(6) Holly Energy Partners (Proposal) $16.81 $2.1 $3.6 8.1x 7.8x 14.7% 14.7% 8.3% 8.7% 1.7x 1.7x 3.4x 3.4x 2.1% 5.8% $1.5 (6) Holly Energy Partners (Current) $18.66 $2.4 $3.8 8.6x 8.3x 13.2% 13.3% 7.5% 7.8% 1.7x 1.7x 3.4x 3.4x 2.1% 5.8% $1.5 Note:
Market data as of July 10, 2023; pro forma announced M&A and capital markets activity. Market capitalization and TEV shown in $bn. 30-day ADTV shown in $mm. (1) Reflects LP market capitalization for MLPs (i.e., excludes economic GPs and/or IDR
value). (2) Reflects total enterprise value for MLPs (i.e., includes economic GPs and/or IDR value, if applicable, based on Intrepid estimates). (3) LTM EBITDA as of 3/31/2023. (4) Adjusted debt reflects 100% debt treatment for preferred equity. (5)
LT&S CAGRs reflect ’23E – ’24E for DKL due to lack of 2025E estimates. Select MLP CAGRs reflect ’23E – ’24E for CAPL and GLP due to lack of 2025E estimates. 30 (6) Reflects 30-day ADTV as of May 3, 2023.
Source: Public disclosure, FactSet, Wall Street research. Small Cap Wall Street Mgmt. LT&S MLPs

PRELIMINARY WORKING DRAFT – SUBJECT TO FURTHER REVIEW AND
MODIFICATION DINO | Comparable Company Trading Analysis (1) Share Market TEV/EBITDA TEV/UFCF Dividend Yield Leverage '23E - '25E CAGR Trading Liq. (2) Company Price Cap TEV 2023E 2024E 2023E 2024E LQA 2023E LTM EBITDA EBITDA Div. 30-day ADTV
Marathon Petroleum $117.84 $50.0 $82.1 5.2x 7.0x 6.2x 8.7x 2.6% 2.6% 1.0x (18.4%) 4.6% $414.5 Phillips 66 100.33 46.0 66.0 5.8x 6.7x 6.9x 8.2x 4.2% 4.2% 1.1x (8.5%) 4.1% 318.0 Valero Energy 112.61 40.7 48.7 3.6x 5.3x 4.2x 6.6x 3.6% 3.6% 0.5x (23.2%)
2.6% 476.7 PBF Energy 40.58 5.1 6.0 2.7x 3.5x 3.2x 4.3x 2.1% 2.1% 0.3x (18.3%) 2.1% 95.2 CVR Energy 30.77 3.1 4.6 4.7x 6.3x 6.0x 8.7x 6.7% 6.7% 1.0x (18.8%) n.m. 31.2 Par Pacific 27.20 1.7 1.8 3.5x 4.3x 4.1x 5.6x -- -- 0.7x (19.5%) n.m. 24.4 Delek
22.94 1.5 4.0 4.3x 5.5x 6.9x 10.0x 3.6% 3.6% 2.0x (18.5%) 7.3% 29.3 Vertex Energy 6.65 0.6 0.8 3.7x 3.2x 9.2x 5.4x -- -- 1.5x 10.5% n.m. 15.7 Mean - 8 Companies 4.2x 5.2x 5.8x 7.2x 3.2% 3.2% 1.0x (14.4%) 4.2% $175.6 Median - 8 Companies 4.0x 5.4x
6.1x 7.4x 3.1% 3.1% 1.0x (18.5%) 4.1% $63.2 Mean - Large Cap (3 Companies) 4.9x 6.3x 5.8x 7.8x 3.5% 3.5% 0.9x (16.7%) 3.8% $403.0 Median - Large Cap (3 Companies) 5.2x 6.7x 6.2x 8.2x 3.6% 3.6% 1.0x (18.4%) 4.1% $414.5 Mean - SMID Cap (5 Companies)
3.8x 4.6x 5.9x 6.8x 2.9% 2.9% 1.1x (12.9%) 2.1% $50.2 Median - SMID Cap (5 Companies) 3.7x 4.3x 6.0x 5.6x 2.1% 2.1% 1.0x (18.5%) 2.1% $29.3 (3) HF Sinclair Corporation (Wall Street) $45.27 $8.8 $11.7 3.9x 4.4x 5.9x 6.6x 4.0% 4.0% 0.6x (10.5%) 4.4%
$117.1 (3) HF Sinclair Corporation (Management) $45.27 $8.8 $11.7 3.7x 4.1x 5.4x 6.2x 4.0% 4.0% 0.6x (4.9%) -- $117.1 Note: Market data as of July 10, 2023. Market capitalization and TEV shown in $bn. 30-day ADTV shown in $mm. (1) UFCF calculated as
EBITDA less capex. (2) LTM EBITDA as of March 31, 2023. 31 (3) Reflects 30-day ADTV as of May 3, 2023. Source: FactSet, Public disclosure, Wall Street research, Management projections. SMID Cap. Large Cap.

PRELIMINARY WORKING DRAFT – SUBJECT TO FURTHER REVIEW AND
MODIFICATION HEP | Distribution Coverage Sensitivity Methodology Coverage Reference Range Implied Unit Price ($) Unaffected: $15.92 (2) Implied Proposal: $16.81 Management Forecast $13.54 $18.77 (1.97x – 2.26x) Current: $18.66 Distribution Ke:
13.0% – 8.75% $15.99 $22.31 1.85x Discount Model Term. Yield: 9.00% – 7.00% 1.75x $16.89 $23.57 $5 $10 $15 $20 $25 $30 $35 32 Note: Market data as of July 10, 2023. Source: Management projections, Wall Street research,
Bloomberg.

PRELIMINARY WORKING DRAFT – SUBJECT TO FURTHER REVIEW AND
MODIFICATION HEP | Wall Street Research Summary Selected HEP Target Price and Ratings Ratings Summary Pre-Announcement Post-Announcement Broker Date Target Rating Updated? Target Rating Citi 4/5/23 $20 Hold Yes $17 Hold Buy 1 Barclays 4/4/23 $18
Sell No $18 Sell Sell 2 Hold JP Morgan 3/8/23 $19 Sell Yes $18 Sell 1 Raymond James 2/24/23 $23 Buy Yes $20 Buy Max $23 1 Buy $20 1 Buy Median (4 Brokers) $20 1 Hold $18 1 Hold Mean (4 Brokers) $20 2 Sell $18 2 Sell Min $18 $17 33 Note: Market data
as of July 10, 2023. Source: Wall Street research.

PRELIMINARY WORKING DRAFT – SUBJECT TO FURTHER REVIEW AND
MODIFICATION DINO | Wall Street Research Summary Selected DINO Selected Target Price and Ratings Ratings Summary Pre-Announcement Post-Announcement Broker Date Target Rating Updated? Target Rating UBS 5/4/23 $58 Hold Yes $58 Hold Bank of America
5/4/23 $64 Buy Yes $62 Buy Hold 4 Piper Sandler & Co. 5/1/23 $73 Buy Yes $57 Buy Mizuho Capital 4/20/23 $68 Buy Yes $56 Buy RBC Capital 4/19/23 $66 Buy Yes $59 Buy Buy Wells Fargo 4/18/23 $52 Buy Yes $52 Buy 8 Goldman Sachs 4/18/23 $58 Buy Yes
$56 Buy Scotiabank 4/13/23 $57 Buy Yes $57 Buy Cowen 4/13/23 $50 Hold Yes $40 Hold TPH &Co. 4/10/23 $56 Buy No $50 Buy Barclays 4/9/23 $55 Hold No $55 Hold JP Morgan 4/5/23 $57 Hold Yes $57 Hold Max $73 8 Buy $62 8 Buy Median (12 Brokers) $58 4
Hold $57 4 Hold Mean (12 Brokers) $60 $55 Min $50 $40 34 Note: Market data as of July 10, 2023. Price Targets and Ratings reflect select research reports. Source: Wall Street research.

PRELIMINARY WORKING DRAFT – SUBJECT TO FURTHER REVIEW AND
MODIFICATION Selected Midstream Parent-MLP Buy-In Precedent Transactions th Includes selected transactions since 2016 with 8/8 equity value over $1bn Transaction Metrics Final Prem. to Unaff. 8/8ths Equity Buyer % FY+1 LP FY+1 LP % Cash 30-Day (1)
Unaff. Date Buyer Target Value ($bn) Owned DCF Yield DPU Yield Consid. 1-Day VWAP 8/17/22 Phillips 66 DCP Midstream $8.7 56% 14.2% 4.1% 100% 20% 28% 6/23/22 PBF Energy PBF Logistics 1.1 48% 13.9% 6.8% 53% 32% 12% (2) (2) 5/13/22 Diamondback Energy
Rattler Midstream LP 2.2 74% 11.3% 8.0% --% 17% 9% 2/10/22 Shell Shell Midstream 6.2 69% 10.5% 7.6% 100% 23% 25% 10/25/21 Phillips 66 Phillips 66 Partners 10.1 70% 10.6% 4.2% --% 7% 0% (2) 8/4/21 BP BP Midstream Partners 1.5 54% 11.2% 9.8% --% 11%
3% 2/4/21 Chevron Corp. Noble Midstream Partners 1.1 62% 21.3% 6.0% --% (1%) 6% (2) 10/2/20 TC Energy Corporation TC PipeLines 2.1 24% 13.5% 8.8% --% 14% 12% 2/25/20 Equitrans Midstream EQM Midstream Partners 4.6 54% 21.6% 5.2% --% 0% 3% 8/27/19
Blackstone Tallgrass Energy 6.3 44% 10.6% 10.0% 100% 56% 23% 4/1/19 UGI Corp. AmeriGas Partners LP 3.3 26% 10.3% 8.9% 22% 13% 22% (2) 11/7/18 Western Gas Equity Partners Western Gas Partners 8.4 30% 8.5% 8.1% --% 8% 8% (2) 10/19/18 EnLink Midstream
EnLink Midstream Partners 6.5 22% 9.2% 8.5% --% 1% 4% 10/17/18 Valero Energy Valero Energy Partners 2.9 68% 7.0% 5.7% 100% 7% 12% 10/8/18 Antero Midstream GP LP Antero Midstream Partners LP 5.8 --% 7.9% 7.2% 10% 5% 4% 9/18/18 Dominion Energy
Dominion Energy Midstream Partners 2.8 61% 8.2% 8.2% --% 1% 8% (2) 8/1/18 Energy Transfer Equity Energy Transfer Partners 27.5 2% 12.5% 9.8% --% 11% 14% 6/1/18 OCI OCI Partners 1.0 88% 13.0% 13.0% 100% 15% 15% 5/16/18 Enbridge Spectra Energy
Partners 17.6 83% 9.8% 8.7% --% 10% 3% 5/16/18 Enbridge Enbridge Energy Partners 4.9 33% 14.9% 9.1% --% 9% 6% 3/15/18 Williams Williams Partners 38.9 74% 7.6% 6.4% --% 14% 13% (2) 2/7/18 Tallgrass Energy GP Tallgrass Energy Partners 3.5 35% 9.6%
8.4% --% 10% 10% 12/29/17 Archrock Archrock Partners 1.0 41% 14.4% 7.8% --% 23% 22% 9/23/16 Columbia Pipeline Group Columbia Pipeline Partners 1.7 47% 4.9% 4.7% 100% 11% 17% Summary Statistics (24 Transactions) 75th Percentile $7.0 68% 13.6% 8.9%
64% 15.6% 15.2% Mean $7.1 48% 11.5% 7.7% 29% 13.2% 11.6% Median $4.0 51% 10.6% 8.0% --% 10.9% 10.9% 25th Percentile $2.0 32% 9.0% 6.3% --% 7.1% 5.5% (3) Holly Energy Partners / HF Sinclair Initial Proposal 5/3/23 HF Sinclair Corporation Holly Energy
Partners $2.0 47% 16.8% 9.0% --% (2%) (0%) Note: Excludes non-limited partnership/LLC transactions or transactions with incentive distribution rights. non-US targets. Transaction metrics are based on management projections available (2) Reflects
yield based on Wall Street consensus metrics. 35 in public disclosure (e.g., proxy statement). (3) Metrics are based off pricing as of the unaffected date. (1) Does not include value attributable to an economic general partner or to Source: FactSet,
Wall Street research, Public disclosure.

PRELIMINARY WORKING DRAFT – SUBJECT TO FURTHER REVIEW AND
MODIFICATION Summary of Selected Parent / MLP Buy-In Transactions (1) Key Takeaways Precedent Transactions Analysis | Parent-MLP Buy-Ins ▪ Intrepid has reviewed and Low Median High analyzed 34 recent Parent- All Deals (4%) 1% 32% MLP Buy-In
transactions, Initial 1-Day including 18 all-equity deals Premium Equity Deals (4%) 0% 15% ▪ Premiums have typically All Deals (13%) 5% 21% Initial 30-Day been modest when VWAP Premium Equity Deals (9%) 4% 15% compared to third-party
transactions All Deals 0 3 7 # of Bumps ▪ Sponsors typically leave Equity Deals 1 3 7 some room to improve the All Deals 9 53 204 # of Days from Initial Offer initial offer to Final Agreement Equity Deals 9 41 204 (2) All Deals (1%) 8% 40%
Total Premium Increase (2) Equity Deals (1%) 7% 26% All Deals (9%) 11% 56% Final 1-Day Premium (2) Equity Deals (1%) 10% 34% All Deals 0% 10% 47% Final 30-Day VWAP Premium Equity Deals 0% 8% 22% All Deals (61%) (10%) 12% Final Prem. To 52-Wk High
Equity Deals (61%) (11%) 7% All Deals 14% 32% 261% Final Prem. To 52-Wk Low Equity Deals 14% 27% 261% (1) Final premium metrics reflect premiums to unaffected unit price and unaffected exchange ratio. ratio implied by the relative equity prices at
the time of the initial proposal. 36 (2) CVX’s initial proposal was based on a fixed value ($12.47/unit) and did not include an Source: FactSet, Public disclosure, Wall Street research. exchange ratio metric; the final exchange ratio of
0.1393x is a slight discount to the exchange
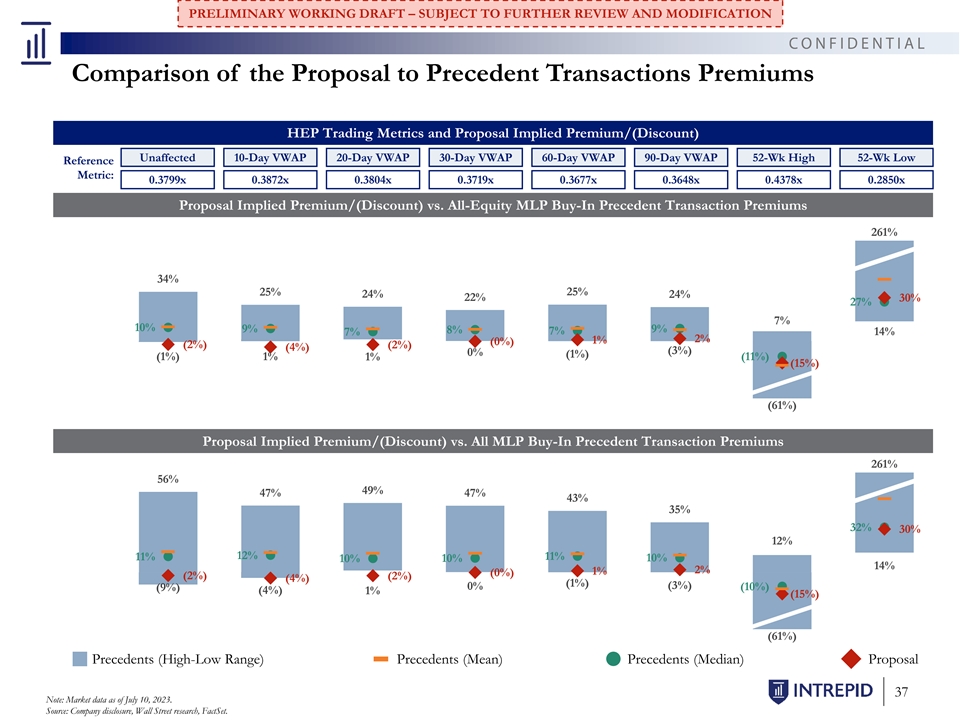
PRELIMINARY WORKING DRAFT – SUBJECT TO FURTHER REVIEW AND
MODIFICATION Comparison of the Proposal to Precedent Transactions Premiums HEP Trading Metrics and Proposal Implied Premium/(Discount) Unaffected 10-Day VWAP 20-Day VWAP 30-Day VWAP 60-Day VWAP 90-Day VWAP 52-Wk High 52-Wk Low Reference Metric:
0.3799x 0.3872x 0.3804x 0.3719x 0.3677x 0.3648x 0.4378x 0.2850x Proposal Implied Premium/(Discount) vs. All-Equity MLP Buy-In Precedent Transaction Premiums 261% 34% 25% 25% 24% 24% 22% 30% 27% 7% 10% 9% 9% 8% 7% 14% 7% 2% 1% (0%) (2%) (2%) (4%)
(3%) 0% (1%) (1%) 1% 1% (11%) (15%) (61%) Proposal Implied Premium/(Discount) vs. All MLP Buy-In Precedent Transaction Premiums 261% 56% 49% 47% 47% 43% 35% 32% 30% 12% 12% 11% 11% 10% 10% 10% 14% 2% 1% (0%) (2%) (2%) (4%) (1%) 0% (3%) (9%) (10%)
(4%) 1% (15%) (61%) Precedents (High-Low Range) Precedents (Mean) Precedents (Median) Proposal 37 Note: Market data as of July 10, 2023. Source: Company disclosure, Wall Street research, FactSet.

PRELIMINARY WORKING DRAFT – SUBJECT TO FURTHER REVIEW AND
MODIFICATION Disclaimer These materials have been prepared by Intrepid Partners, LLC (“Intrepid”) for the Conflicts Committee (the “Committee”) of the Board of Directors of Holly Logistic Services, L.L.C. (the “General
Partner”), the ultimate general partner of Holly Energy Partners, L.P. (“HEP”), to whom such materials are directly addressed and delivered. These materials are confidential and may not be used or relied upon by any other person or
for any purpose other than as specifically contemplated by a written agreement with Intrepid. These materials have been developed by and are proprietary to Intrepid and were prepared exclusively for the benefit and internal use of the Committee in
connection with evaluating the Proposed Transaction with HEP and HF Sinclair Corporation (“DINO”). These materials are based upon information provided by or on behalf of the management of DINO and the General Partner, from public
sources, or otherwise reviewed by Intrepid. Intrepid has relied upon and assumes no responsibility for independent investigation or verification of such information and has relied upon such information being complete and accurate in all material
respects. To the extent such information includes estimates and forecasts of future performance prepared by or reviewed with management of DINO or the General Partner and/or other potential transaction participants or obtained from public sources,
Intrepid has assumed that such estimates and forecasts have been reasonably prepared on bases reflecting the best currently available estimates and judgments of management of DINO, and the General Partner or such other potential transaction
participants (or, with respect to estimates and forecasts obtained from public sources, represent reasonable estimates). Actual results may differ materially from such estimates and forecasts. No representation or warranty, express or implied, is
made as to the accuracy or completeness of such information, and nothing contained herein is, or shall be relied upon as, a representation or warranty, whether as to the past, the present or the future. The materials and related commentary are not
intended to provide the only basis for evaluating, and should not be considered a recommendation with respect to, the consideration paid, the proposed transaction or any transaction or other matter. These materials are also subject to the
qualifications and limitations described in any accompanying written opinion letter. These materials were compiled on a confidential basis solely for use by the Committee and may not be relied on by any other party (including stakeholders in either
entity), even if such parties are provided a copy of these materials. These materials were prepared without a view to public disclosure or filing thereof under state or federal laws, and may not be redistributed, reproduced, distributed, passed to
others, transmitted, quoted or referred to, in whole or in part, without the prior written permission of Intrepid in accordance with the terms of our engagement letter with the Committee. These materials speak only as of the date on the cover and
Intrepid assumes no obligation to update these materials or inform any recipient of changed circumstances, events or information. These materials were prepared for a specific use by specific persons and were not prepared to conform with any
disclosure standards under securities laws or otherwise. In the ordinary course of its business, each of Intrepid and its affiliates may actively trade or hold the securities of DINO, HEP or other parties involved in a proposed transaction for its
own account or for the account of its customers and, accordingly, may at any time hold a long or short position in such securities. Intrepid will receive a fee in connection with delivery of an opinion relating to the proposed transaction. These
materials do not constitute, nor do they form part of, an offer or solicitation to sell or purchase any securities or instruments and are not a commitment by Intrepid or any of its affiliates to provide, arrange or underwrite any financing for any
transaction or to purchase any security in connection therewith. These materials may not reflect information known to other professionals in other business areas of Intrepid and its affiliates. Intrepid and its affiliates do not provide legal,
regulatory, accounting, bankruptcy, securities or tax advice. Any statements contained herein as to tax matters were neither written nor intended by Intrepid or its affiliates to be used and cannot be used by any taxpayer for the purpose of avoiding
tax penalties that may be imposed on such taxpayer. Each person should seek legal, regulatory accounting and tax advice based on his, her or its particular circumstances from independent advisors regarding the evaluation and impact of any
transactions or matters described herein.

PR PRELIM ELIMINAR INARY Y WOR WORKING KING DRAF DRAFT T – –
SUBJECT SUBJECT TO TO FUR FURTHE THER REV R REVIEW IEW AND AND MOD MODIFICAT IFICATION ION Exhibit (c)(3)(D) PROJECT APPLE DISCUSSION MATERIALS July 14, 2023

PRELIMINARY WORKING DRAFT – SUBJECT TO FURTHER REVIEW AND
MODIFICATION Market Performance and Implied Proposal | “Then” vs. “Now” 5/3/23 (“Then”) 7/13/23 (“Now”) Change (%) $41.91 $47.02 +12.2% DINO Unit Price HEP Unit Price $15.92 $19.07 +19.8% 0.3799x
0.4056x +6.8% Spot Exchange Ratio Prem. / Disc. of Proposal to Spot XR (2.2%) (8.4%) Prem. / Disc. of Proposal to Unaff. 30-d VWAP XR (0.1%) Implied Value at Proposal (0.3714x) $15.57 $17.46 +12.2% Prem. / Disc. vs. HEP Price (2.2%) (8.4%) (2.2%)
+9.7% Prem. / Disc. vs. Unaff. HEP price HEP Peers | LT&S +15.9% (2.1%) HEP Peers | Small Cap. DINO Peers | Large Cap. +7.9% +17.2% DINO Peers | SMID Cap. Note: Market data as of July 13, 2023. LT&S Peers include: DKL, NS, PAA. Small Cap.
MLP peers include CAPL, GEL, GLP. Large Cap. Refining peers include MPC, PSX, VLO. SMID Cap. Refining peers 1 include CVI, DK, PARR, PBF, VTNR. Source: FactSet, public disclosure. Peer Trading Perf.

PRELIMINARY WORKING DRAFT – SUBJECT TO FURTHER REVIEW AND
MODIFICATION HEP | Preliminary Valuation Analysis (1) Methodology Metric Reference Range Implied Unit Price ($) Unaffected 52-Week Trading Range Unaffected: $15.92 $15.66 $20.00 Trading Range Low (7/6/22) – High (6/6/22) (2) Implied Proposal:
$17.46 (3) Unaffected Unit Price Target Range $18.00 $23.00 (Low – Median – High) $20.00 Wall Street Current: $19.07 Research (3) Post-Announcement Unit Price Target Range $17.00 $20.00 (Low – Median – High) $18.00 Discounted
WACC: 10.25% – 8.50% PV of Unlevered FCF $20.86 $26.94 Cash Flow Term. Mult.: 7.25x – 8.75x Distribution Ke: 13.00% – 8.75% PV of LP DPU $13.54 $18.77 Discount Model Term. Yield: 9.00% – 7.00% Trading (4) Range of Metrics
Various $15.48 $20.41 Comparables Precedent (4) Range of Metrics Various $18.11 $23.58 Transactions Precedent Unaffected Close: 10% – 25% $17.51 $19.90 Premiums Paid $15.92 $5 $10 $15 $20 $25 $30 $35 Note: Market data as of July 13, 2023. (1)
Based on $1,477mm of net debt as of June 30, 2023E, per Management estimates. (2) Based on current DINO share price and 0.3714x exchange ratio. (3) Forward target price. 2 (4) Reflects average low and average high implied unit price. Source:
Management projections, Wall Street research, Bloomberg, FactSet. For Reference Only

PRELIMINARY WORKING DRAFT – SUBJECT TO FURTHER REVIEW AND
MODIFICATION DINO | Preliminary Valuation Analysis Methodology Metric Reference Range Implied Share Price ($) Unaffected: $41.91 Unaffected 52-Week Trading Range Trading Range $41.63 $65.61 Low (5/2/22) – High (11/22/22) Current: $47.02 (1)
Unaffected Share Price Target Range $50.00 $73.00 (Low – Median – High) $58.00 Wall Street Research (1) Post-Announcement Share Price Target Range $40.00 $62.00 (Low – Median – High) $57.00 Discounted Cash Flow $52.35 $64.18
(Management) WACC: 10.25% – 9.00% (2) PV of Unlevered FCF Term. Mult.: 4.5x – 5.5x Discounted Cash Flow $46.28 $57.08 (Sensitivity) Trading (3) Range of Metrics Various $41.56 $57.19 Comparables $0 $20 $40 $60 $80 Note: Market data as of
July 13, 2023. (1) Forward target price. (2) Based on $1,700mm of net debt as of June 30, 2023E and NCI based on midpoint of HEP DCF analysis. 3 (3) Reflects average low and average high implied share price; based on $1,700mm of net debt as of June
30, 2023E and NCI based on HEP’s current unit price. Source: Management projections, Wall Street research, Bloomberg. For Reference Only

PRELIMINARY WORKING DRAFT – SUBJECT TO FURTHER REVIEW AND
MODIFICATION Exchange Ratio Analysis Methodology Implied HEP Unit Price Implied DINO Share Price Implied Exchange Ratio HEP/DINO Proposal: 0.3714x Market Trading Unaffected 52-Week Low (11/15/22) – High (5/3/22) 0.2850x 0.4378x Exchange Ratio
Current: 0.4056x Wall Street Research $18.00 – $23.00 $50.00 – $73.00 0.2466x 0.4600x 0.3448x (Unaffected) Wall Street $17.00 – $20.00 $40.00 – $62.00 Research (Post- 0.2742x 0.5000x 0.3158x Announcement) Trading $15.48
– $20.41 $41.56 – $57.19 0.2707x 0.4911x Comparables Discounted Cash $52.35 – $64.18 Flow 0.3249x 0.5146x (Management) $20.86 – $26.94 Discounted Cash Flow $46.28 – $57.08 0.3654x 0.5821x (Sensitivity) Precedent (1)
$18.11 – $23.58 $41.56 – $57.19 0.3167x 0.5674x Transactions Precedent Unaffected Exchange Ratio (0.3799x): 0.4178x 0.4748x 10% – 25% Premium Premiums Paid 0.0000x 0.2000x 0.4000x 0.6000x 0.8000x Note: Market data as of July 13,
2023. 4 (1) DINO share price range based on comparable company trading range. Source: Management guidance, FactSet, Bloomberg. For Reference Only

PRELIMINARY WORKING DRAFT – SUBJECT TO FURTHER REVIEW AND
MODIFICATION Exchange Ratio Analysis | HEP / DINO The spot exchange ratio has traded up 9% vs. the Proposal Exchange Ratio Analysis | Unaffected 1-Year to Current Proposal vs. Unaffected Date Exchange Ratio Ref. Period 0.525x (5/3/2023) Current
(07/13/23) 0.4056x (8.4%) VWAP Since Proposal 0.4118x (9.8%) Unaffected Close (05/03/2023) 0.3799x (2.2%) Unaffected 30-Day VWAP 0.3719x (0.1%) Unaffected 90-Day VWAP 0.3648x 1.8% Unaffected 180-Day VWAP 0.3419x 8.6% 0.475x Benefits HEP Unaffected
1-Year VWAP 0.3475x 6.9% Unaffected 2-Year VWAP 0.4345x (14.5%) 0.4345x 0.425x 0.4056x 0.3799x 0.3719x 0.375x 0.3714x 0.3648x 0.3475x 0.3419x 0.325x Benefits DINO 0.275x May-22 Sep-22 Feb-23 Jul-23 HEP/DINO Unaffected 30-Day VWAP Unaffected 90-Day
VWAP Unaffected 180-Day VWAP Unaffected 1-Year VWAP Unaffected 2-Year VWAP Unaffected Close (5/3/23) Proposal 5 Note: Market data as of July 13, 2023. Source: FactSet, public disclosure.

PRELIMINARY WORKING DRAFT – SUBJECT TO FURTHER REVIEW AND
MODIFICATION Illustrative Consideration Mix Scenario Analysis Implied Purchase Price (@ Current DINO - $47.02) Equity 0.3714x 0.3714x 0.3714x 0.3714x 0.3714x 0.3714x 0.3714x $0.00 $5.50 $6.00 $6.50 $7.00 $7.50 $8.00 Cash Value $17.46 $22.96 $23.46
$23.96 $24.46 $24.96 $25.46 Precedents - All Precedents - Since 1/1/22 % Cash Consideration 0% 24% 26% 27% 29% 30% 31% Low Median High Low Median High Prem./(Disc.) to Unaff. Close ($15.92) 10% 44% 47% 51% 54% 57% 60% (9%) 11% 56% 17% 23% 34%
Prem./(Disc.) to Unaff. 30-d VWAP ($17.10) 2% 34% 37% 40% 43% 46% 49% 0% 10% 47% 9% 25% 47% Median Prem./(Disc.) to Current ($19.07) (8%) 20% 23% 26% 28% 31% 34% DKL NS PAA LT&S Small Cap. Implied TEV/'23E EBITDA 8.1x 9.6x 9.7x 9.9x 10.0x 10.1x
10.3x 10.4x 8.4x 8.0x 8.4x 7.1x Implied '23E DCF Yield 15.0% 11.4% 11.2% 10.9% 10.7% 10.5% 10.3% 13.0% 18.6% 16.1% 16.1% 16.0% Implied '23E DPU Yield 8.0% 6.1% 6.0% 5.8% 5.7% 5.6% 5.5% 7.9% 9.1% 7.3% 7.9% 8.4% Precedents - 100% Equity Low Median
High Implied All-in XR (@ Current DINO) 0.3714x 0.4884x 0.4990x 0.5096x 0.5203x 0.5309x 0.5415x Prem./(Disc.) to Unaff. Close (0.3799x) (2%) 29% 31% 34% 37% 40% 43% (1%) 10% 34% Prem./(Disc.) to Unaff. 30-d VWAP (0.3719x) (0%) 31% 34% 37% 40% 43%
46% 0% 8% 22% Prem./(Disc.) to Current (0.4056x) (8%) 20% 23% 26% 28% 31% 34% Implied Purchase Price (@ DINO DCF Midpoint - $58.11) Equity 0.3714x 0.3714x 0.3714x 0.3714x 0.3714x 0.3714x 0.3714x $0.00 $5.50 $6.00 $6.50 $7.00 $7.50 $8.00 Cash Value
$21.58 $27.08 $27.58 $28.08 $28.58 $29.08 $29.58 Uplift/(Dec.) vs. HEP Has @ DCF Midpoint ($23.79) (9%) 14% 16% 18% 20% 22% 24% Implied Purchase Price (@ DINO Sensitivity DCF Midpoint - $51.53) Equity 0.3714x 0.3714x 0.3714x 0.3714x 0.3714x 0.3714x
0.3714x $0.00 $5.50 $6.00 $6.50 $7.00 $7.50 $8.00 Cash Value $19.14 $24.64 $25.14 $25.64 $26.14 $26.64 $27.14 Uplift/(Dec.) vs. HEP Has @ DCF Midpoint ($23.79) (20%) 4% 6% 8% 10% 12% 14% 6 Note: Market data as of July 13, 2023. Source: FactSet,
public disclosure.

PRELIMINARY WORKING DRAFT – SUBJECT TO FURTHER REVIEW AND
MODIFICATION Implied Premium to HEP Valuation at Various Exchange Ratios and Consideration Mixes Discounted Cash Flow Analysis – Management Discounted Cash Flow Analysis – Sensitivity Low $52.35 $46.28 DINO Midpoint $58.11 $51.53
Standalone High $64.18 $57.08 All Equity Equity + Cash All Equity Equity + Cash Consideration 0.3714x 0.4500x 0.4750x 0.5000x 0.5250x 0.5500x 0.3714x 0.3714x 0.4500x 0.4750x 0.5000x 0.5250x 0.5500x 0.3714x Equity XR Mix $-- $6.00 $7.00 $8.00 $--
$6.00 $7.00 $8.00 Cash Consid. Low $19.44 $23.56 $24.87 $26.18 $27.49 $28.79 $25.44 $26.44 $27.44 $17.19 $20.83 $21.98 $23.14 $24.30 $25.45 $23.19 $24.19 $25.19 Implied HEP Unit Price Midpoint 21.58 26.15 27.60 29.05 30.51 31.96 27.58 28.58 29.58
19.14 23.19 24.48 25.77 27.06 28.34 25.14 26.14 27.14 (“Gets”) High 23.84 28.88 30.49 32.09 33.70 35.30 29.84 30.84 31.84 21.20 25.69 27.11 28.54 29.97 31.39 27.20 28.20 29.20 Low $20.86 $20.86 Standalone HEP Midpoint 23.79 23.79 Unit
Price (“Has”) 26.94 26.94 High Low (6.8%) 13.0% 19.2% 25.5% 31.8% 38.1% 22.0% 26.8% 31.6% (17.6%) (0.1%) 5.4% 11.0% 16.5% 22.1% 11.2% 16.0% 20.8% Implied Premium Midpoint (9.3%) 9.9% 16.0% 22.1% 28.2% 34.4% 15.9% 20.2% 24.4% (19.5%)
(2.5%) 2.9% 8.3% 13.7% 19.2% 5.7% 9.9% 14.1% (“Gets” vs. “Has”) High (11.5%) 7.2% 13.2% 19.1% 25.1% 31.0% 10.8% 14.5% 18.2% (21.3%) (4.6%) 0.6% 5.9% 11.2% 16.5% 1.0% 4.7% 8.4% 7 Note: Market data as of July 13, 2023. Source:
FactSet, public disclosure.

PRELIMINARY WORKING DRAFT – SUBJECT TO FURTHER REVIEW AND
MODIFICATION Implied Premiums and Valuation Metrics at Various Exchange Ratios HEP Consolidated DINO Proposal Proposal Precedents ($mm, unless per unit data) (Unaffected) (Current) Current Current (1) 0.3714x 0.3714x 0.4056x 0.4500x 0.4750x 0.5000x
0.5250x 0.5500x Median HEP/DINO Exchange Ratio $47.02 Implied HEP Unit Price (@ Current DINO) $15.57 $17.46 $19.07 $21.16 $22.33 $23.51 $24.69 $25.86 Metric Implied Prem./(Disc.) to Current (as of 7/13/23) 0.4056x (8%) (8%) -- 11% 17% 23% 29% 36%
Initial Proposal 0.3714x -- -- 9% 21% 28% 35% 41% 48% VWAP Since Proposal 0.4118x (10%) (10%) (2%) 9% 15% 21% 27% 34% Unaffected Close (as of 5/3/23) 0.3799x (2%) (2%) 7% 18% 25% 32% 38% 45% 10% Unaffected 10-Day VWAP 0.3872x (4%) (4%) 5% 16% 23%
29% 36% 42% 9% Unaffected 20-Day VWAP 0.3804x (2%) (2%) 7% 18% 25% 31% 38% 45% 7% Unaffected Unaffected 30-Day VWAP 0.3719x (0%) (0%) 9% 21% 28% 34% 41% 48% 8% Metrics Unaffected 60-Day VWAP 0.3677x 1% 1% 10% 22% 29% 36% 43% 50% 7% Unaffected 90-Day
VWAP 0.3648x 2% 2% 11% 23% 30% 37% 44% 51% 9% Unaffected 52-week High (05/03/22) 0.4378x (15%) (15%) (7%) 3% 8% 14% 20% 26% (11%) Unaffected 52-week Low (11/15/22) 0.2850x 30% 30% 42% 58% 67% 75% 84% 93% 27% Units Unit Ownership DINO 59.6 $928
$1,041 $1,137 $1,262 $1,332 $1,402 $1,472 $1,542 (2) Unaffiliated Public 67.0 $1,042 $1,170 $1,277 $1,417 $1,496 $1,574 $1,653 $1,732 (3) (x) Total Units/Shares Outstanding 126.6 193.9 Total Equity Value $1,971 $2,211 $2,414 $2,679 $2,828 $2,976
$3,125 $3,274 $9,119 (+) Debt 1,492 3,200 (4) (+) Non-Controlling Interests -- 1,277 (-) Cash (15) (1,500) Total Enterprise Value $3,448 $3,688 $3,891 $4,156 $4,305 $4,453 $4,602 $4,751 $12,096 LT&S / Small (5) Metric Cap. MLP Metric TEV/'23E
EBITDA $458 7.5x 8.1x 8.5x 9.1x 9.4x 9.7x 10.1x 10.4x 8.4x / 7.1x $3,191 3.8x TEV/'24E EBITDA 477 7.2x 7.7x 8.2x 8.7x 9.0x 9.3x 9.6x 10.0x 8.3x / 6.9x 2,842 4.3x 2023E DCF Yield $332 16.8% 15.0% 13.7% 12.4% 11.7% 11.1% 10.6% 10.1% 16.1% / 16.0%
2024E DCF Yield 349 17.7% 15.8% 14.5% 13.0% 12.3% 11.7% 11.2% 10.7% 17.9% / 16.8% (7) (6) (8) 2023E FCF Yield $322 16.3% 14.5% 13.3% 12.0% 11.4% 10.8% 10.3% 9.8% 11.3% / 10.3% $2,171 5.6x (7) (6) (8) 2024E FCF Yield 349 17.7% 15.8% 14.5% 13.0% 12.3%
11.7% 11.2% 10.7% 13.9% / 12.9% 1,896 6.4x LQA Dist. / Div. Yield $1.40 9.0% 8.0% 7.3% 6.6% 6.3% 6.0% 5.7% 5.4% 7.8% / 8.0% $1.80 3.8% Debt/LTM EBITDA $434 3.4x 4.4x / 4.4x $4,119 0.8x Note: Market data as of July 13, 2023. Balance sheet data as of
June 30, 2023E. For illustrative purposes, NCI reflects the current market value of HEP units not held by DINO. capitalization excludes finance leases. (5) LT&S peers include: DKL, NS, PAA. Small Cap. peers include CAPL, GEL, GLP. (1) Precedents
include all equity parent-MLP buy-in transactions. (6) Reflects DCF less growth capex. (2) Includes 116,154 phantom units and 43,365 performance units. (7) Reflects unlevered free cash flow (“UFCF”) and calculated as EBITDA less capex. 8
(3) Reflects fully diluted units and shares. (8) Reflects TEV / UFCF. (4) HEP cash flow metrics are shown net to HEP and therefore NCI is excluded from TEV. DINO Source: Company disclosure, Wall Street research, FactSet.

PRELIMINARY WORKING DRAFT – SUBJECT TO FURTHER REVIEW AND
MODIFICATION Illustrative HEP Unit Price Based on Peer Performance Unaffected Select Peer and Index Performance Implied Market Unit Price Through 7/13/23 Adj. HEP Market-adjusted HEP Unit Price at Illustrative Premiums (5/3/23) Benchmark Trading
Perf. Unit Price 10% 15% 20% 25% 30% AMNA Index +5.3% $16.76 $18.44 $19.28 $20.12 $20.95 $21.79 Prem. to Unaffected HEP Unit Price 15.8% 21.1% 26.4% 31.6% 36.9% Average of LT&S $15.92 +15.9% $18.45 $20.29 $21.21 $22.14 $23.06 $23.98 (1) Peers
Prem. to Unaffected HEP Unit Price 27.5% 33.3% 39.1% 44.8% 50.6% Average of Small (2.1%) $15.58 $17.14 $17.91 $18.69 $19.47 $20.25 (2) Cap MLP Peers Prem. to Unaffected HEP Unit Price 7.6% 12.5% 17.4% 22.3% 27.2% Note: Market data as of July 13,
2023. (1) Includes DKL, NS and PAA. 9 (2) Includes CAPL, GEL and GLP. Source: FactSet.

PRELIMINARY WORKING DRAFT – SUBJECT TO FURTHER REVIEW AND
MODIFICATION Disclaimer These materials have been prepared by Intrepid Partners, LLC (“Intrepid”) for the Conflicts Committee (the “Committee”) of the Board of Directors of Holly Logistic Services, L.L.C. (the “General
Partner”), the ultimate general partner of Holly Energy Partners, L.P. (“HEP”), to whom such materials are directly addressed and delivered. These materials are confidential and may not be used or relied upon by any other person or
for any purpose other than as specifically contemplated by a written agreement with Intrepid. These materials have been developed by and are proprietary to Intrepid and were prepared exclusively for the benefit and internal use of the Committee in
connection with evaluating the Proposed Transaction with HEP and HF Sinclair Corporation (“DINO”). These materials are based upon information provided by or on behalf of the management of DINO and the General Partner, from public
sources, or otherwise reviewed by Intrepid. Intrepid has relied upon and assumes no responsibility for independent investigation or verification of such information and has relied upon such information being complete and accurate in all material
respects. To the extent such information includes estimates and forecasts of future performance prepared by or reviewed with management of DINO or the General Partner and/or other potential transaction participants or obtained from public sources,
Intrepid has assumed that such estimates and forecasts have been reasonably prepared on bases reflecting the best currently available estimates and judgments of management of DINO, and the General Partner or such other potential transaction
participants (or, with respect to estimates and forecasts obtained from public sources, represent reasonable estimates). Actual results may differ materially from such estimates and forecasts. No representation or warranty, express or implied, is
made as to the accuracy or completeness of such information, and nothing contained herein is, or shall be relied upon as, a representation or warranty, whether as to the past, the present or the future. The materials and related commentary are not
intended to provide the only basis for evaluating, and should not be considered a recommendation with respect to, the consideration paid, the proposed transaction or any transaction or other matter. These materials are also subject to the
qualifications and limitations described in any accompanying written opinion letter. These materials were compiled on a confidential basis solely for use by the Committee and may not be relied on by any other party (including stakeholders in either
entity), even if such parties are provided a copy of these materials. These materials were prepared without a view to public disclosure or filing thereof under state or federal laws, and may not be redistributed, reproduced, distributed, passed to
others, transmitted, quoted or referred to, in whole or in part, without the prior written permission of Intrepid in accordance with the terms of our engagement letter with the Committee. These materials speak only as of the date on the cover and
Intrepid assumes no obligation to update these materials or inform any recipient of changed circumstances, events or information. These materials were prepared for a specific use by specific persons and were not prepared to conform with any
disclosure standards under securities laws or otherwise. In the ordinary course of its business, each of Intrepid and its affiliates may actively trade or hold the securities of DINO, HEP or other parties involved in a proposed transaction for its
own account or for the account of its customers and, accordingly, may at any time hold a long or short position in such securities. Intrepid will receive a fee in connection with delivery of an opinion relating to the proposed transaction. These
materials do not constitute, nor do they form part of, an offer or solicitation to sell or purchase any securities or instruments and are not a commitment by Intrepid or any of its affiliates to provide, arrange or underwrite any financing for any
transaction or to purchase any security in connection therewith. These materials may not reflect information known to other professionals in other business areas of Intrepid and its affiliates. Intrepid and its affiliates do not provide legal,
regulatory, accounting, bankruptcy, securities or tax advice. Any statements contained herein as to tax matters were neither written nor intended by Intrepid or its affiliates to be used and cannot be used by any taxpayer for the purpose of avoiding
tax penalties that may be imposed on such taxpayer. Each person should seek legal, regulatory accounting and tax advice based on his, her or its particular circumstances from independent advisors regarding the evaluation and impact of any
transactions or matters described herein.

PR PRELIM ELIMINAR INARY Y WOR WORKING KING DRAF DRAFT T – –
SUBJECT SUBJECT TO TO FUR FURTHE THER REV R REVIEW IEW AND AND MOD MODIFICAT IFICATION ION Exhibit (c)(3)(E) PROJECT APPLE DISCUSSION MATERIALS July 24, 2023

Volume (000) Volume (000) PRELIMINARY WORKING DRAFT – SUBJECT TO
FURTHER REVIEW AND MODIFICATION HEP and DINO Trading Analysis Since Proposal HEP Price Performance and Volume Since Proposal DINO Price Performance and Volume Since Proposal $53.00 8,000 $20.00 8,000 SMID Cap. Refining: $52.00 +25% 7,000 $51.00
7,000 $19.00 HEP: $18.97 $50.00 +19% 6,000 6,000 $49.00 DINO: $18.00 $48.96 LT&S: $48.00 +17% +11% 5,000 5,000 $47.00 Large Cap. $17.00 Refining: $46.00 +13% 4,000 4,000 MMP/OKE $45.00 XR: Announcement $16.00 +2% $44.00 $15.92 3,000 3,000 Small
Cap. $43.00 XR: MLPs: (2%) Unaffected 30-Day +2% $15.00 $42.00 ADTV: 2,547 2,000 2,000 $41.91 $41.00 $14.00 983,200-unit $40.00 1,000 1,000 trade at $16.44 $39.00 Unaffected 30-Day ADTV: 90 $13.00 -- $38.00 -- Volume HEP Volume DINO LT&S Peers
Small Cap. MLP Peers Exchange Ratio Large Cap. Refining Exchange Ratio Unaffected 30-Day ADTV (in '000s) SMID Cap. Refining Unaffected 30-Day ADTV (in '000s) Note: Market data as of July 21, 2023. LT&S Peers include: DKL, NS, PAA. Small Cap. MLP
peers include CAPL, GEL, GLP. Large Cap. Refining peers include MPC, PSX, VLO. SMID Cap. Refining 1 peers include CVI, DK, PARR, PBF, VTNR. Source: FactSet, company disclosure. Unit Price ($) | Indexed to HEP Share Price ($) | Indexed to
DINO

PRELIMINARY WORKING DRAFT – SUBJECT TO FURTHER REVIEW AND
MODIFICATION HEP and DINO Trading Analysis Since Proposal (Cont’d) Indexed Price Performance Since Proposal LT&S Peer Price Performance Since Proposal 140% DKL NS PAA $21.00 130% PAA: $14.77 +19% 120% NS: $17.39 110% +12% $20.00 DKL:
$46.48 100% +2% 90% HEP: $18.97 $19.00 +19% DINO: $48.96 +17% $18.00 LT&S: +11% $17.00 $16.00 $15.92 MMP/OKE $15.00 Announcement $14.00 HEP DINO LT&S Peers 2 Note: Market data as of July 21, 2023. LT&S Peers include: DKL, NS, PAA.
Source: FactSet, company disclosure. Unit Price ($) | Indexed to HEP

PRELIMINARY WORKING DRAFT – SUBJECT TO FURTHER REVIEW AND
MODIFICATION Negotiation Summary and Market Trading (1) HEP Peer Perf. Spot Price Negotiations (Consideration) Negotiations (HEP $/Unit) Prem./(Disc.) to HEP Unaff. 30-d (Cum. Since Date HEP DINO DINO CC DINO CC Spot VWAP ($17.10) Unaff.) 5/3/23
$15.92 $41.91 0.3714x $15.57 (2%) (9%) n/a 0.3714x + 7/13/23 $19.07 $47.02 $24.46 +28% +43% +16% $7.00 Cash 0.3150x + 7/21/23 $18.97 $48.96 $18.92 (0%) +11% +11% $3.50 Cash Note: Market data as of July 21, 2023. 3 (1) LT&S Peers include: DKL,
NS, PAA. Source: FactSet, company disclosure.

PRELIMINARY WORKING DRAFT – SUBJECT TO FURTHER REVIEW AND
MODIFICATION Implied Value Over Time – Proposals and Counterproposal Proposals and Counterproposal Value Over Time | Unaffected LTM to Current Average Value to HEP Unitholders $40 Consideration Mix Unaff. LTM Since Announcement 0.3714x + No
Cash $19.12 $16.21 0.3150x + $3.50 Cash $19.72 $17.25 $35 0.3714x + $7.00 Cash $26.12 $23.21 HEP $17.86 $17.82 $30 Unaffected Date (5/3/2023) $25.18 $25 $22.12 $20 $18.97 $17.82 $18.92 $18.18 $16.32 $15.12 $15 $10 May-22 Jul-22 Oct-22 Jan-23 Apr-23
Jul-23 0.3714x + No Cash 0.3150x + $3.50 Cash 0.3714x + $7.00 Cash HEP 4 Note: Market data as of July 21, 2023. Source: FactSet. Implied Value to HEP Unitholders

PRELIMINARY WORKING DRAFT – SUBJECT TO FURTHER REVIEW AND
MODIFICATION Illustrative Consideration Mix Analysis at Proposals Implied Purchase Price (@ Current DINO - $48.96) Equity 0.3714x 0.3150x 0.3714x $0.00 $3.50 $7.00 Cash Value $18.18 $18.92 $25.18 % Cash Consideration 0% 18% 28% Precedents - All
Precedents - Since 1/1/22 Low Median High Low Median High Prem./(Disc.) to Unaff. Close ($15.92) 14% 19% 58% (9%) 11% 56% 17% 23% 34% Prem./(Disc.) to Unaff. 30-d VWAP ($17.10) 6% 11% 47% 0% 10% 47% 9% 25% 47% (1) Prem./(Disc.) to LT&S Market
Adj. HEP Price ($17.70) 3% 7% 42% Prem./(Disc.) to Current ($18.97) (4%) (0%) 33% Prem./(Disc.) to Unaff. 52-week High ($20.00) (9%) (5%) 26% (61%) (10%) 12% (32%) (2%) 6% Median Prem./(Disc.) to High of Research Target Prices ($20.00) (9%) (5%) 26%
DKL NS PAA LT&S Small Cap. Implied TEV/'23E EBITDA 8.3x 8.5x 10.2x 9.9x 8.5x 8.0x 8.5x 7.1x Implied '23E DCF Yield 14.4% 13.9% 10.4% 14.4% 18.5% 16.0% 16.0% 16.4% Implied '23E DPU Yield 7.7% 7.4% 5.6% 8.9% 9.2% 7.3% 8.9% 8.3% Precedents - 100%
Equity Low Median High Implied All-in XR (@ Current DINO) 0.3714x 0.3865x 0.5144x Prem./(Disc.) to Unaff. Close (0.3799x) (2%) 2% 35% (1%) 10% 34% Prem./(Disc.) to Unaff. 30-d VWAP (0.3719x) (0%) 4% 38% 0% 8% 22% Prem./(Disc.) to Current (0.3875x)
(4%) (0%) 33% Implied Purchase Price (@ DINO DCF Midpoint - $58.11) Equity 0.3714x 0.3150x 0.3714x $0.00 $3.50 $7.00 Cash Value $21.58 $21.80 $28.58 Uplift/(Dec.) vs. HEP Has @ DCF Midpoint ($23.79) (9%) (8%) 20% Implied Purchase Price (@ DINO
Sensitivity DCF Midpoint - $51.53) Equity 0.3714x 0.3150x 0.3714x $0.00 $3.50 $7.00 Cash Value $19.14 $19.73 $26.14 Uplift/(Dec.) vs. HEP Has @ DCF Midpoint ($23.79) (20%) (17%) 10% Note: Market data as of July 21, 2023. 5 (1) Represents
hypothetical HEP price if HEP traded in-line with average of LT&S peers since the unaffected date. Source: FactSet, public disclosure.

PRELIMINARY WORKING DRAFT – SUBJECT TO FURTHER REVIEW AND
MODIFICATION Illustrative Consideration Mix Analysis at Constant 0.3714x Exchange Ratio Implied Purchase Price (@ Current DINO - $48.96) Equity 0.3714x 0.3150x 0.3714x 0.3714x 0.3714x 0.3714x 0.3714x 0.3714x $0.00 $3.50 $2.00 $3.00 $4.00 $5.00 $6.00
$7.00 Cash Value $18.18 $18.92 $20.18 $21.18 $22.18 $23.18 $24.18 $25.18 Precedents - All Precedents - Since 1/1/22 % Cash Consideration 0% 18% 10% 14% 18% 22% 25% 28% Low Median High Low Median High Prem./(Disc.) to Unaff. Close ($15.92) 14% 19%
27% 33% 39% 46% 52% 58% (9%) 11% 56% 17% 23% 34% Prem./(Disc.) to Unaff. 30-d VWAP ($17.10) 6% 11% 18% 24% 30% 36% 41% 47% 0% 10% 47% 9% 25% 47% (1) Prem./(Disc.) to LT&S Market Adj. HEP Price ($17.70) 3% 7% 14% 20% 25% 31% 37% 42% Prem./(Disc.)
to Current ($18.97) (4%) (0%) 6% 12% 17% 22% 27% 33% Prem./(Disc.) to Unaff. 52-week High ($20.00) (9%) (5%) 1% 6% 11% 16% 21% 26% (61%) (10%) 12% (32%) (2%) 6% Prem./(Disc.) to High of Research Target Prices ($20.00) (9%) (5%) 1% 6% 11% 16% 21% 26%
Median DKL NS PAA LT&S Small Cap. Implied TEV/'23E EBITDA 8.3x 8.5x 8.8x 9.1x 9.4x 9.6x 9.9x 10.2x 9.9x 8.5x 8.0x 8.5x 7.1x Implied '23E DCF Yield 14.4% 13.9% 13.0% 12.4% 11.8% 11.3% 10.8% 10.4% 14.4% 18.5% 16.0% 16.0% 16.4% Implied '23E DPU
Yield 7.7% 7.4% 6.9% 6.6% 6.3% 6.0% 5.8% 5.6% 8.9% 9.2% 7.3% 8.9% 8.3% Precedents - 100% Equity Implied All-in XR (@ Current DINO) 0.3714x 0.3865x 0.4122x 0.4327x 0.4531x 0.4735x 0.4939x 0.5144x Low Median High Prem./(Disc.) to Unaff. Close
(0.3799x) (2%) 2% 9% 14% 19% 25% 30% 35% (1%) 10% 34% Prem./(Disc.) to Unaff. 30-d VWAP (0.3719x) (0%) 4% 11% 16% 22% 27% 33% 38% 0% 8% 22% Prem./(Disc.) to Current (0.3875x) (4%) (0%) 6% 12% 17% 22% 27% 33% Implied Purchase Price (@ DINO DCF
Midpoint - $58.11) Equity 0.3714x 0.3150x 0.3714x 0.3714x 0.3714x 0.3714x 0.3714x 0.3714x $0.00 $3.50 $2.00 $3.00 $4.00 $5.00 $6.00 $7.00 Cash Value $21.58 $21.80 $23.58 $24.58 $25.58 $26.58 $27.58 $28.58 Uplift/(Dec.) vs. HEP Has @ DCF Midpoint
($23.79) (9%) (8%) (1%) 3% 8% 12% 16% 20% Implied Purchase Price (@ DINO Sensitivity DCF Midpoint - $51.53) Equity 0.3714x 0.3150x 0.3714x 0.3714x 0.3714x 0.3714x 0.3714x 0.3714x $0.00 $3.50 $2.00 $3.00 $4.00 $5.00 $6.00 $7.00 Cash Value $19.14
$19.73 $21.14 $22.14 $23.14 $24.14 $25.14 $26.14 Uplift/(Dec.) vs. HEP Has @ DCF Midpoint ($23.79) (20%) (17%) (11%) (7%) (3%) 1% 6% 10% Note: Market data as of July 21, 2023. 6 (1) Represents hypothetical HEP price if HEP traded in-line with
average of LT&S peers since the unaffected date. Source: FactSet, public disclosure.

PRELIMINARY WORKING DRAFT – SUBJECT TO FURTHER REVIEW AND
MODIFICATION Illustrative Consideration Mix Analysis at Various Prices Assumed Purchase Price Current $18.97 $19.50 $20.00 $20.50 $21.00 $21.50 $22.00 $22.50 $23.00 Precedents - All Precedents - Since 1/1/22 Low Median High Low Median High
Prem./(Disc.) to Unaff. Close ($15.92) 19% 22% 26% 29% 32% 35% 38% 41% 44% (9%) 11% 56% 17% 23% 34% Prem./(Disc.) to Unaff. 30-d VWAP ($17.10) 11% 14% 17% 20% 23% 26% 29% 32% 35% 0% 10% 47% 9% 25% 47% (1) Prem./(Disc.) to LT&S Market Adj. HEP
Price ($17.70) 7% 10% 13% 16% 19% 21% 24% 27% 30% Prem./(Disc.) to Current ($18.97) 0% 3% 5% 8% 11% 13% 16% 19% 21% Prem./(Disc.) to Unaff. 52-week High ($20.00) (5%) (3%) 0% 2% 5% 8% 10% 13% 15% (61%) (10%) 12% (32%) (2%) 6% Median Prem./(Disc.) to
High of Research Target Prices ($20.00) (5%) (3%) 0% 2% 5% 8% 10% 13% 15% DKL NS PAA LT&S Small Cap. Implied TEV/'23E EBITDA 8.5x 8.6x 8.8x 8.9x 9.0x 9.2x 9.3x 9.5x 9.6x 9.9x 8.5x 8.0x 8.5x 7.1x Implied '23E DCF Yield 13.8% 13.4% 13.1% 12.8%
12.5% 12.2% 11.9% 11.6% 11.4% 14.4% 18.5% 16.0% 16.0% 16.4% Implied '23E DPU Yield 7.4% 7.2% 7.0% 6.8% 6.7% 6.5% 6.4% 6.2% 6.1% 8.9% 9.2% 7.3% 8.9% 8.3% Precedents - 100% Equity Low Median High Implied All-in XR (@ Current DINO) 0.3875x 0.3983x
0.4085x 0.4187x 0.4289x 0.4391x 0.4493x 0.4596x 0.4698x Prem./(Disc.) to Unaff. Close (0.3799x) 2% 5% 8% 10% 13% 16% 18% 21% 24% (1%) 10% 34% Prem./(Disc.) to Unaff. 30-d VWAP (0.3719x) 4% 7% 10% 13% 15% 18% 21% 24% 26% 0% 8% 22% Prem./(Disc.) to
Current (0.3875x) 0% 3% 5% 8% 11% 13% 16% 19% 21% Note: Market data as of July 21, 2023. 7 (1) Represents hypothetical HEP price if HEP traded in-line with average of LT&S peers since the unaffected date. Source: FactSet, public
disclosure.

PRELIMINARY WORKING DRAFT – SUBJECT TO FURTHER REVIEW AND
MODIFICATION Illustrative Exchange Ratio Matrix Implied Exchange Ratio at Various Purchase Prices and Cash Consideration Purchase Price ($/Unit) $0.32 $18.92 $19.50 $20.00 $20.50 $21.00 $21.50 $22.00 $22.50 $23.00 $3.50 0.3150x 0.3268x 0.3370x
0.3472x 0.3574x 0.3676x 0.3779x 0.3881x 0.3983x $4.00 0.3047x 0.3166x 0.3268x 0.3370x 0.3472x 0.3574x 0.3676x 0.3779x 0.3881x $4.50 0.2945x 0.3064x 0.3166x 0.3268x 0.3370x 0.3472x 0.3574x 0.3676x 0.3779x $5.00 0.2843x 0.2962x 0.3064x 0.3166x 0.3268x
0.3370x 0.3472x 0.3574x 0.3676x $5.50 0.2741x 0.2859x 0.2962x 0.3064x 0.3166x 0.3268x 0.3370x 0.3472x 0.3574x $6.00 0.2639x 0.2757x 0.2859x 0.2962x 0.3064x 0.3166x 0.3268x 0.3370x 0.3472x $6.50 0.2537x 0.2655x 0.2757x 0.2859x 0.2962x 0.3064x 0.3166x
0.3268x 0.3370x $7.00 0.2435x 0.2553x 0.2655x 0.2757x 0.2859x 0.2962x 0.3064x 0.3166x 0.3268x 8 Note: Market data as of July 21, 2023. Source: FactSet, company disclosure. Cash Consideration ($/Unit)

PRELIMINARY WORKING DRAFT – SUBJECT TO FURTHER REVIEW AND
MODIFICATION APPENDIX 9

PRELIMINARY WORKING DRAFT – SUBJECT TO FURTHER REVIEW AND
MODIFICATION Illustrative Consideration Mix Analysis at Constant 0.3150x Exchange Ratio Implied Purchase Price (@ Current DINO - $48.96) Equity 0.3714x 0.3714x 0.3150x 0.3150x 0.3150x 0.3150x 0.3150x Cash $0.00 $7.00 $3.50 $4.50 $5.50 $6.50 $7.00
Value $18.18 $25.18 $18.92 $19.92 $20.92 $21.92 $22.42 Precedents - All Precedents - Since 1/1/22 % Cash Consideration 0% 28% 18% 23% 26% 30% 31% Low Median High Low Median High Prem./(Disc.) to Unaff. Close ($15.92) 14% 58% 19% 25% 31% 38% 41% (9%)
11% 56% 17% 23% 34% Prem./(Disc.) to Unaff. 30-d VWAP ($17.10) 6% 47% 11% 17% 22% 28% 31% 0% 10% 47% 9% 25% 47% (1) Prem./(Disc.) to LT&S Market Adj. HEP Price ($17.70) 3% 42% 7% 13% 18% 24% 27% Prem./(Disc.) to Current ($18.97) (4%) 33% (0%) 5%
10% 16% 18% Prem./(Disc.) to Unaff. 52-week High ($20.00) (9%) 26% (5%) (0%) 5% 10% 12% (61%) (10%) 12% (32%) (2%) 6% Prem./(Disc.) to High of Research Target Prices ($20.00) (9%) 26% (5%) (0%) 5% 10% 12% Median DKL NS PAA LT&S Small Cap.
Implied TEV/'23E EBITDA 8.3x 10.2x 8.5x 8.7x 9.0x 9.3x 9.4x 9.9x 8.5x 8.0x 8.5x 7.1x Implied '23E DCF Yield 14.4% 10.4% 13.9% 13.2% 12.5% 12.0% 11.7% 14.4% 18.5% 16.0% 16.0% 16.4% Implied '23E DPU Yield 7.7% 5.6% 7.4% 7.0% 6.7% 6.4% 6.2% 8.9% 9.2%
7.3% 8.9% 8.3% Precedents - 100% Equity Low Median High Implied All-in XR (@ Current DINO) 0.3714x 0.5144x 0.3865x 0.4069x 0.4273x 0.4478x 0.4580x Prem./(Disc.) to Unaff. Close (0.3799x) (2%) 35% 2% 7% 12% 18% 21% (1%) 10% 34% Prem./(Disc.) to
Unaff. 30-d VWAP (0.3719x) (0%) 38% 4% 9% 15% 20% 23% 0% 8% 22% Prem./(Disc.) to Current (0.3875x) (4%) 33% (0%) 5% 10% 16% 18% Implied Purchase Price (@ DINO DCF Midpoint - $58.11) Equity 0.3714x 0.3714x 0.3150x 0.3150x 0.3150x 0.3150x 0.3150x
$0.00 $7.00 $3.50 $4.50 $5.50 $6.50 $7.00 Cash Value $21.58 $28.58 $21.80 $22.80 $23.80 $24.80 $25.30 Uplift/(Dec.) vs. HEP Has @ DCF Midpoint ($23.79) (9%) 20% (8%) (4%) 0% 4% 6% Implied Purchase Price (@ DINO Sensitivity DCF Midpoint - $51.53)
Equity 0.3714x 0.3714x 0.3150x 0.3150x 0.3150x 0.3150x 0.3150x $0.00 $7.00 $3.50 $4.50 $5.50 $6.50 $7.00 Cash Value $19.14 $26.14 $19.73 $20.73 $21.73 $22.73 $23.23 Uplift/(Dec.) vs. HEP Has @ DCF Midpoint ($23.79) (20%) 10% (17%) (13%) (9%) (4%)
(2%) Note: Market data as of July 21, 2023. 10 (1) Represents hypothetical HEP price if HEP traded in-line with average of LT&S peers since the unaffected date. Source: FactSet, public disclosure.

PRELIMINARY WORKING DRAFT – SUBJECT TO FURTHER REVIEW AND
MODIFICATION Illustrative Consideration Mix Analysis at Constant $3.50/Unit Cash Implied Purchase Price (@ Current DINO - $48.96) Equity 0.3714x 0.3714x 0.3150x 0.3250x 0.3500x 0.3750x 0.4000x 0.4250x $0.00 $7.00 $3.50 $3.50 $3.50 $3.50 $3.50 $3.50
Cash Value $18.18 $25.18 $18.92 $19.41 $20.64 $21.86 $23.08 $24.31 Precedents - All Precedents - Since 1/1/22 % Cash Consideration 0% 28% 18% 18% 17% 16% 15% 14% Low Median High Low Median High Prem./(Disc.) to Unaff. Close ($15.92) 14% 58% 19% 22%
30% 37% 45% 53% (9%) 11% 56% 17% 23% 34% Prem./(Disc.) to Unaff. 30-d VWAP ($17.10) 6% 47% 11% 14% 21% 28% 35% 42% 0% 10% 47% 9% 25% 47% (1) Prem./(Disc.) to LT&S Market Adj. HEP Price ($17.70) 3% 42% 7% 10% 17% 23% 30% 37% Prem./(Disc.) to
Current ($18.97) (4%) 33% (0%) 2% 9% 15% 22% 28% Prem./(Disc.) to Unaff. 52-week High ($20.00) (9%) 26% (5%) (3%) 3% 9% 15% 22% (61%) (10%) 12% (32%) (2%) 6% Prem./(Disc.) to High of Research Target Prices ($20.00) (9%) 26% (5%) (3%) 3% 9% 15% 22%
Median DKL NS PAA LT&S Small Cap. Implied TEV/'23E EBITDA 8.3x 10.2x 8.5x 8.6x 8.9x 9.3x 9.6x 10.0x 9.9x 8.5x 8.0x 8.5x 7.1x Implied '23E DCF Yield 14.4% 10.4% 13.9% 13.5% 12.7% 12.0% 11.4% 10.8% 14.4% 18.5% 16.0% 16.0% 16.4% Implied '23E DPU
Yield 7.7% 5.6% 7.4% 7.2% 6.8% 6.4% 6.1% 5.8% 8.9% 9.2% 7.3% 8.9% 8.3% Precedents - 100% Equity Implied All-in XR (@ Current DINO) 0.3714x 0.5144x 0.3865x 0.3965x 0.4215x 0.4465x 0.4715x 0.4965x Low Median High Prem./(Disc.) to Unaff. Close
(0.3799x) (2%) 35% 2% 4% 11% 18% 24% 31% (1%) 10% 34% Prem./(Disc.) to Unaff. 30-d VWAP (0.3719x) (0%) 38% 4% 7% 13% 20% 27% 34% 0% 8% 22% Prem./(Disc.) to Current (0.3875x) (4%) 33% (0%) 2% 9% 15% 22% 28% Implied Purchase Price (@ DINO DCF Midpoint
- $58.11) Equity 0.3714x 0.3714x 0.3150x 0.3250x 0.3500x 0.3750x 0.4000x 0.4250x $0.00 $7.00 $3.50 $3.50 $3.50 $3.50 $3.50 $3.50 Cash Value $21.58 $28.58 $21.80 $22.38 $23.84 $25.29 $26.74 $28.20 Uplift/(Dec.) vs. HEP Has @ DCF Midpoint ($23.79)
(9%) 20% (8%) (6%) 0% 6% 12% 19% Implied Purchase Price (@ DINO Sensitivity DCF Midpoint - $51.53) Equity 0.3714x 0.3714x 0.3150x 0.3250x 0.3500x 0.3750x 0.4000x 0.4250x $0.00 $7.00 $3.50 $3.50 $3.50 $3.50 $3.50 $3.50 Cash Value $19.14 $26.14 $19.73
$20.25 $21.54 $22.83 $24.11 $25.40 Uplift/(Dec.) vs. HEP Has @ DCF Midpoint ($23.79) (20%) 10% (17%) (15%) (9%) (4%) 1% 7% Note: Market data as of July 21, 2023. 11 (1) Represents hypothetical HEP price if HEP traded in-line with average of LT&S
peers since the unaffected date. Source: FactSet, public disclosure.

PRELIMINARY WORKING DRAFT – SUBJECT TO FURTHER REVIEW AND
MODIFICATION Disclaimer These materials have been prepared by Intrepid Partners, LLC (“Intrepid”) for the Conflicts Committee (the “Committee”) of the Board of Directors of Holly Logistic Services, L.L.C. (the “General
Partner”), the ultimate general partner of Holly Energy Partners, L.P. (“HEP”), to whom such materials are directly addressed and delivered. These materials are confidential and may not be used or relied upon by any other person or
for any purpose other than as specifically contemplated by a written agreement with Intrepid. These materials have been developed by and are proprietary to Intrepid and were prepared exclusively for the benefit and internal use of the Committee in
connection with evaluating the Proposed Transaction with HEP and HF Sinclair Corporation (“DINO”). These materials are based upon information provided by or on behalf of the management of DINO and the General Partner, from public
sources, or otherwise reviewed by Intrepid. Intrepid has relied upon and assumes no responsibility for independent investigation or verification of such information and has relied upon such information being complete and accurate in all material
respects. To the extent such information includes estimates and forecasts of future performance prepared by or reviewed with management of DINO or the General Partner and/or other potential transaction participants or obtained from public sources,
Intrepid has assumed that such estimates and forecasts have been reasonably prepared on bases reflecting the best currently available estimates and judgments of management of DINO, and the General Partner or such other potential transaction
participants (or, with respect to estimates and forecasts obtained from public sources, represent reasonable estimates). Actual results may differ materially from such estimates and forecasts. No representation or warranty, express or implied, is
made as to the accuracy or completeness of such information, and nothing contained herein is, or shall be relied upon as, a representation or warranty, whether as to the past, the present or the future. The materials and related commentary are not
intended to provide the only basis for evaluating, and should not be considered a recommendation with respect to, the consideration paid, the proposed transaction or any transaction or other matter. These materials are also subject to the
qualifications and limitations described in any accompanying written opinion letter. These materials were compiled on a confidential basis solely for use by the Committee and may not be relied on by any other party (including stakeholders in either
entity), even if such parties are provided a copy of these materials. These materials were prepared without a view to public disclosure or filing thereof under state or federal laws, and may not be redistributed, reproduced, distributed, passed to
others, transmitted, quoted or referred to, in whole or in part, without the prior written permission of Intrepid in accordance with the terms of our engagement letter with the Committee. These materials speak only as of the date on the cover and
Intrepid assumes no obligation to update these materials or inform any recipient of changed circumstances, events or information. These materials were prepared for a specific use by specific persons and were not prepared to conform with any
disclosure standards under securities laws or otherwise. In the ordinary course of its business, each of Intrepid and its affiliates may actively trade or hold the securities of DINO, HEP or other parties involved in a proposed transaction for its
own account or for the account of its customers and, accordingly, may at any time hold a long or short position in such securities. Intrepid will receive a fee in connection with delivery of an opinion relating to the proposed transaction. These
materials do not constitute, nor do they form part of, an offer or solicitation to sell or purchase any securities or instruments and are not a commitment by Intrepid or any of its affiliates to provide, arrange or underwrite any financing for any
transaction or to purchase any security in connection therewith. These materials may not reflect information known to other professionals in other business areas of Intrepid and its affiliates. Intrepid and its affiliates do not provide legal,
regulatory, accounting, bankruptcy, securities or tax advice. Any statements contained herein as to tax matters were neither written nor intended by Intrepid or its affiliates to be used and cannot be used by any taxpayer for the purpose of avoiding
tax penalties that may be imposed on such taxpayer. Each person should seek legal, regulatory accounting and tax advice based on his, her or its particular circumstances from independent advisors regarding the evaluation and impact of any
transactions or matters described herein.

PR PRELIM ELIMINAR INARY Y WOR WORKING KING DRAF DRAFT T – –
SUBJECT SUBJECT TO TO FUR FURTHE THER REV R REVIEW IEW AND AND MOD MODIFICAT IFICATION ION Exhibit (c)(3)(F) PROJECT APPLE DISCUSSION MATERIALS July 27, 2023

Exchange Ratio (x) PRELIMINARY WORKING DRAFT – SUBJECT TO FURTHER
REVIEW AND MODIFICATION HEP and DINO Trading Analysis Since Proposal Indexed Price Performance Since Proposal LT&S Peer Price Performance Since Proposal 140% DKL NS PAA PAA: $14.95 130% $21.00 0.4400x +21% 120% NS: $17.18 110% +10% 100% DKL:
$45.16 0.4300x (1%) $20.00 90% HEP: $19.38 +22% 0.4200x DINO: $50.90 $19.00 +21% 0.4100x $18.00 0.4000x LT&S: +10% 0.3900x $17.00 XR: 0.3807x +0% 0.3799x 0.3800x $16.00 $15.92 0.3700x MMP/OKE Announcement $15.00 0.3600x $14.00 0.3500x HEP DINO
LT&S Peers Exchange Ratio 1 Note: Market data as of July 26, 2023. LT&S Peers include: DKL, NS, PAA. Source: FactSet, company disclosure. Unit Price ($) | Indexed to HEP

Volume (000) Volume (000) PRELIMINARY WORKING DRAFT – SUBJECT TO
FURTHER REVIEW AND MODIFICATION HEP and DINO Trading Analysis Since Proposal (Cont’d) HEP Price Performance and Volume Since Proposal DINO Price Performance and Volume Since Proposal $20.00 8,000 $54.00 8,000 SMID Cap. HEP: Refining: $53.00
$19.38 +26% +22% 7,000 $52.00 7,000 $19.00 DINO: $51.00 $50.90 +21% 6,000 $50.00 6,000 $18.00 Large Cap. $49.00 Refining: LT&S: +17% +10% 5,000 $48.00 5,000 Small Cap. $17.00 $47.00 MLPs: +1% 4,000 $46.00 4,000 MMP/OKE XR: Announcement $45.00
$16.00 +0% $15.92 3,000 $44.00 3,000 $43.00 Unaffected 30-Day $15.00 XR: +0% ADTV: 2,547 2,000 $42.00 2,000 $41.91 $41.00 983,200-unit $14.00 1,000 $40.00 1,000 trade at $16.44 $39.00 Unaffected 30-Day ADTV: 90 $13.00 -- $38.00 -- Volume HEP Volume
DINO LT&S Peers Small Cap. MLP Peers Exchange Ratio Large Cap. Refining Exchange Ratio Unaffected 30-Day ADTV (in '000s) SMID Cap. Refining Unaffected 30-Day ADTV (in '000s) Note: Market data as of July 26, 2023. LT&S Peers include: DKL, NS,
PAA. Small Cap. MLP peers include CAPL, GEL, GLP. Large Cap. Refining peers include MPC, PSX, VLO. SMID Cap. Refining 2 peers include CVI, DK, PARR, PBF, VTNR. Source: FactSet, company disclosure. Unit Price ($) | Indexed to HEP Share Price ($) |
Indexed to DINO

PRELIMINARY WORKING DRAFT – SUBJECT TO FURTHER REVIEW AND
MODIFICATION Negotiation Summary and Market Trading (1) HEP Peer Perf. Spot Price Negotiations (Consideration) Negotiations (HEP $/Unit) Prem./(Disc.) to HEP Unaff. 30-d (Cum. Since VWAP ($17.10) Unaff.) Date HEP DINO DINO CC DINO CC Spot 5/3/23
$15.92 $41.91 0.3714x $15.57 (2%) (9%) n/a 0.3714x + 7/13/23 $19.07 $47.02 $24.46 +28% +43% +16% $7.00 Cash 0.3150x + 7/21/23 $18.97 $48.96 $18.92 (0%) +11% +11% $3.50 Cash 7/21/23 DINO Offer 0.3150x + $19.38 $50.90 $19.53 1% +14% +10% at Current
$3.50 Cash Prices Note: Market data as of July 26, 2023. 3 (1) LT&S Peers include: DKL, NS, PAA. Source: FactSet, company disclosure.

PRELIMINARY WORKING DRAFT – SUBJECT TO FURTHER REVIEW AND
MODIFICATION Implied Value Over Time – Proposals and Counterproposal Proposals and Counterproposal Value Over Time | Unaffected LTM to Current Average Value to HEP Unitholders $40 Consideration Mix Unaff. LTM Since Announcement 0.3714x + No
Cash $19.12 $16.34 0.3150x + $3.50 $19.72 $17.36 $35 0.3714x + $7.00 $26.12 $23.34 HEP $17.86 $17.91 $30 Unaffected Date (5/3/2023) $25.90 $25 $22.12 $19.53 $20 $19.38 $17.82 $18.90 $16.32 $15.12 $15 $10 May-22 Jul-22 Oct-22 Jan-23 Apr-23 Jul-23
0.3714x + No Cash 0.3150x + $3.50 0.3714x + $7.00 HEP 4 Note: Market data as of July 26, 2023. Source: FactSet. Implied Value to HEP Unitholders

PRELIMINARY WORKING DRAFT – SUBJECT TO FURTHER REVIEW AND
MODIFICATION Illustrative Consideration Mix Analysis at Constant 0.3714x Exchange Ratio Implied Purchase Price (@ Current DINO - $50.90) Equity 0.3714x 0.3150x 0.3714x 0.3714x 0.3714x 0.3714x 0.3714x 0.3714x Cash $0.00 $3.50 $2.00 $3.00 $4.00 $5.00
$6.00 $7.00 Value $18.90 $19.53 $20.90 $21.90 $22.90 $23.90 $24.90 $25.90 Precedents - All Precedents - Since 1/1/22 % Cash Consideration 0% 18% 10% 14% 17% 21% 24% 27% Low Median High Low Median High Prem./(Disc.) to Unaff. Close ($15.92) 19% 23%
31% 38% 44% 50% 56% 63% (9%) 11% 56% 17% 23% 34% Prem./(Disc.) to Unaff. 30-d VWAP ($17.10) 11% 14% 22% 28% 34% 40% 46% 51% 0% 10% 47% 9% 25% 47% (1) Prem./(Disc.) to LT&S Market Adj. HEP Price ($17.55) 8% 11% 19% 25% 30% 36% 42% 48%
Prem./(Disc.) to Current ($19.38) (2%) 1% 8% 13% 18% 23% 29% 34% Prem./(Disc.) to Unaff. 52-week High ($20.00) (5%) (2%) 5% 10% 15% 20% 25% 30% (61%) (10%) 12% (32%) (2%) 6% Median Prem./(Disc.) to High of Research Target Prices ($20.00) (5%) (2%)
5% 10% 15% 20% 25% 30% DKL NS PAA LT&S Small Cap. Implied TEV/'23E EBITDA 8.5x 8.6x 9.0x 9.3x 9.6x 9.8x 10.1x 10.4x 9.7x 8.4x 8.1x 8.4x 7.1x Implied '23E DCF Yield 13.9% 13.4% 12.5% 12.0% 11.4% 11.0% 10.5% 10.1% 14.8% 18.7% 15.8% 15.8% 15.8%
Implied '23E DPU Yield 7.4% 7.2% 6.7% 6.4% 6.1% 5.9% 5.6% 5.4% 9.2% 9.3% 7.2% 9.2% 8.0% Precedents - 100% Equity Implied All-in XR (@ Current DINO) 0.3714x 0.3838x 0.4107x 0.4303x 0.4500x 0.4696x 0.4893x 0.5089x Low Median High Prem./(Disc.) to
Unaff. Close (0.3799x) (2%) 1% 8% 13% 18% 24% 29% 34% (1%) 10% 34% Prem./(Disc.) to Unaff. 30-d VWAP (0.3719x) (0%) 3% 10% 16% 21% 26% 32% 37% 0% 8% 22% Prem./(Disc.) to Current (0.3807x) (2%) 1% 8% 13% 18% 23% 29% 34% Implied Purchase Price (@ DINO
DCF Midpoint - $62.25) Equity 0.3714x 0.3150x 0.3714x 0.3714x 0.3714x 0.3714x 0.3714x 0.3714x $0.00 $3.50 $2.00 $3.00 $4.00 $5.00 $6.00 $7.00 Cash Value $23.12 $23.11 $25.12 $26.12 $27.12 $28.12 $29.12 $30.12 Uplift/(Dec.) vs. HEP Has @ DCF Midpoint
($23.79) (3%) (3%) 6% 10% 14% 18% 22% 27% Implied Purchase Price (@ DINO Sensitivity DCF Midpoint - $55.32) Equity 0.3714x 0.3150x 0.3714x 0.3714x 0.3714x 0.3714x 0.3714x 0.3714x $0.00 $3.50 $2.00 $3.00 $4.00 $5.00 $6.00 $7.00 Cash Value $20.55
$20.93 $22.55 $23.55 $24.55 $25.55 $26.55 $27.55 Uplift/(Dec.) vs. HEP Has @ DCF Midpoint ($23.79) (14%) (12%) (5%) (1%) 3% 7% 12% 16% Implied Purchase Price (@ DINO Trading Comps Midpoint - $55.78) Equity 0.3714x 0.3150x 0.3714x 0.3714x 0.3714x
0.3714x 0.3714x 0.3714x $0.00 $3.50 $2.00 $3.00 $4.00 $5.00 $6.00 $7.00 Cash Value $20.72 $21.07 $22.72 $23.72 $24.72 $25.72 $26.72 $27.72 Uplift/(Dec.) vs. HEP Has @ Trading Comps Midpoint ($18.31) 13% 15% 24% 30% 35% 40% 46% 51% Note: Market data
as of July 26, 2023. 5 (1) Represents hypothetical HEP price if HEP traded in-line with average of LT&S peers since the unaffected date. Source: FactSet, public disclosure.
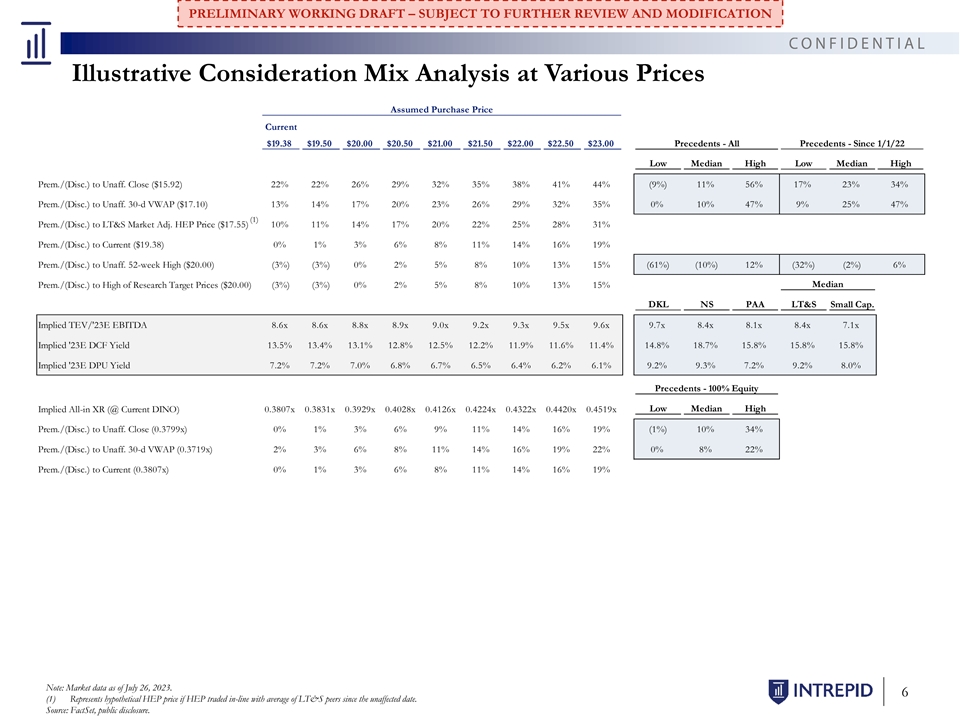
PRELIMINARY WORKING DRAFT – SUBJECT TO FURTHER REVIEW AND
MODIFICATION Illustrative Consideration Mix Analysis at Various Prices Assumed Purchase Price Current $19.38 $19.50 $20.00 $20.50 $21.00 $21.50 $22.00 $22.50 $23.00 Precedents - All Precedents - Since 1/1/22 Low Median High Low Median High
Prem./(Disc.) to Unaff. Close ($15.92) 22% 22% 26% 29% 32% 35% 38% 41% 44% (9%) 11% 56% 17% 23% 34% Prem./(Disc.) to Unaff. 30-d VWAP ($17.10) 13% 14% 17% 20% 23% 26% 29% 32% 35% 0% 10% 47% 9% 25% 47% (1) Prem./(Disc.) to LT&S Market Adj. HEP
Price ($17.55) 10% 11% 14% 17% 20% 22% 25% 28% 31% Prem./(Disc.) to Current ($19.38) 0% 1% 3% 6% 8% 11% 14% 16% 19% Prem./(Disc.) to Unaff. 52-week High ($20.00) (3%) (3%) 0% 2% 5% 8% 10% 13% 15% (61%) (10%) 12% (32%) (2%) 6% Prem./(Disc.) to High
of Research Target Prices ($20.00) (3%) (3%) 0% 2% 5% 8% 10% 13% 15% Median DKL NS PAA LT&S Small Cap. Implied TEV/'23E EBITDA 8.6x 8.6x 8.8x 8.9x 9.0x 9.2x 9.3x 9.5x 9.6x 9.7x 8.4x 8.1x 8.4x 7.1x Implied '23E DCF Yield 13.5% 13.4% 13.1% 12.8%
12.5% 12.2% 11.9% 11.6% 11.4% 14.8% 18.7% 15.8% 15.8% 15.8% Implied '23E DPU Yield 7.2% 7.2% 7.0% 6.8% 6.7% 6.5% 6.4% 6.2% 6.1% 9.2% 9.3% 7.2% 9.2% 8.0% Precedents - 100% Equity Implied All-in XR (@ Current DINO) 0.3807x 0.3831x 0.3929x 0.4028x
0.4126x 0.4224x 0.4322x 0.4420x 0.4519x Low Median High Prem./(Disc.) to Unaff. Close (0.3799x) 0% 1% 3% 6% 9% 11% 14% 16% 19% (1%) 10% 34% Prem./(Disc.) to Unaff. 30-d VWAP (0.3719x) 2% 3% 6% 8% 11% 14% 16% 19% 22% 0% 8% 22% Prem./(Disc.) to
Current (0.3807x) 0% 1% 3% 6% 8% 11% 14% 16% 19% Note: Market data as of July 26, 2023. 6 (1) Represents hypothetical HEP price if HEP traded in-line with average of LT&S peers since the unaffected date. Source: FactSet, public
disclosure.

PRELIMINARY WORKING DRAFT – SUBJECT TO FURTHER REVIEW AND
MODIFICATION Illustrative Exchange Ratio Matrix Implied Exchange Ratio at Various Purchase Prices and Cash Consideration Purchase Price ($/Unit) $0.32 $19.53 $19.50 $20.00 $20.50 $21.00 $21.50 $22.00 $22.50 $23.00 $3.50 0.3150x 0.3143x 0.3242x
0.3340x 0.3438x 0.3536x 0.3635x 0.3733x 0.3831x $4.00 0.3052x 0.3045x 0.3143x 0.3242x 0.3340x 0.3438x 0.3536x 0.3635x 0.3733x $4.50 0.2954x 0.2947x 0.3045x 0.3143x 0.3242x 0.3340x 0.3438x 0.3536x 0.3635x $5.00 0.2855x 0.2849x 0.2947x 0.3045x 0.3143x
0.3242x 0.3340x 0.3438x 0.3536x $5.50 0.2757x 0.2750x 0.2849x 0.2947x 0.3045x 0.3143x 0.3242x 0.3340x 0.3438x $6.00 0.2659x 0.2652x 0.2750x 0.2849x 0.2947x 0.3045x 0.3143x 0.3242x 0.3340x $6.50 0.2561x 0.2554x 0.2652x 0.2750x 0.2849x 0.2947x 0.3045x
0.3143x 0.3242x $7.00 0.2462x 0.2456x 0.2554x 0.2652x 0.2750x 0.2849x 0.2947x 0.3045x 0.3143x 7 Note: Market data as of July 26, 2023. Source: FactSet, company disclosure. Cash Consideration ($/Unit)

PRELIMINARY WORKING DRAFT – SUBJECT TO FURTHER REVIEW AND
MODIFICATION APPENDIX 8

PRELIMINARY WORKING DRAFT – SUBJECT TO FURTHER REVIEW AND
MODIFICATION Illustrative Consideration Mix Analysis at Constant 0.3150x Exchange Ratio Implied Purchase Price (@ Current DINO - $50.90) Equity 0.3714x 0.3714x 0.3150x 0.3150x 0.3150x 0.3150x 0.3150x $0.00 $7.00 $3.50 $4.50 $5.50 $6.50 $7.00 Cash
Value $18.90 $25.90 $19.53 $20.53 $21.53 $22.53 $23.03 % Cash Consideration 0% 27% 18% 22% 26% 29% 30% Precedents - All Precedents - Since 1/1/22 Low Median High Low Median High Prem./(Disc.) to Unaff. Close ($15.92) 19% 63% 23% 29% 35% 42% 45% (9%)
11% 56% 17% 23% 34% Prem./(Disc.) to Unaff. 30-d VWAP ($17.10) 11% 51% 14% 20% 26% 32% 35% 0% 10% 47% 9% 25% 47% (1) Prem./(Disc.) to LT&S Market Adj. HEP Price ($17.55) 8% 48% 11% 17% 23% 28% 31% Prem./(Disc.) to Current ($19.38) (2%) 34% 1% 6%
11% 16% 19% Prem./(Disc.) to Unaff. 52-week High ($20.00) (5%) 30% (2%) 3% 8% 13% 15% (61%) (10%) 12% (32%) (2%) 6% Prem./(Disc.) to High of Research Target Prices ($20.00) (5%) 30% (2%) 3% 8% 13% 15% Median DKL NS PAA LT&S Small Cap. Implied
TEV/'23E EBITDA 8.5x 10.4x 8.6x 8.9x 9.2x 9.5x 9.6x 9.7x 8.4x 8.1x 8.4x 7.1x Implied '23E DCF Yield 13.9% 10.1% 13.4% 12.8% 12.2% 11.6% 11.4% 14.8% 18.7% 15.8% 15.8% 15.8% Implied '23E DPU Yield 7.4% 5.4% 7.2% 6.8% 6.5% 6.2% 6.1% 9.2% 9.3% 7.2% 9.2%
8.0% Precedents - 100% Equity Low Median High Implied All-in XR (@ Current DINO) 0.3714x 0.5089x 0.3838x 0.4034x 0.4231x 0.4427x 0.4525x Prem./(Disc.) to Unaff. Close (0.3799x) (2%) 34% 1% 6% 11% 17% 19% (1%) 10% 34% Prem./(Disc.) to Unaff. 30-d
VWAP (0.3719x) (0%) 37% 3% 8% 14% 19% 22% 0% 8% 22% Prem./(Disc.) to Current (0.3807x) (2%) 34% 1% 6% 11% 16% 19% Implied Purchase Price (@ DINO DCF Midpoint - $62.25) Equity 0.3714x 0.3714x 0.3150x 0.3150x 0.3150x 0.3150x 0.3150x Cash $0.00 $7.00
$3.50 $4.50 $5.50 $6.50 $7.00 Value $23.12 $30.12 $23.11 $24.11 $25.11 $26.11 $26.61 Uplift/(Dec.) vs. HEP Has @ DCF Midpoint ($23.79) (3%) 27% (3%) 1% 6% 10% 12% Implied Purchase Price (@ DINO Sensitivity DCF Midpoint - $55.32) Equity 0.3714x
0.3714x 0.3150x 0.3150x 0.3150x 0.3150x 0.3150x $0.00 $7.00 $3.50 $4.50 $5.50 $6.50 $7.00 Cash Value $20.55 $27.55 $20.93 $21.93 $22.93 $23.93 $24.43 Uplift/(Dec.) vs. HEP Has @ DCF Midpoint ($23.79) (14%) 16% (12%) (8%) (4%) 1% 3% Implied Purchase
Price (@ DINO Trading Comps Midpoint - $55.78) Equity 0.3714x 0.3714x 0.3150x 0.3150x 0.3150x 0.3150x 0.3150x Cash $0.00 $7.00 $3.50 $4.50 $5.50 $6.50 $7.00 Value $20.72 $27.72 $21.07 $22.07 $23.07 $24.07 $24.57 Uplift/(Dec.) vs. HEP Has @ Trading
Comps Midpoint ($18.31) 13% 51% 15% 21% 26% 31% 34% Note: Market data as of July 26, 2023. 9 (1) Represents hypothetical HEP price if HEP traded in-line with average of LT&S peers since the unaffected date. Source: FactSet, public
disclosure.

PRELIMINARY WORKING DRAFT – SUBJECT TO FURTHER REVIEW AND
MODIFICATION Illustrative Consideration Mix Analysis at Constant $3.50/Unit Cash Implied Purchase Price (@ Current DINO - $50.90) Equity 0.3714x 0.3714x 0.3150x 0.3250x 0.3500x 0.3750x 0.4000x 0.4250x Cash $0.00 $7.00 $3.50 $3.50 $3.50 $3.50 $3.50
$3.50 Value $18.90 $25.90 $19.53 $20.04 $21.32 $22.59 $23.86 $25.13 % Cash Consideration 0% 27% 18% 17% 16% 15% 15% 14% Precedents - All Precedents - Since 1/1/22 Low Median High Low Median High Prem./(Disc.) to Unaff. Close ($15.92) 19% 63% 23% 26%
34% 42% 50% 58% (9%) 11% 56% 17% 23% 34% Prem./(Disc.) to Unaff. 30-d VWAP ($17.10) 11% 51% 14% 17% 25% 32% 40% 47% 0% 10% 47% 9% 25% 47% (1) Prem./(Disc.) to LT&S Market Adj. HEP Price ($17.55) 8% 48% 11% 14% 21% 29% 36% 43% Prem./(Disc.) to
Current ($19.38) (2%) 34% 1% 3% 10% 17% 23% 30% Prem./(Disc.) to Unaff. 52-week High ($20.00) (5%) 30% (2%) 0% 7% 13% 19% 26% (61%) (10%) 12% (32%) (2%) 6% Median Prem./(Disc.) to High of Research Target Prices ($20.00) (5%) 30% (2%) 0% 7% 13% 19%
26% DKL NS PAA LT&S Small Cap. Implied TEV/'23E EBITDA 8.5x 10.4x 8.6x 8.8x 9.1x 9.5x 9.8x 10.2x 9.7x 8.4x 8.1x 8.4x 7.1x Implied '23E DCF Yield 13.9% 10.1% 13.4% 13.1% 12.3% 11.6% 11.0% 10.4% 14.8% 18.7% 15.8% 15.8% 15.8% Implied '23E DPU Yield
7.4% 5.4% 7.2% 7.0% 6.6% 6.2% 5.9% 5.6% 9.2% 9.3% 7.2% 9.2% 8.0% Precedents - 100% Equity Implied All-in XR (@ Current DINO) 0.3714x 0.5089x 0.3838x 0.3938x 0.4188x 0.4438x 0.4688x 0.4938x Low Median High Prem./(Disc.) to Unaff. Close (0.3799x) (2%)
34% 1% 4% 10% 17% 23% 30% (1%) 10% 34% Prem./(Disc.) to Unaff. 30-d VWAP (0.3719x) (0%) 37% 3% 6% 13% 19% 26% 33% 0% 8% 22% Prem./(Disc.) to Current (0.3807x) (2%) 34% 1% 3% 10% 17% 23% 30% Implied Purchase Price (@ DINO DCF Midpoint - $62.25)
Equity 0.3714x 0.3714x 0.3150x 0.3250x 0.3500x 0.3750x 0.4000x 0.4250x $0.00 $7.00 $3.50 $3.50 $3.50 $3.50 $3.50 $3.50 Cash Value $23.12 $30.12 $23.11 $23.73 $25.29 $26.84 $28.40 $29.95 Uplift/(Dec.) vs. HEP Has @ DCF Midpoint ($23.79) (3%) 27% (3%)
(0%) 6% 13% 19% 26% Implied Purchase Price (@ DINO Sensitivity DCF Midpoint - $55.32) Equity 0.3714x 0.3714x 0.3150x 0.3250x 0.3500x 0.3750x 0.4000x 0.4250x $0.00 $7.00 $3.50 $3.50 $3.50 $3.50 $3.50 $3.50 Cash Value $20.55 $27.55 $20.93 $21.48
$22.86 $24.25 $25.63 $27.01 Uplift/(Dec.) vs. HEP Has @ DCF Midpoint ($23.79) (14%) 16% (12%) (10%) (4%) 2% 8% 14% Implied Purchase Price (@ DINO Trading Comps Midpoint - $55.78) Equity 0.3714x 0.3714x 0.3150x 0.3250x 0.3500x 0.3750x 0.4000x 0.4250x
$0.00 $7.00 $3.50 $3.50 $3.50 $3.50 $3.50 $3.50 Cash Value $20.72 $27.72 $21.07 $21.63 $23.02 $24.42 $25.81 $27.21 Uplift/(Dec.) vs. HEP Has @ Trading Comps Midpoint ($18.31) 13% 51% 15% 18% 26% 33% 41% 49% Note: Market data as of July 26, 2023. 10
(1) Represents hypothetical HEP price if HEP traded in-line with average of LT&S peers since the unaffected date. Source: FactSet, public disclosure.

PRELIMINARY WORKING DRAFT – SUBJECT TO FURTHER REVIEW AND
MODIFICATION Disclaimer These materials have been prepared by Intrepid Partners, LLC (“Intrepid”) for the Conflicts Committee (the “Committee”) of the Board of Directors of Holly Logistic Services, L.L.C. (the “General
Partner”), the ultimate general partner of Holly Energy Partners, L.P. (“HEP”), to whom such materials are directly addressed and delivered. These materials are confidential and may not be used or relied upon by any other person or
for any purpose other than as specifically contemplated by a written agreement with Intrepid. These materials have been developed by and are proprietary to Intrepid and were prepared exclusively for the benefit and internal use of the Committee in
connection with evaluating the Proposed Transaction with HEP and HF Sinclair Corporation (“DINO”). These materials are based upon information provided by or on behalf of the management of DINO and the General Partner, from public
sources, or otherwise reviewed by Intrepid. Intrepid has relied upon and assumes no responsibility for independent investigation or verification of such information and has relied upon such information being complete and accurate in all material
respects. To the extent such information includes estimates and forecasts of future performance prepared by or reviewed with management of DINO or the General Partner and/or other potential transaction participants or obtained from public sources,
Intrepid has assumed that such estimates and forecasts have been reasonably prepared on bases reflecting the best currently available estimates and judgments of management of DINO, and the General Partner or such other potential transaction
participants (or, with respect to estimates and forecasts obtained from public sources, represent reasonable estimates). Actual results may differ materially from such estimates and forecasts. No representation or warranty, express or implied, is
made as to the accuracy or completeness of such information, and nothing contained herein is, or shall be relied upon as, a representation or warranty, whether as to the past, the present or the future. The materials and related commentary are not
intended to provide the only basis for evaluating, and should not be considered a recommendation with respect to, the consideration paid, the proposed transaction or any transaction or other matter. These materials are also subject to the
qualifications and limitations described in any accompanying written opinion letter. These materials were compiled on a confidential basis solely for use by the Committee and may not be relied on by any other party (including stakeholders in either
entity), even if such parties are provided a copy of these materials. These materials were prepared without a view to public disclosure or filing thereof under state or federal laws, and may not be redistributed, reproduced, distributed, passed to
others, transmitted, quoted or referred to, in whole or in part, without the prior written permission of Intrepid in accordance with the terms of our engagement letter with the Committee. These materials speak only as of the date on the cover and
Intrepid assumes no obligation to update these materials or inform any recipient of changed circumstances, events or information. These materials were prepared for a specific use by specific persons and were not prepared to conform with any
disclosure standards under securities laws or otherwise. In the ordinary course of its business, each of Intrepid and its affiliates may actively trade or hold the securities of DINO, HEP or other parties involved in a proposed transaction for its
own account or for the account of its customers and, accordingly, may at any time hold a long or short position in such securities. Intrepid will receive a fee in connection with delivery of an opinion relating to the proposed transaction. These
materials do not constitute, nor do they form part of, an offer or solicitation to sell or purchase any securities or instruments and are not a commitment by Intrepid or any of its affiliates to provide, arrange or underwrite any financing for any
transaction or to purchase any security in connection therewith. These materials may not reflect information known to other professionals in other business areas of Intrepid and its affiliates. Intrepid and its affiliates do not provide legal,
regulatory, accounting, bankruptcy, securities or tax advice. Any statements contained herein as to tax matters were neither written nor intended by Intrepid or its affiliates to be used and cannot be used by any taxpayer for the purpose of avoiding
tax penalties that may be imposed on such taxpayer. Each person should seek legal, regulatory accounting and tax advice based on his, her or its particular circumstances from independent advisors regarding the evaluation and impact of any
transactions or matters described herein.

PR PRELIM ELIMINAR INARY Y WOR WORKING KING DRAF DRAFT T – –
SUBJECT SUBJECT TO TO FUR FURTHE THER REV R REVIEW IEW AND AND MOD MODIFICAT IFICATION ION Exhibit (c)(3)(G) PROJECT APPLE DISCUSSION MATERIALS August 2, 2023

Exchange Ratio (x) PRELIMINARY WORKING DRAFT – SUBJECT TO FURTHER
REVIEW AND MODIFICATION HEP and DINO Trading Analysis Since Proposal Indexed Price Performance Since Proposal LT&S Peer Indexed Price Performance Since Proposal 140% DKL NS PAA 130% PAA: $14.71 $21.00 0.4400x +19% 120% NS: $17.92 HEP: $20.08
110% +15% +26% 0.4300x DKL: $48.49 100% DINO: $52.33 $20.00 +7% 90% +25% 0.4200x $19.00 0.4100x LT&S: +14% $18.00 0.4000x 0.3900x $17.00 XR: 0.3837x +1% 0.3799x 0.3800x $16.00 $15.92 0.3700x MMP/OKE Announcement $15.00 0.3600x $14.00 0.3500x HEP
DINO LT&S Peers Exchange Ratio 1 Note: Market data as of August 1, 2023. LT&S Peers include: DKL, NS, PAA. Source: FactSet, company disclosure. Unit Price ($) | Indexed to HEP

Volume (000) Volume (000) PRELIMINARY WORKING DRAFT – SUBJECT TO
FURTHER REVIEW AND MODIFICATION HEP and DINO Trading Analysis Since Proposal (Cont’d) HEP Price Performance and Volume Since Proposal DINO Price Performance and Volume Since Proposal $21.00 8,000 $56.00 8,000 HEP: SMID Cap. $55.00 $20.08
Refining: +26% +30% $54.00 $20.00 7,000 7,000 DINO: $53.00 $52.33 +25% $52.00 $19.00 6,000 6,000 $51.00 Large Cap. Refining: LT&S: $50.00 +20% +14% $18.00 5,000 5,000 $49.00 $48.00 $17.00 4,000 $47.00 4,000 Small Cap. MLPs: +2% $46.00 XR:
MMP/OKE +1% $45.00 Announcement $16.00 3,000 3,000 $15.92 $44.00 $43.00 Unaffected 30-Day $15.00 2,000 2,000 ADTV: 2,547 $42.00 XR: +1% $41.91 $41.00 983,200-unit $14.00 1,000 1,000 trade at $16.44 $40.00 $39.00 Unaffected 30-Day ADTV: 90 $13.00 --
$38.00 -- Volume DINO Volume HEP LT&S Peers Small Cap. MLP Peers Exchange Ratio Large Cap. Refining Exchange Ratio Unaffected 30-Day ADTV (in '000s) SMID Cap. Refining Unaffected 30-Day ADTV (in '000s) Note: Market data as of August 1, 2023.
LT&S Peers include: DKL, NS, PAA. Small Cap. MLP peers include CAPL, GEL, GLP. Large Cap. Refining peers include MPC, PSX, VLO. SMID Cap. 2 Refining peers include CVI, DK, PARR, PBF, VTNR. Source: FactSet, company disclosure. Unit Price ($) |
Indexed to HEP Share Price ($) | Indexed to DINO

PRELIMINARY WORKING DRAFT – SUBJECT TO FURTHER REVIEW AND
MODIFICATION Negotiation Summary and Market Trading (1) HEP Peer Perf. Spot Price Negotiations (Consideration) Negotiations (HEP $/Unit) Prem./(Disc.) to HEP Unaff. 30-d VWAP (Cum. Since ($17.10) Unaff.) Date HEP DINO DINO CC DINO CC Spot 5/3/23
$15.92 $41.91 0.3714x $15.57 (2%) (9%) n/a 0.3714x + 7/13/23 $19.07 $47.02 $24.46 +28% +43% +16% $7.00 Cash 0.3150x + 7/21/23 $18.97 $48.96 $18.92 (0%) +11% +11% $3.50 Cash 0.3714x + 7/28/23 $19.18 $51.60 $23.16 +21% +35% +12% $4.00 Cash 7/21/23
0.3150x + DINO Offer at $20.08 $52.33 $19.98 (0%) +17% +14% $3.50 Cash Current Prices 7/28/23 0.3714x + CC Counter at $20.08 $52.33 $23.44 17% +37% +14% $4.00 Cash Current Prices Note: Market data as of August 1, 2023. 3 (1) LT&S Peers include:
DKL, NS, PAA. Source: FactSet, company disclosure.

PRELIMINARY WORKING DRAFT – SUBJECT TO FURTHER REVIEW AND
MODIFICATION Implied Value Over Time – Proposals and Counterproposal Proposals and Counterproposal Value Over Time | Unaffected LTM to Current Average Value to HEP Unitholders Consideration Mix Unaff. LTM Since Announcement $40 0.3714x + No
Cash $19.12 $16.53 0.3150x + $3.50 $19.72 $17.52 0.3714x + $7.00 $26.12 $23.53 $35 0.3714x + $4.00 $23.12 $20.53 HEP $17.86 $18.01 $30 Unaffected Date (5/3/2023) $26.44 $25 $23.44 $22.12 $20.08 $20 $19.98 $19.12 $19.44 $17.82 $16.32 $15.12 $15 $10
May-22 Aug-22 Nov-22 Jan-23 May-23 Aug-23 0.3714x + No Cash 0.3150x + $3.50 0.3714x + $7.00 0.3714x + $4.00 HEP 4 Note: Market data as of August 1, 2023. Source: FactSet. Implied Value to HEP Unitholders

PRELIMINARY WORKING DRAFT – SUBJECT TO FURTHER REVIEW AND
MODIFICATION Disclaimer These materials have been prepared by Intrepid Partners, LLC (“Intrepid”) for the Conflicts Committee (the “Committee”) of the Board of Directors of Holly Logistic Services, L.L.C. (the “General
Partner”), the ultimate general partner of Holly Energy Partners, L.P. (“HEP”), to whom such materials are directly addressed and delivered. These materials are confidential and may not be used or relied upon by any other person or
for any purpose other than as specifically contemplated by a written agreement with Intrepid. These materials have been developed by and are proprietary to Intrepid and were prepared exclusively for the benefit and internal use of the Committee in
connection with evaluating the Proposed Transaction with HEP and HF Sinclair Corporation (“DINO”). These materials are based upon information provided by or on behalf of the management of DINO and the General Partner, from public
sources, or otherwise reviewed by Intrepid. Intrepid has relied upon and assumes no responsibility for independent investigation or verification of such information and has relied upon such information being complete and accurate in all material
respects. To the extent such information includes estimates and forecasts of future performance prepared by or reviewed with management of DINO or the General Partner and/or other potential transaction participants or obtained from public sources,
Intrepid has assumed that such estimates and forecasts have been reasonably prepared on bases reflecting the best currently available estimates and judgments of management of DINO, and the General Partner or such other potential transaction
participants (or, with respect to estimates and forecasts obtained from public sources, represent reasonable estimates). Actual results may differ materially from such estimates and forecasts. No representation or warranty, express or implied, is
made as to the accuracy or completeness of such information, and nothing contained herein is, or shall be relied upon as, a representation or warranty, whether as to the past, the present or the future. The materials and related commentary are not
intended to provide the only basis for evaluating, and should not be considered a recommendation with respect to, the consideration paid, the proposed transaction or any transaction or other matter. These materials are also subject to the
qualifications and limitations described in any accompanying written opinion letter. These materials were compiled on a confidential basis solely for use by the Committee and may not be relied on by any other party (including stakeholders in either
entity), even if such parties are provided a copy of these materials. These materials were prepared without a view to public disclosure or filing thereof under state or federal laws, and may not be redistributed, reproduced, distributed, passed to
others, transmitted, quoted or referred to, in whole or in part, without the prior written permission of Intrepid in accordance with the terms of our engagement letter with the Committee. These materials speak only as of the date on the cover and
Intrepid assumes no obligation to update these materials or inform any recipient of changed circumstances, events or information. These materials were prepared for a specific use by specific persons and were not prepared to conform with any
disclosure standards under securities laws or otherwise. In the ordinary course of its business, each of Intrepid and its affiliates may actively trade or hold the securities of DINO, HEP or other parties involved in a proposed transaction for its
own account or for the account of its customers and, accordingly, may at any time hold a long or short position in such securities. Intrepid will receive a fee in connection with delivery of an opinion relating to the proposed transaction. These
materials do not constitute, nor do they form part of, an offer or solicitation to sell or purchase any securities or instruments and are not a commitment by Intrepid or any of its affiliates to provide, arrange or underwrite any financing for any
transaction or to purchase any security in connection therewith. These materials may not reflect information known to other professionals in other business areas of Intrepid and its affiliates. Intrepid and its affiliates do not provide legal,
regulatory, accounting, bankruptcy, securities or tax advice. Any statements contained herein as to tax matters were neither written nor intended by Intrepid or its affiliates to be used and cannot be used by any taxpayer for the purpose of avoiding
tax penalties that may be imposed on such taxpayer. Each person should seek legal, regulatory accounting and tax advice based on his, her or its particular circumstances from independent advisors regarding the evaluation and impact of any
transactions or matters described herein.

PR PRELIM ELIMINAR INARY Y WOR WORKING KING DRAF DRAFT T – –
SUBJECT SUBJECT TO TO FUR FURTHE THER REV R REVIEW IEW AND AND MOD MODIFICAT IFICATION ION Exhibit (c)(3)(H) PROJECT APPLE DISCUSSION MATERIALS August 9, 2023

Exchange Ratio (x) PRELIMINARY WORKING DRAFT – SUBJECT TO FURTHER
REVIEW AND MODIFICATION HEP and DINO Trading Analysis Since Proposal Indexed Price Performance Since Proposal LT&S Peer Indexed Price Performance Since Proposal 130% DKL NS PAA PAA: $15.11 120% +22% $22.00 0.4400x NS: $16.56 110% DINO: $57.42
+6% +37% 100% NS $200mm equity DKL: $39.03 0.4300x 90% $21.00 offering (8/8/23) HEP: $20.87 (14%) 80% +31% 0.4200x $20.00 0.4100x $19.00 0.4000x $18.00 0.3900x LT&S: $17.00 +5% 0.3800x 0.3799x $16.00 $15.92 0.3700x XR: 0.3635x MMP/OKE (4%)
Announcement $15.00 0.3600x $14.00 0.3500x HEP DINO LT&S Peers Exchange Ratio 1 Note: Market data as of August 8, 2023. LT&S Peers include: DKL, NS, PAA. Source: FactSet, company disclosure. Unit Price ($) | Indexed to HEP

Volume (000) Volume (000) PRELIMINARY WORKING DRAFT – SUBJECT TO
FURTHER REVIEW AND MODIFICATION HEP and DINO Trading Analysis Since Proposal (Cont’d) HEP Price Performance and Volume Since Proposal DINO Price Performance and Volume Since Proposal $58.00 8,000 $21.00 8,000 HEP: DINO: $20.87 $57.00 $57.42
+31% +37% $56.00 $20.00 7,000 7,000 $55.00 SMID Cap. Refining: $54.00 +32% $19.00 6,000 $53.00 6,000 Large Cap. $52.00 Refining: +23% $51.00 $18.00 5,000 5,000 $50.00 $49.00 $17.00 4,000 $48.00 4,000 LT&S: $47.00 +5% MMP/OKE $46.00 Announcement
$16.00 3,000 3,000 Unaffected 30-Day $15.92 $45.00 ADTV: 2,547 XR: $44.00 (4%) $15.00 2,000 $43.00 2,000 1,356,435-unit Small Cap. $42.00 MLPs: trade at $20.87 $41.91 (7%) $41.00 $14.00 1,000 983,200-unit 1,000 $40.00 XR: (4%) trade at $16.44 $39.00
Unaffected 30-Day ADTV: 90 $13.00 -- $38.00 -- Volume HEP Volume DINO LT&S Peers Small Cap. MLP Peers Exchange Ratio Large Cap. Refining Exchange Ratio Unaffected 30-Day ADTV (in '000s) SMID Cap. Refining Unaffected 30-Day ADTV (in '000s) Note:
Market data as of August 8, 2023. LT&S Peers include: DKL, NS, PAA. Small Cap. MLP peers include CAPL, GEL, GLP. Large Cap. Refining peers include MPC, PSX, VLO. SMID Cap. 2 Refining peers include CVI, DK, PARR, PBF, VTNR. Source: FactSet,
company disclosure. Unit Price ($) | Indexed to HEP Share Price ($) | Indexed to DINO

PRELIMINARY WORKING DRAFT – SUBJECT TO FURTHER REVIEW AND
MODIFICATION Negotiation Summary and Market Trading (1) HEP Peer Perf. Spot Price Negotiations (Consideration) Negotiations (HEP $/Unit) Prem./(Disc.) to HEP Unaff. 30-d (Cum. Since VWAP ($17.10) Unaff.) Date HEP DINO DINO CC DINO CC Spot 5/3/23
$15.92 $41.91 0.3714x $15.57 (2%) (9%) n/a 0.3714x + 7/13/23 $19.07 $47.02 $24.46 +28% +43% +16% $7.00 Cash 0.3150x + 7/21/23 $18.97 $48.96 $18.92 (0%) +11% +11% $3.50 Cash 0.3714x + 7/28/23 $19.18 $51.60 $23.16 +21% +35% +12% $4.00 Cash 7/21/23
DINO Offer 0.3150x + $20.87 $57.42 $21.59 3% +26% +5% at Current $3.50 Cash Prices 7/28/23 0.3714x + CC Counter at $20.87 $57.42 $25.33 21% +48% +5% $4.00 Cash Current Prices Note: Market data as of August 8, 2023. 3 (1) LT&S Peers include: DKL,
NS, PAA. Source: FactSet, company disclosure.

PRELIMINARY WORKING DRAFT – SUBJECT TO FURTHER REVIEW AND
MODIFICATION Implied Value Over Time – Proposals and Counterproposal Proposals and Counterproposal Value Over Time | Unaffected LTM to Current Average Value to HEP Unitholders Consideration Mix Unaff. LTM Since Announcement $40 0.3714x + No
Cash $19.12 $16.81 0.3150x + $3.50 $19.72 $17.76 0.3714x + $7.00 $26.12 $23.81 $35 0.3714x + $4.00 $23.12 $20.81 HEP $17.86 $18.16 $30 Unaffected Date $28.33 (5/3/2023) $25.33 $25 $22.12 $21.59 $21.33 $20.87 $20 $19.12 $17.82 $16.32 $15.12 $15 $10
May-22 Aug-22 Nov-22 Feb-23 May-23 Aug-23 0.3714x + No Cash 0.3150x + $3.50 0.3714x + $7.00 0.3714x + $4.00 HEP 4 Note: Market data as of August 8, 2023. Source: FactSet. Implied Value to HEP Unitholders

PRELIMINARY WORKING DRAFT – SUBJECT TO FURTHER REVIEW AND
MODIFICATION Disclaimer These materials have been prepared by Intrepid Partners, LLC (“Intrepid”) for the Conflicts Committee (the “Committee”) of the Board of Directors of Holly Logistic Services, L.L.C. (the “General
Partner”), the ultimate general partner of Holly Energy Partners, L.P. (“HEP”), to whom such materials are directly addressed and delivered. These materials are confidential and may not be used or relied upon by any other person or
for any purpose other than as specifically contemplated by a written agreement with Intrepid. These materials have been developed by and are proprietary to Intrepid and were prepared exclusively for the benefit and internal use of the Committee in
connection with evaluating the Proposed Transaction with HEP and HF Sinclair Corporation (“DINO”). These materials are based upon information provided by or on behalf of the management of DINO and the General Partner, from public
sources, or otherwise reviewed by Intrepid. Intrepid has relied upon and assumes no responsibility for independent investigation or verification of such information and has relied upon such information being complete and accurate in all material
respects. To the extent such information includes estimates and forecasts of future performance prepared by or reviewed with management of DINO or the General Partner and/or other potential transaction participants or obtained from public sources,
Intrepid has assumed that such estimates and forecasts have been reasonably prepared on bases reflecting the best currently available estimates and judgments of management of DINO, and the General Partner or such other potential transaction
participants (or, with respect to estimates and forecasts obtained from public sources, represent reasonable estimates). Actual results may differ materially from such estimates and forecasts. No representation or warranty, express or implied, is
made as to the accuracy or completeness of such information, and nothing contained herein is, or shall be relied upon as, a representation or warranty, whether as to the past, the present or the future. The materials and related commentary are not
intended to provide the only basis for evaluating, and should not be considered a recommendation with respect to, the consideration paid, the proposed transaction or any transaction or other matter. These materials are also subject to the
qualifications and limitations described in any accompanying written opinion letter. These materials were compiled on a confidential basis solely for use by the Committee and may not be relied on by any other party (including stakeholders in either
entity), even if such parties are provided a copy of these materials. These materials were prepared without a view to public disclosure or filing thereof under state or federal laws, and may not be redistributed, reproduced, distributed, passed to
others, transmitted, quoted or referred to, in whole or in part, without the prior written permission of Intrepid in accordance with the terms of our engagement letter with the Committee. These materials speak only as of the date on the cover and
Intrepid assumes no obligation to update these materials or inform any recipient of changed circumstances, events or information. These materials were prepared for a specific use by specific persons and were not prepared to conform with any
disclosure standards under securities laws or otherwise. In the ordinary course of its business, each of Intrepid and its affiliates may actively trade or hold the securities of DINO, HEP or other parties involved in a proposed transaction for its
own account or for the account of its customers and, accordingly, may at any time hold a long or short position in such securities. Intrepid will receive a fee in connection with delivery of an opinion relating to the proposed transaction. These
materials do not constitute, nor do they form part of, an offer or solicitation to sell or purchase any securities or instruments and are not a commitment by Intrepid or any of its affiliates to provide, arrange or underwrite any financing for any
transaction or to purchase any security in connection therewith. These materials may not reflect information known to other professionals in other business areas of Intrepid and its affiliates. Intrepid and its affiliates do not provide legal,
regulatory, accounting, bankruptcy, securities or tax advice. Any statements contained herein as to tax matters were neither written nor intended by Intrepid or its affiliates to be used and cannot be used by any taxpayer for the purpose of avoiding
tax penalties that may be imposed on such taxpayer. Each person should seek legal, regulatory accounting and tax advice based on his, her or its particular circumstances from independent advisors regarding the evaluation and impact of any
transactions or matters described herein.

PR PRELIM ELIMINAR INARY Y WOR WORKING KING DRAF DRAFT T – –
SUBJECT SUBJECT TO TO FUR FURTHE THER REV R REVIEW IEW AND AND MOD MODIFICAT IFICATION ION Exhibit (c)(3)(I) PROJECT APPLE DISCUSSION MATERIALS August 11, 2023

Exchange Ratio (x) PRELIMINARY WORKING DRAFT – SUBJECT TO FURTHER
REVIEW AND MODIFICATION HEP and DINO Trading Analysis Since Proposal Indexed Price Performance Since Proposal LT&S Peer Indexed Price Performance Since Proposal 130% DKL NS PAA PAA: $15.25 120% +23% $23.00 0.4400x 110% NS: $15.59 DINO: $59.34
100% +0% +42% NS $200mm equity DKL: $42.73 $22.00 0.4300x 90% offering (8/8/23) (6%) 80% HEP: $21.74 +37% $21.00 0.4200x $20.00 0.4100x $19.00 0.4000x $18.00 0.3900x $17.00 0.3800x 0.3799x LT&S: +6% $16.00 0.3700x $15.92 XR: 0.3664x (4%) MMP/OKE
$15.00 0.3600x Announcement $14.00 0.3500x HEP DINO LT&S Peers Exchange Ratio 1 Note: Market data as of August 11, 2023. LT&S Peers include: DKL, NS, PAA. Source: FactSet, company disclosure. Unit Price ($) | Indexed to HEP

Volume (000) Volume (000) PRELIMINARY WORKING DRAFT – SUBJECT TO
FURTHER REVIEW AND MODIFICATION HEP and DINO Trading Analysis Since Proposal (Cont’d) HEP Price Performance and Volume Since Proposal DINO Price Performance and Volume Since Proposal $22.00 8,000 $61.00 8,000 DINO: HEP: $60.00 $59.34 $21.74
$59.00 +42% +37% $21.00 7,000 7,000 $58.00 SMID Cap. $57.00 Refining: +37% $56.00 $20.00 6,000 6,000 $55.00 Large Cap. $54.00 Refining: $19.00 +29% $53.00 5,000 5,000 $52.00 $51.00 $18.00 $50.00 4,000 4,000 $49.00 $17.00 LT&S: $48.00 +6% $47.00
3,000 3,000 MMP/OKE Unaffected 30-Day $46.00 Small Cap. $16.00 ADTV: 2,547 Announcement $15.92 MLPs: $45.00 (0%) $44.00 2,000 2,000 XR: $15.00 $43.00 (4%) 1,356,435-unit $42.00 trade at $20.87 $41.91 $41.00 1,000 983,200-unit 1,000 $14.00 trade at
$16.44 $40.00 XR: (4%) $39.00 Unaffected 30-Day ADTV: 90 $13.00 -- $38.00 -- Volume DINO Volume HEP LT&S Peers Small Cap. MLP Peers Exchange Ratio Large Cap. Refining Exchange Ratio Unaffected 30-Day ADTV (in '000s) SMID Cap. Refining Unaffected
30-Day ADTV (in '000s) Note: Market data as of August 11, 2023. LT&S Peers include: DKL, NS, PAA. Small Cap. MLP peers include CAPL, GEL, GLP. Large Cap. Refining peers include MPC, PSX, VLO. SMID Cap. 2 Refining peers include CVI, DK, PARR,
PBF, VTNR. Source: FactSet, company disclosure. Unit Price ($) | Indexed to HEP Share Price ($) | Indexed to DINO

PRELIMINARY WORKING DRAFT – SUBJECT TO FURTHER REVIEW AND
MODIFICATION Negotiation Summary and Market Trading (1) HEP Peer Perf. Spot Price Negotiations (Consideration) Negotiations (HEP $/Unit) Prem./(Disc.) to HEP Unaff. 30-d VWAP (Cum. Since ($17.10) Unaff.) Date HEP DINO DINO CC DINO CC Spot Initial
Offer $15.92 $41.91 0.3714x $15.57 (2%) (9%) n/a 0.3714x + CC Counter #1 $19.07 $47.02 $24.46 +28% +43% +16% $7.00 Cash 0.3150x + Revised Offer #2 $18.97 $48.96 $18.92 (0%) +11% +11% $3.50 Cash 0.3714x + CC Counter #2 $19.18 $51.60 $23.16 +21% +35%
+12% $4.00 Cash Revised Offer #3 0.3150x + $21.74 $59.34 $22.69 +4% +33% +6% ( Best and Final ) $4.00 Cash Note: Market data as of August 11, 2023. 3 (1) LT&S Peers include: DKL, NS, PAA. Source: FactSet, company disclosure.

PRELIMINARY WORKING DRAFT – SUBJECT TO FURTHER REVIEW AND
MODIFICATION Implied Value Over Time – Proposals and Counterproposal Proposals and Counterproposal Value Over Time | Unaffected LTM to Current Average Value to HEP Unitholders Consideration Mix Unaff. LTM Since Announcement 0.3714x + No Cash
$19.12 $17.03 $40 0.3714x + $7.00 $26.12 $24.03 0.3150x + $3.50 $19.72 $17.95 0.3714x + $4.00 $23.12 $21.03 $35 0.3150x + $4.00 $20.22 $18.45 HEP $17.86 $18.30 $30 $29.04 Unaffected Date (5/3/2023) $26.04 $25 $22.69 $22.12 $22.19 $22.04 $20 $21.74
$19.12 $17.82 $16.82 $16.32 $15.12 $15 $10 May-22 Aug-22 Nov-22 Feb-23 May-23 Aug-23 0.3714x + No Cash 0.3150x + $3.50 0.3714x + $7.00 0.3714x + $4.00 0.3150x + $4.00 HEP 4 Note: Market data as of August 11, 2023. Source: FactSet. Implied Value to
HEP Unitholders

PRELIMINARY WORKING DRAFT – SUBJECT TO FURTHER REVIEW AND
MODIFICATION Disclaimer These materials have been prepared by Intrepid Partners, LLC (“Intrepid”) for the Conflicts Committee (the “Committee”) of the Board of Directors of Holly Logistic Services, L.L.C. (the “General
Partner”), the ultimate general partner of Holly Energy Partners, L.P. (“HEP”), to whom such materials are directly addressed and delivered. These materials are confidential and may not be used or relied upon by any other person or
for any purpose other than as specifically contemplated by a written agreement with Intrepid. These materials have been developed by and are proprietary to Intrepid and were prepared exclusively for the benefit and internal use of the Committee in
connection with evaluating the Proposed Transaction with HEP and HF Sinclair Corporation (“DINO”). These materials are based upon information provided by or on behalf of the management of DINO and the General Partner, from public
sources, or otherwise reviewed by Intrepid. Intrepid has relied upon and assumes no responsibility for independent investigation or verification of such information and has relied upon such information being complete and accurate in all material
respects. To the extent such information includes estimates and forecasts of future performance prepared by or reviewed with management of DINO or the General Partner and/or other potential transaction participants or obtained from public sources,
Intrepid has assumed that such estimates and forecasts have been reasonably prepared on bases reflecting the best currently available estimates and judgments of management of DINO, and the General Partner or such other potential transaction
participants (or, with respect to estimates and forecasts obtained from public sources, represent reasonable estimates). Actual results may differ materially from such estimates and forecasts. No representation or warranty, express or implied, is
made as to the accuracy or completeness of such information, and nothing contained herein is, or shall be relied upon as, a representation or warranty, whether as to the past, the present or the future. The materials and related commentary are not
intended to provide the only basis for evaluating, and should not be considered a recommendation with respect to, the consideration paid, the proposed transaction or any transaction or other matter. These materials are also subject to the
qualifications and limitations described in any accompanying written opinion letter. These materials were compiled on a confidential basis solely for use by the Committee and may not be relied on by any other party (including stakeholders in either
entity), even if such parties are provided a copy of these materials. These materials were prepared without a view to public disclosure or filing thereof under state or federal laws, and may not be redistributed, reproduced, distributed, passed to
others, transmitted, quoted or referred to, in whole or in part, without the prior written permission of Intrepid in accordance with the terms of our engagement letter with the Committee. These materials speak only as of the date on the cover and
Intrepid assumes no obligation to update these materials or inform any recipient of changed circumstances, events or information. These materials were prepared for a specific use by specific persons and were not prepared to conform with any
disclosure standards under securities laws or otherwise. In the ordinary course of its business, each of Intrepid and its affiliates may actively trade or hold the securities of DINO, HEP or other parties involved in a proposed transaction for its
own account or for the account of its customers and, accordingly, may at any time hold a long or short position in such securities. Intrepid will receive a fee in connection with delivery of an opinion relating to the proposed transaction. These
materials do not constitute, nor do they form part of, an offer or solicitation to sell or purchase any securities or instruments and are not a commitment by Intrepid or any of its affiliates to provide, arrange or underwrite any financing for any
transaction or to purchase any security in connection therewith. These materials may not reflect information known to other professionals in other business areas of Intrepid and its affiliates. Intrepid and its affiliates do not provide legal,
regulatory, accounting, bankruptcy, securities or tax advice. Any statements contained herein as to tax matters were neither written nor intended by Intrepid or its affiliates to be used and cannot be used by any taxpayer for the purpose of avoiding
tax penalties that may be imposed on such taxpayer. Each person should seek legal, regulatory accounting and tax advice based on his, her or its particular circumstances from independent advisors regarding the evaluation and impact of any
transactions or matters described herein.

Exhibit (c)(3)(J) PRESENTATION TO THE CONFLICTS COMMITTEE OF THE BOARD
OF DIRECTORS OF HOLLY LOGISTIC SERVICES, L.L.C. August 15, 2023

Table of Contents I. Transaction Summary 2 II. HEP Valuation Detail 7
III. DINO Valuation Detail 20 IV. Appendix 32 Tab A: HEP Valuation Analysis Support 33 Tab B: DINO Valuation Analysis Support 36 1

I. TRANSACTION SUMMARY 2

Summary of Transaction Transaction Summary Transaction at a Glance
▪ HF Sinclair Corporation (“DINO”) to acquire all the publicly held ▪ DINO: 47% common units representing limited partner interests in Holly Energy HEP Unaffiliated Unitholders: 53% ▪ Partners, L.P. (“HEP”)
not already owned by DINO and its affiliates Ownership Sinclair Family: 17% (included in ▪ Overview (the “Unaffiliated Units”) (such unitholders the “Unaffiliated Unaffiliated Unitholders) Unitholders”) for a
combination of DINO common stock and cash (the ▪ DINO Share Price: $57.95 “Transaction”) Exchange Ratio (“XR”): 0.3150x Implied HEP ▪ Each Unaffiliated Unit will be converted into: ▪ Cash: $4.00 Value
($/Unit)▪ – 0.3150 newly issued shares of DINO common stock Consideration▪ Total Implied Value: $22.25 – $4.00 of cash ▪ Equates to 82% stock / 18% cash Transaction ▪ $1.5bn Expected to be funded with DINO’s
existing sources of liquidity ▪ Size – Undrawn $1.65bn revolver Financing – Balance sheet cash: $1.2bn (as of 6/30/23) Unaffected Spot: 40% ▪ – Credit Rating: Baa3 / BBB- Unaffected 30-day VWAP: 30% Implied ▪ No
financing condition ▪ Premiums▪ Current: 3% ▪ HEP would merge with and into a newly-formed wholly-owned ▪ VWAP Since Unaffected: 18% Structure subsidiary of DINO (“Merger Sub”), with HEP surviving the merger
▪ Affirmative vote of a majority of votes cast by DINO stockholders (stock issuance to 5% holder) – Sinclair Family owns 14% Affirmative vote of a majority of the HEP common units outstanding ▪ Approvals – DINO has agreed to
vote its 47% interest in favor of the Transaction – Sinclair Family owns another 17% ▪ Special Approval by the HEP Conflicts Committee ▪ Customary closing conditions HEP unitholders to continue to receive regular quarterly
distributions ▪ Other consistent with past practice, not to exceed $0.35/unit per quarter 3 Note: Market data as of August 14, 2023. Source: Management guidance, FactSet, public disclosure.

Illustrative Premiums and Valuation Benchmarking Illustrative Premiums
Illustrative Valuation Benchmarking Transaction Consideration TEV / 2023E EBITDA (1) Time Period HEP Unit Price ($22.25) vs. Reference Period 9.4x 9.2x Unaffected Price $15.92 +40% 8.4x (5/3/23) 8.4x 8.0x Closing Price +3% $21.55 (8/14/23) HEP @ DKL
NS PAA Transaction Unaffected $16.73 +33% 10-Day VWAP 2023E DCF Yield 18.3% 15.5% Unaffected 14.0% $16.93 +31% 15.5% 20-Day VWAP 11.8% Unaffected +30% $17.10 30-Day VWAP HEP @ DKL NS PAA Transaction Unaffected $17.77 +25% LTM VWAP 2023E DPU Yield
Unaffected 52-Week High $20.00 +11% 10.4% 10.2% (6/6/22) 10.2% 6.3% 7.0% Current 52-Week High +2% $21.74 (8/11/23) HEP @ DKL NS PAA VWAP Since Transaction $18.85 +18% Unaffected Peer Median Note: Market data as of August 14, 2023. 4 (1) Based on
current DINO share price. Source: Management guidance, Wall Street research, FactSet.

Comparison of the Transaction to Precedent Transaction Premiums Trading
Metrics and Implied Transaction Value vs. Unaffected HEP Metrics Reference Metric: T-1 10-Day VWAP 20-Day VWAP 30-Day VWAP 60-Day VWAP 90-Day VWAP 52-Wk High 52-Wk Low HEP Unit Price: $15.92 $16.73 $16.93 $17.10 $17.73 $18.09 $20.00 $15.66 Stock
Consideration: $13.20 $13.61 $14.02 $14.49 $15.19 $15.62 $20.67 $13.11 Total Consideration: $17.20 $17.61 $18.02 $18.49 $19.19 $19.62 $24.67 $17.11 Implied Premium: 8% 5% 6% 8% 8% 8% 23% 9% Stock Consideration: $18.25 Total Consideration: $22.25
Implied Premium: 40% 33% 31% 30% 26% 23% 11% 42% Transaction Implied Premium/(Discount) vs. MLP Buy-In Precedent Transaction Premiums 261% 56% 49% 47% 47% 43% 42% 35% 40% 33% 31% 32% 30% 26% 23% 23% 12% 12% 14% 11% 11% 11% 10% 10% 10% 9% 8% 8% 8% 8%
6% 5% (1%) (3%) 0% (9%) (10%) (4%) 1% (61%) (1) (2) Precedents (High-Low Range) Precedents (Mean) Precedents (Median) Transaction @ Unaffected DINO Transaction @ Current DINO Note: Market data as of August 14, 2023. (1) Calculated assuming
unaffected DINO share price metric and $4.00 of cash consideration. 5 (2) Calculated assuming current DINO share price of $57.95 and $4.00 of cash consideration. Source: Public disclosure, Wall Street research, FactSet. (2) (1) Current
Unaffected

Intrepid’s Due Diligence Process Fairness Opinion Requested:
Intrepid Partners, LLC (“Intrepid”, “us”, “our” and “we”) has been asked by the conflicts committee (the “Committee”) of the board of directors of Holly Logistic Services, L.L.C. (the
“General Partner”), the ultimate general partner of HEP, whether, in Intrepid’s opinion, as of the date hereof, the Consideration to be paid in the Transaction is fair, from a financial point of view, to the Unaffiliated
Unitholders. In connection with our Opinion, we have, among other due diligence: i. Reviewed a draft of the Merger Agreement (draft dated August [14], 2023); ii. Reviewed the Partnership’s Second Amended and Restated Agreement of Limited
Partnership, dated as of October 31, 2017 (the “Partnership Agreement”); iii. Reviewed certain presentations to the Committee from the management of the General Partner and DINO; iv. Reviewed certain publicly available information
relating to HEP and DINO that we deemed relevant, including each of HEP’s and DINO’s Annual Reports on Form 10-K for the fiscal year ended December 31, 2022, Quarterly Reports on Form 10-Q for the three months ended March 31, 2023 and
June 30, 2023, and certain Current Reports on Form 8-K, in each case as filed with or furnished to the U.S. Securities and Exchange Commission; v. Reviewed HEP’s and DINO’s business plan with management of the General Partner and DINO,
including, but not limited to, a detailed review of business segments, certain material growth projects and commercial contracts and legal, environmental, regulatory and other matters; vi. Discussed the distribution policy for HEP and the dividend
policy for DINO with the management of the General Partner and DINO; vii. Reviewed certain recent corporate announcements made by HEP and DINO; viii. Reviewed certain non-public projected financial data and related assumptions of each of HEP and
DINO, as prepared and furnished to us by management of the General Partner and DINO; ix. Discussed past and current operations and operational projections of each of HEP and DINO with management of the General Partner and DINO, including their views
on the risks and uncertainties in achieving the projections set forth in the forecasts provided; x. Discussed the strategic rationale for, and potential benefits of, the Transaction with management of the General Partner and DINO; xi. Performed
discounted cash flow analyses based on forecasts and other data provided by management of the General Partner and DINO; xii. Reviewed and analyzed publicly available historical and current financial information, debt trading data, unit and stock
price data and broker research estimates with respect to certain public companies with operations and assets that we considered comparable to each of HEP and DINO; xiii. Reviewed the financial metrics of certain historical transactions that we
deemed relevant and compared such financial metrics to those implied by the Transaction; and xiv. Conducted such other studies and investigations, performed such other analyses and examinations, reviewed such other information and considered such
other factors that we deemed appropriate for purposes of providing our opinion. 6

II. HEP VALUATION DETAIL 7

HEP | Summary of Management’s Financial Projections ~80% of HEP
revenue during the forecast period is from DINO Adjusted EBITDA and Distributable Cash Flow ($mm) Capex ($mm) ’23E – ’28E EBITDA CAGR: 2.2% ’23E – ’28E DCF CAGR: 3.7% $511 $497 $477 $480 $77 $474 $458 $415 $62 $25
$400 $44 $398 $42 $42 $42 $41 $378 $30 $360 $349 $21 $0 $332 $10 $10 $10 $10 $10 $307 $3 $32 $32 $32 $32 $31 $31 $30 2022A 2023E 2024E 2025E 2026E 2027E 2028E 2022A 2023E 2024E 2025E 2026E 2027E 2028E Maintenance Capex Growth & JV Investment
Adjusted EBITDA Distributable Cash Flow Turnaround Capital MidCon Capital DPU ($/unit) and Coverage (x) Leverage – End of Period (x) 3.8x 2.1x 2.3x 2.2x 2.0x 2.0x 1.9x 3.1x 1.7x 2.5x $1.40 $1.40 $1.40 $1.40 $1.40 $1.40 $1.40 2.1x 1.9x 1.8x
1.7x 3.7x 3.0x 2.5x 2.1x 1.6x 1.1x 0.6x 2022A 2023E 2024E 2025E 2026E 2027E 2028E 2022A 2023E 2024E 2025E 2026E 2027E 2028E Gross Leverage Net Leverage Distribution Per Unit Coverage 8 Source: Management guidance, public disclosure.

HEP | Summary of Valuation Methodologies Used Methodology Description /
Key Metrics Historical Market ▪ Analyzed historical market trading performance and valuation Valuations and Wall Street Research ▪ Reviewed research analyst price targets included in equity research from four investment banks (For
Reference Only) ▪ Valuation based on trading metrics of selected peers: – Liquids Transportation and Storage (“LT&S”) Peers: DKL, NS and PAA Comparable Public Company Trading – Small Cap. MLP Peers: CAPL, GEL, and
GLP Analysis ▪ Metrics included: (i) TEV/EBITDA, (ii) LP Distributable Cash Flow Yield and (iii) LP Distribution Yield – Metrics (i) and (ii) evaluated on a 2023E and 2024E basis; metric (iii) evaluated on a 2023E basis ▪ Valuation
based on the present value of future free cash flows (“FCF”) expected to be generated by HEP and an assumed terminal value (calculated by applying a range of terminal multiples to terminal year EBITDA) – Evaluated on an unlevered
FCF basis Discounted Cash Flow – Ranges of terminal multiples based on public companies operating with similar asset profiles Analysis – Discount rate range reflective of HEP’s weighted average cost of capital (“WACC”)
o HEP WACC implied by capital asset pricing model (“CAPM”) and an analysis of public companies operating with similar asset profiles ▪ Valuation based on the present value of future expected distributions paid by HEP and an assumed
terminal value (calculated by applying a range of distribution yields to the terminal year distribution) Distribution Discount – Ranges of terminal distribution yields based on trading yields of public companies operating with similar asset
profiles Model (“DDM”) – Discount rate range reflective of HEP’s cost of equity capital (“Ke”) o HEP Ke implied by CAPM and an analysis of public companies operating with similar asset profiles ▪ Valuation
based on metrics for comparable MLP buy-in transactions Precedent ▪ Metrics include: (i) LP Distributable Cash Flow Yield and (ii) LP Distribution Yield Transactions – Evaluated on a FY+1 basis Precedent Premiums ▪ Premiums paid
analysis based on comparable MLP buy-in transactions Paid 9
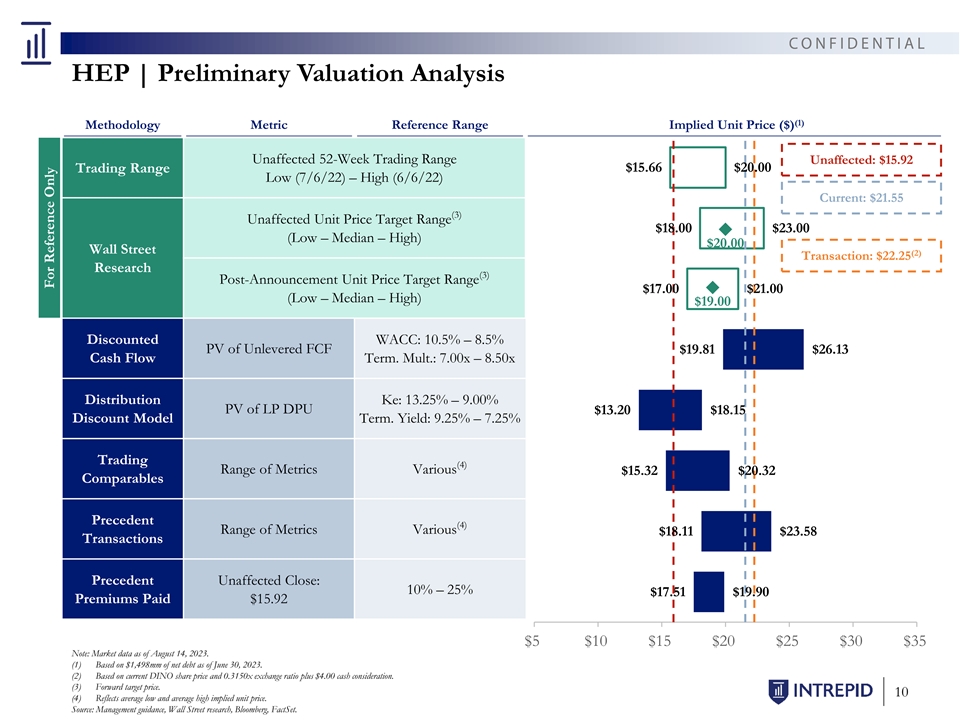
HEP | Preliminary Valuation Analysis (1) Methodology Metric Reference
Range Implied Unit Price ($) Unaffected 52-Week Trading Range Unaffected: $15.92 $15.66 $20.00 Trading Range Low (7/6/22) – High (6/6/22) Current: $21.55 (3) Unaffected Unit Price Target Range $18.00 $23.00 (Low – Median – High)
$20.00 Wall Street (2) Transaction: $22.25 Research (3) Post-Announcement Unit Price Target Range $17.00 $21.00 (Low – Median – High) $19.00 Discounted WACC: 10.5% – 8.5% PV of Unlevered FCF $19.81 $26.13 Cash Flow Term. Mult.:
7.00x – 8.50x Distribution Ke: 13.25% – 9.00% PV of LP DPU $13.20 $18.15 Discount Model Term. Yield: 9.25% – 7.25% Trading (4) Range of Metrics Various $15.32 $20.32 Comparables Precedent (4) Range of Metrics Various $18.11 $23.58
Transactions Precedent Unaffected Close: 10% – 25% $17.51 $19.90 Premiums Paid $15.92 $5 $10 $15 $20 $25 $30 $35 Note: Market data as of August 14, 2023. (1) Based on $1,498mm of net debt as of June 30, 2023. (2) Based on current DINO share
price and 0.3150x exchange ratio plus $4.00 cash consideration. (3) Forward target price. 10 (4) Reflects average low and average high implied unit price. Source: Management guidance, Wall Street research, Bloomberg, FactSet. For Reference
Only

Illustrative “Has / Gets” Analysis Reflects implied value
HEP “gets” per unit under different valuation methodologies at the Transaction (0.3150x + $4.00) Implied Value per HEP Unit HEP Illustrative Value per Unit 0.3150x Exchange Ratio + $4.00 Cash per Unit Methodology DINO Illustrative Value
per Share (HEP “Has”) (HEP “Gets”) Market Trading $41.63 $65.61 $15.66 $20.00 $17.11 $24.67 (52-Week High/Low) Wall Street $44.00 $70.00 $17.00 $21.00 $17.86 $26.05 Research (Post- Announcement) Discounted Cash $58.88 $72.38
$19.81 $26.13 $22.55 $26.80 Flow (Management) Discounted Cash $52.08 $64.40 $19.81 $26.13 $20.40 $24.28 Flow (Sensitivity) Trading $51.02 $67.35 $15.32 $20.32 $20.07 $25.21 Comparables Precedent $51.02 $67.35 $18.11 $23.58 $20.07 $25.21 Transactions
$10 $15 $20 $25 $30 $20 $30 $40 $50 $60 $70 $80 $90 $10 $15 $20 $25 $30 $10 $15 $20 $25 $30 DINO Value HEP “Has” HEP “Gets” 11 Note: Market data as of August 14, 2023. Does not include impact from synergies and tax savings.
Source: Management guidance, Wall Street research, Factset, Bloomberg.

Volume (000s) HEP Unit Price Performance & Trading Statistics HEP
Two-Year Price Performance Unaffected Historical Trading Stats Unaffected Historical Trading $22 2,500 ADTV ADTV 10-Day 20-Day 30-Day 1-Year HEP: VWAP (mm) ($mm) $21.55 VWAP $16.73 $16.93 $17.10 $17.77 16% High $17.15 $17.40 $17.69 $20.00 Unaffected
(1) $15.92 0.1 $1.4 Low $15.92 $15.92 $15.92 $15.66 (5/3/23) $20 2,000 Unaffected $16.73 0.1 $1.8 10-Day $18.61 Unaffected $16.93 0.1 $1.5 20-Day $18 1,500 Unaffected $17.10 0.1 $1.5 30-Day Unaffected $17.73 0.1 $2.0 $16 1,000 60-Day Unaffected
$18.09 0.1 $2.1 90-Day $14 500 Unaffected $18.03 0.2 $2.8 180-Day Unaffected $17.77 0.2 $2.9 1-Year $12 -- Aug-21 Dec-21 Apr-22 Aug-22 Dec-22 Apr-23 Aug-23 Volume HEP Initial Proposal Received Note: Market data as of August 14, 2023. 12 (1) Reflects
closing price. Source: FactSet, public disclosure.

HEP | Discounted Cash Flow Analysis Projected Forecast Period ($mm,
unless otherwise noted) 2H2023E 2024E 2025E 2026E 2027E 2028E Terminal Adj. EBITDA $249 $477 $474 $480 $497 $511 $511 (-) Maintenance Capex (21) (31) (32) (32) (32) (32) (31) (-) Turnaround Expense -- (3) -- -- -- (30) (8) (-) MidCon Capital -- (10)
(10) (10) (10) -- -- (-) Growth Capex (3) -- -- -- -- -- -- (+/-) Changes in Net Working Capital (15) 6 (1) (2) (2) (2) -- (1) (+/-) Other 11 20 20 20 20 20 20 Unlevered Free Cash Flow ( UFCF ) $222 $459 $451 $457 $474 $468 $491 Discounted Unlevered
Free Cash Flows (9.50% WACC) $217 $419 $376 $348 $329 $297 Present Value of Unlev. FCF (9.50% WACC) $1,986 Terminal Adj. EBITDA $511 (x) Terminal Multiple 7.75x Terminal Value (Undiscounted) $3,960 Present Value of Terminal Value (9.50% WACC) $2,403
Memo: % of Total TEV 54.8% Memo: Implied Perpetuity Growth Rate (3.1%) Implied TEV $4,389 (-) Debt (1,506) (+) Cash 8 Implied Equity Value $2,891 (÷) Total Units Outstanding (mm) 126.6 Implied Unit Price $22.84 Sensitivity Analysis $mm, unless
per unit data Implied TEV Implied Equity Value Implied Unit Price Implied Perpetuity Growth Rate PV of Terminal Adj. EBITDA Multiple UFCF 7.00x 7.38x 7.75x 8.13x 8.50x 7.00x 7.38x 7.75x 8.13x 8.50x 7.00x 7.38x 7.75x 8.13x 8.50x 7.00x 7.38x 7.75x
8.13x 8.50x 10.50% $1,941 $4,006 $4,116 $4,227 $4,337 $4,448 $2,507 $2,618 $2,729 $2,839 $2,950 $19.81 $20.68 $21.55 $22.43 $23.30 (3.4%) (2.8%) (2.2%) (1.7%) (1.2%) 10.00% 1,963 4,080 4,194 4,307 4,420 4,534 2,582 2,695 2,809 2,922 3,036 20.40
21.29 22.19 23.08 23.98 (3.9%) (3.2%) (2.7%) (2.1%) (1.7%) 9.50% 1,986 4,157 4,273 4,389 4,506 4,622 2,659 2,775 2,891 3,008 3,124 21.00 21.92 22.84 23.76 24.68 (4.3%) (3.6%) (3.1%) (2.6%) (2.1%) 9.00% 2,009 4,236 4,355 4,474 4,593 4,713 2,738 2,857
2,976 3,095 3,215 21.62 22.57 23.51 24.45 25.39 (4.7%) (4.1%) (3.5%) (3.0%) (2.5%) 8.50% 2,033 4,317 4,439 4,561 4,684 4,806 2,818 2,941 3,063 3,185 3,308 22.26 23.23 24.20 25.16 26.13 (5.1%) (4.5%) (3.9%) (3.4%) (2.9%) Note: Discounted cash flow
analysis based on cash flows discounted to June 30, 2023. Assumes mid-year discounting convention. 13 (1) Includes tariffs, adjustments to opex, taxes, stock-based compensation, reimbursables and other cash adjustments. Source: Management guidance.
WACC

HEP | Distribution Discount Model Projected Forecast Period ($mm,
unless otherwise noted) 2H2023E 2024E 2025E 2026E 2027E 2028E Terminal Total LP Distributable Cash Flow $180 $349 $360 $378 $400 $398 (/) Average Units Outstanding (mm) 126.6 126.6 126.6 126.6 126.6 126.6 LP DCF / Unit ( LP DCFPU ) $1.42 $2.76 $2.85
$2.98 $3.16 $3.15 LP Distribution / Unit ( LP DPU ) $0.70 $1.40 $1.40 $1.40 $1.40 $1.40 $1.40 Memo: Implied Coverage (x) 2.0x 2.0x 2.0x 2.1x 2.3x 2.2x Discounted LP DPU (11.125% Ke) $0.68 $1.26 $1.13 $1.02 $0.92 $0.83 Present Value of LP DPU
(11.125% Ke) $5.84 Terminal LP DPU $1.40 (/) Terminal Yield 8.3% Terminal Value (Undiscounted) $16.97 Present Value of Terminal Value (11.125% Ke) $9.50 Memo: % of Total 61.9% Implied Unit Price $15.34 Sensitivity Analysis $/unit, unless otherwise
noted PV of Terminal Value Implied Unit Price PV of Terminal Yield DPU 9.25% 8.75% 8.25% 7.75% 7.25% 9.25% 8.75% 8.25% 7.75% 7.25% 13.250% $5.57 $7.63 $8.07 $8.56 $9.11 $9.74 $13.20 $13.64 $14.13 $14.68 $15.31 12.188% 5.70 8.04 8.50 9.01 9.59 10.26
13.74 14.20 14.72 15.30 15.96 11.125% 5.84 8.47 8.96 9.50 10.11 10.81 14.31 14.79 15.34 15.95 16.65 10.063% 5.98 8.93 9.44 10.01 10.66 11.39 14.91 15.42 15.99 16.64 17.38 9.000% 6.13 9.42 9.96 10.56 11.24 12.02 15.55 16.09 16.69 17.37 18.15 14 Note:
Discounted cash flow analysis based on distributions discounted to June 30, 2023. Assumes mid-year discounting convention. Source: Management guidance. Cost of Equity

HEP | Preliminary Illustrative Valuation Analysis – Trading
Comparables (1) Methodology Metric Reference Range Implied Unit Price ($) Unaffected: $15.92 2023E Adj. EBITDA $15.28 $20.70 7.5x – 9.0x $458mm Current: $21.55 (2) Transaction: $22.25 2024E Adj. EBITDA $14.56 $20.21 7.0x – 8.5x $477mm
2023E DCF per Unit $15.89 $20.97 16.5% – 12.5% $2.62/unit Trading Comparables 2024E DCF per Unit 17.5% – 13.5% $15.76 $20.42 $2.76/unit 2023E Distribution per Unit $15.14 $19.31 9.25% – 7.25% $1.40/unit Reference Range $15.32
$20.32 $5 $10 $15 $20 $25 $30 $35 Note: Market data as of August 14, 2023. (1) Based on $1,498mm of net debt and 126.6mm units outstanding as of June 30, 2023. 15 (2) Based on current DINO share price and 0.3150x exchange ratio plus $4.00 cash
consideration. Source: Management guidance, Wall Street research, FactSet.

HEP | Comparable Public Company Trading Analysis (5) (3) Unit Market
TEV/EBITDA LP DCF Yield Dist. Yield LP Dist. Coverage Lev. (LTM EBITDA) '23E - '25E CAGR Trading Liq. (1) (2) (4) Company Price Cap TEV 2023E 2024E 2023E 2024E LQA 2023E 2023E 2024E Debt Adj. Debt EBITDA Distr. 30-day ADTV Plains All American $15.29
$10.7 $20.5 8.0x 7.8x 15.5% 17.2% 7.0% 7.0% 2.2x 2.1x 3.1x 4.2x 1.2% 14.1% $49.5 NuStar Energy 15.37 1.9 6.1 8.4x 8.1x 18.3% 21.0% 10.4% 10.4% 1.8x 2.0x 4.1x 5.1x 2.2% 0.2% 7.3 Delek Logistics Partners 40.62 1.8 3.5 9.2x 8.7x 14.0% 14.8% 10.2% 10.2%
1.4x 1.4x 4.6x 4.6x 5.5% 3.4% 5.5 Genesis Energy 9.39 1.2 5.9 8.0x 7.7x 24.0% 23.4% 6.4% 6.4% 3.8x 3.7x 5.1x 6.3x 7.3% 5.3% 5.9 Global Partners 32.31 1.1 2.2 6.4x 6.2x 16.6% 16.4% 8.4% 8.3% 1.8x 1.7x 2.2x 2.6x 3.2% 3.5% 2.3 CrossAmerica Partners
19.86 0.8 1.5 10.1x 9.5x 13.7% 14.5% 10.6% 10.6% 1.3x 1.4x 4.3x 4.4x 6.2% -- 0.8 Mean - All (6 Companies) 8.3x 8.0x 17.0% 17.9% 8.8% 8.8% 2.0x 2.0x 3.9x 4.5x 4.3% 4.4% $11.9 Median - All (6 Companies) 8.2x 8.0x 16.1% 16.8% 9.3% 9.3% 1.8x 1.9x 4.2x
4.5x 4.3% 3.5% $5.7 Mean - LT&S (3 Companies) 8.5x 8.2x 15.9% 17.7% 9.2% 9.2% 1.8x 1.8x 3.9x 4.6x 3.0% 5.9% $20.8 Median - LT&S (3 Companies) 8.4x 8.1x 15.5% 17.2% 10.2% 10.2% 1.8x 2.0x 4.1x 4.6x 2.2% 3.4% $7.3 Mean - Small Cap. MLPs (3
Companies) 8.2x 7.8x 18.1% 18.1% 8.4% 8.4% 2.3x 2.2x 3.9x 4.4x 5.5% 2.9% $3.0 Median - Small Cap. MLPs (3 Companies) 8.0x 7.7x 16.6% 16.4% 8.4% 8.3% 1.8x 1.7x 4.3x 4.4x 6.2% 3.5% $2.3 (6) Holly Energy Partners (Transaction) $22.25 $2.8 $4.3 9.4x
9.0x 11.8% 12.4% 6.3% 6.3% 1.9x 2.0x 3.4x 3.4x 1.7% -- $1.5 (6) Holly Energy Partners (Current) $21.55 $2.7 $4.2 9.2x 8.9x 12.2% 12.8% 6.5% 6.5% 1.9x 2.0x 3.4x 3.4x 1.7% -- $1.5 (6) Holly Energy Partners (Transaction) $22.25 $2.8 $4.3 9.6x 9.3x
11.1% 11.1% 6.3% 6.5% 1.7x 1.7x 3.4x 3.4x 2.1% 5.8% $1.5 (6) Holly Energy Partners (Current) $21.55 $2.7 $4.2 9.4x 9.1x 11.5% 11.5% 6.5% 6.8% 1.7x 1.7x 3.4x 3.4x 2.1% 5.8% $1.5 Note: Market data as of August 14, 2023; pro forma announced M&A and
capital markets activity. Market capitalization and TEV shown in $bn. 30-day ADTV shown in $mm. (1) Reflects LP market capitalization for MLPs (i.e., excludes economic GPs and/or IDR value). (2) Reflects total enterprise value for MLPs (i.e.,
includes economic GPs and/or IDR value, if applicable, based on Intrepid estimates). (3) LTM EBITDA as of June 30, 2023. (4) Adjusted debt reflects 100% debt treatment for preferred equity. (5) LT&S CAGRs reflect ’23E – ’24E
for DKL due to lack of 2025E estimates. Select MLP CAGRs reflect ’23E – ’24E for CAPL and GLP due to lack of 2025E estimates. 16 (6) Reflects 30-day ADTV as of May 3, 2023. Source: Public disclosure, FactSet, Wall Street research.
Small Cap Consensus Mgmt. LT&S MLPs

HEP | Preliminary Illustrative Valuation Analysis – Precedent
Transactions Methodology Metric Reference Range Implied Unit Price ($) Unaffected: $15.92 Current: $21.55 2023E LP DCF / Unit: 14.0% – 11.0% $18.72 $23.83 $2.62 (1) Transaction: $22.25 Precedent 2023E DPU: $17.50 $23.33 8.0% – 6.0%
Transactions $1.40 $18.11 $23.58 Reference Range $5 $10 $15 $20 $25 $30 $35 Note: Market data as of August 14, 2023. 17 (1) Based on current DINO share price and 0.3150x exchange ratio plus $4.00 cash consideration. Source: Management guidance, Wall
Street research, FactSet, public disclosure.

Selected Midstream Parent-MLP Buy-In Precedent Transactions th Includes
selected transactions since 2016 with 8/8 equity value over $1bn Transaction Metrics Final Prem. to Unaff. 8/8ths Equity Buyer % FY+1 LP FY+1 LP % Cash 30-Day (1) Unaff. Date Buyer Target Value ($bn) Owned DCF Yield DPU Yield Consid. 1-Day VWAP
8/17/22 Phillips 66 DCP Midstream $8.7 56% 14.2% 4.1% 100% 20% 28% 6/23/22 PBF Energy PBF Logistics 1.1 48% 13.9% 6.8% 53% 32% 12% (2) (2) 5/13/22 Diamondback Energy Rattler Midstream 2.2 74% 11.3% 8.0% --% 17% 9% 2/10/22 Shell Shell Midstream 6.2
69% 10.5% 7.6% 100% 23% 25% 10/25/21 Phillips 66 Phillips 66 Partners 10.1 70% 10.6% 4.2% --% 7% 0% (2) 8/4/21 BP BP Midstream Partners 1.5 54% 11.2% 9.8% --% 11% 3% 2/4/21 Chevron Corp. Noble Midstream Partners 1.1 62% 21.3% 6.0% --% (1%) 6% (2)
10/2/20 TC Energy Corporation TC PipeLines 2.1 24% 13.5% 8.8% --% 14% 12% 2/25/20 Equitrans Midstream EQM Midstream Partners 4.6 54% 21.6% 5.2% --% 0% 3% 8/27/19 Blackstone Tallgrass Energy 6.3 44% 10.6% 10.0% 100% 56% 23% 4/1/19 UGI Corp. AmeriGas
Partners 3.3 26% 10.3% 8.9% 22% 13% 22% (2) 11/7/18 Western Gas Equity Partners Western Gas Partners 8.4 30% 8.5% 8.1% --% 8% 8% (2) 10/19/18 EnLink Midstream EnLink Midstream Partners 6.5 22% 9.2% 8.5% --% 1% 4% 10/17/18 Valero Energy Valero Energy
Partners 2.9 68% 7.0% 5.7% 100% 7% 12% 10/8/18 Antero Midstream GP LP Antero Midstream Partners LP 5.8 --% 7.9% 7.2% 10% 5% 4% 9/18/18 Dominion Energy Dominion Energy Midstream Partners 2.8 61% 8.2% 8.2% --% 1% 8% (2) 8/1/18 Energy Transfer Equity
Energy Transfer Partners 27.5 2% 12.5% 9.8% --% 11% 14% 6/1/18 OCI OCI Partners 1.0 88% 13.0% 13.0% 100% 15% 15% 5/16/18 Enbridge Spectra Energy Partners 17.6 83% 9.8% 8.7% --% 10% 3% 5/16/18 Enbridge Enbridge Energy Partners 4.9 33% 14.9% 9.1% --%
9% 6% 3/15/18 Williams Williams Partners 38.9 74% 7.6% 6.4% --% 14% 13% (2) 2/7/18 Tallgrass Energy GP Tallgrass Energy Partners 3.5 35% 9.6% 8.4% --% 10% 10% 12/29/17 Archrock Archrock Partners 1.0 41% 14.4% 7.8% --% 23% 22% 9/23/16 Columbia
Pipeline Group Columbia Pipeline Partners 1.7 47% 4.9% 4.7% 100% 11% 17% Summary Statistics (24 Transactions) 75th Percentile $7.0 68% 13.6% 8.9% 64% 16% 15% Mean $7.1 48% 11.5% 7.7% 29% 13% 12% Median $4.0 51% 10.6% 8.0% --% 11% 11% 25th Percentile
$2.0 32% 9.0% 6.3% --% 7% 5% (3) Holly Energy Partners / HF Sinclair (Transaction at Unaffected DINO) 5/3/23 HF Sinclair Corporation Holly Energy Partners $2.2 47% 15.2% 8.1% 23% 8% 1% (4) Holly Energy Partners / HF Sinclair (Transaction at Current
DINO) 5/3/23 HF Sinclair Corporation Holly Energy Partners $2.8 47% 11.8% 6.3% 18% 40% 30% Note: Excludes non-limited partnership/LLC transactions or transactions with non-US targets. Transaction (2) Reflects yield based on Wall Street consensus
metrics. metrics are based on management projections available in public disclosure (e.g., proxy statement). Market data (3) Metrics are based off pricing as of the unaffected date ($17.20/unit total consideration). 18 as of August 14, 2023. (4)
Metrics are based off pricing as of August 14, 2023 ($22.25/unit total consideration). (1) Does not include value attributable to an economic general partner or to incentive distribution rights. Source: FactSet, Wall Street research, Public
disclosure.

HEP | Wall Street Research Summary Selected HEP Target Price and
Ratings Ratings Summary Pre-Announcement Post-Announcement Broker Date Target Rating Updated? Target Rating Citi 4/5/23 $20 Hold Yes $17 Hold Buy 1 Barclays 4/4/23 $18 Sell No $18 Sell Sell 2 Hold JP Morgan 3/8/23 $19 Sell Yes $20 Sell 1 Raymond
James 2/24/23 $23 Buy Yes $21 Buy Max $23 1 Buy $21 1 Buy Median (4 Brokers) $20 1 Hold $19 1 Hold Mean (4 Brokers) $20 2 Sell $19 2 Sell Min $18 $17 19 Note: Market data as of August 14, 2023. Source: Wall Street research, Bloomberg.

III. DINO VALUATION DETAIL 20

DINO | Summary of Management’s Consolidated Financial Projections
Management Consolidated EBITDA by Segment ($mm) (1) Corp/Other: ($38) ($39) ($39) ($40) ($41) ($42) $4,620 $3,191 $2,886 $2,842 $377 $2,670 $2,661 $2,602 $391 $395 $414 $397 $319 $428 $360 $410 $75 $441 $445 $437 $1,307 $62 $258 $361 $395 $391 $400
$2,395 $70 $79 $1,798 $1,685 $1,361 $1,328 $100 $1,318 $89 $112 ($194) 2020A 2021A 2022A 2023E 2024E 2025E 2026E 2027E 2028E Refining Marketing Renewables Lubricants HEP (2) Management Consolidated Unlevered FCF ($mm) (3) Capex: ($425) ($1,028)
($682) ($1,020) ($946) ($887) ($828) ($705) ($851) $3,938 $2,171 $2,000 $1,965 $1,896 $1,774 $1,810 $279 ($619) 2020A 2021A 2022A 2023E 2024E 2025E 2026E 2027E 2028E (1) Adjusted to reflect full consolidation of HEP. (2) Calculated as EBITDA less
Capex (incl. turnarounds). 21 (3) Includes turnaround expense. Source: Management guidance, public disclosure.

Summary of Sensitivity Case At the Committee’s request, Intrepid
analyzed a projection case that sensitized the Renewables and Lubricants segments Renewables Lubricants ▪ Profitability drivers are highly volatile and include ▪ Forecast includes uplift from “McKinsey BOHO spread, D4 RIN price,
LCFS price and adjustments” related to potential commercial blenders’/producers’ tax credit improvements (e.g., pricing strategy, SKU rationalization) ▪ Management projections include a large uptick in volume in 2024E,
followed by gradual 1%-2% annual ▪ Management’s public commentary has indicated Commentary increases in utilization (1Q23A utilization was <50%) $250mm mid-cycle EBITDA ▪ Sensitivity reflects Wall Street research consensus
▪ Sensitivity excludes cash flows from McKinsey average EBITDA from 2024E to 2027E and held adjustments flat thereafter 2028E Impact ($127) ($98) to Total EBITDA (5%) (Terminal Year) (4%) ($mm) Cumulative Impact to Total EBITDA ($616) ($390)
(2H23E – 2028E) (4%) (3%) ($mm) Aggregate EBITDA ($1,006) Impact (2H23E – 2028E) (7%) ($mm) 22 Source: Management guidance, Wall Street research.

DINO | Summary of Valuation Methodologies Used Methodology Description
/ Key Metrics Historical Market ▪ Analyzed historical market trading performance and valuation Valuations and Wall Street Research ▪ Reviewed research analyst price targets included in equity research from twelve investment banks (For
Reference Only) ▪ Valuation based on trading metrics of selected peers: – Large-cap. Refiner Peers: MPC, PSX and VLO Comparable Public Company Trading – Small- and Mid-cap. (“SMID-cap.”) Refiner Peers: CVI, DK, PARR,
PBF and VTNR Analysis (1) ▪ Metrics included: (i) TEV/EBITDA and (ii) TEV/Unlevered Free Cash Flow – Evaluated on a 2023E and 2024E basis ▪ Valuation based on the present value of future cash flows expected to be generated by DINO
and an assumed terminal value (calculated by applying a range of terminal multiples to terminal year EBITDA) – Evaluated on an unlevered FCF basis Discounted Cash Flow Analysis – Ranges of terminal multiples based on public companies
operating with similar asset profiles – Discount rate range reflective of DINO’s weighted average cost of capital (“WACC”) o DINO WACC implied by CAPM and an analysis of public companies operating with similar asset profiles
23 (1) Defined as EBITDA less capex.

DINO | Preliminary Valuation Analysis Methodology Metric Reference
Range Implied Share Price ($) Unaffected: $41.91 Unaffected 52-Week Trading Range Trading Range $41.63 $65.61 Low (5/2/23) – High (11/22/22) Current: $57.95 (1) Unaffected Share Price Target Range $50.00 $73.00 (Low – Median –
High) $58.00 Wall Street Research (1) Post-Announcement Share Price Target Range $44.00 $70.00 (Low – Median – High) $59.00 Discounted Cash Flow $58.88 $72.38 (Management) WACC: 10.5% – 9.0% (2) PV of Unlevered FCF Term. Mult.:
5.25x – 6.25x Discounted Cash Flow $52.08 $64.40 (Sensitivity) Trading (3) Range of Metrics Various $51.02 $67.35 Comparables $10 $30 $50 $70 $90 Note: Market data as of August 14, 2023. (1) Forward target price. (2) Based on $2,010mm of net
debt as of June 30, 2023 and NCI based on midpoint of HEP DCF analysis. 24 (3) Reflects average low and average high implied share price; based on $2,010mm of net debt as of June 30, 2023 and NCI based on HEP’s current unit price. Source:
Management guidance, Wall Street research, Bloomberg. For Reference Only

DINO | Discounted Cash Flow Analysis Projected Forecast Period ($mm,
unless otherwise noted) 2H2023E 2024E 2025E 2026E 2027E 2028E Terminal Refining $1,224 $1,798 $1,685 $1,328 $1,361 $1,318 $1,318 Marketing 35 70 79 89 100 112 112 400 Renewables 76 258 361 391 395 400 445 Lubricants 134 360 410 437 441 445 428 HEP
208 395 391 397 414 428 (-) Corporate, Other & Eliminations (19) (39) (39) (40) (41) (42) (42) EBITDA $1,658 $2,842 $2,886 $2,602 $2,670 $2,661 $2,661 (1) (-) Depreciation & Amortization (369) (739) (739) (739) (739) (739) (881) EBIT $1,289
$2,103 $2,147 $1,863 $1,931 $1,923 $1,923 (-) Taxes at 20.4% (263) (429) (438) (380) (394) (392) (392) NOPAT $1,026 $1,674 $1,709 $1,483 $1,537 $1,530 $1,530 (+) Depreciation & Amortization 369 739 739 739 739 739 881 (-) Sustaining Capex (489)
(846) (787) (728) (605) (751) (781) (-) Discretionary Capex (27) (100) (100) (100) (100) (100) (100) (+/-) Change in NWC -- -- -- -- -- -- -- Unlevered Free Cash Flow ( UFCF ) $879 $1,467 $1,561 $1,393 $1,571 $1,418 $1,530 Discounted Unlevered Free
Cash Flows (9.75% WACC) $859 $1,337 $1,296 $1,054 $1,083 $891 Present Value of Unlev. FCF (9.75% WACC) $6,519 Terminal EBITDA $2,661 (x) Terminal Multiple 5.75x Terminal Value (Undiscounted) $15,303 Present Value of Terminal Value (9.75% WACC)
$9,173 Memo: % of Total TEV 58.5% Memo: Implied Perpetuity Growth Rate (0.7%) Implied TEV $15,691 (-) Debt (3,214) (2) (-) Minority Interest (1,530) (+) Cash 1,204 Implied Equity Value $12,151 (÷) Total Shares Outstanding (mm) 185.8 Implied
Share Price $65.42 Sensitivity Analysis Implied TEV Implied Equity Value Implied Unit Price Implied Perpetuity Growth Rate $mm, unless per unit data PV of Terminal EBITDA Multiple UFCF 5.25x 5.50x 5.75x 6.00x 6.25x 5.25x 5.50x 5.75x 6.00x 6.25x
5.25x 5.50x 5.75x 6.00x 6.25x 5.25x 5.50x 5.75x 6.00x 6.25x 10.50% $6,410 $14,477 $14,861 $15,245 $15,630 $16,014 $10,937 $11,321 $11,706 $12,090 $12,474 $58.88 $60.95 $63.02 $65.09 $67.15 (1.0%) (0.5%) (0.0%) 0.4% 0.8% 10.13% 6,464 14,683 15,075
15,466 15,857 16,249 11,143 11,535 11,926 12,318 12,709 59.99 62.10 64.20 66.31 68.42 (1.4%) (0.8%) (0.4%) 0.1% 0.5% 9.75% 6,519 14,894 15,292 15,691 16,090 16,489 11,354 11,752 12,151 12,550 12,949 61.12 63.27 65.42 67.56 69.71 (1.7%) (1.2%) (0.7%)
(0.3%) 0.1% 9.38% 6,574 15,108 15,515 15,921 16,327 16,734 11,568 11,975 12,381 12,787 13,194 62.28 64.47 66.65 68.84 71.03 (2.1%) (1.6%) (1.1%) (0.6%) (0.2%) 9.00% 6,630 15,327 15,741 16,156 16,570 16,984 11,787 12,202 12,616 13,030 13,444 63.46
65.69 67.92 70.15 72.38 (2.4%) (1.9%) (1.4%) (1.0%) (0.6%) Note: Discounted cash flow analysis based on cash flows discounted to June 30, 2023. Assumes mid-year discounting convention. (1) Terminal D&A matches terminal total capex. 25 (2)
Reflects midpoint of HEP DCF analysis. Source: Management guidance. WACC

DINO | Discounted Cash Flow Analysis (Sensitivity Case) Projected
Forecast Period ($mm, unless otherwise noted) 2H2023E 2024E 2025E 2026E 2027E 2028E Terminal Refining $1,224 $1,798 $1,685 $1,328 $1,361 $1,318 $1,318 Marketing 35 70 79 89 100 112 112 272 Renewables 76 197 222 225 272 272 348 Lubricants 134 328 345
339 343 348 428 HEP 208 395 391 397 414 428 (-) Corporate, Other & Eliminations (19) (39) (39) (40) (41) (42) (42) EBITDA $1,658 $2,748 $2,682 $2,339 $2,450 $2,437 $2,437 (1) (-) Depreciation & Amortization (369) (739) (739) (739) (739)
(739) (881) EBIT $1,289 $2,009 $1,943 $1,600 $1,711 $1,698 $1,698 (-) Taxes at 20.4% (263) (410) (396) (326) (349) (346) (346) NOPAT $1,026 $1,599 $1,547 $1,274 $1,362 $1,351 $1,351 (+) Depreciation & Amortization 369 739 739 739 739 739 881 (-)
Sustaining Capex (489) (846) (787) (728) (605) (751) (781) (-) Discretionary Capex (27) (100) (100) (100) (100) (100) (100) (+/-) Change in NWC -- -- -- -- -- -- -- Unlevered Free Cash Flow ( UFCF ) $879 $1,393 $1,399 $1,184 $1,396 $1,239 $1,351
Discounted Unlevered Free Cash Flows (9.75% WACC) $859 $1,269 $1,161 $896 $962 $778 Present Value of Unlev. FCF (9.75% WACC) $5,924 Terminal EBITDA $2,437 (x) Terminal Multiple 5.75x Terminal Value (Undiscounted) $14,010 Present Value of Terminal
Value (9.75% WACC) $8,397 Memo: % of Total TEV 58.6% Memo: Implied Perpetuity Growth Rate (0.4%) Implied TEV $14,322 (-) Debt (3,214) (2) (-) Minority Interest (1,530) (+) Cash 1,204 Implied Equity Value $10,782 (÷) Total Shares Outstanding
(mm) 185.8 Implied Share Price $58.04 Sensitivity Analysis Implied TEV Implied Equity Value Implied Unit Price Implied Perpetuity Growth Rate $mm, unless per unit data PV of Terminal EBITDA Multiple UFCF 5.25x 5.50x 5.75x 6.00x 6.25x 5.25x 5.50x
5.75x 6.00x 6.25x 5.25x 5.50x 5.75x 6.00x 6.25x 5.25x 5.50x 5.75x 6.00x 6.25x 10.50% $5,829 $13,214 $13,565 $13,917 $14,269 $14,620 $9,674 $10,025 $10,377 $10,729 $11,080 $52.08 $53.97 $55.87 $57.76 $59.65 (0.6%) (0.1%) 0.4% 0.8% 1.2% 10.13% 5,876
13,401 13,759 14,117 14,476 14,834 9,861 10,219 10,577 10,936 11,294 53.09 55.01 56.94 58.87 60.80 (1.0%) (0.5%) 0.0% 0.4% 0.8% 9.75% 5,924 13,591 13,957 14,322 14,687 15,052 10,052 10,417 10,782 11,147 11,512 54.11 56.08 58.04 60.01 61.98 (1.3%)
(0.8%) (0.4%) 0.1% 0.5% 9.38% 5,973 13,786 14,158 14,530 14,902 15,274 10,246 10,618 10,990 11,362 11,735 55.16 57.16 59.17 61.17 63.17 (1.7%) (1.2%) (0.7%) (0.3%) 0.1% 9.00% 6,023 13,985 14,364 14,743 15,122 15,502 10,445 10,824 11,203 11,583
11,962 56.23 58.27 60.31 62.36 64.40 (2.0%) (1.5%) (1.1%) (0.7%) (0.3%) Note: Discounted cash flow analysis based on cash flows discounted to June 30, 2023. Assumes mid-year discounting convention. (1) Terminal D&A matches terminal total capex.
26 (2) Reflects midpoint of HEP DCF analysis. Source: Management guidance. WACC

DINO | Preliminary Illustrative Valuation Analysis – Trading
Comparables (1) Methodology Consolidated Metric Reference Range Implied Share Price ($) Unaffected: $41.91 2023E EBITDA $54.41 $71.59 4.25x – 5.25x Current: $57.95 $3,191mm 2024E EBITDA 5.25x – 6.25x $61.72 $77.02 $2,842mm Trading 2023E
UFCF 5.25x – 6.75x $42.75 $60.28 Comparables $2,171mm 2024E UFCF 6.25x – 7.75x $45.20 $60.51 $1,896mm Reference Range $51.02 $67.35 $10 $30 $50 $70 $90 Note: Market data as of August 14, 2023. EBITDA metrics shown on a fully consolidated
basis. UFCF defined as EBITDA less capex. 27 (1) Based on $2,010mm of net debt as of June 30, 2023 and NCI based on HEP’s current unit price. Source: Management guidance, Wall Street research, FactSet.

DINO | Comparable Company Trading Analysis (1) Share Market TEV/EBITDA
TEV/UFCF Dividend Yield Leverage '23E - '25E CAGR Trading Liq. (2) Company Price Cap TEV 2023E 2024E 2023E 2024E LQA 2023E LTM EBITDA EBITDA Div. 30-day ADTV Marathon Petroleum $148.54 $59.4 $92.3 5.5x 7.5x 6.4x 9.3x 2.1% 2.1% 1.2x (17.3%) 7.1%
$416.4 Phillips 66 114.67 51.1 68.0 5.6x 6.7x 6.9x 8.4x 3.6% 3.6% 1.2x (9.4%) 4.2% 331.0 Valero Energy 136.50 48.2 56.6 4.0x 6.0x 4.7x 8.2x 3.0% 3.0% 0.6x (24.3%) 2.0% 428.4 PBF Energy 49.52 6.1 6.1 2.6x 3.7x 4.4x 5.7x 1.7% 1.7% 0.4x (22.5%) 2.4%
92.3 CVR Energy 35.99 3.6 5.0 4.6x 6.6x 5.6x 7.8x 8.2% 8.2% 1.1x (24.4%) n.m. 33.1 Par Pacific 35.29 2.2 2.6 4.5x 5.9x 5.1x 8.0x -- -- 0.9x (22.8%) n.m. 23.6 Delek 28.18 1.8 4.3 4.4x 5.7x 7.0x 10.0x 2.8% 2.8% 2.4x (18.9%) 8.7% 32.5 Vertex Energy
4.63 0.4 0.6 5.3x 2.5x n.m. 4.2x -- -- 3.2x 49.5% n.m. 14.0 Mean - 8 Companies 4.6x 5.6x 5.7x 7.7x 3.1% 3.1% 1.4x (11.3%) 4.9% $171.4 Median - 8 Companies 4.5x 5.9x 5.6x 8.1x 2.5% 2.5% 1.2x (20.7%) 4.2% $62.7 Mean - Large Cap (3 Companies) 5.0x 6.8x
6.0x 8.6x 2.9% 2.9% 1.0x (17.0%) 4.4% $391.9 Median - Large Cap (3 Companies) 5.5x 6.7x 6.4x 8.4x 3.0% 3.0% 1.2x (17.3%) 4.2% $416.4 Mean - SMID Cap (5 Companies) 4.3x 4.9x 5.5x 7.1x 3.3% 3.3% 1.6x (7.8%) 2.4% $49.7 Median - SMID Cap (5 Companies)
4.5x 5.7x 5.4x 7.8x 1.7% 1.7% 1.1x (22.5%) 2.4% $32.5 (3) HF Sinclair Corporation (Consensus) $57.95 $10.8 $14.2 4.7x 5.3x 7.2x 8.0x 3.1% 3.1% 0.8x (10.5%) 4.4% $117.1 (3) HF Sinclair Corporation (Management) $57.95 $10.8 $14.2 4.5x 5.0x 6.6x 7.5x
3.1% 3.1% 0.8x (4.9%) -- $117.1 Note: Market data as of August 14, 2023. Market capitalization and TEV shown in $bn. 30-day ADTV shown in $mm. (1) UFCF calculated as EBITDA less capex. (2) LTM EBITDA as of June 30, 2023. 28 (3) Reflects 30-day ADTV
as of May 3, 2023. Source: FactSet, Public disclosure, Wall Street research, Management guidance. SMID Cap. Large Cap.

Volume ('000s) DINO Share Price Performance & Trading Statistics
DINO Two-Year Price Performance Unaffected Historical Trading Stats $75 16,000 ADTV ADTV Unaffected Historical Trading VWAP (mm) ($mm) 10-Day 20-Day 30-Day 1-Year $70 VWAP $43.22 $44.50 $45.98 $51.14 (1) Unaffected $41.91 6.5 $271.3 High $45.14
$47.96 $49.78 $65.61 (5/3/23) Low $41.63 $41.63 $41.63 $41.63 $65 Unaffected $43.22 2.7 $115.2 12,000 10-Day DINO $60 $57.95 Unaffected 91% $44.50 2.3 $103.8 20-Day $55 Unaffected $45.98 2.5 $117.1 30-Day $50 8,000 Unaffected $48.22 2.6 $124.8 $45
60-Day Unaffected $40 $49.58 2.4 $118.1 90-Day 4,000 $35 Unaffected $52.72 2.3 $118.8 180-Day $30 Unaffected $51.14 2.3 $115.6 $30.39 1-Year $25 -- Aug-21 Dec-21 Apr-22 Aug-22 Dec-22 Apr-23 Aug-23 Volume DINO Initial Proposal Received Note: Market
data as of August 14, 2023. 29 (1) Reflects closing price. Source: FactSet, public disclosure.

Volume (000s) DINO | Historical Price Performance Two-Year Indexed
Price Performance $70 16,000 125% $65 14,000 104% $60 $57.95; 91% 12,000 $55 10,000 $50 $45 8,000 $40 6,000 $35 4,000 $30.39 $30 2,000 $25 $20 -- Aug-21 Oct-21 Jan-22 Mar-22 Jun-22 Aug-22 Oct-22 Jan-23 Mar-23 Jun-23 Aug-23 (1) (2) DINO Volume
SMID-cap Refiner Peers Large-cap Refiner Peers Note: Market data as of August 14, 2023. 1) SMID-cap Refiner Peers include CVI, DK, and PARR. PBF and VTNR excluded due to extreme price volatility since January 2021. 30 2) Large-cap Refiner Peers
include MPC, PSX and VLO. Source: FactSet, public disclosure. Indexed to DINO Share Pirce

DINO | Wall Street Research Summary Selected DINO Selected Target Price
and Ratings Ratings Summary Pre-Announcement Post-Announcement Broker Date Target Rating Updated? Target Rating UBS 5/4/23 $58 Hold Yes $53 Hold Bank of America 5/4/23 $64 Buy Yes $62 Buy Hold 4 Piper Sandler & Co. 5/1/23 $73 Buy Yes $70 Buy
Mizuho Capital 4/20/23 $68 Buy Yes $56 Buy RBC Capital 4/19/23 $66 Buy Yes $61 Buy Buy Wells Fargo 4/18/23 $52 Buy Yes $60 Buy 8 Goldman Sachs 4/18/23 $58 Buy Yes $63 Buy Scotiabank 4/13/23 $57 Buy Yes $54 Buy Cowen 4/13/23 $50 Hold Yes $44 Hold TPH
&Co. 4/10/23 $56 Buy Yes $60 Buy Barclays 4/9/23 $55 Hold No $55 Hold JP Morgan 4/5/23 $57 Hold Yes $57 Hold Max $73 8 Buy $70 8 Buy Median (12 Brokers) $58 4 Hold $59 4 Hold Mean (12 Brokers) $60 $58 Min $50 $44 31 Note: Market data as of
August 14, 2023. Price Targets and Ratings reflect select research reports. Source: Wall Street research, Bloomberg.

IV. APPENDIX 32

TAB A: HEP VALUATION ANALYSIS SUPPORT 33

HEP | Weighted Average Cost of Capital (“WACC”) Analysis
(1) ($ in billions, unless noted) Adj. Beta Levered Unlevered Market Value Net Debt / Tax Company of Equity Net Debt Preferred Total Cap. Rate 1-yr 3-yr 5-yr 1-yr 3-yr 5-yr Plains All American 10.7 7.1 2.7 35% -- 0.70 0.88 1.07 0.37 0.46 0.56 NuStar
Energy 1.9 3.4 0.8 55% -- 0.79 0.84 0.92 0.25 0.26 0.29 Delek Logistics Partners 1.8 1.7 0.0 50% -- 0.69 0.75 1.00 0.35 0.38 0.50 Global Partners 1.2 1.0 0.1 42% -- 0.79 0.89 0.90 0.40 0.45 0.46 Genesis Energy 1.2 3.6 0.8 61% -- 0.96 0.99 1.23 0.20
0.20 0.26 CrossAmerica Partners 0.8 0.8 0.0 50% -- 0.66 0.70 0.73 0.32 0.34 0.36 Mean - All 49% 0.77 0.84 0.98 0.31 0.35 0.40 Median - All 50% 0.74 0.86 0.96 0.33 0.36 0.41 Mean - LT&S 46% 0.73 0.82 1.00 0.32 0.37 0.45 Median - LT&S 39% 0.70
0.84 1.00 0.35 0.38 0.50 Mean - Small Cap MLPs 51% 0.80 0.86 0.96 0.31 0.33 0.36 Median - Small Cap MLPs 50% 0.79 0.89 0.90 0.32 0.34 0.36 Holly Energy Partners $2.7 $1.5 $ -- 35% -- 0.72 0.73 0.62 0.47 0.47 0.40 Cost of Equity and WACC Calculation
Cost of Equity Sensitivity Analysis (2) Unlevered Beta Risk-Free Rate 4.3% 0.35 0.40 0.45 0.50 0.55 (3) 0.45 Unlevered Beta 30% 9.0% 9.5% 10.1% 10.6% 11.1% Target Net Debt / Total Cap. 40.0% 35% 9.3% 9.9% 10.4% 11.0% 11.5% Levered Beta 0.75 40% 9.6%
10.2% 10.8% 11.4% 12.0% (4) 7.2% Equity Risk Premium 45% 10.0% 10.7% 11.3% 12.0% 12.6% (5) 1.2% Size Premium 50% 10.5% 11.2% 11.9% 12.6% 13.3% Implied Cost of Equity 10.8% WACC Sensitivity Analysis (6) 7.5% Pre-Tax Cost of Debt Unlevered Beta Tax
Rate 0.0% 0.35 0.40 0.45 0.50 0.55 After-Tax Cost of Debt 7.5% 30% 8.6% 8.9% 9.3% 9.7% 10.0% Target Net Debt / Total Cap. 40.0% 35% 8.7% 9.0% 9.4% 9.8% 10.1% (7) 9.5% WACC 40% 8.8% 9.1% 9.5% 9.9% 10.2% 45% 8.9% 9.2% 9.6% 10.0% 10.3% Note: Market
data as of August 14, 2023. Balance sheet data as of June 30, 2023. Peers sorted by market value of equity. 50% 9.0% 9.3% 9.7% 10.1% 10.4% (1) Represents historical Bloomberg adjusted beta, regressed weekly against the S&P 500. (2) 30-year
treasury yield as of August 14, 2023. (6) Based on YTW of senior unsecured notes recently issued by select peers. (3) βU = βL/(1+D/E x (1-t) + P/E). (7) WACC = (KD x (1- t) x D/(D + E)))+(KE x E / (D + E)). 34 (4) Sourced from Kroll Cost
of Capital Navigator – 2022. Source: Bloomberg, 2022 Kroll Valuation Handbook, U.S. Department of the th (5) Represents size premium for CRSP 6 decile as of December 31, 2022 (range of $1.4bn - $2.4bn market capitalization). Treasury, Public
disclosure, FactSet. Small Cap. LT&S MLPs Target Net Debt / Target Net Debt / Total Cap. Total Cap.

HEP | Selected Peer Debt Trading Analysis Issuer Maturity Date Amount
Security Coupon Issue Rating Price YTW Plains All American Pipeline Sep-30 $750 Sr. Unsecured 3.800% Baa3/BBB- 87.9 5.91% Delek Logistics Jun-28 400 Sr. Unsecured 7.125% B3/BB- 89.8 9.85% NuStar Energy Oct-30 600 Sr. Unsecured 6.375% Ba3/BB- 95.4
7.21% Genesis Energy Apr-30 500 Sr. Unsecured 8.875% B2/B 97.9 9.29% Global Partners Jan-29 350 Sr. Unsecured 6.875% B2/B+ 93.2 8.47% DT Midstream Jun-31 1,000 Sr. Unsecured 4.375% Ba2/BB+ 86.5 6.61% EnLink Midstream Sep-30 1,000 Sr. Unsecured
6.500% Ba1/BB+ 99.9 6.52% Hess Midstream Oct-30 400 Sr. Unsecured 5.500% Ba2/BB+ 92.5 6.83% Sustainability-Linked Kinetik Jun-30 1,000 5.875% Ba1/BB+ 95.5 6.70% Sr. Notes Mean 6.144% 93.2 7.49% Median 6.375% 93.2 6.83% Investment Grade Mean 3.800%
87.9 5.91% Investment Grade Median 3.800% 87.9 5.91% BB Mean 5.958% 93.3 7.29% BB Median 6.125% 94.0 6.76% B Mean 7.875% 95.5 8.88% B Median 7.875% 95.5 8.88% HEP Feb-28 $500 Sr. Unsecured 5.000% Ba3/BB+ 92.9 6.86% Note: Market data as of August 11,
2023. 35 (1) Excludes CAPL, MMLP, USDP and WLKP due to lack of publicly traded and/or comparable debt. Source: Bloomberg, Public disclosure, FactSet. Other BB+ Small Cap. LT&S Peers (1) MLP Peers Midstream

TAB B: DINO VALUATION ANALYSIS SUPPORT 36

DINO | Weighted Average Cost of Capital (“WACC”) Analysis
(1) ($ in billions, unless noted) Adj. Beta Levered Unlevered Market Value Net Net Debt / Tax Company of Equity Debt Total Cap. Rate 1-yr 3-yr 5-yr 1-yr 3-yr 5-yr Marathon Petroleum $59.4 $20.3 22% 21% 0.70 0.83 1.26 0.55 0.66 0.99 Phillips 66 51.1
15.7 23% 21% 0.81 0.80 1.00 0.65 0.64 0.80 Valero Energy 48.2 6.2 11% 21% 0.80 0.82 1.15 0.72 0.74 1.05 PBF Energy 6.1 (0.0) (1%) 21% 0.61 0.76 1.25 0.61 0.76 1.25 CVR Energy 3.6 0.8 17% 21% 1.17 0.92 0.95 0.99 0.78 0.80 Par Pacific 2.2 0.4 16% 21%
0.98 1.17 1.19 0.86 1.02 1.04 Delek 1.8 2.1 48% 21% 0.87 0.92 0.91 0.46 0.49 0.48 Vertex Energy 0.4 0.2 31% 21% 1.59 1.27 1.39 1.18 0.94 1.03 Mean - All 21% 0.94 0.94 1.14 0.75 0.75 0.93 Median - All 19% 0.84 0.88 1.17 0.69 0.75 1.01 Mean - Large
Cap. Refiners 19% 0.77 0.82 1.14 0.64 0.68 0.95 Median - Large Cap. Refiners 22% 0.80 0.82 1.15 0.65 0.66 0.99 Mean - SMID Cap. Refiners 22% 1.04 1.01 1.14 0.82 0.80 0.92 Median - SMID Cap. Refiners 17% 0.98 0.92 1.19 0.86 0.78 1.03 HF Sinclair
$10.8 $2.0 14% 20% 0.76 0.80 1.08 0.66 0.70 0.94 Cost of Equity and WACC Calculation Cost of Equity Sensitivity Analysis (2) Unlevered Beta Risk-Free Rate 4.3% 0.60 0.65 0.70 0.75 0.80 (3) 0.70 Unlevered Beta 10% 9.5% 9.9% 10.3% 10.7% 11.1% Target
Net Debt / Total Cap. 20.0% 15% 9.8% 10.2% 10.6% 11.0% 11.4% Levered Beta 0.84 20% 10.0% 10.4% 10.9% 11.3% 11.7% (4) 7.2% Equity Risk Premium 25% 10.3% 10.8% 11.2% 11.7% 12.1% (5) 0.6% Size Premium 30% 10.6% 11.1% 11.6% 12.1% 12.6% Implied Cost of
Equity 10.9% WACC Sensitivity Analysis (6) 7.0% Pre-Tax Cost of Debt Unlevered Beta Tax Rate 20.4% 0.60 0.65 0.70 0.75 0.80 10% 9.1% 9.5% 9.8% 10.2% 10.6% After-Tax Cost of Debt 5.6% 15% 9.1% 9.5% 9.8% 10.2% 10.5% Target Net Debt / Total Cap. 20.0%
20% 9.1% 9.5% 9.8% 10.2% 10.5% (7) 9.8% WACC 25% 9.1% 9.5% 9.8% 10.1% 10.5% Note: Market data as of August 14, 2023. Balance sheet data as of June 30, 2023. Peers sorted by market value of equity. 30% 9.1% 9.4% 9.8% 10.1% 10.5% (1) Represents
historical Bloomberg adjusted beta, regressed weekly against the S&P 500. (2) 30-year treasury yield as of August 14, 2023. (6) Based on YTW of senior unsecured notes recently issued by select peers. (3) βU = βL/(1+D/E x (1-t)+P/E).
(7) WACC = (KD x (1- t) x D/(D + E)))+(KE x E / (D + E)). 37 (4) Sourced from Kroll Cost of Capital Navigator – 2022. Source: Bloomberg, 2022 Kroll Valuation Handbook, U.S. Department of the rd (5) Represents size premium for CRSP 3 decile as
of December 31, 2022 (range of $5.9bn - $12.3bn market capitalization). Treasury, Public disclosure, FactSet. Large SMID Cap. Cap. Target Net Debt Target Net Debt / Total Cap. / Total Cap.

DINO | Selected Peer Debt Trading Analysis Issuer Maturity Date Amount
Security Coupon Issue Rating Price YTW Marathon Petroleum Apr-28 $496 Sr. Unsecured 3.800% Baa2/BBB 93.0 5.52% Phillips 66 Jun-33 500 Sr. Unsecured 5.300% A3/BBB+ 98.0 5.56% Valero Energy Apr-29 439 Sr. Unsecured 4.000% Baa2/BBB 93.9 5.26% PBF
Energy Feb-28 827 Sr. Unsecured 6.000% Ba3/BB 94.0 7.59% CVR Energy Feb-28 400 Sr. Unsecured 5.750% B1/B+ 91.9 7.93% Mean 4.970% 94.2 6.37% Median 5.300% 93.9 5.56% Investment Grade Mean 4.367% 95.0 5.44% Investment Grade Median 4.000% 93.9 5.52% BB
Mean 6.000% 94.0 7.59% BB Median 6.000% 94.0 7.59% B Mean 5.750% 91.9 7.93% B Median 5.750% 91.9 7.93% DINO Oct-30 $400 Sr. Unsecured 4.500% Baa3 / BBB- 89.4 6.37% Note: Market data as of August 11, 2023. 38 (1) Excludes PARR due to lack of publicly
traded and/or comparable debt. Source: Bloomberg, Public disclosure, FactSet. SMID Cap. Large Cap. Peers (1) Peers

Disclaimer These materials have been prepared by Intrepid Partners, LLC
(“Intrepid”) for the Conflicts Committee (the “Committee”) of the Board of Directors of Holly Logistic Services, L.L.C. (the “General Partner”), the ultimate general partner of Holly Energy Partners, L.P.
(“HEP”), to whom such materials are directly addressed and delivered. These materials are confidential and may not be used or relied upon by any other person or for any purpose other than as specifically contemplated by a written
agreement with Intrepid. These materials have been developed by and are proprietary to Intrepid and were prepared exclusively for the benefit and internal use of the Committee in connection with evaluating the Proposed Transaction with HEP and HF
Sinclair Corporation (“DINO”). These materials are based upon information provided by or on behalf of the management of DINO and the General Partner, from public sources, or otherwise reviewed by Intrepid. Intrepid has relied upon and
assumes no responsibility for independent investigation or verification of such information and has relied upon such information being complete and accurate in all material respects. To the extent such information includes estimates and forecasts of
future performance prepared by or reviewed with management of DINO or the General Partner and/or other potential transaction participants or obtained from public sources, Intrepid has assumed that such estimates and forecasts have been reasonably
prepared on bases reflecting the best currently available estimates and judgments of management of DINO, and the General Partner or such other potential transaction participants (or, with respect to estimates and forecasts obtained from public
sources, represent reasonable estimates). Actual results may differ materially from such estimates and forecasts. No representation or warranty, express or implied, is made as to the accuracy or completeness of such information, and nothing
contained herein is, or shall be relied upon as, a representation or warranty, whether as to the past, the present or the future. The materials and related commentary are not intended to provide the only basis for evaluating, and should not be
considered a recommendation with respect to, the consideration paid, the proposed transaction or any transaction or other matter. These materials are also subject to the qualifications and limitations described in any accompanying written opinion
letter. These materials were compiled on a confidential basis solely for use by the Committee and may not be relied on by any other party (including stakeholders in either entity), even if such parties are provided a copy of these materials. These
materials were prepared without a view to public disclosure or filing thereof under state or federal laws, and may not be redistributed, reproduced, distributed, passed to others, transmitted, quoted or referred to, in whole or in part, without the
prior written permission of Intrepid in accordance with the terms of our engagement letter with the Committee. These materials speak only as of the date on the cover and Intrepid assumes no obligation to update these materials or inform any
recipient of changed circumstances, events or information. These materials were prepared for a specific use by specific persons and were not prepared to conform with any disclosure standards under securities laws or otherwise. In the ordinary course
of its business, each of Intrepid and its affiliates may actively trade or hold the securities of DINO, HEP or other parties involved in a proposed transaction for its own account or for the account of its customers and, accordingly, may at any time
hold a long or short position in such securities. Intrepid will receive a fee in connection with delivery of an opinion relating to the proposed transaction. These materials do not constitute, nor do they form part of, an offer or solicitation to
sell or purchase any securities or instruments and are not a commitment by Intrepid or any of its affiliates to provide, arrange or underwrite any financing for any transaction or to purchase any security in connection therewith. These materials may
not reflect information known to other professionals in other business areas of Intrepid and its affiliates. Intrepid and its affiliates do not provide, and the information herein does not constitute, legal, regulatory, accounting, bankruptcy,
securities or tax advice. Any statements contained herein as to tax matters were neither written nor intended by Intrepid or its affiliates to be used and cannot be used by any taxpayer for any tax purposes, including but not limited to, the purpose
of avoiding tax penalties that may be imposed on such taxpayer. Each person should seek legal, regulatory accounting and tax advice based on his, her or its particular circumstances from independent advisors regarding the evaluation and impact of
any transactions or matters described herein.
Exhibit (f)(2)
Delaware Revised Uniform Limited Partnership Act
Delaware Code Title 6 § 17-212.
Unless otherwise provided in a partnership agreement or an agreement of merger or consolidation or a plan of merger or a plan of division, no appraisal rights
shall be available with respect to a partnership interest or another interest in a limited partnership, including in connection with any amendment of a partnership agreement, any merger or consolidation in which the limited partnership or a
registered series of the limited partnership is a constituent party to the merger or consolidation, any division of the limited partnership, any conversion of the limited partnership to another business form, any conversion of a protected series of
the limited partnership to a registered series of such limited partnership, any conversion of a registered series of the limited partnership to a protected series of such limited partnership, any transfer to or domestication or continuance in any
jurisdiction by the limited partnership, or the sale of all or substantially all of the limited partnership’s assets. The Court of Chancery shall have jurisdiction to hear and determine any matter relating to any appraisal rights provided in a
partnership agreement or an agreement of merger or consolidation or a plan of merger or a plan of division.
Exhibit 107
Calculation of Filing Fee Tables
Table 1—Transaction Value
|
|
|
|
|
|
|
| |
|
|
|
| |
|
Transaction
Valuation |
|
Fee Rate |
|
Amount of
Filing Fee |
| |
|
|
|
| Fees to Be Paid |
|
$1,528,911,630.30(1) |
|
0.00011020 |
|
$168,486.06(2) |
| |
|
|
|
| Fees Previously Paid |
|
$0 |
|
|
|
$0 |
| |
|
|
|
| Total Transaction Valuation |
|
$1,528,911,630.30 |
|
|
|
|
| |
|
|
|
| Total Fees Due for Filing |
|
|
|
|
|
$168,486.06 |
| |
|
|
|
| Total Fees Previously Paid |
|
|
|
|
|
$0 |
| |
|
|
|
| Total Fee Offsets |
|
|
|
|
|
$168,486.06(3) |
| |
|
|
|
| Net Fee
Due |
|
|
|
|
|
$0 |
Table 2—Fee Offset Claims and Sources
|
|
|
|
|
|
|
|
|
|
|
|
|
|
|
| |
|
|
|
|
|
|
|
| |
|
Registrant
or Filer
Name |
|
Form
or Filing
Type |
|
File
Number |
|
Initial
Filing Date |
|
Filing Date |
|
Fee Offset
Claimed |
|
Fee Paid
with Fee
Offset Source |
| |
|
|
|
|
|
|
|
| Fee Offset Claims |
|
|
|
Form S-4 |
|
333-274655 |
|
September 22, 2023 |
|
|
|
$168,486.06 |
|
|
| |
|
|
|
|
|
|
|
| Fee Offset Sources |
|
HF Sinclair Corporation |
|
Form S-4 |
|
333-274655 |
|
|
|
September 22, 2023 |
|
|
|
$168,486.06(3) |
| (1) |
This Schedule 13E-3 relates to the registration of shares of Common
Stock, par value $0.01 per share (the “HF Sinclair Common Stock”), of HF Sinclair Corporation (“HF Sinclair”) into which the common units representing limited partner interests (the “HEP Common Units”) in Holly
Energy Partners, L.P. (“HEP”), will be exchanged. The transaction valuation (the “Transaction Valuation”) is calculated solely for purposes of determining the filing fee in accordance with Rule
0-11 under the Securities Exchange Act of 1934, as amended (the “Exchange Act”). The Transaction Valuation is calculated based on the product of (a) $22.83, the average of the high and low
prices of a HEP Common Unit as reported on the New York Stock Exchange on September 19, 2023, which is within five business days prior to the filing of this Schedule 13E-3, and (b) 66,969,410, the
estimated maximum number of HEP Common Units that may be exchanged for consideration in the merger that is the subject of this Schedule 13E-3 (the “Merger”), which is the sum of (i) 66,810,171
HEP Common Units estimated to be held by public unitholders of HEP immediately prior to completion of the Merger and (ii) 159,239 HEP Common Units underlying outstanding awards issued under the Holly Energy Partners, L.P. Long-Term Incentive Plan
and other plans of HEP or Holly Logistic Services, L.L.C. providing for the grant of awards of HEP Common Units (assuming target performance of any such awards that are conditioned upon the satisfaction or attainment of a performance or incentive
goal). |
| (2) |
The filing fee, calculated in accordance with Exchange Act Rule 0-11,
is calculated by multiplying the Transaction Valuation by 0.00011020. |
| (3) |
HF Sinclair previously paid $168,486.06 upon the filing of its Registration Statement on Form S-4 on September 22, 2023 in connection with the transaction reported hereby. |
Holly Energy Partners (NYSE:HEP)
Historical Stock Chart
From Apr 2024 to May 2024

Holly Energy Partners (NYSE:HEP)
Historical Stock Chart
From May 2023 to May 2024
