Ocean Tomo 300(TM) Patent Index Hits Record High
November 20 2006 - 9:00AM
PR Newswire (US)
New Ocean Tomo 300(TM) Patent Index Tracking the 'Knowledge
Economy' Outperforms S&P 500 through its Third Week CHICAGO,
Nov. 20 /PRNewswire/ -- Ocean Tomo, LLC, the Chicago-based provider
of diversified intellectual property-related services, announced
the Ocean Tomo 300(TM) Patent Index, the first equity index based
on the value of corporate intellectual property, concluded trading
on November 17 at 5880.48, a new record high. It continues to
outpace the S&P 500 since the Index's reconstitution on October
31, 2006. "The Ocean Tomo 300(TM) Patent Index continues to receive
considerable attention. Morgan Stanley Institutional Equity
mentioned the Claymore/Ocean Tomo Patent ETF in the section of
Announced Plans for New ETFs in its Exchange Traded Funds - Q3 2006
Global Review. The intended symbol of the Claymore/Ocean Tomo
Patent ETF is OTR," said Keith Cardoza, Managing Director of Ocean
Tomo and Chief Investment Officer of Ocean Tomo Asset Management.
Standard and Poor's included Ocean Tomo 300(TM) member Celgene
(NASDAQ: CELG) in the S&P 500 on November 3, 2006. Several
member companies including InterDigital Communications Corp.
(NASDAQ:IDCC) and Energy Conversion Devices, Inc. (NASDAQ:ENER)
have reported their inclusion in the Index in quarterly earnings
filings. Garmin Ltd. (NASDAQ:GRMN) and United Technologies
(NYSE:UTX) have also incorporated their inclusion in recent press
releases or company highlights. "The Ocean Tomo 300(TM) Patent
Index is the most relevant index to measure the knowledge economy.
It allows investors for the first time to commit a meaningful and
sustainable portion of their capital to intellectual property as a
distinct asset class ... the most valuable asset of the knowledge
economy," Cardoza added. The Ocean Tomo 300(TM) Patent Index is a
diversified market-weighted index of 300 companies that own the
most valuable patents relative to their book value. The American
Stock Exchange recognizes the Index as "the first major,
broad-based market equity index to be launched in 35 years, and
follows the progression from the Dow Jones Industrial Average in
1896, to the Standard & Poor's 500 in 1957 and then to the
NASDAQ Composite Index in 1971." Over a 10- year time period ending
October 2006, the Ocean Tomo 300(TM) Patent Index outperformed the
S&P 500 by more than 300 basis points annualized. Among the
companies that trade on the Ocean Tomo 300(TM) Patent Index as of
November 1, 2006 are: Baker Hughes (NYSE:BHI), Garmin
(NASDAQ:GRMN), Pactiv (NYSE:PTV), Invitrogen (NASDAQ:IVGN), Intel
(NASDAQ:INTC), Gannett (NYSE:GCI), Baxter (NYSE:BAX), Brunswick
(NYSE:BC), Alberto-Culver (NYSE: ACV), Ecolab (NYSE:ECL) and Adtran
(NASDAQ:ADTN). The full list of companies in the Index and other
materials are available at http://www.oceantomoindexes.com/ and
http://www.amex.com/. Also recently available at
http://www.oceantomoindexes.com/ are company dashboards for all 300
constituents listing average IPQ(R) score, top patents, intangible
value as percentage of market capitalization and complete member
company news. Ocean Tomo 300(TM) Patent Index Rate of Return versus
S&P 500: November 1 - 17, 2006* Ocean Tomo 300(TM) Patent
Index: 1.8% S&P 500: 1.6% * Returns are calculated from close
of market on October 31, 2006 to close of market November 17, 2006,
using prices from Bloomberg. Ocean Tomo 300(TM) Patent Index
Methodology The Ocean Tomo 300(TM) Patent Index represents a
diversified portfolio of 300 companies that own the most valuable
patents relative to their book value. The Index selection
methodology identifies six companies within each of 50 size and
style groups, reflecting a broad spectrum of market capitalizations
and investment styles, including value, relative value, blend,
growth at a reasonable price (GARP) and growth by decile, that have
the highest ratio of patent value to book value. The analytical
engine used to evaluate the value of each company's patent
portfolio is Ocean Tomo's PatentRatings(TM) software, which
calculates the relative attractiveness of the more than four
million patents issued by the U.S. Patent and Trademark Office
since 1983, and which is widely recognized by the intellectual
property valuation industry. The methodology developed by Ocean
Tomo is a 100 percent rules-based, quantitative approach to
selecting stocks from a universe of 1,000 companies. The Index
constituent selection process utilizes multi-factor proprietary
selection rules to identify those stocks that offer the greatest
patent value opportunities while maintaining broad-based
diversification. The Index annually reconstitutes after the close
of business on the last business day of October. Daily tracking of
the Ocean Tomo 300(TM) Patent Index is available at numerous media
outlets including: Bloomberg.com (^OTPAT), Bloomberg terminal
(OTPAT ), MarketWatch.com (OTPAT), and Yahoo! Finance (^OTPAT). The
Ocean Tomo 300(TM) Patent Index is patent-pending and was created
by and is a trademark of Ocean Tomo Capital, LLC. Ocean Tomo's
PatentRatings(TM) software is protected by U.S. Patent Number
6,556,992. About Ocean Tomo, LLC: Established in 2003, Ocean Tomo,
LLC (http://www.oceantomo.com/) is a fully integrated intellectual
capital merchant banc that specializes in understanding and
leveraging intellectual property assets. The company provides
advice in IP-related mergers and acquisitions, valuations, expert
services, analytics and IP auctions. Ocean Tomo has offices in
Chicago, San Francisco, Palm Beach, Orange County and Washington,
DC. Subsidiaries of Ocean Tomo include: Ocean Tomo Capital, LLC,
publisher of the Ocean Tomo 300(TM) Patent Index (AMEX:OTPAT);
Ocean Tomo Capital Fund, LP -- a $200 million private equity
investment fund; and Ocean Tomo Asset Management, LLC -- an SEC
Registered Investment Advisor offering hedge funds utilizing
IP-based investment strategies. DATASOURCE: Ocean Tomo, LLC
CONTACT: Melissa Kanter, +1-212-704-8261, , or Judith Flynn
Echeverria, +1-212-819-4806, , both of Edelman Web site:
http://www.oceantomo.com/
Copyright
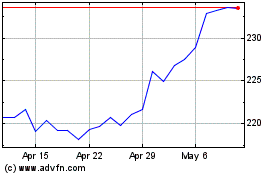
Ecolab (NYSE:ECL)
Historical Stock Chart
From Oct 2024 to Nov 2024

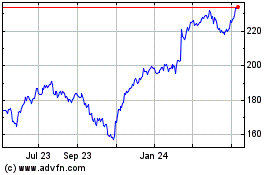
Ecolab (NYSE:ECL)
Historical Stock Chart
From Nov 2023 to Nov 2024
