UNITED STATES
SECURITIES AND EXCHANGE COMMISSION
Washington, D.C. 20549
FORM 6-K
REPORT OF FOREIGN PRIVATE ISSUER PURSUANT TO
RULE 13a-16 OR 15d-16
UNDER THE SECURITIES EXCHANGE ACT OF 1934
July 27, 2023
| Commission File Number 001-16125 |
| |
|
| ASE Technology Holding Co., Ltd. |
| (Translation of registrant’s name into English) |
| |
|
|
26, Chin 3rd Road
Kaohsiung, Taiwan
Republic of China |
| (Address of principal executive offices) |
Indicate by check mark whether the registrant files or will file annual
reports under cover of Form 20-F or Form 40-F.
SIGNATURES
Pursuant to the requirements of the Securities
Exchange Act of 1934, the registrant has duly caused this report to be signed on its behalf by the undersigned, thereunto duly authorized.
| |
ASE TECHNOLOGY HOLDING CO., LTD. |
| |
|
| |
|
| Date: July 27, 2023
|
By: |
/s/ Joseph Tung |
| |
|
Name: Joseph Tung |
| |
|
Title: Chief Financial Officer |

Second Quarter 2023 Earnings Release 27 July, 2023 ASE Technology Holding

Safe Harbor Notice This presentation contains "forward - looking statements" within the meaning of Section 27A of the United States Securities Act of 1933, as amended, and Section 21E of the United States Securities Exchange Act of 1934, as amended. Although these forward - looking statements, which may include statements regarding our future results of operations, financial condition or business prospects, are based on our own information and information from other sources we believe to be reliable, you should not place undue reliance on these forward - looking statements, which apply only as of the date of this press release. The words “anticipate,” “believe,” “estimate,” “expect,” “intend,” “plan” and similar expressions, as they relate to us, are intended to identify these forward - looking statements in this presentation. These forward - looking statements are necessarily estimates reflecting the best judgment of our senior management and our actual results of operations, financial condition or business prospects may differ materially from those expressed or implied by the forward - looking statements for reasons including, among others, risks associated with cyclicality and market conditions in the semiconductor or electronic industry; changes in our regulatory environment, including our ability to comply with new or stricter environmental regulations and to resolve environmental liabilities; demand for the outsourced semiconductor packaging, testing and electronic manufacturing services we offer and for such outsourced services generally; the highly competitive semiconductor or manufacturing industry we are involved in; our ability to introduce new technologies in order to remain competitive; international business activities; our business strategy; our future expansion plans and capital expenditures; the strained relationship between the Republic of China and the People’s Republic of China; general economic and political conditions; the recent shift in United States trade policies; possible disruptions in commercial activities caused by natural or human - induced disasters; fluctuations in foreign currency exchange rates; and other factors. For a discussion of these risks and other factors, please see the documents we file from time to time with the Securities and Exchange Commission, including the 2022 Annual Report on Form 20 - F filed on April 10, 2023 . 2

Consolidated Statements of Income Quarterly Comparison (Unaudited) 3 (NT$ million) Q2 / 2023 % Q1 / 2023 % Q2 / 2022 % QoQ YoY Net Revenues: ATM 75,256 55.2% 72,524 55.4% 93,355 58.2% 4% -19% EMS 60,384 44.3% 57,731 44.1% 66,213 41.3% 5% -9% Others 635 0.5% 636 0.5% 871 0.5% 0% -27% Total Net Revenues 136,275 100.0% 130,891 100.0% 160,439 100.0% 4% -15% Gross Profit 21,741 16.0% 19,339 14.8% 34,388 21.4% 12% -37% Operating Income (Loss) 9,412 6.9% 7,695 5.9% 20,606 12.8% 22% -54% Pretax Income (Loss) 10,111 7.4% 7,870 6.0% 21,136 13.2% 28% -52% Income Tax Benefit (Expense) (1,914) -1.4% (1,777) -1.4% (4,479) -2.8% Non-controlling Interests (457) -0.3% (276) -0.2% (669) -0.4% Net Income Attributable to Shareholders of the Parent 7,740 5.7% 5,817 4.4% 15,988 10.0% 33% -52% Basic EPS(NT$) 1.80 1.36 3.69 32% -51% Diluted EPS(NT$) 1.76 1.30 3.61 35% -51% Additional Commentary From Management 1&2 : Gross Profit excl. PPA expenses 22,654 16.6% 20,256 15.5% 35,306 22.0% 12% -36% Operating Income excl. PPA expenses 10,587 7.8% 8,874 6.8% 21,786 13.6% 19% -51% Net income attributable to shareholders of the parent excl. PPA expenses 8,902 6.5% 6,980 5.3% 17,161 10.7% 28% -48% Basic EPS(NT$) excl. PPA expenses 2.07 1.63 3.97 27% -48% 1 : PPA expenses are the P&L impacts from the accounting treatment of purchase price allocation in relation to the ASE/SPIL trans act ion, which resulted in increased asset values from purchase price premiums in PP&E, intangibles and right - of - use assets. The PPA expenses excluded are related to depreciation, amortization and other expenses $1.13bn in 2Q23, 1Q23, and 2Q22. 2 : PPA expenses are the P&L impacts from the accounting treatment of purchase price allocation in relation to the USI/ Asteelflash transaction, which resulted in increased asset and liability values from purchase price premiums in PP&E, intangibles, right - of - use assets an d deferred tax liability. The PPA expenses excluded are related to depreciation, amortization, other expenses and income tax benefit $0.04bn in both 2Q23 and 1Q23, and $0.05bn in 2Q22 .

Consolidated Operations (Unaudited) 4 82,355 93,355 97,137 92,742 72,524 75,256 61,163 66,213 90,660 83,931 57,731 60,384 873 871 829 744 636 635 19.7% 21.4% 20.1% 19.2% 14.8% 16.0% 11.2% 12.8% 12.6% 11.1% 5.9% 6.9% 0% 10% 20% 30% 40% 0 50,000 100,000 150,000 200,000 Q1/22 Q2/22 Q3/22 Q4/22 Q1/23 Q2/23 NT$ million ATM Revenue EMS Revenue Other Revenue Gross Margin Operating Margin

ATM Statements of Income Quarterly Comparison (Unaudited) 5 (NT$ million) Q2 / 2023 % Q1 / 2023 % Q2 / 2022 % QoQ YoY Net Revenues: Packaging 62,607 82.3% 60,770 82.9% 79,894 84.1% 3% -22% Testing 12,292 16.1% 11,407 15.6% 13,760 14.5% 8% -11% Direct Material 1,165 1.5% 1,106 1.5% 1,288 1.3% 5% -10% Others 44 0.1% 36 0.0% 56 0.1% 22% -21% Total Net Revenues 76,108 100.0% 73,319 100.0% 94,998 100.0% 4% -20% Gross Profit 16,161 21.2% 14,749 20.1% 27,768 29.2% 10% -42% Operating Income (Loss) 7,405 9.7% 6,409 8.7% 17,995 18.9% 16% -59% Additional Commentary From Management 1 : Gross Profit excl. PPA expenses 17,035 22.4% 15,624 21.3% 28,645 30.2% 9% -41% Operating Income excl. PPA expenses 8,529 11.2% 7,534 10.3% 19,122 20.1% 13% -55% 1 : PPA expenses are the P&L impacts from the accounting treatment of purchase price allocation in relation to the ASE/SPIL transacti on, which resulted in increased asset values from purchase price premiums in PP&E, intangibles and right - of - use assets. The PPA expenses e xcluded are related to depreciation and amortization $1.12bn in 2Q23, and $ 1.13bn in both 1Q23 and 2Q22.

ATM Operations (Unaudited) 6 23,101 27,768 28,832 26,193 14,749 16,161 84,025 94,998 98,831 94,322 73,319 76,108 27.5% 29.2% 29.2% 27.8% 20.1% 21.2% 0% 10% 20% 30% 40% 50% 0 20,000 40,000 60,000 80,000 100,000 Q1/22 Q2/22 Q3/22 Q4/22 Q1/23 Q2/23 NT$ million Gross Profit Gross Margin Revenue
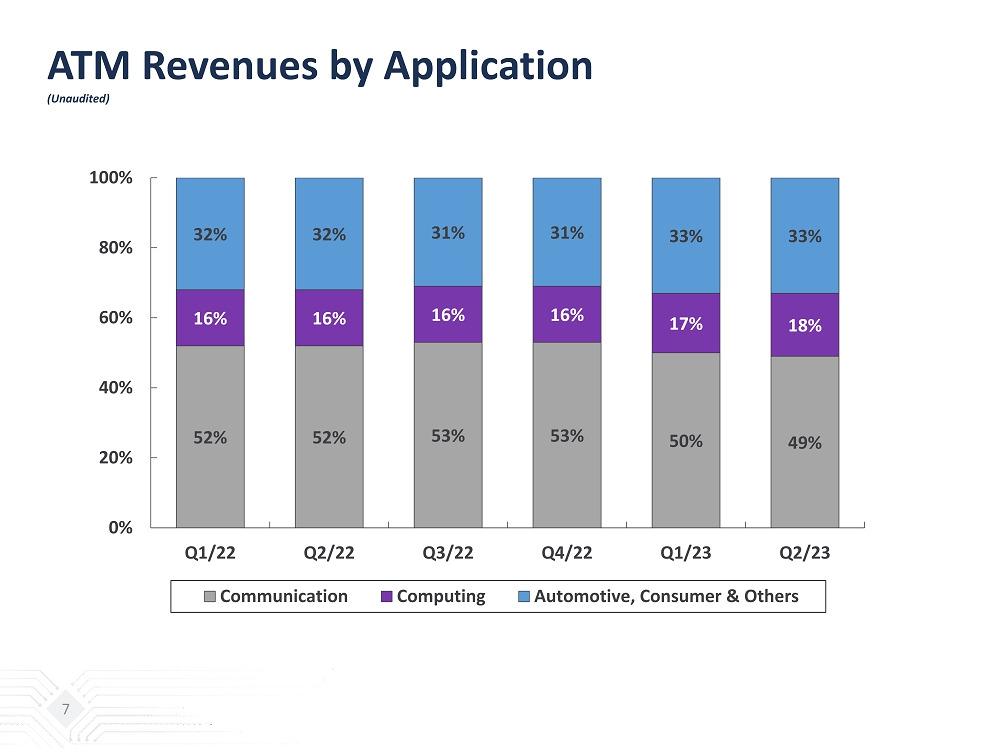
ATM Revenues by Application (Unaudited) 7 52% 52% 53% 53% 50% 49% 16% 16% 16% 16% 17% 18% 32% 32% 31% 31% 33% 33% 0% 20% 40% 60% 80% 100% Q1/22 Q2/22 Q3/22 Q4/22 Q1/23 Q2/23 Communication Computing Automotive, Consumer & Others

ATM Revenues by Type (Unaudited) 8 43% 43% 42% 43% 41% 41% 34% 35% 34% 33% 34% 34% 6% 6% 7% 7% 8% 7% 15% 15% 15% 15% 16% 16% 2% 1% 2% 2% 1% 2% 0% 20% 40% 60% 80% 100% Q1/22 Q2/22 Q3/22 Q4/22 Q1/23 Q2/23 Material Testing Others Wirebonding Bump/FC/WLP/ SiP

EMS Operations Quarterly Revenues by Application (unaudited) 9 (NT$ million) Q2 / 2023 % Q1 / 2023 % Q2 / 2022 % QoQ YoY EMS Net Revenues 60,424 100.0% 57,733 100.0% 66,218 100.0% 5% -9% Gross Profit 5,639 9.3% 4,567 7.9% 6,650 10.0% 23% -15% Operating Income (Loss) 2,089 3.5% 1,325 2.3% 2,667 4.0% 58% -22% 40% 35% 37% 38% 35% 34% 10% 13% 9% 9% 8% 8% 29% 28% 36% 34% 29% 33% 13% 15% 11% 12% 17% 15% 6% 8% 6% 6% 9% 8% 2% 1% 1% 1% 2% 2% 0% 20% 40% 60% 80% 100% Q1/22 Q2/22 Q3/22 Q4/22 Q1/23 Q2/23 Communication Computing Consumer Industrial Automotive Others

Key Balance Sheet Items & Indices (Unaudited) 10 (NT$ million) Jun. 30, 2023 Mar. 31, 2023 Cash and cash equivalent $59,351 $62,056 Financial assets - current 7,040 6,317 Financial assets - non current & investments - equity method 26,761 24,352 Property, plant & equipment 262,604 266,005 Total assets 672,521 675,440 Short-term loans 37,798 45,158 Current portion of bonds payable 13,797 7,298 Current portion of long-term loans 4,394 4,701 Bonds payable 33,462 38,837 Long-term loans & long-term bills payable 90,224 86,752 Total interest bearing debts 187,081 190,300 Total liabilities 375,104 385,714 Total equity (Including non-controlling interest) 297,417 289,726 Quarterly EBITDA 25,770 23,765 Current ratio 1.20 1.16 Net debt to equity ratio 0.41 0.42

Equipment Capital Expenditures vs. EBITDA (Unaudited) 11 443 515 400 339 231 209 1,100 1,203 1,283 1,141 781 843 0 200 400 600 800 1,000 1,200 1,400 Q1/22 Q2/22 Q3/22 Q4/22 Q1/23 Q2/23 US$ million Capex EBITDA

Technology Advancement Led TAM Expansion 12

Third Quarter 2023 Outlook* Based on our current business outlook and exchange rate assumptions, management projects overall performance for the third quarter of 2023 to be as follows: In NT dollar terms, our ATM 3 rd quarter 2023 revenues should grow mid to high single digits quarter over quarter ; Our ATM 3 rd quarter 2023 gross margin should improve 75 to 100 basis points versus the 2 nd quarter 2023; In NTD terms, our EMS 3 rd quarter 2023 revenues should increase 20% quarter over quarter ; Our EMS 3 rd quarter 2023 operating margin should be similar with the 2 nd quarter 2023 . 13

Thank you

Appendix 1 Consolidated Statements of Comprehensive Income (Unaudited) 15 (NT$ thousand) Q1/2022 Q2/2022 Q3/2022 Q4/2022 FY/2022 Q1/2023 Q2/2023 Revenues 144,390,827 160,439,019 188,625,557 177,417,239 670,872,642 130,891,073 136,275,353 COGS 115,919,599 126,051,460 150,653,584 143,317,989 535,942,632 111,551,750 114,534,530 PPA under COGS 920,316 918,661 916,426 917,737 3,673,140 917,384 913,036 Gross profit 28,471,228 34,387,559 37,971,973 34,099,250 134,930,010 19,339,323 21,740,823 Gross profit excl. PPA 29,391,544 35,306,220 38,888,399 35,016,987 138,603,150 20,256,707 22,653,859 OPEX 12,358,395 13,782,006 14,289,270 14,324,758 54,754,429 11,643,749 12,328,656 PPA under OPEX 261,477 261,428 261,109 261,723 1,045,737 261,948 262,147 Operating income 16,112,833 20,605,553 23,682,703 19,774,492 80,175,581 7,695,574 9,412,167 Operating income excl. PPA 17,294,626 21,785,642 24,860,238 20,953,952 84,894,458 8,874,906 10,587,350 Non Op gain/(loss) 549,787 529,795 (67,443) 437,990 1,450,129 174,771 698,626 PPA under Non Op gain/ (loss) 3,637 20,922 7,038 6,268 37,865 6,270 7,693 Non Op gain/ (loss) excl. PPA 553,424 550,717 (60,405) 444,258 1,487,994 181,041 706,319 Pretax income 16,662,621 21,135,348 23,615,261 20,212,482 81,625,712 7,870,345 10,110,793 PPA under Pretax income 1,185,430 1,201,011 1,184,573 1,185,728 4,756,742 1,185,602 1,182,876 Pretax income excl. PPA 17,848,051 22,336,359 24,799,834 21,398,210 86,382,454 9,055,947 11,293,669 Tax expenses 3,277,505 4,478,602 5,046,341 3,596,127 16,398,575 1,777,556 1,913,865 PPA under Tax expense (13,081) (16,957) (12,653) (13,164) (55,855) (13,652) (12,466) Tax expense excl. PPA 3,290,586 4,495,559 5,058,994 3,609,291 16,454,430 1,791,208 1,926,331 Non-controlling interests 477,834 668,595 1,104,295 885,919 3,136,643 275,624 456,505 PPA under Non-controlling interests 9,074 10,913 8,619 9,015 37,621 9,332 8,517 Non-controlling interests excl. PPA 486,908 679,508 1,112,914 894,934 3,174,264 284,956 465,022 Net income attributable to shareholders of the parent 12,907,282 15,988,151 17,464,625 15,730,436 62,090,494 5,817,165 7,740,423 PPA expenses under Net income attributable to shareholders of the parent 1,163,275 1,173,141 1,163,301 1,163,549 4,663,266 1,162,618 1,161,893 Net income attributable to shareholders of the parent excl. PPA 14,070,557 17,161,292 18,627,926 16,893,985 66,753,760 6,979,783 8,902,316 Total PPA expenses 1,172,349 1,184,054 1,171,920 1,172,564 4,700,887 1,171,950 1,170,410 Basic EPS (NT$) 3.01 3.69 4.03 3.77 14.53 1.36 1.80 Basic EPS (NT$) excl. PPA 3.28 3.97 4.30 4.05 15.62 1.63 2.07 Diluted EPS (NT$) 2.92 3.61 3.92 3.57 13.94 1.30 1.76 Diluted EPS (NT$) excl. PPA 3.19 3.88 4.18 3.84 15.02 1.57 2.03
ASE Technology (NYSE:ASX)
Historical Stock Chart
From Mar 2024 to Apr 2024

ASE Technology (NYSE:ASX)
Historical Stock Chart
From Apr 2023 to Apr 2024
