United Security Bancshares - 18.3% ROE for 3rd Quarter of 2004
FRESNO, Calif., Oct. 12 /PRNewswire-FirstCall/ -- Dennis R. Woods,
President and Chief Executive Officer of United Security Bancshares
(NASDAQ:UBFO), http://www.unitedsecuritybank.com/ , reported today
the results of operations for the 3rd quarter of 2004. Return on
average equity for the 3rd quarter was 18.3% and the return on
average assets was 1.66%. Net income was $2,382,000, as compared
with $2,559,000 in 2003, a decrease of 6.9%. Net income was
$6,152,000 for the nine months ended September 30, 2004 as compared
with $6,505,000 in 2003, a decline of 5.4%. The net income decrease
of $353,000 in nine months ended September 30 resulted from several
factors which, except for income taxes, were more than offset by
increased core earnings and expense reduction. In the nine months
of 2003 the company earned shared appreciation income of $1,438,000
while none was earned in the same period for 2004. This
nonrecurring income was more than offset as evidenced by the
Company's nine month pretax income for 2004 which exceeded the nine
month pretax income of 2003 by $465,000, an increase of 4.9%.
Income tax expense however, increased by $818,000 for 2004 over
2003. This resulted from the elimination of real estate investment
trust (REIT) tax benefits by the California Franchise Tax Board
(FTB). The adjustments for this elimination appeared in the fourth
quarter for 2003 and are not apparent in the nine month comparison.
This discrepancy will no longer be a factor with the release of our
year end report. Basic earnings per share for the 3rd quarter were
$0.42 compared with $0.47 for 2003, a 10.6% decrease. Diluted
earnings per share for the quarter were also $0.42 compared with
$0.47 a year ago. Year to date basic earnings per share for 2004
were $1.10 compared with 1.19 in 2003, a 7.6% decrease. Year to
date diluted earning per share for 2004 were $1.09 compared with
$1.18 in 2003, a 7.6% decrease. Woods added, "I am very pleased
with the pretax earnings numbers, up $465,000 year to date. I
consider pretax earnings growth a key indicator that shareholder
value is growing despite all that has gone on this year. We opened
a de novo branch in downtown Fresno, completed a merger with Taft
National Bank, improved corporate governance, strengthened the
audit committee and currently a significant portion of our staff is
dedicated to ensuring our compliance with Sarbanes-Oxley by year
end, a highly complex and time consuming project. Each of these
items takes away from our core business focus and some add
considerable cost. I am especially pleased that we continue to
project another record year for earnings." Return on average equity
for the 3rd quarter was 18.3% and the return on average assets was
1.66%. For the same period in 2003, ROAE was 23.8% and ROAA was
2.01%. For the nine months just ended, return on average equity was
16.8% and the return on average assets was 1.52%. For the same
period in 2003, ROAE was 20.2% and ROAA was 1.70%. The stability of
these key ratios is indicative of the banks' consistent performance
and ability to build shareholder value, even during expansion. The
64th consecutive quarterly cash dividend of $0.16 per share, up
from $0.145 for an 10.3% increase from a year ago, was declared on
September 28, 2004 to be paid on October 20, 2004, to shareholders
of record on October 8, 2004. Shareholders' equity ended the
quarter at $52,123,000, an increase of 16.2% over September 30,
2003. Dividends of $3.4 million were paid out of shareholders'
equity to shareholders during the past 12 months. During the last
12 months $2,022,136 from shareholders' equity was used to purchase
and retire Company stock. The average price paid per share was
$23.07 and the number of shares purchased and retired was 87,638
shares. In addition, $6,250,000 was added to shareholders' equity
as a result of the Taft National Bank acquisition. Net interest
income for the 3rd quarter 2004 was $6.4 million, up $1.1 million
from 2003 for an increase of 21.4%. The net interest margin
increased from 4.55% in 2003 to 5.03% in the 3rd quarter of 2004.
The increase is primarily attributable to growth in earning assets
and a decrease in funding costs. Earning assets increased by $43
million over the past 12 months. Noninterest income for the 3rd
quarter of 2004 was $1,359,000, down from $2,223,000 in 2003 for a
decrease of $864,000 or 38.9%. The decrease primarily resulted from
$1,032,000 in shared appreciation income in the 3rd quarter 2003
that did not reoccur in 2004 and was partially offset from
increases in service charges on deposit accounts and other
noninterest income. 3rd quarter operating expenses were $3,738,000
for 2004 and $3,478,000 for 2003, an increase of $261,000 or 7.5%.
The primary factors contributing to the rise were salaries and
other employee benefits related to the Taft acquisition, Convention
Center branch, and other key staff position additions to better
position the Company for continued strong growth. The efficiency
ratio changed to 49.3% for 2004 from 46.2% in 2003, reflecting the
costs of expanding and the nonreocurring shared appreciation
income. The provision for loan loss was $889,000 for the nine
months of 2004 and $872,000 for same period in 2003. The Bank's
model to determine the adequacy of the allowance for loan losses is
the primary factor for establishing the amount of the provision for
loan losses and the current allowance for loan losses is considered
adequate. Nonperforming assets improved to 3.04% of total assets on
September 30, 2004 from 3.25% at June 30, 2004. United Security
Banc shares is a $583 million bank holding company. United Security
Bank, it's principal subsidiary is a state chartered bank and
member of the Federal Reserve Bank of San Francisco. The Bank
operates ten branches in the Central and Southern San Joaquin
Valley. FORWARD-LOOKING STATEMENTS This news release contains
forward-looking statements about the company for which the company
claims the protection of the safe harbor provisions contained in
the Private Securities Litigation Reform Act of 1995.
Forward-looking statements are based on management's knowledge and
belief as of today and include information concerning the company's
possible or assumed future financial condition, and its results of
operations, business and earnings outlook. These forward-looking
statements are subject to risks and uncertainties. A number of
factors, some of which are beyond the company's ability to control
or predict, could cause future results to differ materially from
those contemplated by such forward-looking statements. These
factors include (1) changes in interest rates, (2) significant
changes in banking laws or regulations, (3) increased competition
in the company's market, (4) other-than-expected credit losses, (5)
earthquake or other natural disasters impacting the condition of
real estate collateral, (6) the effect of acquisitions and
integration of acquired businesses, (7) the impact of proposed
and/or recently adopted changes in regulatory, judicial, or
legislative tax treatment of business transactions, particularly
recently enacted California tax legislation and the subsequent Dec.
31, 2003, announcement by the Franchise Tax Board regarding the
taxation of REITs and Riches; and (8) unknown economic impacts
caused by the State of California's budget issues. Management
cannot predict at this time the severity or duration of the effects
of the recent business slowdown on our specific business activities
and profitability. Weaker or a further decline in capital and
consumer spending, and related recessionary trends could adversely
affect our performance in a number of ways including decreased
demand for our products and services and increased credit losses.
Likewise, changes in deposit interest rates, among other things,
could slow the rate of growth or put pressure on current deposit
levels. Forward-looking statements speak only as of the date they
are made, and the company does not undertake to update
forward-looking statements to reflect circumstances or events that
occur after the date the statements are made, or to update earnings
guidance including the factors that influence earnings. For a more
complete discussion of these risks and uncertainties, see the
company's Quarterly Report on Form 10-K for the year ended December
31, 2003, and particularly the section of Management's Discussion
and Analysis. United Security Bancshares Consolidated Balance
Sheets (unaudited) (Dollars in thousands) September 30 September 30
2004 2003 Cash & noninterest-bearing deposits in other banks
$26,405 $18,465 Interest-bearing deposits in other banks 8,069
7,654 Federal funds sold 32,005 15,085 Investment securities 93,680
89,128 Loans, net of unearned fees 386,141 354,668 Less: allowance
for loan losses (7,186) (5,298) Loans, net 378,956 349,370 Premises
and equipment, net 7,149 5,255 Intangible assets 4,222 2,035 Other
assets 32,742 21,233 TOTAL ASSETS $583,227 $508,224 Deposits:
Noninterest-bearing demand & NOW $176,133 $117,814 Savings
31,982 25,247 Time 302,450 290,618 Total deposits 510,565 433,679
Borrowed funds 135 10,415 Other liabilities 4,940 4,361 Trust
Preferred Securities 0 15,000 Junior subordinated debentures 15,464
0 TOTAL LIABILITIES $531,104 $463,455 Shareholders' equity: Common
shares outstanding: 5,681,472 at Sep. 30, 2004 5,508,760 at Sep.
30, 2003 $22,323 $18,218 Retained earnings 30,537 26,693
Unallocated ESOP shares (103) (374) Other comprehensive income
(loss) ($633) $232 Total shareholders' equity $52,123 $44,769 TOTAL
LIABILITIES & SHAREHOLDERS' EQUITY $583,227 $508,224 United
Security Bancshares Consolidated Statements of Income (unaudited)
Three Three Nine Nine Months Months Months Months Ending Ending
Ending Ending Sep 30 Sep 30 Sep 30 Sep 30 2004 2003 2004 2003
Interest income $8,060 $6,935 $22,200 $20,110 Interest expense
1,616 1,630 4,626 5,681 Net interest income 6,444 5,304 17,574
14,429 Provision for loan losses 249 371 889 872 Other income 1,359
2,223 3,673 4,883 Other expenses 3,738 3,478 10,476 9,023 Income
before income taxes 3,815 3,679 9,883 9,417 Provision for income
taxes 1,433 1,121 3,731 2,913 NET INCOME $2,382 $2,559 $6,152
$6,505 United Security Bancshares Selected Financial Data Three
Three Nine Nine Months Months Months Months Ended Ended Ended Ended
09/30/2004 09/30/2003 09/30/2004 09/30/2003 Basic Earnings Per
Share $0.42 $0.47 $1.10 $1.19 Diluted earning per share $0.42 $0.47
$1.09 $1.18 Annualized Return on: Average Assets 1.66% 2.01% 1.52%
1.70% Average Equity 18.34% 23.78% 16.79% 20.44% Net Interest
Margin 5.03% 4.55% 4.82% 4.11% Net Charge-offs to Average Loans
0.00% 0.04% 0.10% 0.28% 09/30/2004 09/30/2003 Book Value Per Share
$9.17 $8.14 Tangible Book Value Per Share $8.43 $7.77 Efficiency
Ratio 49.30% 46.72% Non Performing Assets to Total Assets 3.04%
4.37% Allowance for Loan Losses to Total Loans 1.86% 1.49% Shares
Outstanding -- period end 5,681,472 5,508,760 DATASOURCE: United
Security Bancshares CONTACT: Dennis R. Woods, President and Chief
Executive Officer of United Security Bank, +1-559-248-4928 Web
site: http://www.unitedsecuritybank.com/
Copyright
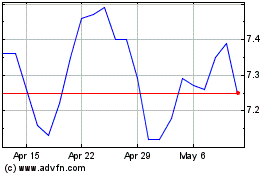
United Security Bancshares (NASDAQ:UBFO)
Historical Stock Chart
From Apr 2024 to May 2024

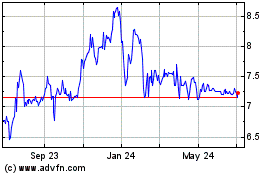
United Security Bancshares (NASDAQ:UBFO)
Historical Stock Chart
From May 2023 to May 2024
