FRESNO, Calif., July 16 /PRNewswire-FirstCall/ -- Dennis R. Woods,
President and Chief Executive Officer of United Security Bancshares
(http://www.unitedsecuritybank.com/) (NASDAQ:UBFO) reported today
the results of operation for the 2nd quarter and six months ended
2008. Net income was $2,070,000 for the 2nd quarter of 2008, as
compared with $3,308,000 for the 2nd quarter in 2007. Basic and
diluted earnings per share for the 2nd quarter 2008 were $0.18
compared with $0.27 for the 2nd quarter 2007. For the six months
ended June 30, 2008, net income was $4,570,000 compared with
$6,911,000 in 2007. For the six months ended June 30, 2008, return
on average equity was 10.98% and the return on average assets was
1.19%. For the same period in 2007, return on average equity was
17.42% and return on average assets was 1.89%. The low interest
rate environment, weak real estate market and weakened economy all
combined to impact earnings adversely. The 79th consecutive
quarterly cash dividend of $0.13 per share, up from $0.125 for a
4.0% increase from a year ago, was declared on June 24, 2008, to be
paid on July 23, 2008, to shareholders of record on July 11, 2008.
Woods added, "The 2nd quarter began: with a weakening real estate
market; the Federal Reserve poised to lower rates for a 7th time;
weak credit market; and a general weak national economy. As the
quarter ended: we are seeing an improving real estate market; the
Federal Reserve leaving rates unchanged; credit markets essentially
unchanged and a modestly improved national economy. The California
housing market is beginning to show signs of recovery. Home sales
were up in May for the second consecutive month. Sales of new homes
are increasing as developers lower prices. Sales of existing houses
climbed 15.5% from the previous month and 18.1% from May 2007,
topping 400,000 for the first time since last year, according to a
report from the California Association of Realtors. Fresno and
Clovis sales of existing houses climbed 19% month-to- month and
year-over-year. Pending sales-transactions are up 34% from May
2007. Lower prices and a renewed Federal Housing Administration
loan program are the primary causes for the increase. Even though
signs of improvement are appearing, returning to economic normalcy
is not expected until sometime in 2009. The third quarter may
reveal extended weakness. We continue to work with customers as
they work through this difficult economic cycle." Shareholders'
equity at quarter end was $81.7 million. During the past 12 months,
dividends of $6.0 million were paid out of shareholders' equity to
shareholders and $2.5 million was utilized to purchase and retire
shares of Company stock at an average price of $16.11 per share.
Net interest income for the 2nd quarter 2008 was $7.7 million, down
$1.1 million from the 2nd quarter of 2007 for a decrease of 12.5%.
The net interest margin decreased from 5.19% in the 2nd 2007 to
4.51% in 2008. For the six months ended June 30, 2008 net interest
income was $15,713,000, down $2,856,000 from $18,569,000 for the
same period in 2007. The lower interest rate environment is the
primary cause for the decline. The decrease in the net interest
margin in the 2nd quarter of 2008 is attributable to the interest
income reversed during the quarter amounting to $450,000 on loans
transferred to nonaccrual status and the action by the Federal
Reserve lowering rates on April 30, 2008. Without reversal of the
interest income for nonaccrual of $450,000, the net interest margin
would have been 4.78% in the 2nd quarter of 2008, an increase from
the 1st quarter net interest margin of 4.61% Noninterest income for
the 2nd quarter of 2008 was $1,721,000, down $233,000 from
$1,954,000 in 2007 for a decrease of 11.9%. $219,000 of the
decrease resulted from the gain on proceeds from life insurance
that occurred in 2007 that did not reoccur in 2008. For the six
months ended June 30, 2008, noninterest income was $4,054,000, up
$520,000 from $3,535,000 for the same period in 2007. A gain from
the fair value adjustment to the carrying amount of Trust Preferred
Securities of $388,000 accounts for most of the change. Other
operating expenses for the three months ended June 30, 2008 were
$5,644,000 and $5,517,000 for 2007, an increase of $127,000 or
2.3%. For the six months ended June 30, 2008, other operating
expenses totaled $11,760,000, up $1,043,000 from $10,717,000 for
the same period in 2007. Salaries and benefits increased by
$263,000, occupancy expense rose $220,000, and an impairment loss
on core deposit intangibles during the 1st quarter 2008 totaling
$624,000 were the primary reasons for the increase. The provision
for loan loss was $548,000 for the 2nd quarter of 2008 and $208,000
for 2nd quarter of 2007. . For the six months ended June 30, 2008,
the provision was $813,000 compared with $410,000 for the same
period in 2007. In determining the adequacy of the allowance for
loan losses, Management's judgment is the primary determining
factor for establishing the amount of the provision for loan losses
and management considers the allowance for loan and lease losses at
June 30, 2008 to be adequate. Non-performing assets increased to
6.67% of total assets on June 30, 2008 from 3.90% on March 31,
2008. At year-end 2007 non-performing assets were 3.66% of total
assets and on June 30, 2007 2.55%. United Security Bancshares is a
$770+ million bank holding company. United Security Bank, it's
principal subsidiary is a state chartered bank and member of the
Federal Reserve Bank of San Francisco. FORWARD-LOOKING STATEMENTS
This news release contains forward-looking statements within the
meaning of Section 27A of the Securities Act of 1933, as amended,
and Section 21E of the Securities Exchange Act of 1934, as amended
and the Company intends such statements to be covered by the safe
harbor provisions for forward-looking statements contained in the
Private Securities Litigation Reform Act of 1995. Forward-looking
statements are based on management's knowledge and belief as of
today and include information concerning the Company's possible or
assumed future financial condition, and its results of operations,
business and earnings outlook. These forward-looking statements are
subject to risks and uncertainties. A number of factors, some of
which are beyond the Company's ability to control or predict, could
cause future results to differ materially from those contemplated
by such forward-looking statements. These factors include (1)
changes in interest rates, (2) significant changes in banking laws
or regulations, (3) increased competition in the company's market,
(4) other-than-expected credit losses, (5) earthquake or other
natural disasters impacting the condition of real estate
collateral, (6) the effect of acquisitions and integration of
acquired businesses, (7) the impact of proposed and/or recently
adopted changes in regulatory, judicial, or legislative tax
treatment of business transactions, particularly recently enacted
California tax legislation and the subsequent Dec. 31, 2003,
announcement by the Franchise Tax Board regarding the taxation of
REITs and RICs; and (8) unknown economic impacts caused by the
State of California's budget issues. Management cannot predict at
this time the severity or duration of the effects of the recent
business slowdown on our specific business activities and
profitability. Weaker or a further decline in capital and consumer
spending, and related recessionary trends could adversely affect
our performance in a number of ways including decreased demand for
our products and services and increased credit losses. Likewise,
changes in interest rates, among other things, could slow the rate
of growth or put pressure on current deposit levels and affect the
ability of borrowers to repay loans. Forward- looking statements
speak only as of the date they are made, and the company does not
undertake to update forward-looking statements to reflect
circumstances or events that occur after the date the statements
are made, or to update earnings guidance including the factors that
influence earnings. For a more complete discussion of these risks
and uncertainties, see the Company's Annual Report on Form 10-K for
the year ended December 31, 2007, and particularly the section of
Management's Discussion and Analysis. United Security Bancshares
Consolidated Balance Sheets (unaudited) (Dollars in thousands) June
30, June 30, 2008 2007 Cash & nonint.-bearing deposits in banks
$23,429 $24,190 Interest-bearing deposits in banks 6,770 7,910
Federal funds sold 0 2,376 Investment securities AFS 98,260 91,636
Loans, net of unearned fees 587,655 588,950 Less: allowance for
loan losses (11,223) (9,905) Loans, net 576,433 579,046 Premises
and equipment, net 14,942 15,970 Intangible assets 13,879 13,638
Other assets 39,149 37,547 TOTAL ASSETS $772,861 $772,312 Deposits:
Noninterest-bearing demand & NOW 178,663 183,474 Savings &
Money Market 178,548 191,976 Time 201,461 265,737 Total deposits
558,672 641,187 Borrowed funds 110,640 23,060 Other liabilities
9,123 9,698 Junior subordinated debentures 12,741 16,998 TOTAL
LIABILITIES $691,176 $690,943 Shareholders' equity: Common shares
outstanding: 11,798,992 at June 30, 2008 11,943,363 at June 30,
2007 $31,741 $33,966 Retained earnings 51,495 48,618 Fair Value
Adjustment - Hedge (0) (56) Accumulated other comprehensive income
(1,551) (1,159) Total shareholders' equity $81,684 $81,369 TOTAL
LIABILITIES & SHAREHOLDERS' EQUITY 772,861 772,312 United
Security Bancshares Consolidated Statements of Income (dollars in
000's, Three Three Six Six except per share Months Months Months
Months amounts) Ended Ended Ended Ended (unaudited) June 30, June
30, June 30, June 30, 2008 2007 2008 2007 Interest income $11,431
$13,962 $24,175 $28,198 Interest expense 3,702 5,126 8,461 9,629
Net interest income 7,728 8,836 15,713 18,569 Provision for loan
losses 548 208 813 410 Other income 1,721 1,954 4,054 3,535 Other
expenses 5,644 5,517 11,760 10,717 Income before income tax
provision 3,258 5,065 7,195 10,977 Provision for income taxes 1,188
1,757 2,625 4,066 NET INCOME $2,070 $3,308 $4,570 $6,911 United
Security Bancshares Selected Financial Data Three Three Six Six
(dollars in 000's Months Months Months Months except per Ended
Ended Ended Ended share amounts) June 30, June 30, June 30, June
30, 2008 2007 2008 2007 Basic Earnings Per Share $0.18 $0.27 $0.39
$0.58 Diluted Earning Per Share $0.18 $0.27 $0.39 $0.57 Annualized
Return on: Average Assets 1.08% 1.74% 1.19% 1.89% Average Equity
10.11% 15.56% 10.98% 17.42% Net Interest Margin 4.51% 5.19% 4.57%
5.68% Net Charge-offs to Average Loans 0.17% 0.09% 0.17% 0.02% June
30, June 30, 2008 2007 Book Value Per Share $6.92 $6.81 Tangible
Book Value Per Share $5.75 $5.67 Efficiency Ratio 59.49% 48.48% Non
Performing Assets to Total Assets 6.67% 2.55% Allowance for Loan
Losses to Total Loans 1.91% 1.68% Shares Outstanding - period end
11,798,992 11,943,363 Basic Shares - average weighted 11,818,665
12,078,030 Diluted Shares - average weighted 11,821,658 12,135,006
DATASOURCE: United Security Bancshares CONTACT: Dennis R. Woods,
President and Chief Executive Officer of United Security
Bancshares, +1-559-248-4928 Web site:
http://www.unitedsecuritybank.com/
Copyright
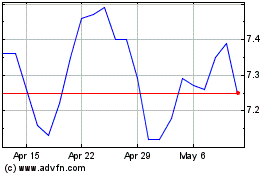
United Security Bancshares (NASDAQ:UBFO)
Historical Stock Chart
From Apr 2024 to May 2024

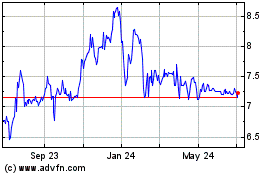
United Security Bancshares (NASDAQ:UBFO)
Historical Stock Chart
From May 2023 to May 2024
