
January 29, 2024
To Our Stockholders:
You are cordially invited to attend the 2024 Annual Meeting of Stockholders (the “Annual Meeting”) of Sonos, Inc. The Annual Meeting will be held on March 11, 2024. To allow for participation by all of our stockholders, regardless of their geographic location, the Annual Meeting will be held entirely online. You may attend the Annual Meeting online at the following website address: www.virtualshareholdermeeting.com/SONO2024 and by entering the 16-digit control number included on your Notice of Internet Availability, your proxy card or in the instructions that accompanied your proxy materials. The Annual Meeting will begin at approximately 10:00 a.m., Pacific Time, with login beginning at 9:45 a.m., Pacific Time, via a live webcast on the internet.
The matters expected to be acted upon at the Annual Meeting are listed in the Notice of Annual Meeting of Stockholders and more fully described in the accompanying proxy statement. We have also made available or provided our Annual Report on Form 10-K for the fiscal year ended September 30, 2023, which contains important business and financial information regarding Sonos.
Your vote is important. Whether or not you plan to attend the Annual Meeting, to ensure that your shares will be represented, please cast your vote as soon as possible via the internet or by telephone, or, if you received a paper proxy card and voting instructions by mail, by completing and returning the enclosed proxy card in the postage-prepaid envelope. Your vote by proxy will ensure your representation at the Annual Meeting regardless of whether or not you attend.
Sincerely,

Patrick Spence
Chief Executive Officer and Director
YOUR VOTE IS IMPORTANT
Your vote is important. As described in your electronic proxy materials notice or on the enclosed paper proxy card and voting instructions, please vote by: (1) accessing the internet website, (2) calling the toll-free number, or (3) signing and dating the proxy card as promptly as possible and returning it in the enclosed envelope (to which no postage need be affixed if mailed in the United States). Even if you plan to attend the virtual Annual Meeting, we recommend that you vote your shares in advance, so that your vote will be counted if you later decide not to attend online.
IMPORTANT NOTICE REGARDING THE AVAILABILITY OF PROXY MATERIALS FOR THE ANNUAL MEETING TO BE HELD ON MARCH 11, 2024: THE PROXY STATEMENT, PROXY CARD AND ANNUAL REPORT ARE AVAILABLE AT WWW.PROXYVOTE.COM.
SONOS, INC.
614 Chapala Street
Santa Barbara, CA 93101
NOTICE OF ANNUAL MEETING OF STOCKHOLDERS
January 29, 2024
|
|
|
Time and Date: |
|
March 11, 2024 at 10:00 a.m. Pacific Time |
Place: |
|
Virtually at www.virtualshareholdermeeting.com/SONO2024 |
Items of Business: |
|
1. Elect the two Class III directors listed in the accompanying proxy statement. 2. Ratify the appointment of PricewaterhouseCoopers LLP as the independent registered public accounting firm of Sonos, Inc. for the fiscal year ending September 28, 2024. 3. Conduct an advisory vote to approve named executive officer compensation (the say-on-pay vote). 4. Transact any other business as may properly come before the Annual Meeting or any adjournment or postponement of the Annual Meeting. |
Record Date: |
|
Only stockholders of record at the close of business on January 17, 2024 are entitled to notice of, and to vote at, the Annual Meeting and any adjournments thereof. |
Proxy Voting: |
|
Each share of common stock that you own represents one vote. For questions regarding your stock ownership, you may contact us through our website at https://investors.sonos.com or, if you are a registered holder, contact our transfer agent, Equiniti Trust Company, LLC, through its website at https://www.shareowneronline.com or by phone at (800) 937-5449. |
This notice of the Annual Meeting, proxy statement, form of proxy and our 2023 Annual Report are being distributed or made available on or about January 29, 2024.
Whether or not you plan to attend the Annual Meeting, we encourage you to vote or submit your proxy via the internet, or request and submit your proxy card as soon as possible, so that your shares may be represented at the meeting.
By Order of the Board of Directors,

Edward Lazarus
Chief Legal and Strategy Officer and Corporate Secretary
Santa Barbara, California
January 29, 2024
SONOS, INC.
PROXY STATEMENT FOR 2024 ANNUAL MEETING OF STOCKHOLDERS
TABLE OF CONTENTS
Section 27A of the Securities Act of 1933, as amended (the “Securities Act”), and Section 21E of the Securities Exchange Act of 1934, as amended (the “Exchange Act”), provide a “safe harbor” for forward-looking statements. With the exception of historical information, the matters discussed in this proxy statement are forward-looking statements and may be identified by the use of words such as “anticipate,” “believe,” “could,” “should,” “estimate,” “expect,” “intend,” “may,” “will,” “plan,” “predict,” “project,” “seek,” “approximately,” “potential,” “outlook” and similar terms and phrases that concern our strategy, plans or intentions, including references to assumptions. Such statements reflect our current view with respect to future events and are subject to certain risks, uncertainties and assumptions. A variety of factors could cause our future results to differ materially from the anticipated events or results expressed in such forward-looking statements. Readers should review Item 1A, Risk Factors, of our Annual Report on Form 10-K for the fiscal year ended September 30, 2023 for a description of important factors that could cause our future results to differ materially from those contemplated by the forward-looking statements made in this proxy statement. In light of these risks, uncertainties and assumptions, the forward-looking events discussed in this proxy statement might not occur. All forward-looking statements speak only as of the date of this proxy statement and should be evaluated with an understanding of their inherent uncertainty. Except as required under federal securities laws and the rules and regulations of the Securities and Exchange Commission, we will not undertake and specifically decline any obligation to publicly update or revise any forward-looking statements to reflect events or circumstances arising after the date of this proxy statement, whether as a result of new information, future events or otherwise.
Information appearing on sonos.com is not a part of and is not incorporated by reference in this proxy statement.
EXECUTIVE SUMMARY
This proxy statement (“Proxy Statement”) is first being made available to stockholders on or about January 29, 2024 in connection with the solicitation by the Board of Directors (the “Board”) of Sonos, Inc. of proxies for use at the Company’s 2024 Annual Meeting of Stockholders (the “Annual Meeting”). Except as otherwise indicated or where the context otherwise requires, in this Proxy Statement, “Sonos,” the “Company,” “we,” “us” and “our” refer to Sonos, Inc.; “you,” “your,” “yours” and other words of similar import refer to stockholders of Sonos; and “Fiscal 2024” refers to the fiscal year ending September 28, 2024, “Fiscal 2023” refers to the fiscal year ended September 30, 2023, “Fiscal 2022” refers to the fiscal year ended October 1, 2022, and “Fiscal 2021” refers to the fiscal year ended October 2, 2021.
Highlights of certain information contained elsewhere in this Proxy Statement are provided below. This summary does not contain all of the information you should consider before you decide how to vote, and we encourage you to read the entire Proxy Statement carefully before voting.
2024 Annual Meeting of Stockholders
|
|
Date and Time: |
March 11, 2024 at 10:00 a.m. PST |
Place: |
Virtually at www.virtualshareholdermeeting.com/SONO2024 |
Record Date: |
January 17, 2024 |
Voting: |
Holders of common stock are entitled to one vote per share on all matters to be presented at the Annual Meeting |
Meeting Agenda Items
|
|
|
|
Proposal |
Page Number |
Voting Standard |
Board Vote Recommendation |
Proposal No. 1: Election of Directors |
24 |
Plurality |
FOR EACH NOMINEE |
Proposal No. 2: Ratification of the appointment of PricewaterhouseCoopers LLP as the independent registered public accounting firm for the fiscal year ending September 28, 2024 |
33 |
Majority of votes cast |
FOR |
Proposal No. 3: Advisory vote to approve named executive officer compensation (the say-on-pay vote) |
35 |
Majority of votes cast |
FOR |
Director Nominees
|
|
|
|
|
|
|
Director Nominee |
Director Since |
Primary Occupation |
Independent |
Committee Memberships |
Audit |
CPD&I |
NCG |
Jonathan Mildenhall |
January 2024 |
CMO, Rocket Companies Inc. |
√ |
|
√ |
|
Patrick Spence |
January 2017 |
CEO, Sonos, Inc. |
|
|
|
|
CPD&I = Compensation, People and Diversity & Inclusion Committee
NCG = Nominating and Corporate Governance Committee
1
Our Business
Sonos is one of the world's leading sound experience brands.
We pioneered multi-room, wireless audio products, debuting the world’s first multi-room wireless sound system in 2005. Today, our products include wireless, portable and home theater speakers, components, and accessories to address consumers’ evolving audio needs. We are known for delivering unparalleled sound, thoughtful design aesthetic, simplicity of use, and an open platform. Our platform has attracted a broad range of more than 130 streaming content providers, such as Apple Music, Spotify, Deezer, and Pandora. These partners find value in our independent platform and access to our millions of desirable and engaged customers. We frequently introduce new services and features across our platform, providing our customers with enhanced functionality, improved sound, and an enriched user experience. We are committed to continuous technological innovation as reflected in our growing global patent portfolio. We believe our patents comprise the foundational intellectual property for wireless multi-room and other audio technologies.
Since we launched our first product 18 years ago, we have grown our install base by launching innovative new products, delivering a seamless customer experience, and expanding our global footprint. Our customers have typically purchased additional Sonos products over time. In Fiscal 2023, existing customers accounted for approximately 44% of new product registrations. As of September 30, 2023, we had a total of nearly 46.6 million products registered in approximately 15.3 million households globally, including the addition of approximately 1.3 million new households during Fiscal 2023. As of September 30, 2023, 60% of our 15.3 million households had registered more than one Sonos product. As of September 30, 2023, each of our households owned more than 3.0 Sonos products on average.
Fiscal 2023 Highlights
While Fiscal 2023 was a challenging year in the categories in which we operate, the strength of the Sonos brand and product portfolio enabled us to retain a strong market share position. We successfully raised the bar in the speaker category with the introduction of our new Era products, and extended our leadership in the premium portable category with Move 2. We also delivered on our commitment to maintain Adjusted EBITDA margin in spite of the headwinds we faced. We showed our commitment to making necessary changes to achieve sustainable profit growth by rightsizing our expense base with a reduction in force announced in June 2023.
2
Fiscal 2023 highlights include:
|
|
FISCAL 2023 HIGHLIGHTS |
Financial Results and Key Metrics |
Expanding our Brand While Responsibly Innovating |
●Net loss of $10.3 million ●Adjusted EBITDA* of $153.9 million ●Adjusted EBITDA margin* of 9.3% ●Free cash flow* of $50.1 million, improving significantly from -$74.5 million in Fiscal 2022 due to working capital improvements ●Gained significant market share in the US, UK, and Germany home theater category, and recorded our highest annual market share since fiscal year 2019 in both the US and Germany ●Record more than 3.0 products per household vs. 2.98 in Fiscal 2022; ended Fiscal 2023 in 15.3 million homes, with existing households representing 44% of new registrations ●Returned $100 million to stockholders by repurchasing 6.6 million shares; following fiscal year-end, announced Board authorization of additional $200 million program in November 2023 |
●Continued brand building efforts with partners, advocates and retailers to drive awareness and purchase intent with customers at scale: ○More than 30,000 consumers, industry and press visited the sound experience at the Dolby House during SXSW, March 2023 ○The Sonos Professional experience at CEDIA Expo, the premier tradeshow summit for home technology integration professionals, saw over 3,500 integrators, distribution partners, and strategic partners visit the booth ○The Era Advocacy campaign enlisted more than 130 influencers, creating 350 pieces of bespoke content that resulted in more than 12 million impressions and 10 million views ●Continued to responsibly innovate, including by building sustainability into all three of our new marquee products: Era 100, Era 300, and Move 2. See “Sustainability” for more information on our ESG efforts. |
|
Continued Product Innovation |
●Era 100 - Launched March 2023. Our powerful smart speaker with improved acoustics and design that delivers detailed stereo sound and deep bass. Originally launched as One in October 2017 and completely redesigned in March 2023 as Era 100. ●Era 300 - Launched March 2023. Our bold, revolutionary speaker that offers the best out-loud listening experience for spatial audio content with Dolby Atmos. ●Move 2 - Launched September 2023. Our portable, battery-powered smart speaker that delivers spacious stereo sound, with ultra-durable water resistant design for outdoor and indoor listening. ●Sub Mini - Launched October 2022. Our wireless subwoofer which delivers powerful, balanced bass, rich, clear low end frequencies, in a compact cylindrical design. ●Sonos Pro - Launched April 2023. This new software as a service (SaaS) offering gives business owners the power to control Sonos across multiple locations. With this subscription-based solution, business owners get access to a web-based dashboard for remote monitoring and management, commercially-licensed music, and personalized support. |
* See Annex A of this Proxy Statement for reconciliations of non-GAAP items.
Corporate Governance
•Independent Board Oversight. Six out of seven directors are independent. The roles of Chairperson and Chief Executive are currently separate. Our independent directors meet regularly in scheduled executive sessions without management, and our Chairperson is the presiding director at those meetings.
•Independent Board Committees. Only independent directors serve on the Board’s committees.
•Strategy and Risk. Our Board as a whole has responsibility for risk oversight and exercises this risk oversight responsibility directly and through its committees.
3
•Board Evaluations. The Board and each committee conducts an annual self-evaluation, led by the Chair of our Nominating and Corporate Governance Committee.
•Stockholder Engagement. We have ongoing engagement with our stockholders throughout the year, which includes governance-focused meetings. In Fiscal 2023, we met with stockholders representing approximately 18% of our outstanding shares in our governance-focused meetings.
•No Poison Pill. We do not have a poison pill.
•Diverse and Skilled Board. Our Board is composed of members with diverse professional backgrounds, experience, expertise and viewpoints who combine a strong professional reputation and knowledge of our business and industry with a reputation for integrity.
•Sustainability & Environmental, Social and Governance (“ESG”). Our Nominating and Corporate Governance Committee has oversight over our ESG program, and our Audit Committee has oversight over ESG disclosures and risk.
•Stock Ownership Requirements. We maintain rigorous stock ownership guidelines for our named executive officers and non-executive directors and monitor compliance with such guidelines.
•Anti-Hedging and Pledging Policies. We prohibit all employees and directors from engaging in hedging transactions and only allow for pledging our common stock in limited circumstances, subject to the approval of our Compliance Officer.
See “Board of Directors and Corporate Governance” beginning on page 12 and “Compensation Discussion and Analysis” beginning on page 41 for more information.
Executive Compensation
We have established a compensation program that seeks to closely align the interests of our named executive officers and other management with the interests of our stockholders.
•Our compensation program is designed to attract, retain and motivate key executives critical to our success, provide fair and competitive compensation opportunities, integrate compensation with our business plans, and reward both business and individual performance.
•We link pay for performance and stockholder interests by heavily weighting compensation to short-term cash incentive awards and long-term equity awards that are tied to the value of our stock and financial targets. In Fiscal 2023, 91% of target CEO compensation and 80% of our other named executive officers’ target compensation, on average, was composed of variable, at-risk compensation elements.
•Our annual cash incentive program for our named executive officers consists of pre-established enterprise-wide financial measures (45% revenue and 45% Adjusted EBITDA margin) and diversity, equity, and inclusion (“DEI”) goals (10%). Based on achievement against the financial measures and DEI objectives, Fiscal 2023 annual incentive bonuses paid out at 20.1% of target.
•The Compensation, People and Diversity & Inclusion Committee annually evaluates ways to better align our compensation program with the Company’s strategic initiatives. We recently introduced performance-based equity for all of our named executive officers and added a diversity, equity, and inclusion metric to our cash incentive program, further emphasizing performance-based pay to better support our pay for performance philosophy.
4
•Our compensation program does not include any of the following practices:
oSingle trigger acceleration in connection with a change of control.
oMaterial perquisites for executives, except in connection with a business-related relocation.
oGuaranteed cash severance in the event of termination for our NEOs.
•At our 2023 annual meeting of stockholders, more than 96% of the votes cast for the say-on-pay proposal were in favor of our executive compensation program and policies.
See “Compensation Discussion and Analysis” beginning on page 41 for more information.
Corporate Social Responsibility
We are committed to creating responsibly-designed products and experiences, which are built by inclusive teams in pursuit of our mission to help the world listen better. In Fiscal 2021, we introduced our Climate Action Plan, with a goal of going carbon neutral by 2030 and reaching net zero by 2040. Our core objective is reducing our carbon emissions. Product energy usage makes up the majority of our emissions, making it a priority of our Climate Action Plan.
In Fiscal 2023, we conducted a robust climate risk assessment, evaluating physical and transition risks and opportunities using the framework established by the Task Force on Climate-Related Financial Disclosures (“TCFD”). This assessment found that Sonos’ exposure to climate-related risks is low. We also added a financial analysis in line with the TCFD. This enabled us to report to the Carbon Disclosure Project for the first time, a major milestone for our climate program.
We also built sustainability into all three of our Fiscal 2023 marquee products: Era 100, Era 300, and Move 2. We improved our energy efficiency, use of recycled plastics, and serviceability. Era 100’s and Era 300’s idle power consumption is under 2 watts — our first plug-in speakers to reach this milestone. The power-save mode reduces energy consumption even further. Era 100 and Era 300 incorporate approximately 40% recycled plastic and the design facilitates easy in-region repair, reducing transportation emissions and keeping products and component materials in use longer. Move 2 is 47% more energy efficient than Move when idle and incorporates recycled plastic.
In November 2023, Sonos published its sixth annual Listen Better report detailing our ESG efforts and progress against our goals, which is available at https://sustainability.sonos.com/Sustainability-and-Climate-Impact/default.aspx.
See the “Board of Directors and Corporate Governance” section beginning on page 12 for more information.
5
SONOS, INC.
614 Chapala Street
Santa Barbara, CA 93101
PROXY STATEMENT FOR THE 2024 ANNUAL MEETING OF STOCKHOLDERS
January 29, 2024
INFORMATION ABOUT SOLICITATION AND VOTING
The accompanying proxy is solicited on behalf of the Board of Directors of Sonos, Inc. for use at our 2024 Annual Meeting of Stockholders to be held virtually at www.virtualshareholdermeeting.com/SONO2024 on March 11, 2024 at 10:00 a.m. Pacific Time, and any adjournment or postponement thereof. Beginning on or about January 29, 2024, a Notice of Internet Availability of Proxy Materials (the “Notice of Internet Availability”), which contains instructions on how to access this Proxy Statement and our Annual Report on Form 10-K for the fiscal year ended September 30, 2023 (the “Annual Report”), is being mailed to our stockholders.
INTERNET AVAILABILITY OF PROXY MATERIALS
We are using the internet as the primary means for furnishing proxy materials to stockholders. Consequently, most stockholders will not receive paper copies of our proxy materials. We will instead send these stockholders a Notice of Internet Availability with instructions for accessing the proxy materials online, including this Proxy Statement and our Annual Report, and for voting via the internet, by telephone or by mail. The Notice of Internet Availability also provides information on how stockholders may obtain paper copies of our proxy materials if they so choose. We encourage stockholders to take advantage of the online availability of proxy materials, as we believe it helps in conserving natural resources and reduces our printing and mailing costs.
GENERAL INFORMATION ABOUT THE MEETING
What is the purpose of the Annual Meeting?
At the Annual Meeting, stockholders will vote upon the proposals described in this Proxy Statement.
What proposals are scheduled to be voted on at the Annual Meeting?
Stockholders will be asked to vote upon three proposals. The proposals are:
1. The election of each of the two Class III directors set forth in Proposal One to serve for a term of three years or until such director’s successor is duly elected and qualified or until such director’s earlier death, resignation, disqualification or removal.
2. The ratification of the appointment of PricewaterhouseCoopers LLP as our independent registered public accounting firm for the fiscal year ending September 28, 2024.
3. An advisory vote to approve named executive officer compensation (the say-on-pay vote).
What is the recommendation of our Board of Directors on each of the proposals scheduled to be voted upon at the Annual Meeting?
6
Our Board recommends that you vote your shares:
•FOR each of the nominees to the Board of Directors (Proposal One);
•FOR the ratification of the appointment of PricewaterhouseCoopers LLP as our independent registered public accounting firm for the fiscal year ending September 28, 2024 (Proposal Two); and
•FOR the approval, on an advisory basis, of the named executive officer compensation (Proposal Three).
How do I attend the Annual Meeting?
We will host the Annual Meeting live via the internet. You will not be able to attend the meeting in person. Participation in and attendance at the Annual Meeting is limited to stockholders as of the close of business on January 17, 2024 (the “Record Date”). Such stockholders can listen to and participate in the Annual Meeting live via the internet at www.virtualshareholdermeeting.com/SONO2024 (the “Annual Meeting Website”). The webcast will begin at 10:00 a.m., Pacific Time, on March 11, 2024. Online access will begin at 9:45 a.m., Pacific Time, and we encourage you to access the Annual Meeting prior to the start time.
A list of stockholders entitled to vote at the meeting will be available for examination during normal business hours for ten days prior to the Annual Meeting for any purpose germane to the meeting at our corporate headquarters. Our corporate headquarters are currently located at 614 Chapala Street, Santa Barbara, CA 93101 and, as of May 1, 2024, will be located at 301 Coromar Drive, Goleta, CA 93117. The stockholder list will also be available to stockholders during the meeting at the Annual Meeting Website.
To participate in the Annual Meeting, you will need the 16-digit control number found on your Notice of Internet Availability, your proxy card or the instructions that accompany your proxy materials. If your shares are held in the name of a bank, broker or other holder of record, you should follow the instructions provided by your bank, broker or other holder of record to be able to participate in the Annual Meeting. If you encounter difficulties accessing the virtual meeting, please call the technical support number that will be posted at www.virtualshareholdermeeting.com/SONO2024.
A replay of the Annual Meeting will be posted as soon as practical on our investor relations website: https://investors.sonos.com/.
Who can vote at the Annual Meeting?
Stockholders as of the Record Date are entitled to vote at the Annual Meeting. At the close of business on the Record Date, there were 124,151,292 shares of our common stock outstanding and entitled to vote.
Each share of our common stock as of the close of business on the Record Date is entitled to one vote on each matter presented at the Annual Meeting. There is no cumulative voting.
How do I vote my shares?
Stockholder of Record: Shares Registered in Your Name
If, on the Record Date, your shares were registered directly in your name with our transfer agent, Equiniti Trust Company, LLC, then you are considered the stockholder of record with respect to those shares.
7
Beneficial Owner: Shares Registered in the Name of a Broker or Nominee
If, on the Record Date, your shares were held in an account with a brokerage firm, bank or other nominee, then you are the beneficial owner of the shares held in street name. As a beneficial owner, you have the right to direct your nominee on how to vote the shares held in your account, and your nominee has enclosed or provided voting instructions for you to use in directing it on how to vote your shares. However, the organization that holds your shares is considered the stockholder of record for purposes of voting at the Annual Meeting. Because you are not the stockholder of record, you may not vote your shares at the Annual Meeting unless you request and obtain a valid proxy from the organization that holds your shares giving you the right to vote the shares at the Annual Meeting.
Voting Instructions
If you are a stockholder of record, you may:
•VOTE AT THE ANNUAL MEETING - if you would like to vote at the Annual Meeting, please follow the instructions that will be available on the Annual Meeting Website during the Annual Meeting;
•VOTE BY MAIL IN ADVANCE OF THE ANNUAL MEETING - if you request a paper proxy card, complete, sign and date the enclosed proxy card, then follow the instructions on the card: or
•VOTE VIA THE INTERNET OR VIA TELEPHONE IN ADVANCE OF THE ANNUAL MEETING - follow the instructions on the proxy card and have the proxy card available when you access the internet website or place your telephone call.
Votes submitted via the internet or by telephone must be received by 11:59 p.m. Eastern Time on March 10, 2024. If you submit your vote by mail, your completed, signed and dated proxy card must be received prior to the Annual Meeting. Submitting your proxy, whether via the internet, via telephone or by mail if you requested a paper proxy card, will not affect your right to vote at the Annual Meeting should you decide to attend the meeting.
If you are not a stockholder of record, please refer to the voting instructions provided by your nominee to direct it how to vote your shares.
Your vote is important. Whether or not you plan to attend the Annual Meeting, we urge you to vote by proxy to ensure your vote is counted.
What if I return my proxy card but do not provide voting instructions?
All proxies will be voted in accordance with the instructions specified on the proxy card. If you sign a proxy card and return it without instructions as to how your shares should be voted on a particular proposal at the Annual Meeting, your shares will be voted in accordance with the recommendations of our Board stated above.
If you hold your shares in street name and do not vote, and your broker does not have discretionary power to vote your shares, your shares may constitute “broker non-votes” (as described below) and will not be counted in determining the number of shares necessary for approval of the proposals. However, shares that constitute broker non-votes will be counted for the purpose of establishing a quorum for the Annual Meeting.
8
Can I change my vote or revoke my proxy?
A stockholder of record who has given a proxy may revoke it at any time before it is exercised at the Annual Meeting by:
•Delivering to our Corporate Secretary a written notice stating that the proxy is revoked;
•Signing and delivering a proxy bearing a later date;
•Voting again via internet or by telephone no later than 11:59 p.m. Eastern Time on March 10, 2024; or
•Attending and voting at the Annual Meeting (although attendance at the Annual Meeting will not, by itself, revoke a proxy).
Please note, however, that if your shares are held of record by a broker, bank or other nominee and you wish to revoke a proxy, you must contact that firm to revoke any prior voting instructions.
Will I be able to ask questions at the Annual Meeting?
You will be able to submit written questions during the Annual Meeting by following the instructions that will be available on the Annual Meeting Website during the Annual Meeting. Only questions pertinent to meeting matters or our Company and submitted in accordance with the Annual Meeting’s Rules of Conduct will be answered during the meeting, subject to time constraints. Questions that are substantially similar may be grouped and answered together to avoid repetition. The Annual Meeting’s Rules of Conduct will be available on the Annual Meeting Website.
What is the quorum requirement for the Annual Meeting?
The holders of a majority of the voting power of the shares of our common stock entitled to vote at the Annual Meeting as of the Record Date must be present at the Annual Meeting in order to hold the Annual Meeting and conduct business. This presence is called a quorum. Your shares are counted as present at the Annual Meeting if you are present and vote in person at the Annual Meeting, if you vote in advance of the Annual Meeting by mail or internet or by telephone or if you have properly submitted a proxy.
What is the vote required for each proposal?
For Proposal One, each director will be elected by a plurality of the votes cast, which means that the two individuals nominated for election to our Board at the Annual Meeting receiving the highest number of “FOR” votes will be elected. You may vote “FOR ALL NOMINEES,” to “WITHHOLD AUTHORITY FOR ALL NOMINEES” or “FOR ALL EXCEPT” one of the nominees you specify. If any nominee is unable or unwilling to serve for any reason, proxies may be voted for such substitute nominee as the proxy holder might determine. Proxies may not be voted for more than two directors. Each nominee has consented to being named in this Proxy Statement and to serve if elected.
For Proposal Two, ratification of the appointment of PricewaterhouseCoopers LLP as our independent registered public accounting firm for the fiscal year ending September 28, 2024 will be obtained if the number of votes cast “FOR” the proposal at the Annual Meeting represents a majority of the votes cast by stockholders.
For Proposal Three, the approval, on an advisory basis, of the named executive officer compensation will be obtained if the number of votes cast “FOR” the proposal at the Annual Meeting represents a majority of the votes cast by stockholders.
9
How are abstentions and broker non-votes treated?
Abstentions (i.e. shares present at the Annual Meeting and marked “abstain”) and “broker non-votes” are each included in the determination of the number of shares present and entitled to vote at the meeting for purposes of determining the presence or absence of a quorum for the transaction of business at the Annual Meeting; however, neither abstentions nor broker non-votes are counted as voted either for or against a proposal and, as such, will not affect the outcome of the vote on any proposal.
A “broker non-vote” occurs when your broker submits a proxy for your shares but does not indicate a vote for a particular proposal because the broker has not received voting instructions from you and is not authorized to vote on that proposal without instructions. A broker is authorized to vote shares held for a beneficial owner on “routine” matters without instructions from the beneficial owner of those shares, but is not authorized to vote shares held for a beneficial owner on “non-routine” matters without instructions from the beneficial owner of those shares.
Proposals One and Three are each considered a “non-routine” matter. If you do not provide your broker with specific instructions on how to vote your shares, the broker that holds your shares will not be authorized to vote on Proposal One or Three. Accordingly, we encourage you to provide voting instructions to your broker, whether or not you plan to attend the Annual Meeting.
Proposal Two is considered a “routine” matter. Brokers have discretionary authority to vote shares that are beneficially owned on Proposal Two.
What does it mean if I receive more than one proxy card?
You may receive more than one set of voting materials for the Annual Meeting, including multiple copies of this Proxy Statement and multiple proxy cards or voting instruction cards. For example, your shares may be registered in more than one name or registered in different accounts. To make certain all of your shares are voted, please follow the instructions included on each proxy card and vote each proxy card via the internet, telephone or by mail. If you requested or received paper proxy materials and you intend to vote by mail, please complete, sign and return each proxy card you received to ensure that all of your shares are voted.
Who is paying for this proxy solicitation?
We will pay the expenses of soliciting proxies, including preparation, assembly, printing and mailing of this Proxy Statement, the proxy card and any other information furnished to stockholders. Following the original mailing of the proxy materials, we and our agents, including directors, officers and other employees, without additional compensation, may solicit proxies by mail, email, telephone, facsimile, by other similar means or in person. Following the original mailing of the proxy materials, we will request brokers, custodians, nominees and other record holders to forward copies of the proxy materials to persons for whom they hold shares and to request authority for the exercise of proxies. In such cases, upon the request of the record holders, we will reimburse such holders for their reasonable expenses. If you choose to access the proxy materials or vote via the internet or by telephone, you are responsible for any internet access or telephone charges you may incur.
10
Where can I find the voting results?
Voting results will be tabulated and certified by the inspector of elections appointed for the Annual Meeting. The preliminary voting results will be announced at the Annual Meeting. The final results will be tallied by the inspector of elections and filed with the U.S. Securities and Exchange Commission (the “SEC”) in a current report on Form 8-K within four business days of the Annual Meeting.
11
BOARD OF DIRECTORS AND CORPORATE GOVERNANCE
BOARD OF DIRECTORS
Our Board is responsible for overseeing and providing advice and counsel to our Chief Executive Officer and senior leadership team in the conduct of operating our business and fostering the creation of long-term value for our stockholders. In accordance with our restated certificate of incorporation and our restated bylaws, our Board currently consists of seven directors and is divided into three classes, with staggered three-year terms. As further described below, the current leadership structure of our Board separates the roles of Chairperson and Chief Executive Officer, with Julius Genachowski serving as our Chairperson and Patrick Spence serving as our Chief Executive Officer.
Our Board is composed of members with diverse professional backgrounds, experience, expertise and viewpoints who combine a strong professional reputation and knowledge of our business and industry with a reputation for integrity. Many of our directors have experience serving on board and board committees of other public companies, and have an understanding of corporate governance practices and trends and different business challenges and strategies.
Composition of the Board and its Committees; Director Independence; Director Qualifications
Our Board conducts an annual review of the independence of our directors. Our Board has determined that each of the members of our Board, other than Mr. Spence, is “independent” as that term is defined under the rules of The Nasdaq Stock Market (“Nasdaq”). In assessing independence, our Board determined that none of the members of our Board, other than Mr. Spence, has a relationship that would interfere with the exercise of independent judgment in carrying out the responsibilities of a director.
Our Board has established an Audit Committee, a Compensation, People and Diversity & Inclusion Committee and a Nominating and Corporate Governance Committee. The Board has determined that all committee members are independent under applicable Nasdaq and SEC rules for committee memberships, that each member of our Compensation, People and Diversity & Inclusion Committee qualifies as a non-employee director under Rule 16b-3 of the Securities Exchange Act of 1934 (the “Exchange Act”), and that each member of our Audit Committee is financially literate. In addition, our Board has determined that Karen Boone is an audit committee financial expert within the meaning of Item 407(d) of Regulation S-K.
12
The composition of our Board and its committees as of January 29, 2024 is as follows:
|
|
|
|
|
|
|
|
|
|
|
|
|
|
|
|
Committee Membership |
Name |
|
Age |
|
Class |
|
Director Since |
|
Independent |
|
Audit |
|
Compensation, People and Diversity & Inclusion |
|
Nominating and Corporate Governance |
Karen Boone(1) |
|
50 |
|
Class I |
|
June 2017 |
|
√ |
|
Chair |
|
● |
|
|
Joanna Coles |
|
61 |
|
Class I |
|
February 2020 |
|
√ |
|
● |
|
● |
|
|
Thomas Conrad |
|
54 |
|
Class II |
|
March 2017 |
|
√ |
|
|
|
Chair |
|
|
Julius Genachowski(2) |
|
61 |
|
Class II |
|
September 2013 |
|
√ |
|
● |
|
|
|
Chair |
Jonathan Mildenhall |
|
56 |
|
Class III |
|
January 2024 |
|
√ |
|
|
|
● |
|
|
Patrick Spence |
|
49 |
|
Class III |
|
January 2017 |
|
|
|
|
|
|
|
|
Michelangelo Volpi |
|
57 |
|
Class II |
|
March 2010 |
|
√ |
|
|
|
|
|
● |
(1)Audit Committee Financial Expert
(2)Chairperson of the Board
The responsibilities of each committee are described below. Each of these committees has a written charter approved by our Board. Copies of the charters for each committee are available on the Investor Relations section of our website, which is located at https://investors.sonos.com, by clicking on “Governance Documents” in the “Corporate Governance” section of our website.
Audit Committee
The purpose of our Audit Committee is to assist our Board in fulfilling its oversight responsibilities relating to our financial accounting, financial reporting and internal controls. As more fully described in its charter, our Audit Committee has responsibility for, among other things:
•selecting an accounting firm to serve as the independent registered public accounting firm to audit our financial statements;
•helping to ensure the independence of the independent registered public accounting firm;
•discussing the scope and results of the audit with the independent registered public accounting firm, and reviewing, with management and the independent accountants, our interim and year-end operating results;
•developing procedures for employees to anonymously submit concerns about questionable accounting or audit matters;
•reviewing with management the Company’s significant risk exposures (including those related to cybersecurity, ESG and climate), reviewing our policies for risk assessment and risk management, and steps management has taken to monitor these risks;
•reviewing with management the Company’s ESG reporting and disclosures;
•considering the adequacy of our internal accounting controls and audit procedures;
•reviewing and approving any proposed transaction between our company and any related party; and
13
•approving the fees and other compensation to be paid to our independent registered public accounting firm, and pre-approving all audit and non-audit related services provided by our independent registered public accounting firm.
Compensation, People and Diversity & Inclusion Committee
The purpose of our Compensation, People and Diversity & Inclusion Committee (the “CPD&I Committee”) is to assist our Board with respect to compensation matters and to oversee our policies and strategies relating to culture and people management, including diversity and inclusion. As more fully described in its charter, our CPD&I Committee has responsibility for, among other things:
•reviewing and determining the compensation of our executive officers and making recommendations to our Board regarding compensation of our non-employee directors;
•administering our stock and equity incentive plans;
•reviewing and making recommendations to our Board regarding the adoption or amendment of incentive compensation and equity plans;
•reviewing the compensation-related disclosures in our proxy statements and human-capital related disclosures in our annual reports;
•reviewing, approving and administering any policies with respect to the recoupment or “clawback” of compensation of executive officers and other employees;
•periodically reviewing and assessing our policies, initiatives and results in the areas of diversity and inclusion (other than those within the purview of other committees of the Board); and
•establishing and reviewing general policies relating to the compensation and benefits of our employees.
Our CPD&I Committee may delegate authorities to subcommittees as it deems appropriate and to the extent permitted under Nasdaq listing standards, and applicable laws, rules and regulations, along with our corporate governance documents.
Nominating and Corporate Governance Committee
The purpose of our Nominating and Corporate Governance Committee is to identify, consider and recommend candidates for membership on our Board, develop and recommend corporate governance policies, oversee the evaluation of our Board and assist our Board with respect to corporate governance matters. As more fully described in its charter, our Nominating and Corporate Governance Committee has responsibility for, among other things:
•identifying, evaluating and recommending nominees to our Board and committees of our Board;
•conducting searches for appropriate directors;
•evaluating the performance of our Board, of the committees of our Board and of individual directors;
•considering and making recommendations to the Board regarding the composition of the Board and its committees;
•reviewing developments in corporate governance practices;
•evaluating the adequacy of our corporate governance practices and reporting;
•reviewing litigation and other legal matters on a periodic basis that could have a significant impact on the Company;
•overseeing our corporate social responsibility and sustainability program; and
•making recommendations to our Board concerning corporate governance matters.
14
Board Diversity
Our Board seeks members from diverse professional backgrounds who combine a strong professional reputation and knowledge of our business and industry with a reputation for integrity. Our Board does not have a formal policy with respect to diversity and inclusion. Diversity of experience, expertise and viewpoints is one of many factors the Nominating and Corporate Governance Committee considers when recommending director nominees to our Board. Further, our Board is committed to actively seeking highly qualified women and individuals from minority groups to include in the pool from which new candidates are selected.
We believe that the current composition of our Board reflects our commitment to diversity in the areas of gender, ethnicity and professional background. The table below provides additional diversity information regarding our Board as of January 29, 2024. Each of the categories listed in the below table has the meaning as it is used in Nasdaq Listing Rule 5605(f).
|
|
|
|
|
|
|
|
|
Board Diversity Matrix (as of January 29, 2024) |
Board Size: |
Total Number of Directors |
|
7 |
Gender Identity: |
|
Female |
|
Male |
|
Non-Binary |
|
Did Not Disclose Gender |
Directors |
|
2 |
|
5 |
|
— |
|
— |
Demographic Background: |
African American or Black |
|
|
|
— |
|
— |
|
— |
Alaskan Native or Native American |
|
— |
|
— |
|
— |
|
— |
Asian |
|
— |
|
— |
|
— |
|
— |
Hispanic or Latinx |
|
— |
|
— |
|
— |
|
— |
Native Hawaiian or Pacific Islander |
|
— |
|
— |
|
— |
|
— |
White |
|
2 |
|
4 |
|
— |
|
— |
Two or More Races or Ethnicities |
|
— |
|
1 |
|
— |
|
— |
LGBTQ+ |
|
— |
|
1 |
|
— |
|
— |
Did Not Disclose Demographic Background |
|
— |
|
— |
|
— |
|
— |
CORPORATE GOVERNANCE
Corporate Governance Guidelines and Code of Business Conduct and Ethics
Our Corporate Governance Guidelines set forth our policies and procedures related to corporate governance and cover topics including director qualifications and responsibilities, Board composition and management, and succession planning. Our Corporate Governance Guidelines are available without charge on the Investor Relations section of our website, which is located at https://investors.sonos.com, by clicking on “Governance Documents” in the “Corporate Governance” section of our website.
We have adopted a Code of Business Conduct and Ethics that applies to all of the members of our Board, officers and employees. Our Code of Business Conduct and Ethics is posted on the Investor Relations section of our website, which is located at https://investors.sonos.com, by clicking on “Governance Documents” in the “Corporate Governance” section of our
15
website. We intend to satisfy the disclosure requirement under Item 5.05 of Form 8-K regarding amendment to, or waiver from, a provision of our Code of Business Conduct and Ethics by posting such information on our website at the location specified above.
Board Leadership Structure
Our Corporate Governance Guidelines provide that the roles of Chairperson and Chief Executive Officer may be either separate or combined, and our Board exercises its discretion in combining or separating these positions as it deems appropriate in the best interests of our company. When determining the leadership structure that will allow the Board to effectively carry out its responsibilities and best represent our stockholders’ interests, the Board will consider various factors, including our specific business needs, our operating and financial performance, industry conditions, the economic and regulatory environment, Board and committee annual self-evaluations, advantages and disadvantages of alternative leadership structures and our corporate governance practices. In the event that our Chief Executive Officer holds the Chairperson position, our Board will designate a “lead independent director” by a majority vote of the independent directors, which “lead independent director” shall have the responsibilities set forth in our Corporate Governance Guidelines.
Currently, Julius Genachowski, an independent director, serves as our Chairperson. Our Board believes that separating the positions of Chief Executive Officer and Chairperson allows our Chief Executive Officer to focus on setting our strategic direction and over-seeing our day-to-day business, while allowing the Chairperson to lead our Board in its fundamental role of providing independent advice to, and oversight of, management. In addition, we believe that this structure enhances the independent oversight of the Company, provides multiple opportunities for discussion and evaluation of management decisions and the direction of the Company and increases objectivity of the Board’s evaluation of the Chief Executive Officer role. Mr. Genachowski has been the Chairperson of our Board since May 2023, and Patrick Spence has served as our Chief Executive Officer and as a member of our Board since January 2017.
Our Corporate Governance Guidelines provide the flexibility for our Board to modify this leadership structure as appropriate.
Presiding Director of Non-Employee Director Meetings
Our non-employee directors meet regularly in scheduled executive sessions without management to promote open and honest discussion. Our Chairperson, Mr. Genachowski, is the presiding director at these meetings.
Board and Committee Self-Evaluations
Each year, the Board and its committees undergo a review and evaluation of their respective conduct and performance through a self-evaluation questionnaire that assesses, among other things, composition and structure, responsibilities and processes, meetings and materials, and management interactions. Our evaluation process is designed to identify ways in which to enhance the performance of the Board and its committees and to identify specific areas, if any, in need of improvement or strengthening. The Chair of our Nominating and Corporate Governance Committee oversees the evaluation process, which currently includes individual interviews with each director and a report of the results to the full Board.
16
Our Board of Directors’ Role in Risk Oversight
Our Board as a whole has responsibility for risk oversight. Our Board exercises this risk oversight responsibility directly and through its committees. The risk oversight responsibility of our Board and its committees is informed by reports from our management teams and from our internal audit department that are designed to provide visibility to our Board about the identification, assessment and management of key risks, and our management’s risk mitigation strategies.
Risk Oversight Structure
|
The Board |
Our Board has primary responsibility for evaluating the most significant risks applicable to the Company, including: ●strategic, financial and operational risks including related to our annual business plan and product strategy; ●senior management succession planning; ●business or financial risks, including related to significant transactions and liquidity and credit; and ●brand or reputational risks, including those related to human capital management. |
|
|
|
Board Committees |
The Board’s committees oversee delegated responsibilities for specific risks as follows: |
Our Audit Committee assists our Board with risk oversight and has primary responsibility for: ●oversight of our major financial and risk exposures; ●oversight of our major business risk exposures, including those related to our supply chain, information security and technology, cybersecurity, ESG, climate and data privacy; ●establishing procedures and overseeing the review of our ethics and compliance program and the Company’s compliance with legal and regulatory requirements; ●discussing guidelines and policies with respect to assessing and managing risk with management and our independent auditor; ●our internal control over financial reporting; ●our disclosure controls and procedures; and ●oversight of processes to identify material risks, including through our enterprise risk management program. |
Our Compensation, People and Diversity & Inclusion Committee has responsibility for: ●evaluating risks arising from our compensation and people policies and practices; and ●oversight of the Company’s policies and strategies relating to culture and people management, including diversity and inclusion. |
Our Nominating and Corporate Governance Committee has responsibility for: ●evaluating risks relating to our corporate governance practices, including related to Board structure, composition, independence and evaluation; ●periodic review of litigation and other legal matters that could have a significant impact on the Company; and ●oversight of matters that could have an impact on the Company’s business activities, performance and reputation, including the Company’s public policy activities and corporate social responsibility and sustainability programs. |
17
|
Management |
Our management team implements and supervises processes to manage risks in the day-to-day operations of our business. These processes are coordinated through its legal, internal audit and other functions which, along with management, regularly report to the Board and its committees on risks that are material to the Company. Enterprise Risk Management Program The Board and Audit Committee also review and discuss with management the Company’s findings from its annual enterprise risk management program, a process led by our internal audit department for considering a broad range of risks to the business. The enterprise risk management process takes into account feedback from senior business leaders and identifies and evaluates trends and concerns. Through the process, risks are evaluated in light of their probability and severity. The Board is kept apprised of ongoing management and mitigation efforts related to key risks. |
Compensation Committee Interlocks and Insider Participation
None of the members of our CPD&I Committee in Fiscal 2023 was at any time during Fiscal 2023 one of our officers or employees, and none had or have any relationships with us that are required to be disclosed under Item 404 of Regulation S-K. During Fiscal 2023, none of our executive officers served as a member of the board of directors, or as a member of the compensation or similar committee, of any entity that has one or more executive officers who served on our Board or CPD&I Committee.
Board and Committee Meetings and Attendance
Our Board and its committees meet regularly throughout the year, and also hold special meetings and act by written consent from time to time. During Fiscal 2023: (i) our Board met five (5) times; (ii) our Audit Committee met six (6) times; (iii) our CPD&I Committee met four (4) times; and (iv) our Nominating and Corporate Governance Committee met four (4) times.
During Fiscal 2023, each member of our Board attended at least 75% of the aggregate of all meetings of our Board and of all meetings of committees of our Board on which such member served that were held during the period in which such director served.
Board Attendance at Annual Meeting of Stockholders
Our policy is to invite and encourage each member of our Board to be present at our annual meetings of stockholders. Six out of eight directors attended our 2023 Annual Meeting held on March 9, 2023.
Communication with Directors
Stockholders and interested parties who wish to communicate with our Board, non-management members of our Board as a group, a committee of our Board or a specific member of our Board (including our Chairperson) may do so by letters addressed to the attention of our Corporate Secretary.
All communications are reviewed by the Corporate Secretary and provided to the members of our Board as appropriate. Unsolicited items, sales materials, abusive, threatening or otherwise inappropriate materials and routine items and items unrelated to the duties and responsibilities of our Board will not be provided to directors.
18
The address for these communications is, until April 30, 2024:
Sonos, Inc.
614 Chapala Street
Santa Barbara, CA 93101
Attn: Corporate Secretary
As of May 1, 2024, the address for these communications will be:
Sonos, Inc.
301 Coromar Drive
Goleta, CA 93117
Attn: Corporate Secretary
Stockholder Engagement
We actively engage with major stockholders of the Company, which has been our practice since our initial public offering in 2018. Starting in 2022, we launched a formalized stockholder outreach program designed to solicit feedback from the Company’s stockholders with respect to a number of topics related to our corporate governance structure and policies and executive compensation program, which we continued in 2023. This effort supplements the ongoing communications between our management and stockholders.
As part of the 2023 stockholder outreach campaign, we solicited the views of institutional investors that we believe represented approximately 55% of our issued and outstanding shares owned by institutional investors as of September 30, 2023, and had discussions with and received feedback from investors representing approximately 18% of such outstanding shares. The results of the stockholder outreach campaign and the feedback we received were discussed with our Nominating and Corporate Governance Committee, particularly with respect to our corporate governance structure, and subsequently shared with our Board.
We plan to continue various stockholder communication and outreach programs in the future.
19
Sustainability & Impact
Overview
Sonos’ Sustainability and Impact programs aim to make a positive contribution to society and the environment. We have established five pillars across our Environmental, Social, and Governance work: Sustainability, Diversity, Equity & Inclusion, Supply Chain Responsibility, Privacy & Cybersecurity, and Social Impact.
Taking Climate Action
One important focus for Sonos is reducing greenhouse gas emissions across our operations and value chain while delivering the premium sound experience our customers know and expect. In Fiscal 2021, we established a Climate Action Plan centered on reducing our emissions and guiding our efforts toward those goals.
As part of our Climate Action Plan, we conduct annual carbon footprint assessments. This year, our carbon footprint assessment measured our Fiscal 2022 emissions and the results showed a minor decrease in our impact areas compared to Fiscal 2021 due to improved data quality. As with Fiscal 2021, the largest contributor was product energy use, making energy efficiency a priority of our Climate Action Plan.
In Fiscal 2023, we conducted a robust climate risk assessment, evaluating physical and transition risks and opportunities using the framework established by the TCFD. This assessment found that Sonos’ exposure to climate-related risks is low. We also added a financial analysis in line with the TCFD. This enabled us to report to the Carbon Disclosure Project for the first time, a major milestone for our climate program.
Product Sustainability
Designing products that last and reducing their environmental footprint is integral to our sustainability mission. We built sustainability into all three of our Fiscal 2023 marquee products: Era 100, Era 300, and Move 2. We improved the energy efficiency, use of recycled plastics, and serviceability for these three products. Era 100’s and Era 300’s idle power consumption is under 2 watts — our first plug-in speakers to reach this milestone. The power-save mode reduces energy consumption even further. Era 100 and Era 300 incorporate approximately 40% recycled plastic and the design facilitates easy in-region repair, reducing transportation emissions and keeping products and component materials in use longer. Move 2 is 47% more energy efficient than Move when idle and incorporates recycled plastic.
For products in development, we continue to focus on five areas: energy efficiency, design for serviceability, safer materials that minimize the use of substances of concern, and circular materials that minimize single-use plastics and increase recycled content in our products and packaging. We now conduct life cycle assessments, analyzing product impacts holistically from raw material extraction through end-of-life. The findings help us understand how design decisions affect environmental outcomes and identify areas of improvement. Based on these third-party verified assessments, we release in-depth Product Environmental Reports on our website that detail the environmental footprint of our new products.
We also deliver award-winning packaging that utilizes Forest Stewardship Council certified fibers and sustainably sourced materials to replace plastics from the unboxing experience. Our team won Best In Show at The Dieline Awards 2023 for our paper-based Sonos Ray and Sub Mini product packaging.
20
Supply Chain Audits
We are committed to respecting human rights in our supply chain through a robust Supplier Code of Conduct, trusted relationships with suppliers, and verified audits of labor practices and environmental conditions. We conduct in-person audits of key suppliers, who represent 80% of our supply chain spend, to confirm their compliance with our Supplier Code of Conduct. If a noncompliance is identified, we will work with our suppliers to take corrective action. In rare instances where a noncompliance is not corrected, we will terminate our business with that supplier. To deepen our commitment to supply chain responsibility, we have participated as an affiliate member of the Responsible Business Alliance since Fiscal 2021 to help us adhere to the latest best practices in human rights standards, especially as we expand our operations into new regions globally.
Diversity, Equity & Inclusion
As part of our DEI efforts, we recruit, retain, and support employees from all backgrounds. DEI principles are integrated into our operations, culture, and business strategy and we continue to make progress in developing a diverse and inclusive culture by focusing on four areas: workforce (talent acquisition, management and development), workplace (culture), marketplace (inclusive product design and marketing), and community (societal impact).
In Fiscal 2023, we invested in inclusive recruitment and retention, increased transparency regarding our DEI efforts to our employees, and incorporated feedback from employee resource groups and other stakeholders. We continue to measure progress against our DEI goals. By fiscal year 2026, we are aiming to increase the representation of Black employees by 50%, Latinx employees by 25%, in each case as compared to Fiscal 2022, and to ensure that our representation of women in tech-focused roles mirrors the talent market.
Privacy & Cybersecurity
We deeply respect our customers’ privacy. Our approach to privacy is described in our privacy statement. For cybersecurity, our approach includes technical and organizational measures to protect customer information, which includes operating a robust vulnerability disclosure program. We welcome and encourage feedback on our security practices, and each vulnerability concern reported to us is thoroughly investigated and addressed by our information security team.
Social Impact
Our philanthropic support includes grants, product donations, and employee volunteering. To target our support most effectively, our social impact program, Sonos Soundwaves, partnered with over a dozen nonprofit organizations globally in Fiscal 2023. We focused on supporting efforts in biodiversity conservation, STEM learning experiences, and music education. We believe our emphasis on biodiversity will prepare us well for emerging standards. We remain committed to strengthening ecoacoustics programs that use sound technology to promote environmental protection.
Governance
Our Nominating and Corporate Governance Committee has oversight of our corporate social responsibility and sustainability program, and our Audit Committee has oversight over ESG disclosures and risk. In November 2023, we released our Listen Better Report for Fiscal 2023, offering a detailed overview of our ESG efforts described above. A copy of this report is available on the sustainability section of our Investor Relations website and at sustainability.sonos.com.
21
NOMINATIONS PROCESS AND DIRECTOR QUALIFICATIONS
Nomination to the Board of Directors
The Nominating and Corporate Governance Committee is responsible for recommending to the Board nominees for election to our Board at each annual meeting of stockholders and for identifying one or more candidates to fill any vacancies that may occur on our Board. New candidates may be identified through recommendations from existing directors or members of management, consultants or third-party search firms, discussions with other persons who may know of suitable candidates to serve on our Board, and stockholder recommendations. Evaluations of prospective candidates typically include a review of the candidate’s background and qualifications by the Nominating and Corporate Governance Committee, interviews with the committee as a whole, one or more members of the committee, or one or more other Board members, and discussions within the committee and the full Board. The Nominating and Corporate Governance Committee then recommends candidates to the full Board, with the full Board selecting the candidates to be nominated for election by the stockholders or to be appointed by the Board to fill a vacancy.
The Nominating and Corporate Governance Committee will consider director candidates proposed by stockholders as well as recommendations from other sources. Additional information regarding the process for properly submitting stockholder nominations for candidates for nomination to our Board is set forth below under “Stockholder Proposals and Nominations for the 2025 Annual Meeting.”
Director Qualifications
In accordance with its charter and our Corporate Governance Guidelines, the Nominating and Corporate Governance Committee develops and recommends to our Board appropriate criteria, including desired qualifications, expertise, skills and characteristics, for selection of new directors and periodically reviews the criteria adopted by our Board and, if appropriate, recommends changes to such criteria.
Key Qualifications and Experiences
We have identified key qualifications and experiences that are important to be represented on the Board, in light of the Company’s business model and expected future strategy. The table below summarizes how these key qualifications and experiences are related to our Company’s business.
|
|
Business Characteristic |
Key Qualification/Experience |
We are a global consumer electronics company with a portfolio of proprietary audio products and services, proprietary software and an open platform. We partner with a broad range of content providers, such as streaming music services, internet radio stations, and podcast services, allowing our customers to enjoy their audio content from whichever source they desire. We frequently introduce new services and features across our platform, and intend to deepen our relationships with our current partners and expand our partner ecosystem. |
Consumer Technology and Content Experience |
We are committed to continuous technological innovation, including by delivering at least two new products per year. We also seek to make thoughtful and targeted investments to drive long-term growth, including acquisitions. |
Strategic Planning and Product Innovation Experience |
We sell through both retail channels and direct-to-consumer and in more than 60 countries. Our strategy of sustainable, profitable growth is dependent on |
Consumer Sales and Marketing Experience |
22
|
|
reaching and acquiring new households who add more products over time and deliver word-of-mouth marketing. |
|
We are a global company, with 29% of our employees and 41% of our Fiscal 2023 revenue outside of the United States, and our products are sold in more than 60 countries. We also manufacture our products outside of the United States and, similar to other companies in our industry, may face challenges in managing our global supply chain. |
Global Operating Experience |
We are a public company with a disciplined approach to financial management and accurate disclosure. |
Finance and Accounting Experience |
Our business is global and subject to a variety of regulatory regimes and requirements. In addition, we have a strategy for protecting our intellectual property and resisting anti-competitive conduct by large tech platforms. Each requires us to maintain relationships with various governmental entities and nongovernmental organizations. |
Government and Regulatory Experience |
We are subject to a variety of risks and seek to identify, assess, and manage those risks for the long-term success of our business and to meet our legal and regulatory obligations. |
Risk Oversight and Corporate Governance Experience |
We are a multifaceted global technology company, whose success requires aligning many areas of operations, including capital allocation, engineering, product design, supply chain, marketing, technology, human capital management, legal and our community and charitable activities. |
C-Suite Experience |
We are committed to creating responsibly-designed products and experiences, built by inclusive teams in pursuit of our mission to help the world listen better. |
Sustainability |
Board Diversity
As discussed above, our Board seeks members from diverse professional backgrounds who combine a strong professional reputation and knowledge of our business and industry with a reputation for integrity. Our Board does not have a formal policy with respect to diversity and inclusion. Diversity of experience, expertise and viewpoints is one of many factors the Nominating and Corporate Governance Committee considers when recommending director nominees to our Board. Further, our Board is committed to actively seeking highly qualified women and individuals from minority groups to include in the pool from which new candidates are selected. Our Board also seeks members that have experience in positions with a high degree of responsibility or are, or have been, leaders in the companies or institutions with which they are, or were, affiliated, but may seek other members with different backgrounds, based upon the contributions they can make to our company.
23
PROPOSAL ONE: ELECTION OF DIRECTORS
In accordance with our restated certificate of incorporation and our restated bylaws, our Board currently consists of seven directors and is divided into three classes, with staggered three-year terms. Directors in Class III will stand for election at the Annual Meeting. The terms of office of directors in Class I and Class II expire at our Annual Meetings of Stockholders to be held in 2025 and 2026, respectively.
At the recommendation of our Nominating and Corporate Governance Committee, our Board proposes that each of the two nominees named below be elected as a Class III director for a three-year term expiring at our 2027 Annual Meeting of Stockholders or until such director’s successor is duly elected and qualified or until such director’s earlier death, resignation, disqualification or removal. There are no family relationships among our directors and executive officers.
NOMINEES TO OUR BOARD OF DIRECTORS
The nominees, their ages as of January 29, 2024, biographical information and lengths of service on our Board are set forth below.
|
Class III Director Nominees |
|
|
Jonathan Mildenhall 
Age: 56 Director since: January 2024 Committees: CPD&I Other Public Company Boards: Current: None Within the past five years: Peloton Interactive Northern Star Investment Corp. IV |
Key Skills and Qualifications: Jonathan Mildenhall was selected to serve on our Board because of his deep expertise in consumer brand strategies, global marketing campaigns and initiatives, design, and advertising. Mr. Mildenhall has a long track record of driving innovative and successful approaches in each of these disciplines, and is also known for helping companies broaden their appeal to diverse audiences. Experience: Mr. Mildenhall is currently the Chief Marketing Officer of Rocket Companies Inc., a position he has held since January 2024. He is the Co-Founder and Executive Chairman of TwentyFirstCenturyBrand, a consumer brand strategy and marketing consultancy firm. He also serves on the board of Fanatics, Inc. and previously served on the board of Peloton Interactive, a connected fitness company, from February 2022 to December 2023 and the board of Northern Star Investment Corp. IV, a special purpose acquisition company, from March 2021 to September 2023. Prior to co-founding TwentyFirstCenturyBrand, Mr. Mildenhall served as Chief Marketing Officer of Airbnb from 2014 to 2018. Before Airbnb, Mr. Mildenhall led The Coca-Cola Company’s marketing initiatives as Senior Vice President of integrated marketing communication and design excellence from 2013 to 2014 and as Senior Vice President of global advertising strategy and content excellence from 2007 to 2013. Earlier in his career, Mr. Mildenhall served in various management positions in marketing and advertising. Mr. Mildenhall holds a Higher National Diploma in Business and Finance from The Manchester Metropolitan University. He completed the Advanced Management Program at Harvard Business School, and holds an Honorary Doctorate in Business Administration from The Manchester Metropolitan University. |
24
|
|
Patrick Spence 
Age: 49 Director since: January 2017 Other Public Company Boards: Current: Snap, Inc. |
Key Skills and Qualifications: Patrick Spence was selected to serve as a member of our Board given his expertise in driving product innovation, strategic planning, leading consumer sales and marketing organizations, managing global operations, ESG matters, and in consumer technology policy and regulatory matters. Mr. Spence has held numerous senior leadership positions in the consumer technology sector and brings a unique perspective to the Board as our Chief Executive Officer. Experience: Mr. Spence has served as our Chief Executive Officer and as a member of our Board of Directors since January 2017, and as our President since July 2016. Previously, Mr. Spence served as our Chief Commercial Officer from June 2012 to June 2016. Prior to Sonos, he spent 14 years at Research In Motion Limited, a consumer electronics company and the developer of the BlackBerry device, in a variety of senior roles, including most recently serving as the Senior Vice President and the Managing Director of Global Sales and Regional Marketing from August 2011 until June 2012. Mr. Spence currently serves on the board of directors of Snap, Inc., a camera and social media company. Mr. Spence holds a B.A. in business administration from the Ivey Business School at the University of Western Ontario. |
25
CONTINUING DIRECTORS
The directors who are serving for terms that end following the Annual Meeting, their ages as of January 29, 2024, biographical information and lengths of service on our Board are set forth below.
|
|
Class I Directors |
Karen Boone 
Age: 50 Director since: June 2017 Committees: Audit CPD&I Other Public Company Boards: Current: Peloton Interactive Rivian Automotive |
Key Skills and Qualifications: Karen Boone was selected to serve as a member of our Board given her background as a C-Suite and finance executive in the retail and consumer sector, most recently at the leading premium home furnishings retailer, RH. Ms. Boone has extensive experience in strategic and financial planning, governance and risk oversight including cybersecurity and product safety and compliance, and global operations, overseeing financial, accounting, human resources, legal and investor relations functions. Ms. Boone is a seasoned director, serving on several public and private company boards and on the Audit Committee (as chair) of several public company boards. Experience: Ms. Boone most recently served as the President, Chief Financial and Administrative Officer of RH (formerly Restoration Hardware, Inc.), a home furnishings company, from May 2014 until August 2018, and as Chief Financial Officer from June 2012 to May 2014. Prior to that, from 1996 to June 2012, she held various roles at Deloitte & Touche LLP, a public accounting firm, most recently as an Audit Partner. She currently serves on the board of directors of Peloton Interactive, a connected fitness company, Rivian Automotive, an automotive technology company, and several private companies. Ms. Boone holds a B.S. in business economics from the University of California, Davis. |
26
|
|
Joanna Coles 
Age: 61 Director since: February 2020 Committees: Audit CPD&I Other Public Company Boards: Current: Snap, Inc. Within the past five years: Bark, Inc. Northern Star Investment Corp. II Northern Star Investment Corp. III Northern Star Investment Corp. IV |
Key Skills and Qualifications: Joanna Coles was selected to serve as a member of our Board given her media leadership, extensive experience in partnerships and in content across all forms of media, and expertise in brand development and marketing, including by reaching diverse audiences. Ms. Coles serves on a number of boards at the intersection of culture and commerce, helping Sonos tap into unique partnerships, and build a global brand. Experience: Ms. Coles currently serves on the board of directors of Snap Inc., a camera and social media company. Ms. Coles is the former Chief Content Officer of Hearst Magazines, overseeing editorial for Hearst’s 300 titles globally, and served in that role from September 2016 until August 2018. Prior to that she was Editor-in-Chief of Cosmopolitan, a role she started in September 2012. She edited Marie Claire magazine from April 2006 to September 2012. Ms. Coles worked for The Times of London from September 1998 to September 2001 and served as New York Bureau Chief for The Guardian from 1997 to 1998. She is on the boards of Grover, a privately-held consumer electronic rental service company, and KDC-One, a beauty manufacturing company. Ms. Coles has been a special advisor to Cornell Capital private equity since 2019 and has a TV development deal with Futureshack. She is also on the board of the non-profit Fallen Journalists Memorial Foundation. Previously, she served as Chair and CEO of Northern Star Investment Corp. Ms. Coles holds a B.A. in English and American literature from the University of East Anglia. |
27
|
|
Thomas Conrad 
Age: 54 Director since: March 2017 Committee: CPD&I Other Public Company Boards: None |
Key Skills and Qualifications: Thomas Conrad was selected to serve as a member of our Board due to his expertise in the design, development and innovation of a diverse range of software-based and consumer-focused technology products and those involving audio content. Mr. Conrad also has extensive C-Suite experience, including at the CEO level, and experience leading and building product teams in the consumer technology and content industries. Experience: Mr. Conrad is currently the Chief Executive Officer of Zero Longevity Science, Inc. (formerly Big Sky Health), maker of the metabolic health app Zero, a position he has held since November 2021. He previously served as the Chief Product Officer of Quibi, a short form streaming service, from March 2019 to January 2021. Mr. Conrad was the Vice President of Product at Snap Inc., a camera and social media company, from March 2016 to March 2018. Prior to Snap, Mr. Conrad served as the Chief Technology Officer and Executive Vice President of Product of Pandora Media, Inc., a streaming music service company, from July 2004 to July 2014. Mr. Conrad holds a B.S.E in computer science from the University of Michigan. |
|
28
|
|
Julius Genachowski 
Age: 61 Director since: September 2013, Chairperson since May 2023 Committees: Audit Nominating and Corporate Governance Other Public Company Boards: Current: Mastercard Incorporated Within the past five years: Sprint Corporation |
Key Skills and Qualifications: Julius Genachowski was selected to serve on our Board due to his expertise in government and regulatory matters, including as Chairman of the Federal Communications Commission; experience as a C-suite executive, investor and board member in the technology, communications and media industries, including experience with consumer technology and content; his global perspectives and experiences in various roles; his finance and transactional experience as an executive and investor; and his risk oversight and corporate governance experience, including serving on the board of directors of public companies and on Audit (as chair) and Risk Committees. Experience: Mr. Genachowski is a Senior Advisor at The Carlyle Group, a global investment firm, a position he has held since January 2024; from 2014 through 2023 Julius was a Partner and Managing Director at Carlyle. He served as the Chairman of the U.S. Federal Communications Commission from 2009 to 2013. He has held senior executive positions at IAC/InterActiveCorp, an internet, e-commerce and media company. He currently serves on the board of directors of Mastercard Incorporated, a global technology company in the payments industry, where he chairs the Audit Committee and serves on the Risk and Human Resources & Compensation Committees. He previously served on the board of directors of Sprint Corporation, a communications company, from August 2015 until April 2020. He also served on the President’s Intelligence Advisory Board under President Obama, and has served on the staff of then-Representative Charles Schumer and on the staff of the U.S. House Select Committee on the Iran-Contra Affair. Mr. Genachowski holds a B.A. in history from Columbia University and a J.D. from Harvard Law School, and served as a law clerk to U.S. Supreme Court Justice David H. Souter. |
|
29
|
|
Michelangelo Volpi 
Age: 57 Director since: March 2010, Chairperson from November 2010 to May 2023 Committees: Nominating and Corporate Governance Other Public Company Boards: Current: Aurora Innovation, Inc., Confluent, Inc., and Ferrari N.V. Within the past five years: Tishman Speyer Innovation Corp. II, Elastic N.V., Hortonworks, Inc., Fiat Chrysler Automobiles N.V., and Zuora, Inc. |
Key Skills and Qualifications: Michelangelo Volpi was selected to serve on our Board because of his broad expertise in strategic planning and evaluating business strategies; his extensive experience as a C-suite executive, investor and board member in the technology industry; his finance experience as an executive and investor; his global perspectives and experiences in various roles; and his finance experience as an executive and investor. Mr. Volpi is a seasoned director, serving on several public and private company boards. Experience: Since July 2009, Mr. Volpi has served as a Partner at Index Ventures, a venture capital firm. Mr. Volpi has served as a director of Aurora Innovation, Inc., a self-driving technology company, which became a publicly-traded company in November 2021, Confluent, Inc., a data streaming platform, since April 2015, and Ferrari N.V., an automotive company, since April 2023, in addition to serving as a director for numerous private companies. Mr. Volpi has previously served as a director of various public companies, including Tishman Speyer Innovation Corp. II, a special purpose acquisition company, from February 2021 to December 2022, Elastic N.V., a search and data analysis company, from January 2013 to July 2022, Fiat Chrysler Automobiles N.V., an automotive company, from April 2017 to January 2021, Zuora, Inc., an enterprise software company, from November 2011 to June 2020, Hortonworks, Inc. (now a subsidiary of Cloudera, Inc.), a data software company, from October 2011 to January 2019, Pure Storage, Inc., an all-flash data storage company, from April 2014 to October 2018, and Exor N.V., a holding company, from April 2012 to May 2018. Mr. Volpi holds a B.S. in Mechanical Engineering, an M.S. in Manufacturing Systems Engineering, and an M.B.A. from Stanford University. |
DIRECTOR COMPENSATION
Director Compensation Table
The following table presents the total compensation for each person who served as a non-employee director during Fiscal 2023. Mr. Spence is not included in the table below, as he is employed as our Chief Executive Officer and receives no compensation for his service as director. The compensation received by Mr. Spence as an employee is included in “Executive Compensation—Summary Compensation Table” below.
30
|
|
|
|
|
|
|
Name |
|
Fees Earned or Paid in Cash ($) |
|
Stock Awards ($)(1)(2) |
|
Total ($) |
Karen Boone |
|
85,000 |
|
198,018 |
|
283,018 |
Joanna Coles |
|
65,000 |
|
198,018 |
|
263,018 |
Thomas Conrad |
|
75,000 |
|
198,018 |
|
273,018 |
Deirdre Findlay (3) |
|
75,000 |
|
198,018 |
|
273,018 |
Julius Genachowski (4) |
|
116,027 |
|
198,018 |
|
314,045 |
Panos Panay (5) |
|
65,000 |
|
198,018 |
|
263,018 |
Michelangelo Volpi (6) |
|
— |
|
— |
|
— |
(1)The amounts reported in this column represent the aggregate grant date fair value of the restricted stock units (“RSUs”) granted under our 2018 Equity Incentive Plan to our directors during Fiscal 2023, as computed in accordance with Financial Accounting Standard Board Accounting Standards Codification Topic 718 (“ASC 718”), excluding the effect of estimated forfeitures. The assumptions used in calculating the dollar amount recognized for financial statement reporting purposes of the equity awards reported in this column are set forth in Note 2 to our audited consolidated financial statements included in our Annual Report. See footnote (1) to the Summary Compensation Table.
(2)Our non-employee directors held the following number of stock options and RSUs, each as of September 30, 2023:
|
|
|
|
|
Name |
|
Shares Subject to Outstanding Stock Options |
|
Shares Subject to Outstanding Stock Awards |
Karen Boone |
|
31,766 |
|
35,633* |
Joanna Coles |
|
— |
|
10,011 |
Thomas Conrad |
|
31,766 |
|
22,841** |
Deirdre Findlay |
|
— |
|
17,504*** |
Julius Genachowski |
|
54,376 |
|
35,633* |
Panos Panay |
|
— |
|
—**** |
Michelangelo Volpi |
|
— |
|
— |
*Includes 10,011 RSUs that are unvested and 25,622 RSUs that are vested but for which such director has elected to defer settlement until a later date.
**Includes 10,011 RSUs that are unvested and 12,830 RSUs that are vested but for which such director has elected to defer settlement until a later date.
***Includes 10,011 RSUs that are unvested and 7,493 RSUs that are vested but for which Ms. Findlay has elected to defer settlement until a later date. In connection with her resignation from the Board on October 3, 2023, Ms. Findlay’s outstanding 10,011 RSUs vested on a pro rata basis, with settlement of the 5,006 shares that vested deferred to a later date as elected by Ms. Findlay.
**** In connection with his resignation from the Board on September 27, 2023, Mr. Panay’s outstanding 10,011 RSUs vested on a pro rata basis and Mr. Panay received 5,006 shares.
(3)Ms. Findlay resigned from our Board, effective October 3, 2023, in connection with her acceptance of a position with us as Chief Commercial Officer.
(4)Mr. Genachowski became our Chairperson in May 2023.
(5)Mr. Panay resigned from our Board, effective September 27, 2023.
31
(6)Mr. Volpi declined to accept any compensation for his service on our Board in Fiscal 2023.
Non-Employee Director Compensation Arrangements
Pursuant to a policy adopted by our Board, we pay each non-employee director an annual retainer fee of $55,000 for service on our Board and additional annual retainer fees for services as follows:
•$75,000 for the Board Chairperson;
•$20,000 for the Chair of our Audit Committee and $10,000 for each of its other members;
•$20,000 for the Chair of our CPD&I Committee and $10,000 for each of its other members; and
•$20,000 for the Chair of our Nominating and Corporate Governance Committee and $10,000 for each of its other members.
In addition, each non-employee director receives an annual equity grant of RSUs having a fair market value on the grant date equal to approximately $200,000 following each annual meeting of stockholders. Any non-employee director who is initially appointed to our Board receives an initial equity grant of RSUs having a fair market value on the grant date equal to approximately $200,000 at the time of appointment, subject to proration based on the date of appointment in the event that he or she is appointed other than on the date of the annual meeting of stockholders. In each case, the number of shares of our common stock subject to the grant of RSUs is determined by dividing $200,000 by the trailing 30 calendar day average of the closing price of our common stock on The Nasdaq Global Select Market. Each grant of RSUs will vest in full on the earlier of (i) the one-year anniversary of the date of grant and (ii) the date of the first annual meeting of stockholders following the date of grant, subject to the director providing services to us through the vesting date; provided, however, that in the event that a director ceases to provide services to us other than for Cause (as defined in the 2018 Equity Incentive Plan (the “2018 Plan”)), his or her outstanding RSUs will vest on a pro rata basis based on the last day of service. Non-employee directors are provided the opportunity to elect to defer settlement of all or a portion of the RSUs granted to them until a separation from service or a set date; in Fiscal 2023, each of Mses. Boone and Findlay and Messrs. Conrad and Panay elected to defer settlement of their annual equity grants. RSUs granted to non-employee directors under the policy described above will accelerate and vest in full in the event of a change of control, subject to the terms of our 2018 Plan. We also reimburse our directors for their reasonable out-of-pocket expenses in connection with attending meetings of our Board and committees.
Director Stock Ownership Guidelines Policy
For a description of the Stock Ownership Guidelines Policy that applies to our directors, please see “Executive Compensation—Executive and Director Stock Ownership Guidelines Policy” below.
OUR BOARD OF DIRECTORS RECOMMENDS A VOTE “FOR ALL NOMINEES” FOR THE ELECTION OF THE TWO CLASS III DIRECTORS SET FORTH IN THIS PROPOSAL ONE.
32
PROPOSAL TWO: RATIFICATION OF APPOINTMENT OF INDEPENDENT REGISTERED PUBLIC ACCOUNTING FIRM
Our Audit Committee has selected PricewaterhouseCoopers LLP as our independent registered public accounting firm to perform the audit of our consolidated financial statements for the fiscal year ending September 28, 2024, and recommends that our stockholders vote for the ratification of such selection. The ratification of the selection of PricewaterhouseCoopers LLP as our independent registered public accounting firm for the fiscal year ending September 28, 2024 requires the affirmative vote of a majority of the votes cast by stockholders. In the event that PricewaterhouseCoopers LLP is not ratified by our stockholders, the Audit Committee will review its future selection of PricewaterhouseCoopers LLP as our independent registered public accounting firm.
PricewaterhouseCoopers LLP audited our financial statements for the fiscal year ended September 30, 2023. Representatives of PricewaterhouseCoopers LLP are expected to be present at the Annual Meeting and they will be given an opportunity to make a statement at the Annual Meeting if they desire to do so, and will be available to respond to appropriate questions.
Independent Registered Public Accounting Firm Fees and Services
We regularly review the services and fees from our independent registered public accounting firm. These services and fees are also reviewed with our Audit Committee annually. In accordance with standard policy, PricewaterhouseCoopers LLP periodically rotates the individuals who are responsible for our audit. In addition to performing the audit of our consolidated financial statements, PricewaterhouseCoopers LLP provided various other services during the fiscal years ended September 30, 2023 and October 1, 2022. Our Audit Committee has determined that PricewaterhouseCoopers LLP’s provision of these services, which are described below, does not impair PricewaterhouseCoopers LLP’s independence from us. During the years ended September 30, 2023 and October 1, 2022, fees for services provided by PricewaterhouseCoopers LLP were as follows:
|
|
|
|
|
|
|
|
|
|
|
Fiscal Year Ended |
|
|
September 30, 2023 |
|
October 1, 2022 |
Audit fees (1) |
|
$2,731,396 |
|
|
|
$2,499,915 |
|
Audit-related fees (2) |
|
|
— |
|
|
|
— |
|
Tax fees (3) |
|
|
$40,000 |
|
|
|
— |
|
Other fees (4) |
|
|
$2,900 |
|
|
|
$242,900 |
|
Total fees |
|
$2,774,296 |
|
|
$2,742,815 |
|
(1)Consists of fees rendered in connection with the audit of our consolidated financial statements, including audited financial statements presented in our annual report on Form 10-K, review of the interim consolidated financial statements included in our quarterly reports and services normally provided in connection with regulatory filings.
(2)Consists of fees billed for assurance and related services that are reasonably related to the performance of the audit or review of our consolidated financial statements and are not reported under “Audit Fees.”
(3)Consists of fees billed for professional services for tax compliance, tax advice and tax planning. These services include assistance regarding federal, state and international tax compliance, as well as technical tax advice related to federal and state income tax matters, assistance with sales tax and assistance with tax audits.
33
(4)Consists of fees for professional services other than those reported in the categories above, including access to resource materials and portals. For Fiscal 2022, these fees also include professional advisory services related to the Company’s activities to replace its legacy enterprise resource management system.
Policy on Audit Committee Pre-Approval of Audit and Permissible Non-Audit Services of Independent Registered Public Accounting Firm
Our Audit Committee’s policy is to pre-approve all audit and permissible non-audit services provided by our independent registered public accounting firm, the scope of services provided by our independent registered public accounting firm and the fees for the services to be performed. These services may include audit services, audit-related services, tax services and other services. Pre-approval is detailed as to the particular service or category of services and is generally subject to a specific budget. Our independent registered public accounting firm and management are required to periodically report to the Audit Committee regarding the extent of services provided by our independent registered public accounting firm in accordance with this pre-approval, and the fees for the services performed to date.
All of the services relating to the fees described in the table above were approved by our Audit Committee.
OUR BOARD OF DIRECTORS RECOMMENDS A VOTE “FOR” APPROVAL OF PROPOSAL TWO.
34
PROPOSAL THREE: ADVISORY VOTE ON NAMED EXECUTIVE OFFICER COMPENSATION
This stockholder advisory vote, commonly known as "say-on-pay," is required pursuant to Section 14A of the Exchange Act and gives our stockholders the opportunity to approve or not approve, on a non-binding advisory basis, the compensation paid to our Chief Executive Officer and the other officers named in the Summary Compensation Table (“named executive officers”) as disclosed in this Proxy Statement.
The Board recommends a vote "FOR" the following resolution:
“RESOLVED, that the stockholders of Sonos, Inc. approve, on an advisory basis, the compensation of the named executive officers, as disclosed in the Proxy Statement, including the Compensation Discussion and Analysis, the compensation tables and any related narrative discussion.”
The Compensation Discussion and Analysis, beginning on page 41, describes our executive compensation programs and the compensation decisions made by our CPD&I Committee and Board for Fiscal 2023 with respect to the named executive officers. As described in detail in the Compensation Discussion and Analysis and highlighted in the section captioned “Executive Summary,” our CPD&I Committee believes that the most effective compensation program is designed to attract and reward talented individuals who possess the skills necessary to support our business objectives and create long-term value for our stockholders, expand our business, and assist in the achievement of our strategic goals.
Our Board is asking you to support this proposal. Because your vote is advisory, it will not be binding. However, the Board and the CPD&I Committee will review the voting results in their entirety and take them into consideration when making future decisions regarding named executive officer compensation. We currently intend to submit the executive compensation of our named executive officers to an advisory vote at our annual meeting of stockholders each year.
OUR BOARD OF DIRECTORS RECOMMENDS A VOTE “FOR” APPROVAL OF PROPOSAL THREE.
35
EXECUTIVE OFFICERS
Our executive officers and their ages, as of January 29, 2024, and biographical information are set forth below.
|
|
|
|
|
Name |
|
Age |
|
Position |
Patrick Spence |
|
49 |
|
Chief Executive Officer and Director |
Saori Casey |
|
56 |
|
Chief Financial Officer |
Edward Lazarus |
|
64 |
|
Chief Legal and Strategy Officer and Corporate Secretary |
Maxime Bouvat-Merlin |
|
48 |
|
Chief Product Officer |
Deirdre Findlay |
|
50 |
|
Chief Commercial Officer |
Nicholas Millington |
|
47 |
|
Chief Innovation Officer |
Shamayne Braman |
|
35 |
|
Chief People Officer |
Our executive officers are designated by, and serve at the discretion of, our Board. There is no family relationship among any of the directors or executive officers.
Patrick Spence. For a brief biography of Mr. Spence, please see “Proposal One: Election of Directors— Class III Director Nominees.”
Saori Casey has served as our Chief Financial Officer since January 2024. From July 2011 to December 2023, Ms. Casey served as Vice President of Finance at Apple Inc., a designer and manufacturer of consumer electronics and a variety of services. Prior to that, Ms. Casey held various roles as a finance executive at Cisco Systems Inc., a communications technology manufacturer, for fifteen years. She has served on the board of directors of Houzz Inc., a leading platform for home remodeling and design company, since 2019, and also serves on the Audit Committee, as a Chair, and the Compensation Committee. Ms. Casey holds a B.A. in Economics from the University of California, Santa Barbara, and an M.B.A. from Peter F. Drucker Graduate School of Management at the Claremont Graduate University, where she served as a member of the Drucker Advisory Board since 2018.
Edward Lazarus has served as our Chief Legal Officer and Corporate Secretary since January 2019 and was named Chief Strategy Officer in January 2024. He served as our Interim Chief Financial Officer from August 2022 to November 2022, and as our Chief Financial Officer from November 2022 to January 2024. From January 2013 to December 2018, Mr. Lazarus served as the Executive Vice President, General Counsel and Corporate Secretary of Tribune Media Company. Prior to Tribune, Mr. Lazarus worked as an independent consultant and attorney from February 2012 to January 2013 and served as the Chief of Staff to the Chairman of the Federal Communications Commission from June 2009 to February 2012. From 2000 to 2009, Mr. Lazarus practiced law at Akin Gump Strauss Hauer & Feld LLP. Mr. Lazarus holds a B.A. from Yale University and a J.D. from Yale Law School. Since 2015, Mr. Lazarus has served on the board of directors of the Sequoia Fund, a mutual fund.
Maxime Bouvat-Merlin has served as our Chief Product Officer since April 2023. Prior to assuming the role of Chief Product Officer, he was Senior Vice President of Hardware & Operations from June 2020 until April 2023 and Vice President of Hardware from July 2016 until June 2020. Prior to joining Sonos, Mr. Bouvat-Merlin held executive roles at distinguished technology companies such as Quicklogic, Qualcomm-Atheros, Broadcom Corp., and Texas Instruments. Mr. Bouvat-Merlin holds a Bachelor of Science in applied physics from the Faculte de Luminy in Marseille, France, where he graduated with honors, as well as a Master degree in computer sciences from ESINSA in Nice, France.
Deirdre Findlay has served as our Chief Commercial Officer since October 2023. Previously, Ms. Findlay served as a member of our Board of Directors from February 2020 until October 2023. Ms. Findlay was the Global Chief Marketing Officer of McAfee Corp., a global computer security software company, from January 2023 to October 2023 and the Global Chief
39
Marketing Officer and Head of Consumer Revenue at Condé Nast, a global media company, from January 2020 until January 2023. Ms. Findlay currently serves on the board of directors of Olaplex Holdings, Inc, a beauty company. Ms. Findlay was the Chief Marketing Officer of Stitch Fix, a personal style service company, from May 2018 to January 2020. Prior to Stitch Fix, she served as Senior Director of Global Hardware Marketing with Google, a global internet services and products company, from May 2013 to May 2018, Senior Director of Consumer Marketing at eBay, a global ecommerce company, from July 2011 to April 2013, and as Senior Vice President of Digitas, a marketing agency, from July 2000 to June 2011. Ms. Findlay holds a B.A. in Economics from Williams College and an M.B.A. from The Tuck School of Business at Dartmouth College.
Nicholas Millington has served as our Chief Innovation Officer since July 2020. Mr. Millington previously served as our Chief Product Officer from February 2017 to June 2020, as our Vice President and Chief of Staff of Product from February 2010 to January 2017, as our Director of Advanced Development and Architecture from November 2006 to February 2010 and as our Director of Software Development from April 2003 to October 2006. Prior to Sonos, from June 1998 to April 2003, Mr. Millington served as a Software Design Engineer Lead, SharePoint for Microsoft Corporation, a technology company. Mr. Millington holds a B.S.E. in electrical engineering from Duke University.
Shamayne Braman has served as our Chief People Officer since September 2022. Ms. Braman previously served as our Chief Diversity Equity and Inclusion Officer from October 2021 to September 2022. Prior to Sonos, Ms. Braman served as Director, Diversity and Inclusion, from October 2020 to September 2021, and as Senior Manager, Culture Diversity and Inclusion, from December 2019 to October 2020, at Target Corporation, a department store chain. From June 2017 to November 2019, she served as the Director, Diversity and Inclusion and, from February 2016 to June 2017, as Diversity Inclusion and Community Partnerships Associate at HealthPartners, a non-profit health care provider and health insurance company. Ms. Braman holds a B.A. in English from Princeton University and a master’s degree in education policy and management from Harvard University.
40
EXECUTIVE COMPENSATION
Compensation Discussion and Analysis
This Compensation Discussion and Analysis (“CD&A”) provides context for the policies and decisions underlying the compensation reported in the executive compensation tables included in this proxy statement for our named executive officers (“NEOs”). For Fiscal 2023, our NEOs were:
|
|
Named Executive Officer |
Title |
Patrick Spence |
Chief Executive Officer |
Edward Lazarus |
Former Chief Financial Officer, Chief Legal and Strategy Officer and Corporate Secretary |
Maxime Bouvat-Merlin |
Chief Product Officer |
Nicholas Millington |
Chief Innovation Officer |
Shamayne Braman |
Chief People Officer |
Matthew Siegel |
Former Chief Commercial Officer |
During Fiscal 2023, the following transitions occurred with respect to our NEOs:
●Mr. Lazarus served as our Interim Chief Financial Officer, effective September 1, 2022 to November 2022, and as Chief Financial Officer from November 15, 2022 to January 21, 2024.
●Ms. Braman was appointed as an executive officer of the Company effective January 11, 2023.
●Mr. Siegel resigned as Chief Commercial Officer, effective February 17, 2023.
●Mr. Bouvat-Merlin was promoted to Chief Product Officer, effective April 17, 2023. Mr. Bouvat-Merlin was appointed as an executive officer of the Company effective May 3, 2023.
Subsequent to Fiscal 2023 and prior to the filing of this Proxy Statement:
●Deirdre Findlay resigned from the Board of Directors, effective October 3, 2023 and was appointed as Chief Commercial Officer, effective October 16, 2023.
●Saori Casey was appointed as Chief Financial Officer, effective January 22, 2024.
●Mr. Lazarus was appointed as Chief Strategy Officer, effective January 22, 2024, in addition to remaining our Chief Legal Officer and Corporate Secretary.
Executive Summary
Our Business
Sonos is one of the world's leading sound experience brands.
We pioneered multi-room, wireless audio products, debuting the world’s first multi-room wireless sound system in 2005. Today, our products include wireless, portable and home theater speakers, components, and accessories to address consumers’ evolving audio needs. We are known for delivering unparalleled sound, thoughtful design aesthetic, simplicity of use, and an open platform. Our platform has attracted a broad range of more than 130 streaming content providers, such as Apple Music, Spotify, Deezer, and Pandora. These partners find value in our independent platform and access to our millions of desirable and engaged customers. We frequently introduce new services and features across our platform, providing our customers with enhanced functionality, improved sound, and an enriched user experience. We are committed to continuous technological
41
innovation as reflected in our growing global patent portfolio. We believe our patents comprise the foundational intellectual property for wireless multi-room and other audio technologies.
Since we launched our first product 18 years ago, we have grown our install base by launching innovative new products, delivering a seamless customer experience, and expanding our global footprint. Our customers have typically purchased additional Sonos products over time. In Fiscal 2023, existing customers accounted for approximately 44% of new product registrations. As of September 30, 2023, we had a total of nearly 46.6 million products registered in approximately 15.3 million households globally, including the addition of approximately 1.3 million new households during Fiscal 2023. As of September 30, 2023, 60% of our 15.3 million households had registered more than one Sonos product. As of September 30, 2023, each of our households owned more than 3.0 Sonos products on average.
Fiscal 2023 Highlights
While Fiscal 2023 was a challenging year in the categories in which we operate, the strength of the Sonos brand and product portfolio enabled us to retain a strong market share position. We successfully raised the bar in the speaker category with the introduction of our new Era products, and extended our leadership in the premium portable category with Move 2. We also delivered on our commitment to maintain Adjusted EBITDA margin in spite of the headwinds we faced. We showed our commitment to making necessary changes to achieve sustainable profit growth by rightsizing our expense base with a reduction in force announced in June 2023.
Fiscal 2023 highlights include:
|
|
FISCAL 2023 HIGHLIGHTS |
Financial Results and Key Metrics |
Expanding our Brand While Responsibly Innovating |
●Net loss of $10.3 million ●Adjusted EBITDA* of $153.9 million ●Adjusted EBITDA margin* of 9.3% ●Free cash flow* of $50.1 million, improving significantly from -$74.5 million in Fiscal 2022 due to working capital improvements ●Gained significant market share in the US, UK, and Germany home theater category, and recorded our highest annual market share since fiscal year 2019 in both the US and Germany ●Record more than 3.0 products per household vs. 2.98 in Fiscal 2022; ended Fiscal 2023 in 15.3 million homes, with existing households representing 44% of new registrations ●Returned $100 million to stockholders by repurchasing 6.6 million shares; following fiscal year-end, announced Board authorization of additional $200 million program in November 2023 |
●Continued brand building efforts with partners, advocates and retailers to drive awareness and purchase intent with customers at scale: ○More than 30,000 consumers, industry and press visited the sound experience at the Dolby House during SXSW, March 2023 ○The Sonos Professional experience at CEDIA Expo, the premier tradeshow summit for home technology integration professionals, saw over 3,500 integrators, distribution partners, and strategic partners visit the booth ○ The Era Advocacy campaign enlisted more than 130 influencers, creating 350 pieces of bespoke content that resulted in more than 12 million impressions and 10 million views ●Continued to responsibly innovate, including by building sustainability into all three of our new marquee products: Era 100, Era 300, and Move 2. See “Sustainability” for more information on our ESG efforts. |
42
|
Continued Product Innovation |
●Era 100 - Launched March 2023. Our powerful smart speaker with improved acoustics and design that delivers detailed stereo sound and deep bass. Originally launched as One in October 2017 and completely redesigned in March 2023 as Era 100. ●Era 300 - Launched March 2023. Our bold, revolutionary speaker that offers the best out-loud listening experience for spatial audio content with Dolby Atmos. ●Move 2 - Launched September 2023. Our portable, battery-powered smart speaker that delivers spacious stereo sound, with ultra-durable water resistant design for outdoor and indoor listening. ●Sub Mini - Launched October 2022. Our wireless subwoofer which delivers powerful, balanced bass, rich, clear low end frequencies, in a compact cylindrical design. ●Sonos Pro - Launched April 2023. This new software as a service (SaaS) offering gives business owners the power to control Sonos across multiple locations. With this subscription-based solution, business owners get access to a web-based dashboard for remote monitoring and management, commercially-licensed music, and personalized support. |
* See Annex A of this Proxy Statement for reconciliations of non-GAAP items.
Executive Compensation Philosophy
We operate in a highly competitive and rapidly evolving market for skilled personnel in the consumer technology industry. Our ability to compete and succeed in our market is directly correlated to our ability to recruit, incentivize, and retain talented executives and individuals in the areas of product development, sales, marketing, and general and administrative functions. The CPD&I Committee (the “Committee”) believes an effective compensation program is designed to attract and reward talented individuals who possess the skills necessary to support our business objectives and create long-term value for our stockholders, expand our business, and assist in the achievement of our strategic goals.
Accordingly, the Committee believes the executive compensation packages provided to our executives, including our NEOs, should include both cash and stock-based compensation that achieve the following goals:
●Align the interests of management with those of stockholders;
●Provide fair and competitive compensation opportunities;
●Integrate compensation with our business plans;
●Reward both business and individual performance; and
●Attract and retain key executives critical to our success.
|
|
WHAT WE DO |
|
✓ Link Pay for Performance |
We link pay for performance and stockholder interests by heavily weighting compensation to short-term cash incentive awards and long-term equity awards that are tied to the value of our stock and our financial targets. |
✓ Incentivize a Strong Ownership Mentality |
Our primary compensation vehicle is our equity award program, which we use to motivate long-term performance and strongly align the interests of our executives with those of our stockholders. |
✓ Maintain Rigorous Stock Ownership Guidelines |
Executives are subject to stock ownership guidelines equal to a multiple of their annual base salaries (10x for our CEO and 5x for our other NEOs). |
✓ Use an Independent Compensation Consultant |
The Committee selects and engages its own independent compensation consultant. |
43
|
|
✓ Prohibit the Hedging of Our Common Stock |
We prohibit all employees and directors from engaging in hedging transactions and only allow for pledging our common stock in limited circumstances, subject to the approval of our Compliance Officer. |
✓ Maintain a Dodd-Frank Compliant Clawback Policy |
We maintain a clawback policy that requires recoupment of excess incentive compensation paid to our executive officers if amounts were based on material noncompliance with any financial reporting requirement that causes an accounting restatement, without regard to any fault or misconduct. |
|
|
WHAT WE DON’T DO |
✗ Provide Single Trigger Acceleration |
We do not provide for single trigger acceleration in connection with a change of control in employee equity awards. |
✗ Provide Material Executive Perquisites |
We do not provide material perquisites for executives, except in connection with a business-related relocation. |
✗ Provide Tax Gross-Ups |
We do not provide tax gross-ups for “excess parachute payments” or any other executive benefits in employee agreements, except in connection with a business-related relocation or commuting. |
✗ Provide Excessive Executive Retirement Benefits |
We do not provide any executive pension plan or supplemental retirement plans. |
✗ Encourage Excessive or Inappropriate Risk-Taking |
Our compensation programs are balanced in order to mitigate undue risks. |
✗ Provide for Guaranteed Cash Severance |
Our offer letters with our NEOs do not provide for guaranteed cash severance in the event of termination. |
Elements of Fiscal 2023 Compensation
The primary elements of our executive compensation program consist of base salary, annual incentive bonuses and annual long-term incentive awards. These primary elements and the highlights of our Fiscal 2023 compensation program were as follows:
|
|
|
|
|
Elements of Pay |
|
Structure |
|
Highlights |
|
|
|
|
|
Base Salary (see page 47) |
|
■ Fixed cash compensation for expected day-to-day responsibilities. ■ Reviewed annually and adjusted when appropriate, based on scope of responsibility, performance, time in role, experience, and competitive market for executive talent. |
|
■ Base salaries for Mr. Bouvat-Merlin, Mr. Millington, and Mr. Siegel were increased at the beginning of Fiscal 2023 in connection with the Committee’s annual review; Fiscal 2023 salaries for each other NEO were unchanged at the start of the year. ■ Mr. Bouvat-Merlin’s base salary was also increased in April 2023 in connection with his promotion to Chief Product Officer. |
|
|
|
|
|
Annual Incentive Bonuses (see page 48) |
|
■ Variable compensation paid in cash. ■ Based on Fiscal 2023 performance against pre-established enterprise-wide financial measures (45% revenue and 45% Adjusted EBITDA margin) and diversity, equity, and inclusion (“DEI”) objectives (10%). ■ Performance metrics evaluated annually for alignment with strategy and market trends. |
|
■ Fiscal 2023 target bonuses were 65% of base salary for each NEO, including our CEO. Mr. Bouvat-Merlin’s target bonus increased from 55% to 65% of base salary in April 2023 in connection with his promotion to Chief Product Officer. ■ Based on achievement against the financial measures and DEI objectives, Fiscal 2023 annual incentive bonuses paid out at 20.1% of target. |
|
|
|
|
|
44
|
|
|
|
|
Long-Term Incentives (see page 50) |
|
■ 50% of long-term incentives granted as part of the Fiscal 2023 long-term incentive program were granted in the form of restricted stock units (“RSUs”) that vest over three years. ■ 50% of long-term incentives granted as part of the Fiscal 2023 long-term incentive program were in the form of performance-based stock units (“PSUs”) that vest at the end of three years based on performance against each predetermined one-year performance goal (50% revenue and 50% Adjusted EBITDA margin). |
|
■ RSUs align NEOs’ interests with long-term stockholder value creation and encourage executive retention. ■ PSUs further link compensation directly to company performance. ■ All NEOs participated in the equity program for Fiscal 2023, with the exception of Mr. Lazarus who did not receive a grant in Fiscal 2023 after he received a special grant in connection with his appointment as interim CFO in September 2022. In addition, Mr. Bouvat-Merlin received an additional RSU grant in April 2023 in connection with his promotion to Chief Product Officer. ■ The Fiscal 2023 portion of the PSUs was earned at 16.8% of target based on revenue and Adjusted EBITDA margin achievement just above threshold. |
Executive Pay Mix
In Fiscal 2023, a significant portion of executive compensation for our NEOs consisted of variable, at-risk compensation, with a focus on equity-based long-term incentives. As illustrated below, 91% of target CEO compensation for Fiscal 2023 was composed of variable compensation elements, and 80% of our other currently employed NEOs’ target compensation, on average, was composed of variable compensation elements.
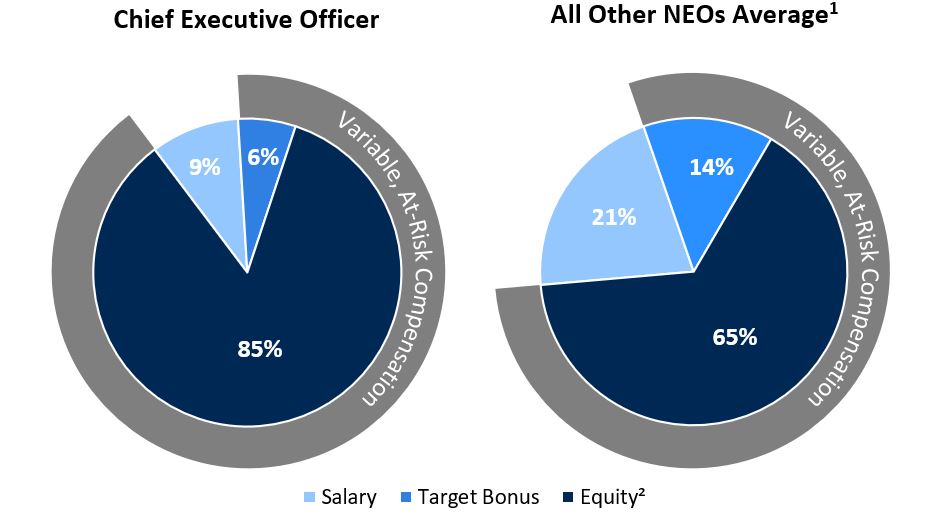
1 The “All Other NEOs Average” pie chart includes only the NEOs that were employees of the Company for all of Fiscal 2023 and participated in all aspects of the ongoing compensation program. Mr. Siegel is excluded due to his departure during the
45
fiscal year. In addition, Mr. Lazarus is excluded due to not participating in the long-term incentive grant for Fiscal 2023 after receiving a special equity award in Fiscal 2022 in connection with his appointment as interim CFO.
2 The pie charts reflect target levels of compensation. As described below, Mr. Bouvat-Merlin received an additional equity award in connection with his promotion to Chief Product Officer, which is included in the pie chart.
Emphasis on Performance Based Outcomes
Our executive compensation program is highly sensitive to company performance and aligns the realizable pay of our executives with actual financial and stock price performance. As presented in the chart below, our CEO’s realizable pay for Fiscal 2023 represented approximately 71% of target total direct compensation. This reflects the relationship of compensation paid to our performance during Fiscal 2023:
●The value of the annual bonus earned was 20.1% of the target opportunity based on our actual performance for the revenue and Adjusted EBITDA margin goals under our annual bonus program and performance for the DEI objectives under this program.
●The value of the RSUs granted to our CEO in Fiscal 2023 decreased from the date of grant because of a 26% decrease in our stock price from $17.40 on the date of grant to our stock price of $12.91 on the last day of Fiscal 2023.
The PSUs granted to our CEO in Fiscal 2023 are earned based on performance relative to annual financial goals for Fiscal 2023 to fiscal year 2025. The Fiscal 2023 tranche was earned at 16.8% of the target opportunity due to actual performance for the revenue and Adjusted EBITDA margin goals. The value of the two remaining tranches decreased from the date of grant because of the 26% decrease in our stock price as described above.
CEO Target vs. Realizable Pay – Fiscal 2023
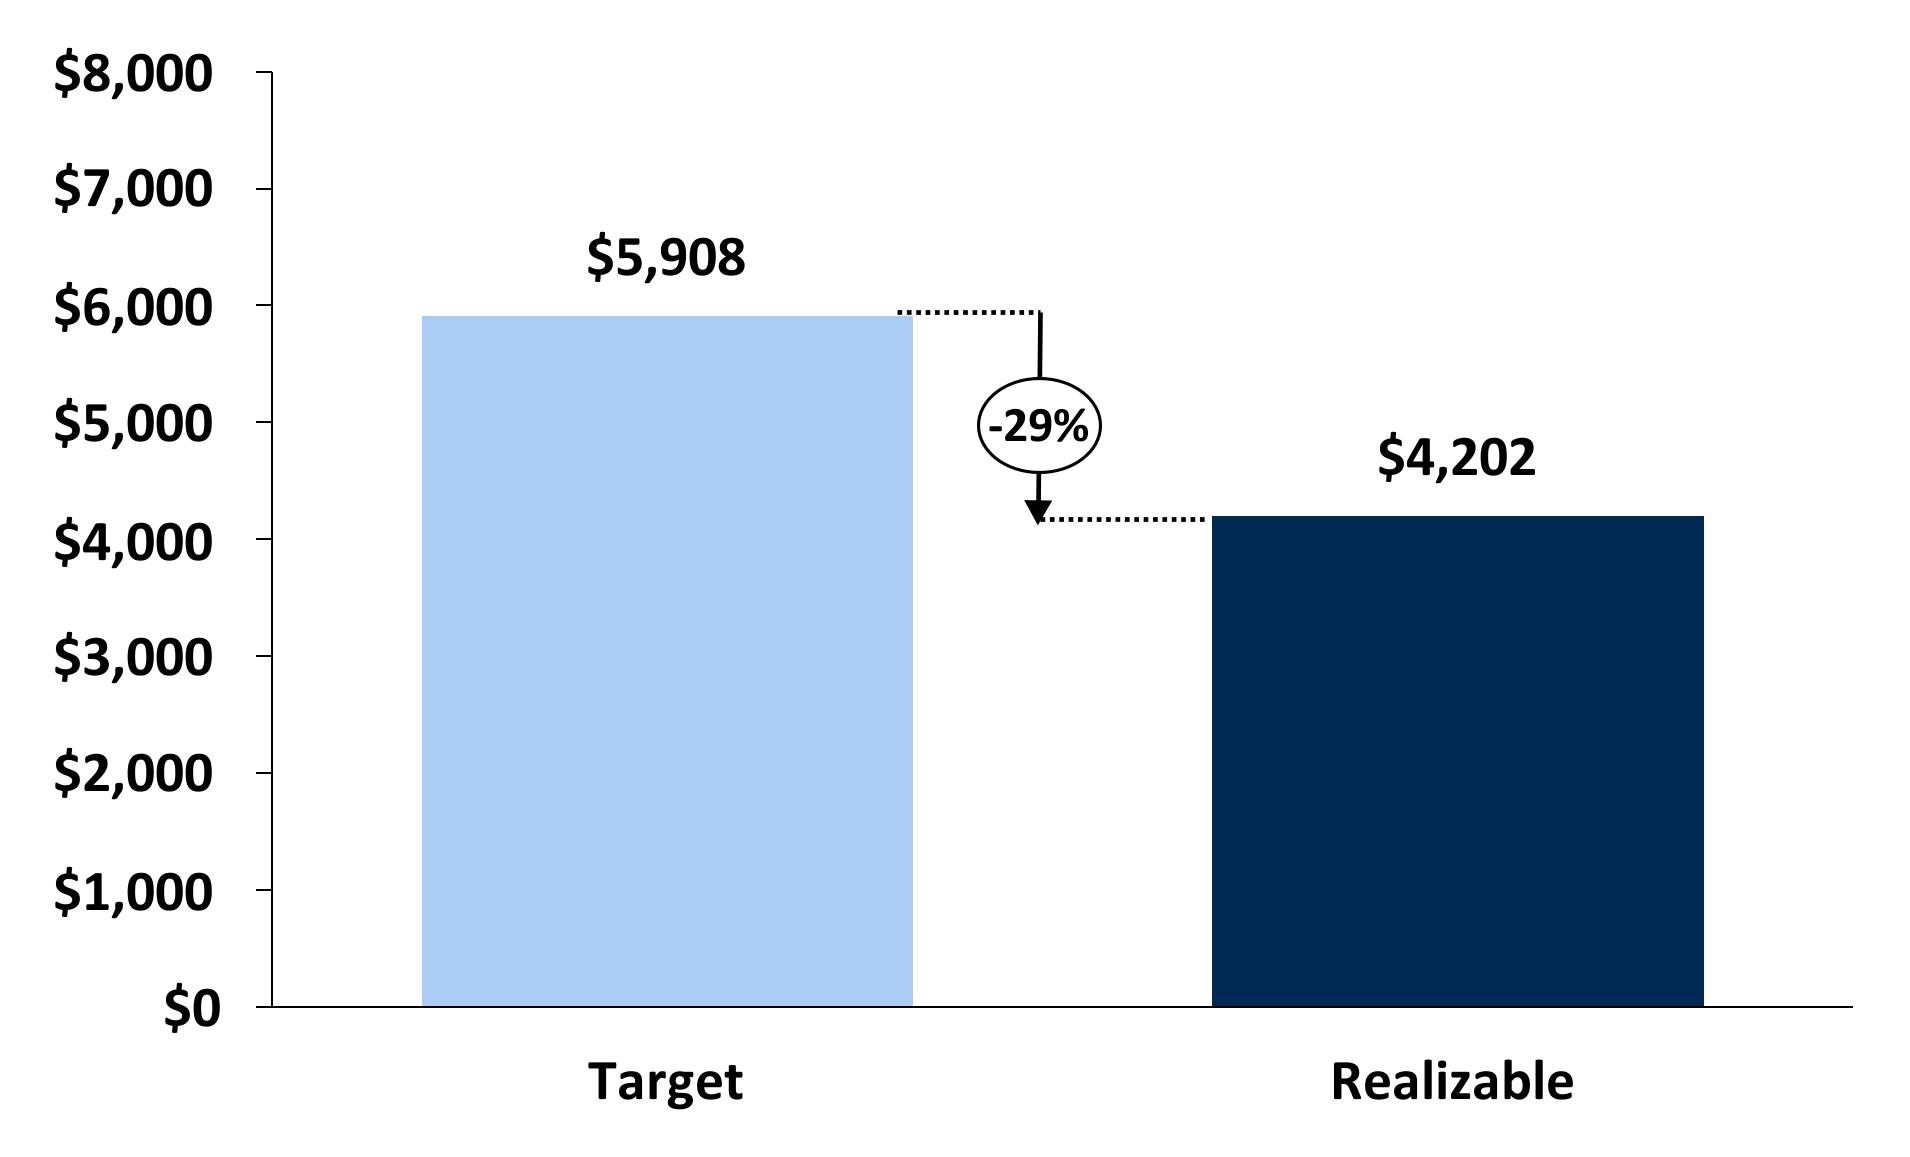
46
Target pay (or target total direct compensation) for Mr. Spence is equal to the salary and bonus paid during the year and the target value of RSUs and PSUs, as applicable (as shown in the “Annual Cash Incentive Plan” and “Fiscal 2023 Equity-Based Awards” sections below). Realizable pay is equal to the salary paid, the value of RSU grants based on the fiscal year-end share price, and the value of in-cycle Fiscal 2023 PSUs based on the fiscal year-end share price and actual financial performance through Fiscal 2023. These amounts do not correspond to values included in the "Summary Compensation Table" for Fiscal 2023. The PSUs are not considered granted for accounting purposes until the performance goals associated with such awards are established. As a result, the Summary Compensation Table reflects a portion of grants made in Fiscal 2021, Fiscal 2022, and Fiscal 2023 rather than reflecting only the grants made in the most recent year.
Pay Positioning and Market Comparators
The Committee considered competitive market practices when determining Fiscal 2023 compensation. Competitive market data, however, is only one of several factors considered by the Committee in setting executive compensation levels. The Committee also considers individual-specific factors, such as individual performance, scope of responsibilities, experience, level, company performance and economic conditions, as described in more detail below. The Committee does not use a formula or fixed target to determine compensation.
In setting compensation, the Committee compares base salaries, annual incentive opportunities and long-term compensation (cumulatively, target total direct compensation) for the NEOs to comparable roles from survey data provided by the Radford technology survey. The Committee believes that the Radford technology survey provides a robust sample of similarly sized technology companies and reflects a broad array of companies against which Sonos competes to attract and retain talent.
Fiscal 2023 NEO Compensation Decisions
Base Salary
We provide our NEOs and other employees with base salary to compensate them for services rendered during the fiscal year. Base salary ranges for our NEOs are determined for each executive based on his or her position and responsibilities.
The base salaries of our executives are also determined by considering such factors as:
●Experience of the executive;
●Level of responsibility for the executive;
●Economic conditions, company performance, financial conditions and strategic goals; and
●Competitive market data provided by the Committee’s independent compensation consultant.
In general, base salary determinations are considered each year as part of the Committee's review process in the first quarter of the fiscal year, as well as upon a promotion or other change in job responsibility. As part of this annual review process, the Committee approved a $75,000 increase to Mr. Bouvat-Merlin’s base salary, a $75,000 increase to Mr. Millington’s base salary and a $25,000 increase to Mr. Siegel’s base salary, in each case, to improve the competitiveness of their total cash compensation compared to market (as represented by the survey data discussed above). The other NEOs did not receive an increase to their
47
base salary at such time after the Committee determined the current salaries remained reasonable and competitive with market practices.
In connection with his promotion to Chief Product Officer, and based on market data, the Committee further increased Mr. Bouvat-Merlin’s base salary by $25,000 on April 17, 2023.
|
|
|
|
Name |
FY22 Salary ($) |
FY23 Salary ($) |
% Increase |
Patrick Spence |
$550,000 |
$550,000 |
-- |
Edward Lazarus |
$475,000 |
$475,000 |
-- |
Maxime Bouvat-Merlin |
$375,000 |
$475,000 (1) |
26.7% |
Nicholas Millington |
$375,000 |
$450,000 |
20.0% |
Shamayne Braman |
$400,000 |
$400,000 |
-- |
Matthew Siegel |
$450,000 |
$475,000 |
5.6% |
(1) Reflects a $75,000 increase to base salary on October 3, 2022, and a subsequent $25,000 base pay increase on April 17, 2023, in connection with Mr. Bouvat-Merlin’s promotion to Chief Product Officer.
Annual Cash Incentive Plan
We maintain an annual cash incentive plan that is designed to serve as an incentive to drive financial performance for the entire organization. Target bonus levels are considered each year as part of the Committee's review process in the first quarter of the fiscal year. The target bonus levels of 65% of base salary for our NEOs were unchanged for Fiscal 2023. Mr. Bouvat-Merlin’s target bonus was increased from 55% to 65% of base salary in connection with his promotion to Chief Product Officer.
|
|
|
Name |
FY22 Target Bonus |
FY23 Target Bonus |
Patrick Spence |
65% |
65% |
Edward Lazarus |
65% |
65% |
Maxime Bouvat-Merlin |
55% |
65% |
Nicholas Millington |
65% |
65% |
Shamayne Braman |
65% |
65% |
Matthew Siegel |
65% |
65% |
Each NEO, including our CEO, participated in our annual cash incentive plan for Fiscal 2023. Mr. Siegel was not eligible to receive a bonus at Fiscal 2023 year-end as he was no longer an employee of the Company when bonuses were paid.
Consistent with prior years, the Committee approved a structured and formulaic annual incentive plan for Fiscal 2023 that explicitly links a significant portion of bonus funding to Company financial goals. In Fiscal 2023, the plan financial metrics were revenue and Adjusted EBITDA margin, each weighted at 45%, and a DEI objective metric, weighted at 10%.
48
The Committee decided to continue using revenue, and made a determination to use Adjusted EBITDA margin, as the financial performance metrics under the annual cash incentive plan for Fiscal 2023 based on the belief that sustainable, profitable growth is an important driver of stockholder value creation. The financial metrics are set in the first quarter by the Committee based on our financial forecast for the year. For purposes of this plan, “Adjusted EBITDA margin” was defined as Adjusted EBITDA divided by revenue, with “Adjusted EBITDA” defined as net income (loss) adjusted to exclude the impact of depreciation, stock-based compensation expense, interest income, interest expense, other income (expense), income taxes, and other items that we do not consider representative of our underlying operating performance. For Fiscal 2023, the Committee decided to change the EBITDA-based metric from Adjusted EBITDA to Adjusted EBITDA margin as it and we believe that Adjusted EBITDA margin measures not just the success of our business in improving profitability but also our success in managing our cost base.
The Committee believes that tying a portion of compensation to our DEI objectives further emphasizes the importance of “Our Behaviors” (Respect, Transparency, Collaboration, and Ownership) and holds management directly accountable in creating a more diverse and inclusive environment. The DEI metric applicable to our annual bonus program for Fiscal 2023 consisted of working towards (i) increasing Black and Latinx (underrepresented races and ethnicities) representation at all levels and across all functions, (ii) increasing women representation in technical roles across all levels, and (iii) encouraging executive leaders to champion DEI through sponsorship, inclusive leadership, and integration of DEI in their business. Performance against each of these metrics is assessed by the Committee at fiscal year-end as “missed,” “met,” or “exceeded.”
Bonus payout opportunities range from 0% to 150% of target for DEI metrics and 0% to 200% of target for revenue and Adjusted EBITDA margin metrics. Payout for each metric is determined based on the table below using linear interpolation where performance is below the minimum payout level threshold.
|
|
|
Revenue Target (in $ millions)
45% Weight |
Adjusted EBITDA Margin Target (Margin Target %)
45% Weight |
Bonus Payout |
$2,095 |
11.65% |
200% |
$1,985 |
11.40% |
150% |
$1,925 |
10.90% |
125% |
$1,875 |
10.65% |
110% |
$1,825 |
10.40% |
100% |
$1,785 |
10.15% |
90% |
$1,755 |
9.90% |
80% |
$1,705 |
9.65% |
50% |
$1,625 |
9.15% |
0% |
During Fiscal 2023, we achieved $1.655 billion in revenue, which represented an achievement of 18.9% of target, and Adjusted EBITDA margin (as defined for purposes of the annual incentive plan) of 9.3% ($153.9 million), which represented an achievement of 14.6% of target. For the DEI performance objectives, the Committee determined an achievement of 50% of the target objectives. The Committee landed on this attainment based on its evaluation of our results for Fiscal 2023. We met or exceeded three of the five representation objectives and continue to hold the executive leadership team to a high bar of
49
accountability for driving inclusive leadership throughout the organization, as evidenced by annual engagement and belonging results. The combined achievement against the financial and DEI metrics resulted in a total annual incentive payout of 20.1% of target for our NEOs (other than Mr. Siegel).
Fiscal 2023 Equity-Based Awards
The majority of the target total direct compensation of our executive officers, including our NEOs, is provided through equity awards. By having a significant percentage of their target total direct compensation payable in the form of equity awards that vest over a number of years and therefore subject to more risk and longer vesting than our cash compensation program, we believe our executive officers are motivated to remain employed with Sonos and take actions that will benefit the Company and its stockholders over the long term.
We make annual equity grants to our executive officers in order to align their interests with those of our stockholders and ensure appropriate incentives are in place to promote a focus on our long-term performance. The size of these awards is not determined based on a specific formula, but rather through the exercise of the Committee’s judgment after considering market data, the individual performance of each of the executive officers, the recommendations of our Chief Executive Officer (except with respect to his awards), the appropriate level of compensation for the position given the scope of responsibility, the need to hire or retain an individual in a particular position, the current unvested equity awards held by such individual and related vesting schedules, the level of each executive officer’s total target cash compensation (base salary plus target cash incentive opportunity), and the potential retentive value of the proposed awards.
Beginning in Fiscal 2022, we expanded participation for performance-based equity (in the form of PSUs) to include all of our NEOs, with the exception of Mr. Millington, who first participated in performance-based equity in Fiscal 2023, after previously granting PSUs only to our CEO in Fiscal 2020 and 2021. Granting PSUs to our NEOs more broadly and directly links their long-term compensation with Company performance.
The Fiscal 2023 NEO equity awards were granted 50% in the form of PSUs and 50% in the form of time-vested RSUs. We did not grant any equity awards to Mr. Lazarus in Fiscal 2023 because he received a $4,000,000 RSU grant in connection with his appointment as interim Chief Financial Officer in September 2022, which vested fifty percent on the first anniversary of the grant date and will vest fifty percent on the second anniversary of the grant date.
The table below outlines the total target value of the equity awards our NEOs received in Fiscal 2023, assuming target performance in the case of PSUs. As a result, these values do not reflect the actual grant date fair value of the awards issued, as shown in the Grants of Plan-Based Awards table. The actual number of units granted was determined using a trailing-average closing stock price for the 30 calendar days prior to the date of grant.
|
|
|
Name |
Total Target Value of RSUs ($) |
Total Target Value of PSUs ($) |
Patrick Spence |
$2,500,000 |
$2,500,000 |
Edward Lazarus(1) |
― |
― |
Maxime Bouvat-Merlin |
$1,350,000 (2) |
$850,000 |
Nicholas Millington |
$750,000 |
$750,000 |
Shamayne Braman |
$500,000 |
$500,000 |
Matthew Siegel |
$800,000 |
$800,000 |
50
(1) Mr. Lazarus did not receive an annual equity grant in Fiscal 2023 after he received a special grant in connection with his appointment as interim CFO in September 2022.
(2) In addition to his annual equity grant, Mr. Bouvat-Merlin received an additional RSU grant in connection with his appointment as Chief Product Officer on April 17, 2023. The RSU grant had a target value of $500,000 based on market data (as represented by the survey data described above) and will vest in equal quarterly installments over three years.
The target values reflected in the table above differ from the grant date fair values reflected in the Summary Compensation Table. This is because we determine the number of shares to grant to each executive based on a 30 calendar-day trailing average share price in order to limit the impact of market volatility on the number of shares underlying granted equity awards. In addition, the grant date value of PSUs for accounting purposes (and therefore for Summary Compensation Table reporting purposes) is not determined until the performance goals are established. Our PSUs have three one-year performance periods with performance goals established in the first quarter of each year of the three-year performance period. As a result of this structure, the share price used to determine grant date fair value on the performance goal approval date can vary significantly from the share price on the date used previously to determine the number of shares.
The PSUs have both (i) time-based vesting conditions and time vest at the end of three years based on continued employment and (ii) performance-based vesting conditions and performance vest based on achievement against the revenue and Adjusted EBITDA margin goals measured over three one-year performance periods. The RSUs have time-based vesting conditions and will vest in equal quarterly installments over three years. Please see the “Outstanding Equity Awards at Fiscal Year-End Table” below for more information regarding the vesting schedule of each grant to our NEOs during Fiscal 2023.
For the PSUs granted in Fiscal 2023, the Committee established a one-year performance goal at the beginning of year one (Fiscal 2023) and will establish subsequent, one-year performance goals at the beginning of year two (fiscal year 2024) and year three (fiscal year 2025). Each of the three, one-year goals applies to one-third of the total PSUs awarded. Depending on the Company’s performance, between 0% and 200% of the target number of PSUs can be earned. The Committee believes that granting a balance of RSUs and PSUs appropriately aligns our NEOs’ compensation with the achievement of the Company’s strategic goals and long-term stockholder value creation. The Fiscal 2023 performance goals for purposes of determining the number of PSUs earned for the first third of the Fiscal 2023 awards were the same as the financial goals under the annual incentive plan as disclosed above. Profitable growth is a key driver to creating stockholder value, and the Committee believes it is important to tie a portion of our long-term incentive to these metrics. As discussed above, achievement against the financial metrics for Fiscal 2023 was slightly above threshold performance for both revenue and Adjusted EBITDA margin. As a result, 16.8% of the target number of PSUs was earned for the first third of the Fiscal 2023 awards (except for Mr. Siegel’s award, which was not earned because he forfeited his unvested awards upon his termination of employment). The PSU achievement differs from the annual cash incentive plan achievement since PSU achievement does not include DEI objectives as a performance metric.
Mr. Spence previously received a PSU grant in Fiscal 2021 and all NEOs (except Mr. Millington) received a PSU grant in Fiscal 2022, and all NEOs (except Mr. Lazarus) received a PSU grant in Fiscal 2023, with each grant including a one-year performance goal covering Fiscal 2023 performance. The performance goals for these grants were the same as the annual incentive plan goals disclosed above (other than the DEI objective metric). As a result, 16.8% of the target number of PSUs were earned for the portion of Fiscal 2021, Fiscal 2022 and Fiscal 2023 awards covering Fiscal 2023 performance for Mr. Spence and the portion of Fiscal 2022 awards covering Fiscal 2023 performance for Mr. Lazarus and Mr. Bouvat-Merlin, and
51
a portion of the Fiscal 2023 awards covering Fiscal 2023 performance for all other NEOs (except Mr. Lazarus and Mr. Siegel (his award was not earned because he forfeited his unvested awards upon his termination of employment)).
The chart below outlines the level of achievement of performance goals for completed one-year performance periods for outstanding PSUs:
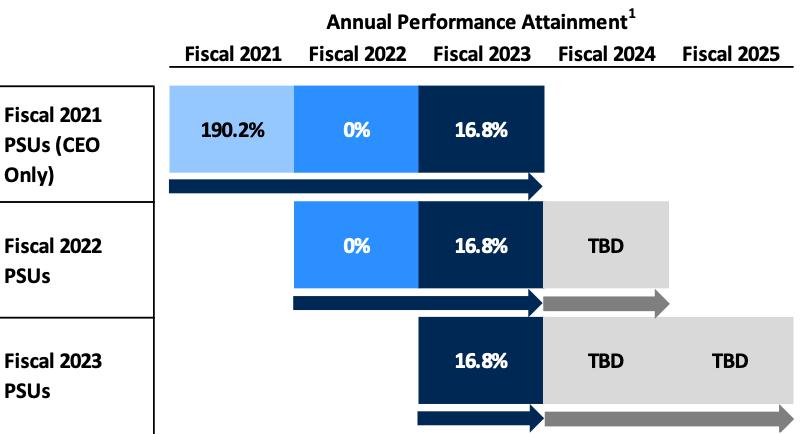
1 Attainment = (50% * Revenue Achievement) + (50% * Adjusted EBITDA Margin Achievement) for Fiscal 2023 or Adjusted EBITDA Achievement for Fiscal 2022 and Fiscal 2021).
The table below outlines the total value of the annual PSU awards the NEOs earned in Fiscal 2023 and the corresponding number of shares. The actual value of the shares delivered will depend on our stock price on the date that the PSUs vest based on continued employment (at the end of the three-year vesting period):
|
|
|
|
|
Name |
Target Value of PSUs ($) |
Target Number of PSUs (#) |
Fiscal 2023 Attainment (%) |
Earned Number of PSUs (#) |
Patrick Spence (1/3 of Fiscal Year 2021 PSU Award) |
461,786 |
26,942 |
16.80% |
4,526 |
Patrick Spence (1/3 of Fiscal Year 2022 PSU Award) |
428,157 |
24,980 |
16.80% |
4,197 |
Patrick Spence (1/3 of Fiscal Year 2023 PSU Award) |
919,732 |
53,660 |
16.80% |
9,015 |
Edward Lazarus (1/3 of Fiscal Year 2022 PSU Award) |
160,139 |
9,343 |
16.80% |
1,570 |
Maxime Bouvat-Merlin (1/3 of Fiscal Year 2022 PSU Award) |
145,570 |
8,493 |
16.80% |
1,427 |
Maxime Bouvat-Merlin (1/3 of Fiscal Year 2023 PSU Award) |
312,702 |
18,244 |
16.80% |
3,065 |
52
|
|
|
|
|
Nicholas Millington (1/3 of Fiscal Year 2023 PSU Award) |
275,920 |
16,098 |
16.80% |
2,704 |
Shamayne Braman (1/3 of Fiscal Year 2023 PSU Award) |
183,946 |
10,732 |
16.80% |
1,803 |
The future tranches of the PSU awards are not considered granted for accounting purposes until the performance goals associated with such awards are established. The grants will be reflected in future years in the “Summary Compensation Table”, and the “Grants of Plan-Based Awards Table” once the performance goals are established, with their value based on the share price at the time the goals are set, rather than at the time of grant.
Benefits and Perquisites
We provide all our employees, including our NEOs, with broad-based employee benefits that are intended to attract and retain employees while providing them with health and welfare benefits, including medical, dental, vision, life and disability insurance coverage, and the ability for eligible employees to participate in our 401(k) plan. We also maintain a relocation program available to eligible employees that is consistent with current practices among publicly traded companies as part of our efforts to attract and retain key talent. Our relocation program includes payments to put employees who relocate in connection with their employment with Sonos in a tax neutral position. We also provide discounts on our products to all employees.
Hedging and Pledging Policy
Under the terms of our insider trading policy, employees, contractors, consultants and members of our Board (and their respective family members and any affiliated entities, such as venture capital funds) may not engage in hedging or monetization transactions involving Sonos securities, such as zero-cost collars and forward sale contracts, or engage in short sales of Sonos securities, including short sales “against the box.” In addition, such persons may not hold Sonos securities in a margin account or pledge Sonos securities as collateral for a loan unless the pledge has been approved by our Compliance Officer. No such pledges were approved during Fiscal 2023.
Our Compensation-Setting Process
Role of the Compensation, People and Diversity & Inclusion Committee
The Committee works closely with its independent compensation consultant (currently, Semler Brossy Consulting Group, LLC (“Semler Brossy”) described below) and meets regularly, including in executive sessions without members of management present, to make decisions on our executive compensation program with respect to the compensation of our CEO and other executives. The Committee reviews a variety of market data and information, including technology industry compensation information, with the Radford technology survey described above as a primary source, and considers the recommendations of its independent consultant when making compensation decisions. The Committee Chair reports the actions of the Committee to our Board at each regular meeting of the Board. The Committee’s responsibilities include, among other things, reviewing and approving (or making recommendations to the Board, as applicable, regarding):
53
●Overall compensation strategy;
●Amounts and form of executive compensation, including base salary, incentive compensation and equity-based compensation;
●Goals and objectives to be considered in determining the compensation of our CEO and other executive officers;
●Annual and long-term incentive plans and benefit plans;
●Annual proxy disclosure, including CD&A disclosure;
●Evaluation of market compensation; and
●Diversity & inclusion policies and practices.
Role of the Independent Compensation Consultant
The Committee has retained Semler Brossy as its independent compensation consultant. Semler Brossy is retained by and reports directly to the Committee. The Committee has analyzed whether the work of Semler Brossy as a compensation consultant raises any conflict of interest and has determined that the work of Semler Brossy has not created any conflict of interest.
Semler Brossy reviews and advises on all principal aspects of our executive compensation program. Its main responsibilities include, as applicable to a particular fiscal year:
●Providing independent advice to the Committee on current trends and best practices in compensation design and program alternatives, and advising on plans or practices that may improve the effectiveness of our compensation program;
●Providing and discussing market comparators for competitive comparisons and based on this information, offering independent recommendations on NEO compensation, including our CEO and newly hired executives;
●Reviewing the Company’s equity plan and providing an assessment of total stock usage relative to market comparators;
●Reviewing the CD&A and other compensation-related disclosures in our proxy statement;
●Offering recommendations, insights, and perspectives on compensation-related matters;
●Assisting the Committee in designing executive compensation programs that are competitive and align the interests of our executives with those of our stockholders; and
●Providing the Committee with ongoing updates regarding trends and regulatory developments in the areas of executive compensation and human capital management.
The Committee typically asks Semler Brossy to attend the Committee’s meetings. Semler Brossy communicates regularly with management to gather information and review proposals.
Role of Management
Our CEO and our other executive officers do not set their own compensation, nor are they present when the Committee sets their specific individual compensation. Our CEO provides his evaluation of each executive officer’s performance to the Committee, and makes recommendations with respect to base salary, target annual incentives, and equity awards for each executive officer other than himself. Our CEO’s recommendation is considered by the Committee, which makes its own ultimate determinations.
The human resources department provides additional analysis and guidance as requested by the Committee related to NEO compensation, including the following:
54
●Developing, summarizing and presenting information and analyses to enable the Committee to execute its responsibilities, as well as addressing specific requests for information from the Committee;
●Attending Committee meetings, as requested, to provide information, respond to questions and otherwise assist the Committee; and
●Assisting the CEO in making preliminary recommendations regarding base salary and annual and long-term incentive awards.
Executive and Director Stock Ownership Guidelines Policy
The Committee has adopted Stock Ownership Guidelines for executive officers and non-employee directors of the Company. In general, each executive officer and director has five years from the date of appointment to accumulate the expected number of shares. In addition, each executive officer and director is required to retain 50% of any after-tax shares received from the vesting of awards or the exercise of stock options until his or her ownership guideline is met. The purpose of the guidelines is to encourage our executive officers and directors to own and retain Company shares, thereby further aligning their interests with our stockholders.
We review our stock ownership guidelines on a periodic basis. Given the intentional structure of our compensation program, which continues to emphasize equity-based long-term incentive awards as a primary incentive vehicle, we have established guidelines that are generally higher than typical market practices.
The table below describes the current ownership guidelines for our NEOs and non-employee directors. As of the Record Date, each of our NEOs and directors has either met his or her stock ownership guideline goal or is on track to meet this goal within the prescribed five-year time frame. In addition to shares held outright by the director or executive officer, vested but unexercised stock options and unvested RSUs count towards expected ownership levels.
Stock Ownership Guideline
|
|
Role |
Multiple of Salary or Cash Retainer |
CEO |
10x |
Other NEOs |
5x |
Non-Employee Director |
5x |
Clawback Policy
We adopted a clawback policy as required by the final Dodd-Frank rules and exchange listing standards. Our policy requires recoupment of excess incentive compensation paid to our executive officers if amounts were based on material noncompliance with any financial reporting requirement that causes an accounting restatement, without regard to any fault or misconduct.
55
Employment, Severance and Change in Control Agreements
We have entered into offer letters with each of our NEOs. Each of these arrangements provides for at-will employment and generally includes the NEO’s initial base salary and an indication of eligibility for an annual cash incentive award opportunity and for the grant of an initial equity award. In addition, each of our NEOs has executed a form of our standard confidential information and invention assignment agreement.
Each of the stock options, PSU awards and RSU awards granted to our NEOs under our 2018 Plan, including in Fiscal 2023, contains a provision for the full acceleration of vesting upon an involuntary termination occurring within two months prior to, or within 12 months following, a change in control. In connection with a change in control, PSUs will vest at target for any PSUs for which the performance period has not been completed and based on the number of PSUs that have been earned by their terms for any performance period that has been completed. If an acquirer in a change in control transaction does not assume the PSUs, they will vest in connection with such transaction. Such benefits are intended to incentivize executives who might be involved in acquisition or merger discussions with another entity to make decisions that are in the best interest of Sonos and our stockholders, without being unduly biased by the impact of such a transaction on their personal situation.
Tax Deductibility
Section 162(m) of the Internal Revenue Code generally sets a limit of $1 million on the amount of compensation that Sonos may deduct for federal income tax purposes in any given year with respect to the compensation of certain executives, including each of the NEOs.
The Committee retains the discretion to award and pay compensation that is not deductible as it believes that it is in the best interests of our stockholders to maintain flexibility in our approach to executive compensation and to structure a program that we consider to be the most effective in attracting, motivating and retaining key executives, without regard to the deductibility of compensation under it.
Compensation Programs Risk Assessment
Management of the Company and the Committee have assessed the Company’s compensation programs and have concluded that there are no risks arising from the Company’s compensation policies and practices that are reasonably likely to have a material adverse effect on the Company. This assessment was overseen by our Committee in consultation with its independent compensation consultant. This assessment considered, among other factors:
●Our compensation policies and practices in effect for our executive officers, senior management, and broader employee population (e.g., performance metrics, pay mix, stock ownership guidelines);
●Features built into our compensation programs to discourage excessive risk-taking (e.g., maximum payout caps); and
●The Committee’s approval of all annual cash incentive programs and performance-based equity award goals and metrics, and the Committee’s certification of performance achievement.
Our performance-based executive compensation program, as described more fully in the “Compensation Discussion and Analysis” section, coupled with our stock ownership guidelines and governance provisions, aligns the interests of our executive
56
officers with those of our stockholders by encouraging long-term superior performance without encouraging excessive or unnecessary risk-taking.
Report of the Compensation, People and Diversity & Inclusion Committee
Our Compensation, People and Diversity & Inclusion Committee has reviewed and discussed the foregoing Compensation Discussion and Analysis as required by Item 402(b) of Regulation S-K with management and based on such review and discussion, such committee has recommended to our Board of Directors that the Compensation Discussion and Analysis be incorporated by reference in annual report on Form 10-K for the fiscal year ended September 30, 2023 and this Proxy Statement.
Submitted by the Compensation, People and Diversity & Inclusion Committee
Thomas Conrad, Chair
Karen Boone
Joanna Coles
57
Summary Compensation Table
The following table provides information concerning the compensation of each of our named executive officers for each fiscal year in which they were a named executive officer during the last three fiscal years:
|
|
|
|
|
|
|
|
|
|
|
|
|
|
|
Fiscal Year |
|
Salary ($) |
|
Stock Awards ($) (1) |
|
Non-Equity Incentive Plan Compensation ($) (2) |
|
All Other Compensation ($)(3) |
|
Total ($) |
Patrick Spence |
|
2023 |
|
550,000 |
|
4,568,856 |
|
71,858 |
|
— |
|
5,190,714 |
Chief Executive Officer |
|
2022 |
|
550,000 |
|
7,837,371 |
|
24,578 |
|
— |
|
8,411,949 |
|
|
2021 |
|
523,346(4) |
|
4,959,209 |
|
— |
|
— |
|
5,482,555 |
Edward Lazarus (5) |
|
2023 |
|
475,000 |
|
160,139 |
|
62,059 |
|
9,900 |
|
707,098 |
Former Chief Financial Officer |
|
2022 |
|
383,462 |
|
4,526,500 |
|
17,136 |
|
7,789 |
|
4,934,887 |
Chief Legal and Strategy Officer & Corporate Secretary |
|
2021 |
|
375,000 |
|
591,074 |
|
392,288 |
|
8,168 |
|
1,366,530 |
Maxime Bouvat-Merlin (6) Chief Product Officer |
|
2023 |
|
461,539 |
|
1,816,034 |
|
55,448 |
|
6,894 |
|
2,339,915 |
Nicholas Millington |
|
2023 |
|
450,000 |
|
1,103,679 |
|
58,793 |
|
9,846 |
|
1,622,318 |
Chief Innovation Officer |
|
2022 |
|
375,000 |
|
544,187 |
|
16,758 |
|
8,654 |
|
944,599 |
|
|
2021 |
|
375,000 |
|
752,271 |
|
392,288 |
|
8,380 |
|
1,527,939 |
Shamayne Braman (7) Chief People Officer |
|
2023 |
|
400,000 |
|
735,786 |
|
52,260 |
|
7,017 |
|
1,195,063 |
Matthew Siegel (8) |
|
2023 |
|
182,692 |
|
1,314,261 |
|
— |
|
1,827 |
|
1,498,780 |
Former Chief Commercial Officer |
|
2022 |
|
450,000 |
|
1,044,542 |
|
20,109 |
|
8,317 |
|
1,522,968 |
|
|
2021 |
|
400,000 |
|
752,271 |
|
418,440 |
|
11,270 |
|
1,581,981 |
(1)Reflects the aggregate grant date fair value of (a) the RSU awards granted under our 2018 Plan to our named executive officers during the fiscal years ended September 30, 2023 (other than Mr. Lazarus), October 1, 2022, and October 2, 2021 and (b) PSU awards granted to Mr. Spence during the fiscal year ended September 30, 2023, October 1, 2022 and October 2, 2021 and to our other named executive officers during the fiscal year ended September 30, 2023 and October 1, 2022, as further described below and all as computed in accordance with ASC 718, excluding the effect of estimated forfeitures. For PSU awards, the grant date fair value is based upon the probable outcome of the performance conditions associated with the awards, which assumes that target performance is achieved. PSU awards have a three-year vesting term generally based on continued employment, with three, one-year performance periods or tranches. The value of PSU awards is included in the Summary Compensation Table in the year when the applicable performance goals are set and the fair value of the PSUs is determinable under ASC 718 (and is determined based on the Company's closing stock price on the trading day immediately preceding such date). The 2023 amount for Mr. Spence includes one-third of his PSU award granted in Fiscal 2023, one-third of his PSU award granted in Fiscal 2022 and one-third of his PSU award granted in Fiscal 2021. The 2023 amount for Mr. Lazarus includes one-third of his PSU award granted in Fiscal 2022. The 2023 amounts for Mr. Bouvat-Merlin and Mr. Siegel include one-third of their PSU awards granted in Fiscal 2023 and one-third of their PSU awards granted in Fiscal 2022. The 2023 amounts for Ms. Braman, and Mr. Millington include one-third of their PSU awards granted in Fiscal 2023. All PSU awards are tranches of the awards for which performance goals were set in December 2022 (Fiscal 2023) for the Fiscal 2023 performance period. The grants to Mr. Siegel were forfeited in connection with his departure. The grant date fair value of the Fiscal 2023 PSU awards assuming maximum achievement of the performance
58
conditions associated with the awards is: Mr. Spence, $3,619,351; Mr. Lazarus, $320,278; Mr. Bouvat-Merlin, $916,544; Mr. Millington, $551,839; Ms. Braman, $367,893; and Mr. Siegel, $862,622. Additional information regarding the assumptions used in calculating the dollar amount recognized for financial statement reporting purposes of the equity awards reported in this column is set forth in Note 2 to our audited consolidated financial statements included in our Annual Report.
(2)These amounts reflect bonuses earned by our named executive officers based upon achievement of financial objectives and, for Fiscal 2022 and Fiscal 2023, DEI goals. For more information on bonuses for Fiscal 2023, see “—Fiscal 2023 NEO Compensation Decisions” above.
(3)These amounts reflect matching contributions made by us under our 401(k) plan.
(4)In June 2020, in connection with uncertainty and challenges stemming from the COVID-19 pandemic and as part of a restructuring plan, our Board approved a temporary twenty percent (20%) reduction in the base salaries for all executive officers. These reductions applied for the period from July 1, 2020 to December 31, 2020 for Mr. Spence and July 1, 2020 to September 30, 2020 for the other NEOs.
(5)Mr. Lazarus served as Interim Chief Financial Officer from September 1, 2022 to November 14, 2022 and as Chief Financial Officer from November 15, 2022 to January 21, 2024. Mr. Lazarus remained our Chief Legal Officer and Corporate Secretary during such periods and currently serves in such roles. Effective January 22, 2024, Mr. Lazarus was also appointed as our Chief Strategy Officer. Saori Casey has served as our Chief Financial Officer since January 22, 2024. See “Executive Officers” for further information.
(6)Mr. Bouvat-Merlin was appointed as Chief Product Officer effective April 17, 2023 and as an executive officer of the Company, effective May 3, 2023. In connection with his appointment as Chief Product Officer, effective April 17, 2023, his base salary was increased by $25,000 annually, and his target bonus increased from 55% to 65% of base salary.
(7)Ms. Braman was appointed as Chief People Officer in June 2022 and as an executive officer of the Company effective January 11, 2023.
(8)Mr. Siegel resigned as Chief Commercial Officer effective February 17, 2023.
59
Grants of Plan-Based Awards in Fiscal 2023 Table
The following table presents information concerning each grant of an award made to the named executive officers during the fiscal year ended September 30, 2023 under any cash or equity incentive plan.
|
|
|
|
|
|
|
|
|
|
|
|
|
|
|
|
|
|
|
|
|
|
|
|
|
|
|
|
|
|
|
Estimated Future Payouts Under Non-Equity Incentive Plan Awards(2) |
|
Estimated Future Payouts Under Equity Incentive Plan Awards |
|
|
|
|
Name |
|
Type of Award |
|
Grant Date (1) |
|
Approval Date |
|
Threshold ($) |
|
Target ($) |
|
Maximum ($) |
|
Threshold (#) |
|
Target (#) |
|
Maximum (#) |
|
All Other Stock Awards: Number of Shares of Stock or Units (#) |
|
Grant Date Fair Value of Stock and Option Awards ($) (8) |
Patrick Spence |
|
Cash |
|
— |
|
— |
|
— |
|
357,500 |
|
697,125 |
|
— |
|
— |
|
— |
|
— |
|
— |
|
|
RSUs(3) |
|
11/15/2022 |
|
11/14/2022 |
|
— |
|
— |
|
— |
|
— |
|
— |
|
— |
|
160,979 |
|
2,759,180 |
|
|
PSUs(4) |
|
12/19/2022 |
|
11/15/2020 |
|
— |
|
— |
|
— |
|
6,736 |
|
26,942 |
|
53,884 |
|
— |
|
461,786 |
|
|
PSUs(5) |
|
12/19/2022 |
|
11/15/2021 |
|
— |
|
— |
|
— |
|
6,245 |
|
24,980 |
|
49,960 |
|
— |
|
428,157 |
|
|
PSUs(6) |
|
12/19/2022 |
|
11/15/2022 |
|
|
|
|
|
|
|
13,415 |
|
53,660 |
|
107,320 |
|
— |
|
919,732 |
Edward Lazarus |
|
Cash |
|
— |
|
— |
|
— |
|
308,750 |
|
602,063 |
|
— |
|
— |
|
— |
|
— |
|
— |
|
|
PSUs(5) |
|
12/19/2022 |
|
11/15/2021 |
|
— |
|
— |
|
— |
|
2,336 |
|
9,343 |
|
18,686 |
|
— |
|
160,139 |
Maxime Bouvat- Merlin |
|
Cash |
|
— |
|
— |
|
— |
|
275,816 |
|
537,841 |
|
— |
|
— |
|
— |
|
— |
|
— |
|
|
RSUs(3) |
|
11/15/2022 |
|
11/14/2022 |
|
— |
|
— |
|
— |
|
— |
|
— |
|
— |
|
54,733 |
|
938,124 |
|
|
RSUs(7) |
|
5/16/2023 |
|
5/16/2023 |
|
— |
|
— |
|
— |
|
— |
|
— |
|
— |
|
24,483 |
|
419,639 |
|
|
PSUs(5) |
|
12/19/2022 |
|
11/15/2021 |
|
— |
|
— |
|
— |
|
2,123 |
|
8,493 |
|
16,986 |
|
— |
|
145,570 |
|
|
PSUs(6) |
|
12/19/2022 |
|
11/15/2022 |
|
— |
|
— |
|
— |
|
4,561 |
|
18,244 |
|
36,488 |
|
— |
|
312,702 |
Nicholas Millington |
|
Cash |
|
— |
|
— |
|
— |
|
292,500 |
|
570,375 |
|
— |
|
— |
|
— |
|
— |
|
— |
|
|
RSUs(3) |
|
11/15/2022 |
|
11/14/2022 |
|
— |
|
— |
|
— |
|
— |
|
— |
|
— |
|
48,294 |
|
827,759 |
|
|
PSUs(6) |
|
12/19/2022 |
|
11/15/2022 |
|
— |
|
— |
|
— |
|
4,025 |
|
16,098 |
|
32,196 |
|
— |
|
275,920 |
Shamayne Braman |
|
Cash |
|
— |
|
— |
|
— |
|
260,000 |
|
507,000 |
|
— |
|
— |
|
— |
|
— |
|
— |
|
|
RSUs(3) |
|
11/15/2022 |
|
11/14/2022 |
|
— |
|
— |
|
— |
|
— |
|
— |
|
— |
|
32,196 |
|
551,839 |
|
|
PSUs(6) |
|
12/19/2022 |
|
11/15/2022 |
|
— |
|
— |
|
— |
|
2,683 |
|
10,732 |
|
21,464 |
|
— |
|
183,946 |
Matthew Siegel |
|
Cash |
|
— |
|
— |
|
— |
|
118,750 |
|
231,562 |
|
— |
|
— |
|
— |
|
— |
|
— |
|
|
RSUs(3) |
|
11/15/2022 |
|
11/14/2022 |
|
— |
|
— |
|
— |
|
— |
|
— |
|
— |
|
51,514 |
|
882,950 |
|
|
PSUs(5) |
|
12/19/2022 |
|
11/15/2021 |
|
— |
|
— |
|
— |
|
1,998 |
|
7,993 |
|
15,986 |
|
— |
|
137,000 |
|
|
PSUs(6) |
|
12/19/2022 |
|
11/15/2022 |
|
— |
|
— |
|
— |
|
4,293 |
|
17,171 |
|
34,342 |
|
— |
|
294,311 |
(1)For PSUs, the "grant date" is the date that the performance goals associated with the PSU awards were set by the CPD&I Committee, which is the date the fair values of such awards are determinable under ASC 718.
(2)Reflects threshold, target and maximum bonus amounts for Fiscal 2023 performance under our Annual Cash Incentive Plan, as described in “—Fiscal 2023 NEO Compensation Decisions — Annual Cash Incentive Plan” above. Amounts actually received by the named executive officer are reported in the “Non-Equity Incentive Plan Compensation” column of the Summary Compensation Table.
(3)The shares subject to the RSU grant will vest in equal quarterly installments over three years following the vesting commencement date of November 15, 2022, generally subject to continued employment. The grants to Mr. Siegel were forfeited in connection with his departure.
60
(4)The amounts shown include one-third of the PSU grant granted in Fiscal 2021, which represents the tranche of the award for which performance goals were set in December 2022 (Fiscal 2023) for the Fiscal 2023 performance period, with the threshold, target and maximum columns reflecting the number of PSUs that can be earned based upon achievement of the pre-established Company performance goal for Fiscal 2023 at 25%, 50% and 200% of target, respectively. As discussed in “—Fiscal 2023 Equity-Based Awards” above, the CPD&I Committee determined achievement of the Fiscal 2023 performance goals at 16.8%. PSU awards have a three-year vesting term generally based on continued employment, and, to the extent earned, will vest upon CPD&I Committee approval of performance attainment at the end of the three-year term.
(5)The amounts shown include one-third of the PSU grant granted in Fiscal 2022, which represents the tranche of the award for which performance goals were set in December 2022 (Fiscal 2023) for the Fiscal 2023 performance period, with the threshold, target and maximum columns reflecting the number of PSUs that can be earned based upon achievement of the pre-established Company performance goal for Fiscal 2023 at 25%, 50% and 200% of target, respectively. As discussed in “—Fiscal 2023 Equity-Based Awards” above, the CPD&I Committee determined achievement of the Fiscal 2023 performance goals at 16.8%. PSU awards have a three-year vesting term generally based on continued employment, and, to the extent earned, will vest upon CPD&I Committee approval of performance attainment at the end of the three-year term. The grants to Mr. Siegel were forfeited in connection with his departure.
(6)The amounts shown include one-third of the PSU grant granted in Fiscal 2023, which represents the tranche of the award for which performance goals were set in December 2022 (Fiscal 2023) for the Fiscal 2023 performance period, with the threshold, target and maximum columns reflecting the number of PSUs that can be earned based upon achievement of the pre-established Company performance goal for Fiscal 2023 at 25%, 50% and 200% of target, respectively. As discussed in “—Fiscal 2023 Equity-Based Awards” above, the CPD&I Committee determined achievement of the Fiscal 2023 performance goals at 16.8%. PSU awards have a three-year vesting term generally based on continued employment, and, to the extent earned, will vest upon CPD&I Committee approval of performance attainment at the end of the three-year term. The grants to Mr. Siegel were forfeited in connection with his departure.
(7)The shares subject to the RSU grant will vest in equal quarterly installments over three years following the vesting commencement date of May 16, 2023, generally subject to continued employment.
(8)Reflects the aggregate grant date fair value of the awards granted under our 2018 Plan to our named executive officers during the fiscal year ended September 30, 2023, as computed in accordance with ASC 718. The assumptions used in calculating the dollar amount recognized for financial statement reporting purposes of the equity awards reported in this column are set forth in Note 2 to our audited consolidated financial statements included in our Annual Report. See footnote (1) to the Summary Compensation Table.
61
Outstanding Equity Awards at Fiscal Year-End Table
The following table provides information regarding the outstanding equity awards held by our named executive officers as of September 30, 2023.
|
|
|
|
|
|
|
|
|
|
|
|
|
|
|
|
|
|
|
|
|
|
|
Option Awards |
|
Stock Awards |
Name |
|
Grant Date (1) |
|
Number of Securities Underlying Unexercised Options (#) Exercisable |
|
Number of Securities Underlying Unexercised Options (#) Unexercisable |
|
Option Exercise Price ($) |
|
Option Expiration Date |
|
Number of Shares or Units of Stock That Have Not Vested (#) |
|
Market Value of Shares or Units of Stock That Have Not Vested ($)(19) |
|
Equity Incentive Plan Awards: Number of unearned shares, units or other rights that have not vested (#) |
|
Equity Incentive Plan Awards: Market or Payout value of unearned shares, units or other rights that have not vested ($) (21) |
Patrick Spence |
|
9/8/2016 (2) |
|
10 |
|
— |
|
13.56 |
|
9/7/2026 |
|
— |
|
— |
|
— |
|
— |
|
|
11/7/2017 (2) |
|
151,736 |
|
— |
|
15.03 |
|
11/6/2027 |
|
— |
|
— |
|
— |
|
— |
|
|
8/1/2018 (2) |
|
200,000 |
|
— |
|
15.00 |
|
7/31/2028 |
|
— |
|
— |
|
— |
|
— |
|
|
11/19/2018 (2) |
|
874,999 |
|
— |
|
15.44 |
|
11/18/2028 |
|
— |
|
— |
|
— |
|
— |
|
|
5/15/2020 |
|
— |
|
— |
|
— |
|
— |
|
49,343 (3) |
|
637,018 |
|
0 |
|
0 |
|
|
11/15/2020 |
|
— |
|
— |
|
— |
|
— |
|
81,029 (4) |
|
1,046,084 |
|
0 |
|
0 |
|
|
11/15/2021 |
|
— |
|
— |
|
— |
|
— |
|
32,299 (5) |
|
416,980 |
|
24,979 (6) |
|
322,479 |
|
|
11/15/2022 |
|
— |
|
— |
|
— |
|
— |
|
129,749(7) |
|
1,675,060 |
|
107,319 (8) |
|
1,385,488 |
Edward Lazarus |
|
2/15/2019 (2) |
|
200,000 |
|
— |
|
11.12 |
|
2/14/2029 |
|
— |
|
— |
|
— |
|
— |
|
|
5/15/2020 |
|
— |
|
— |
|
— |
|
— |
|
21,711 (9) |
|
280,289 |
|
0 |
|
0 |
|
|
11/15/2020 |
|
— |
|
— |
|
— |
|
— |
|
11,114 (10) |
|
143,482 |
|
0 |
|
0 |
|
|
11/15/2021 |
|
— |
|
— |
|
— |
|
— |
|
12,081 (11) |
|
155,966 |
|
9,342 (6) |
|
120,605 |
|
|
9/1/2022 |
|
— |
|
— |
|
— |
|
— |
|
109,898(12) |
|
1,418,783 |
|
0 |
|
0 |
Maxime Bouvat- Merlin |
|
8/25/2016 (2) |
|
52,950 |
|
— |
|
13.56 |
|
8/24/2026 |
|
— |
|
— |
|
— |
|
— |
|
|
5/22/2017 (2) |
|
22,328 |
|
— |
|
13.56 |
|
5/21/2027 |
|
— |
|
— |
|
— |
|
— |
|
|
5/25/2018 (2) |
|
48,124 |
|
— |
|
15.11 |
|
5/24/2028 |
|
— |
|
— |
|
— |
|
— |
|
|
8/1/2018 (2) |
|
28,000 |
|
— |
|
15.00 |
|
7/31/2028 |
|
— |
|
— |
|
— |
|
— |
|
|
5/15/2020 |
|
— |
|
— |
|
— |
|
— |
|
6,375 (9) |
|
82,301 |
|
0 |
|
0 |
|
|
11/15/2020 |
|
— |
|
— |
|
— |
|
— |
|
15,712 (10) |
|
202,842 |
|
0 |
|
0 |
|
|
11/15/2021 |
|
— |
|
— |
|
— |
|
— |
|
10,983 (13) |
|
141,791 |
|
8,493 (6) |
|
109,645 |
|
|
11/15/2022 |
|
— |
|
— |
|
— |
|
— |
|
44,115 (14) |
|
569,525 |
|
36,489 (8) |
|
471,073 |
|
|
5/15/2023 |
|
— |
|
— |
|
— |
|
— |
|
22,443 (15) |
|
289,739 |
|
0 |
|
0 |
Nicholas Millington |
|
8/1/2014 (2) |
|
7,730 |
|
— |
|
11.28 |
|
7/31/2024 |
|
— |
|
— |
|
— |
|
— |
|
|
7/7/2016 (2) |
|
156,842 |
|
— |
|
13.56 |
|
7/6/2026 |
|
— |
|
— |
|
— |
|
— |
|
|
9/8/2016 (2) |
|
193,642 |
|
— |
|
13.56 |
|
9/7/2026 |
|
— |
|
— |
|
— |
|
— |
|
|
11/14/2016 (2) |
|
19,948 |
|
— |
|
13.56 |
|
8/11/2025 |
|
— |
|
— |
|
— |
|
— |
|
|
5/22/2017 (2) |
|
50,000 |
|
— |
|
13.56 |
|
5/21/2027 |
|
— |
|
— |
|
— |
|
— |
|
|
5/25/2018 (2) |
|
64,000 |
|
— |
|
15.11 |
|
5/24/2028 |
|
— |
|
— |
|
— |
|
— |
|
|
8/1/2018 (2) |
|
43,000 |
|
— |
|
15.00 |
|
7/31/2028 |
|
— |
|
— |
|
— |
|
— |
62
|
|
|
|
|
|
|
|
|
|
|
|
|
|
|
|
|
|
|
|
|
5/15/2020 |
|
— |
|
— |
|
— |
|
— |
|
27,632 (9) |
|
356,729 |
|
0 |
|
0 |
|
|
11/15/2020 |
|
— |
|
— |
|
— |
|
— |
|
14,145 (10) |
|
182,612 |
|
0 |
|
0 |
|
|
11/15/2022 |
|
— |
|
— |
|
— |
|
— |
|
38,924 (16) |
|
502,509 |
|
32,196 (8) |
|
415,650 |
Shamayne Braman |
|
11/15/2021 |
|
— |
|
— |
|
— |
|
— |
|
10,960 (17) |
|
141,494 |
|
0 |
|
0 |
|
|
2/15/2022 |
|
— |
|
— |
|
— |
|
— |
|
15,935 (18) |
|
205,721 |
|
0 |
|
0 |
|
|
11/15/2022 |
|
— |
|
— |
|
— |
|
— |
|
25,950 (19) |
|
335,015 |
|
21,464 (8) |
|
277,100 |
Matthew Siegel (20) |
|
— |
|
— |
|
— |
|
— |
|
— |
|
— |
|
— |
|
— |
|
— |
(1)All of the outstanding stock option awards were granted under our 2003 Plan, except for those with a grant date of August 1, 2018, November 19, 2018 and February 15, 2019, which were granted under our 2018 Plan.
(2)The options were fully vested and immediately exercisable as of September 30, 2023.
(3)1/16th of the shares subject to the RSU grant vested on August 15, 2020 and an additional 1/16th vests quarterly thereafter, generally subject to continued employment.
(4)Consists of (i) a grant of 80,827 RSUs, with 1/16th of the shares subject to the RSU grant vested on February 15, 2021 and an additional 1/16 vesting quarterly thereafter, and generally subject to continued employment, (ii) 51,244 shares earned under a PSU award based on the achievement of the pre-established Company performance goals for Fiscal 2021 at 190.2%, as determined by the CPD&I Committee, (iii) 0 shares earned under a PSU award based on the achievement of the pre-established Company performance goals for Fiscal 2022 at 0.00%, as determined by the CPD&I Committee, and (iv) 4,526 shares earned under a PSU award based on achievement of the pre-established Company performance goals for Fiscal 2023 at 16.8%, as determined by the CPD&I Committee. PSU awards have a three-year vesting term generally based on continued employment, and, to the extent earned, will vest upon CPD&I Committee approval of performance attainment at the end of the three-year term.
(5)Consists of (i) a grant of 74,938 RSUs, vesting according to the following schedule: 6.25% of the shares subject to the RSU grant will vest quarterly in year one; 12.5% of the shares subject to the RSU will vest quarterly in year two; and 6.25% of the shares subject to the RSU grant will vest quarterly in year three, following the vesting commencement date of November 15, 2021 and generally subject to continued employment, (ii) 0 shares earned under a PSU award based on the achievement of the pre-established Company performance goals for Fiscal 2022 at 0.00%, as determined by the CPD&I Committee, and (iii) 4,197 shares earned under a PSU award based on the achievement of the pre-established Company performance goals for Fiscal 2023 at 16.8%, as determined by the CPD&I Committee. PSU awards have a three-year vesting term generally based on continued employment, and, to the extent earned, will vest upon CPD&I Committee approval of performance attainment at the end of the three-year term.
(6)Consists of the target number of PSUs that may be earned based upon the achievement of pre-determined performance goals for Fiscal 2024, for which performance goals have not been set as of September 30, 2023. PSU awards have a three-year vesting term generally based upon continued employment, and, to the extent earned, will vest upon CPD&I Committee approval of performance attainment at the end of the three-year term. This PSU award is not shown in the Fiscal 2023 Summary Compensation Table because the performance goals associated with it were not established in Fiscal 2023.
(7)Consists of (i) a grant of 160,979 RSUs, with 1/12th of the shares subject to the RSU grant vested on February 15, 2023 and an additional 1/12 vesting quarterly thereafter, and generally subject to continued employment, and (ii) 9,015 shares earned under a PSU award based on the achievement of the pre-established Company performance goals for Fiscal 2023 at 16.8%, as determined by the CPD&I Committee. PSU awards have a three-year vesting term generally based on continued employment, and, to the extent earned, will vest upon CPD&I Committee approval of performance attainment at the end of the three-year term.
(8)Consists of the target number of PSUs that may be earned based upon the achievement of pre-determined performance goals for Fiscal 2024 and the fiscal year ending September 27, 2025, for which performance goals have not been set as of September 30, 2023. PSU awards have a three-year vesting term generally based upon continued employment, and, to the extent earned, will vest upon CPD&I Committee approval of performance attainment at the end of the three-year term. This PSU award is not shown in the Fiscal 2023 Summary Compensation Table because the performance goals associated with it were not established in Fiscal 2023.
(9)1/16th of the shares subject to the RSU grant vested on August 15, 2020 and an additional 1/16th vests quarterly thereafter, generally subject to continued employment.
(10)1/16th of the shares subject to the RSU grant vested on February 15, 2021 and an additional 1/16th vests quarterly thereafter, generally subject to continued employment.
63
(11)Consists of (i) a grant of 28,027 RSUs, vesting according to the following schedule: 6.25% of the shares subject to the RSU grant will vest quarterly in year one; 12.5% of the shares subject to the RSU grant will vest quarterly in year two; and 6.25% of the shares subject to the RSU grant will vest quarterly in year three, following the vesting commencement date of November 15, 2021 and generally subject to continued employment, (ii) 0 shares earned under a PSU award based on the achievement of the pre-established Company performance goals for Fiscal 2022 at 0.00%, as determined by the CPD&I Committee, and (iii) 1,570 shares earned under a PSU award based on the achievement of the pre-established Company performance goals for Fiscal 2023 at 16.8%, as determined by the CPD&I Committee. PSU awards have a three-year vesting term generally based on continued employment, and, to the extent earned, will vest upon CPD&I Committee approval of performance attainment at the end of the three-year term.
(12)1/2 of the shares subject to the RSU grant vested on September 1, 2023, and the remaining 1/2 vests on September 1, 2024, generally subject to continued employment.
(13)Consists of (i) a grant of 25,479 RSUs, vesting according to the following schedule: 6.25% of the shares subject to the RSU grant will vest quarterly in year one; 12.5% of the shares subject to the RSU grant will vest quarterly in year two; and 6.25% of the shares subject to the RSU grant will vest quarterly in year three, following the vesting commencement date of November 15, 2021 and generally subject to continued employment, (ii) 0 shares earned under a PSU award based on the achievement of the pre-established Company performance goals for Fiscal 2022 at 0.00%, as determined by the CPD&I Committee, and (iii) 1,427 shares earned under a PSU award based on the achievement of the pre-established Company performance goals for Fiscal 2023 at 16.8%, as determined by the CPD&I Committee. PSU awards have a three-year vesting term generally based on continued employment, and, to the extent earned, will vest upon CPD&I Committee approval of performance attainment at the end of the three-year term.
(14)Consists of (i) a grant of 54,733 RSUs, with 1/12th of the shares subject to the RSU grant vested on February 15, 2023 and an additional 1/12 vesting quarterly thereafter and generally subject to continued employment, and (ii) 3,065 shares earned under a PSU award based on the achievement of the pre-established Company performance goals for Fiscal 2023 at 16.8%, as determined by the CPD&I Committee. PSU awards have a three-year vesting term generally based on continued employment, and, to the extent earned, will vest upon CPD&I Committee approval of performance attainment at the end of the three-year term.
(15)1/12th of the shares subject to the RSU grant vested on August 15, 2023, and an additional 1/12th vests quarterly thereafter, generally subject to continued employment.
(16)Consists of (i) a grant of 48,294 RSUs, with 1/12th of the shares subject to the RSU grant vested on February 15, 2023 and an additional 1/12 vesting quarterly thereafter and generally subject to continued employment, and (ii) 2,704 shares earned under a PSU award based on the achievement of the pre-established Company performance goals for Fiscal 2023 at 16.8%, as determined by the CPD&I Committee. PSU awards have a three-year vesting term generally based on continued employment, and, to the extent earned, will vest upon CPD&I Committee approval of performance attainment at the end of the three-year term.
(17)1/4th of shares subject to the RSU grant vested on November 15, 2022, and an additional 1/16th vests quarterly thereafter, generally subject to continued employment.
(18)100% of the shares subject to the RSU grant will vest on February 15, 2025, generally subject to continued employment.
(19)Consists of (i) a grant of 32,196 RSUs, with 1/12th of the shares subject to the RSU grant vested on February 15, 2023 and an additional 1/12 vesting quarterly thereafter and generally subject to continued employment, and (ii) 1,803 shares earned under a PSU award based on the achievement of the pre-established Company performance goals for Fiscal 2023 at 16.8%, as determined by the CPD&I Committee. PSU awards have a three-year vesting term generally based on continued employment, and, to the extent earned, will vest upon CPD&I Committee approval of performance attainment at the end of the three-year term.
(20)Mr. Siegel did not hold any Sonos equity awards as of September 30, 2023.
(21)The market values of (i) RSU awards that have not vested, including PSU awards that have been earned based on the achievement of pre-established Company performance goals, and (ii) other PSU awards (at target) are calculated by multiplying the number of shares shown in the table by $12.91, the closing market price of shares of our common stock on September 29, 2023, the last trading day of Fiscal 2023.
64
Fiscal 2023 Option Exercises and Stock Vested Table
The following table provides information regarding the number of shares of common stock acquired and the value realized pursuant to the exercise of stock options and the vesting of RSUs during Fiscal 2023 by each of our named executive officers.
|
|
|
|
|
|
|
|
|
|
|
Option Awards |
|
Stock Awards |
Name |
|
Number of Shares Acquired on Exercise (#) |
|
Value Realized on Exercise ($) (1) |
|
Number of Shares Acquired on Vesting (#) |
|
Value Realized on Vesting ($) (2) |
Patrick Spence |
|
— |
|
— |
|
432,918 |
|
7,620,038 |
Edward Lazarus |
|
— |
|
— |
|
175,209 |
|
2,656,457 |
Maxime Bouvat-Merlin |
|
— |
|
— |
|
53,913 |
|
938,542 |
Nicholas Millington |
|
41,898 |
|
633,796 |
|
104,956 |
|
1,918,677 |
Shamayne Braman |
|
— |
|
— |
|
16,573 |
|
287,428 |
Matthew Siegel |
|
2,688 |
|
12,849 |
|
66,546 |
|
1,316,536 |
(1)The value realized on exercise reflects the difference between the fair market value of our common stock at the time of exercise on the exercise date and the exercise price of the option. Amounts shown are presented on an aggregate basis for all exercises that occurred during Fiscal 2023.
(2)The value realized on vesting is based on the number of shares underlying the RSU awards that vested during Fiscal 2023 multiplied by the closing market price of a share of our common stock on the applicable vesting date, except where such vesting date fell on a day that was not a trading day, in which case such value was calculated by multiplying the number of shares acquired on vesting by the closing market price on the trading day immediately prior to the applicable vesting date.
Potential Payments upon Termination or Change in Control
We do not have contracts, arrangements or agreements with any of our named executive officers providing severance payments or benefits upon a termination of employment or change in control, other than the acceleration of vesting of unvested options, RSUs or PSUs under the terms of our 2018 Plan upon an involuntary termination of employment within a certain period of time prior to or following a change in control. See “—Employment, Severance and Change in Control Agreements” above for more details.
The following table provides information concerning the estimated payments and benefits that would be provided in the circumstances described below for each of the named executive officers, other than Mr. Siegel. Except where otherwise noted, payments and benefits are estimated assuming that the triggering event took place on the last business day of Fiscal 2023, which was September 29, 2023, and that the price per share of our common stock was the closing price on The Nasdaq Global Select Market as of that date, which was $12.91 per share. There can be no assurance that a triggering event would produce the same or similar results as those estimated below if such event were to occur on any other date or at any other price, or if any other assumption used to estimate potential payments and benefits is not correct. Due to the number of factors that affect the nature and amount of any potential payments or benefits, any actual payments and benefits may be different.
Mr. Siegel did not receive any payments or benefits in connection with his resignation effective as of February 17, 2023 and is not included in the table below given such resignation
65
|
|
|
|
|
Qualifying Termination Within Two Months Prior to, or Within Twelve Months Following, a Change of Control (1) |
Name |
|
Acceleration of Equity Vesting ($) (2) |
Patrick Spence |
|
5,483,109 |
Edward Lazarus |
|
2,119,125 |
Maxime Bouvat-Merlin |
|
1,866,915 |
Nicholas Millington |
|
1,457,500 |
Shamayne Braman |
|
959,329 |
(1)As used herein, a “Qualifying Termination” means either an involuntary termination of employment without cause or a voluntary resignation for good reason, in each case under the terms of the applicable award agreement. All options granted to our NEOs under the 2003 Plan and the 2018 Plan have fully vested.
(2)The value for RSU awards is calculated by multiplying (i) the number of shares underlying unvested RSUs that would be subject to an acceleration of vesting by (ii) $12.91 (the per share closing stock price on September 29, 2023, the last trading date of Fiscal 2023). The value for PSU awards is calculated by multiplying (i) the number of shares underlying unvested PSUs that would be subject to an acceleration of vesting (determined as described in the parenthetical below) by (ii) $12.91 (the per share closing stock price on September 29, 2023, the last trading date of Fiscal 2023). If the acquirer in a change in control transaction does not assume the PSUs, the PSUs will vest in full on such transaction (at target for any PSUs for which the performance period has not been completed and based on the number of PSUs that have been earned by their terms for any performance period that has been completed).
CEO Pay Ratio
For Fiscal 2023, the median of the annual total compensation of all employees of our company (other than our CEO) was $165,333, and the annual total compensation of our CEO, Patrick Spence, was $5,190,714. Based on this information, for Fiscal 2023, the ratio of the annual total compensation of our CEO to the median of the annual total compensation of all employees was approximately 31 to 1. This ratio is a reasonable estimate calculated in a manner consistent with SEC rules.
To identify the median of the annual total compensation of all of our employees and to determine the annual total compensation of the “median employee,” we used the following methodology and material assumptions, adjustments and estimates:
•We selected September 30, 2023 as the date upon which we would identify our median employee.
•As of September 30, 2023, our employee population consisted of approximately 1,879 individuals, of which 1,321 were in the United States and 558 were outside of the United States. In determining our employee population, we considered our worldwide employees as of September 30, 2023, including short-term employees and whether employed on a full-time, part-time, temporary or seasonal basis.
•To identify our “median employee,” we looked at the total direct compensation for Fiscal 2023 for all active employees, which for this purpose included each such employee's Fiscal 2023 annual base salary (or, in the case of non-salaried employees, hourly rate multiplied by his or her Fiscal 2023 work schedule) plus his or her Fiscal 2023 target bonus plus the actual accounting value of his or her Fiscal 2023 equity awards, if any, and annualized the compensation of any employees who started after the first day of our Fiscal 2023.
•With respect to the annual total compensation of the “median employee,” we identified and calculated the elements of such employee’s compensation for Fiscal 2023 in accordance with the requirements of Item 401(c)(2)(x) of Regulation S-K, resulting in annual total compensation of $165,333.
66
With respect to the annual total compensation for our CEO, we used the amount reported in the “Total” column of the “Summary Compensation Table” set forth above.
Because SEC rules for identifying the median of the annual total compensation of all employees allow companies to adopt a variety of methodologies, apply certain exclusions and make reasonable estimates and assumptions that reflect their employee population and compensation practices, the pay ratio reported by other companies may not be comparable to our pay ratio, as other companies have different employee populations and compensation practices and may have used different methodologies, exclusions, estimates and assumptions in calculating their pay ratios.
Pay Versus Performance
The following table and related disclosure below are provided in compliance with the requirements of Item 402(v) of Regulation S-K to summarize information regarding the relationship between “Compensation Actually Paid” (as calculated under applicable SEC rules) (“CAP”), for our Principal Executive Officer (PEO) and our non-PEO NEOs, on an average basis, and the Company’s financial performance for Fiscal 2023, Fiscal 2022, and Fiscal 2021.
The methodology for calculating amounts presented in the columns “Compensation Actually Paid to PEO” and “Average Compensation Actually Paid to Non-PEO NEOs,” including details regarding the amounts that were deducted from, and added to, the Summary Compensation Table totals to arrive at the values presented for CAP, are provided in the footnotes to the table. A discussion of the relationship between CAP and the Company’s performance measures listed in the table below, including the measure that the Company has deemed most important in linking CAP during Fiscal 2023 to Company performance.
The calculations and analysis below do not necessarily reflect the Company’s approach to aligning executive compensation with performance. For information concerning the Company’s compensation philosophy and how the Company aligns executive compensation with financial performance, refer to the Compensation Discussion and Analysis on page 41 of this Proxy Statement.
|
|
|
|
|
|
|
|
|
|
|
|
|
|
Value of Initial Fixed $100 Investment Based On: |
|
|
Fiscal Year |
Summary Compensation Table Total for PEO(1) |
Compensation Actually Paid to PEO(2)(3)(4)(5) |
Average Summary Compensation Table Total for Non-PEO NEOs(1) |
Average Compensation Actually Paid to Non-PEO NEOs(2)(3)(4)(5) |
Total Shareholder Return(6) |
Peer Group Total Shareholder Return |
Net Income ($000s)(7) |
Adjusted EBITDA Margin (8) |
(a) |
(b) |
(c) |
(d) |
(e) |
(f) |
(g) |
(h) |
(i) |
2023 |
$5,190,714 |
$4,702,791 |
$1,472,635 |
$915,290 |
$83.29 |
$146.23 |
($10,274) |
9.3% |
2022 |
$8,411,949 |
($13,528,779) |
$2,122,936 |
($2,666,086) |
$89.68 |
$102.04 |
$67,383 |
12.9% |
2021 |
$5,482,555 |
$32,271,135 |
$1,365,007 |
$10,146,753 |
$208.13 |
$139.60 |
$158,595 |
16.2% |
67
(1)NEOs included in the above compensation columns reflect the following:
|
|
|
Fiscal Year |
PEO |
Non-PEO NEOs |
2023 |
Patrick Spence |
Edward Lazarus, Maxime Bouvat-Merlin, Nicholas Millington, Shamayne Braman, and Matthew Siegel |
2022 |
Patrick Spence |
Edward Lazarus, Matthew Siegel, Nicholas Millington, Brittany Bagley, and Anna Fraser |
2021 |
Patrick Spence |
Edward Lazarus, Matthew Siegel, Nicholas Millington, and Brittany Bagley |
(2)Fair value amounts or change in fair value, as applicable, of equity awards in the Compensation Actually Paid columns were determined based on applicable SEC rules with respect to previously-granted RSUs and PSUs. For stock options, changes in fair value were calculated pursuant to a Black-Scholes model as of the last day of the applicable year.
(3)For Fiscal 2023, the values included in the Compensation Actually Paid to PEO and Average Compensation Actually Paid to Non-PEO NEOs columns reflect the following adjustments from the values shown in columns (b) and (d), respectively. Numbers may not foot in the tables below due to rounding.
|
|
|
|
PEO |
Average Non-PEO NEOs |
Total Reported in Fiscal 2023 Summary Compensation Table (SCT) |
$5,190,714 |
$1,472,635 |
Less: Value of stock awards reported in SCT |
$4,568,856 |
$1,025,980 |
Plus: Year-end value of stock awards granted in fiscal year that are outstanding and unvested |
$1,787,671 |
$347,095 |
Plus: Change in fair value (from prior year-end) of stock awards granted in prior years that are outstanding and unvested |
($152,408) |
($50,203) |
Plus: Fair Market Value (FMV) of awards granted this year and that vested this year |
$690,336 |
$140,302 |
Plus: Change in fair value (from prior year-end) of prior year stock awards that vested this year |
$1,755,335 |
$256,189 |
Less: Prior year-end fair value of stock awards granted in prior years that failed to vest this year |
$0 |
$224,749 |
Total Adjustments |
($487,923) |
($557,345) |
Compensation Actually Paid for Fiscal 2023 |
$4,702,791 |
$915,290 |
(4)For Fiscal 2022, the values included in the Compensation Actually Paid to PEO and Average Compensation Actually Paid to Non-PEO NEOs columns reflect the following adjustments from the values shown in columns (b) and (d), respectively. Numbers may not foot in the tables below due to rounding.
|
|
|
|
PEO |
Average Non-PEO NEOs |
Total Reported in Fiscal 2022 Summary Compensation Table (SCT) |
$8,411,949 |
$2,122,936 |
Less: Value of stock awards reported in SCT |
$7,837,371 |
$1,709,400 |
Plus: Year-end value of stock awards granted in fiscal year that are outstanding and unvested |
$846,343 |
$795,978 |
Plus: Change in fair value (from prior year-end) of stock awards granted in prior years that are outstanding and unvested |
($14,655,694) |
($1,603,036) |
68
|
|
|
Plus: Fair Market Value (FMV) of awards granted this year and that vested this year |
$319,351 |
$131,497 |
Plus: Change in fair value (from prior year-end) of prior year stock awards that vested this year |
($613,357) |
($1,337,309) |
Less: Prior year-end fair value of stock awards granted in prior years that failed to vest this year |
$0 |
$1,066,753 |
Total Adjustments |
($21,940,728) |
($4,789,023) |
Compensation Actually Paid for Fiscal 2022 |
($13,528,779) |
($2,666,086) |
(5)For Fiscal 2021, the values included in the Compensation Actually Paid to PEO and Average Compensation Actually Paid to Non-PEO NEOs columns reflect the following adjustments from the values shown in columns (b) and (d), respectively. Numbers may not foot in the tables below due to rounding.
|
|
|
|
PEO |
Average Non-PEO NEOs |
Total Reported in Fiscal 2021 Summary Compensation Table (SCT) |
$5,482,555 |
$1,365,007 |
Less: Value of stock awards reported in SCT |
$4,959,209 |
$523,904 |
Plus: Year-end value of stock awards granted in fiscal year that are outstanding and unvested |
$11,845,193 |
$826,259 |
Plus: Change in fair value (from prior year-end) of stock awards granted in prior years that are outstanding and unvested |
$15,871,590 |
$5,025,624 |
Plus: Fair Market Value (FMV) of awards granted this year and that vested this year |
$543,055 |
$211,775 |
Plus: Change in fair value (from prior year-end) of prior year stock awards that vested this year |
$3,487,952 |
$3,241,991 |
Less: Prior year-end fair value of stock awards granted in prior years that failed to vest this year |
$0 |
$0 |
Total Adjustments |
$26,788,580 |
$8,781,746 |
Compensation Actually Paid for Fiscal 2021 |
$32,271,135 |
$10,146,753 |
(6)For purposes of calculating peer group total shareholder return (“TSR”), the Nasdaq Computer Index was utilized pursuant to Item 201(e) of Regulation S-K and as is reflected in our Annual Report on Form 10-K for the fiscal year ended September 30, 2023. In accordance with applicable SEC rules, peer group TSR was calculated on a market capitalization weighted basis according to the respective issuers’ stock market capitalization at the beginning of each period for which a return is indicated. TSR for both the Company and the peer group is based on an initial $100 investment, measured on a cumulative basis from the market close on October 2, 2020, through and including the end of the fiscal year for which TSR is being presented in the table. TSR calculations reflect reinvestment of dividends.
(7)The amounts reported in column (h) represent net income of the Company reported in our Annual Report on Form 10-K for the applicable fiscal year.
(8)We identified Adjusted EBITDA margin for Fiscal 2023 as our Company-Selected Measure that represents, in our view, the most important financial performance measure used to link Compensation Actually Paid in Fiscal 2023 to Company performance. Adjusted EBITDA margin was one of two of our financial performance measures used in the Company’s annual cash incentive program, as well as one of two of our equally weighted PSU measures, for Fiscal 2023. We define “Adjusted EBITDA margin” as Adjusted EBITDA divided by revenue, with “Adjusted EBITDA” defined as net income (loss) adjusted to exclude the impact of depreciation, stock-based compensation expense, interest income, interest expense, other income (expense), income taxes, and other items that we do not consider representative of our underlying
69
operating performance. Adjusted EBITDA margin and Adjusted EBITDA are non-GAAP measures. See Annex A of this Proxy Statement for reconciliations of non-GAAP items, including Adjusted EBITDA margin and Adjusted EBITDA.
Pay Versus Performance Additional Disclosure
We believe the Compensation Actually Paid in each of Fiscal 2023, Fiscal 2022, and Fiscal 2021 and over the three-year cumulative period are reflective of the Committee’s emphasis on “pay-for-performance.” The Compensation Actually Paid fluctuated year-over-year, primarily because of our (i) stock performance, (ii) varying levels of achievement against pre-established performance goals under our long-term incentive program, and (iii) varying levels of achievement against pre-established performance goals under our annual cash incentive program.
In addition to reviewing this discussion and the Pay Versus Performance Table above, we encourage you to read the Compensation Discussion and Analysis section of this Proxy Statement, which explains our executive compensation philosophy and programs for our PEO and non-PEO NEOs.
Chart 1: Compensation Actually Paid Versus Company and Peer Group Total Shareholder Return (TSR)
The Compensation Actually Paid values for our PEO and non-PEO NEOs over the three-year period of Fiscal 2021 through Fiscal 2023 generally aligns with the Company’s TSR performance over the same period. This is due primarily to the emphasis on at-risk, performance-based equity incentives in the compensation program design for our PEO and non-PEO NEOs.
As depicted in the below chart, strong absolute TSR performance in Fiscal 2021 exceeded the peer group and drove an increase in the fair value of equity awards, which resulted in increased Compensation Actually Paid values. Weaker TSR performance in Fiscal 2022 resulted in a significant decrease in Compensation Actually Paid. Flatter TSR performance in Fiscal 2023 resulted in more modest Compensation Actually Paid values.
The below chart also compares the Company’s TSR to the peer group TSR, in each case, measured on a cumulative basis from the market close on October 2, 2020, through and including the end of Fiscal 2023.
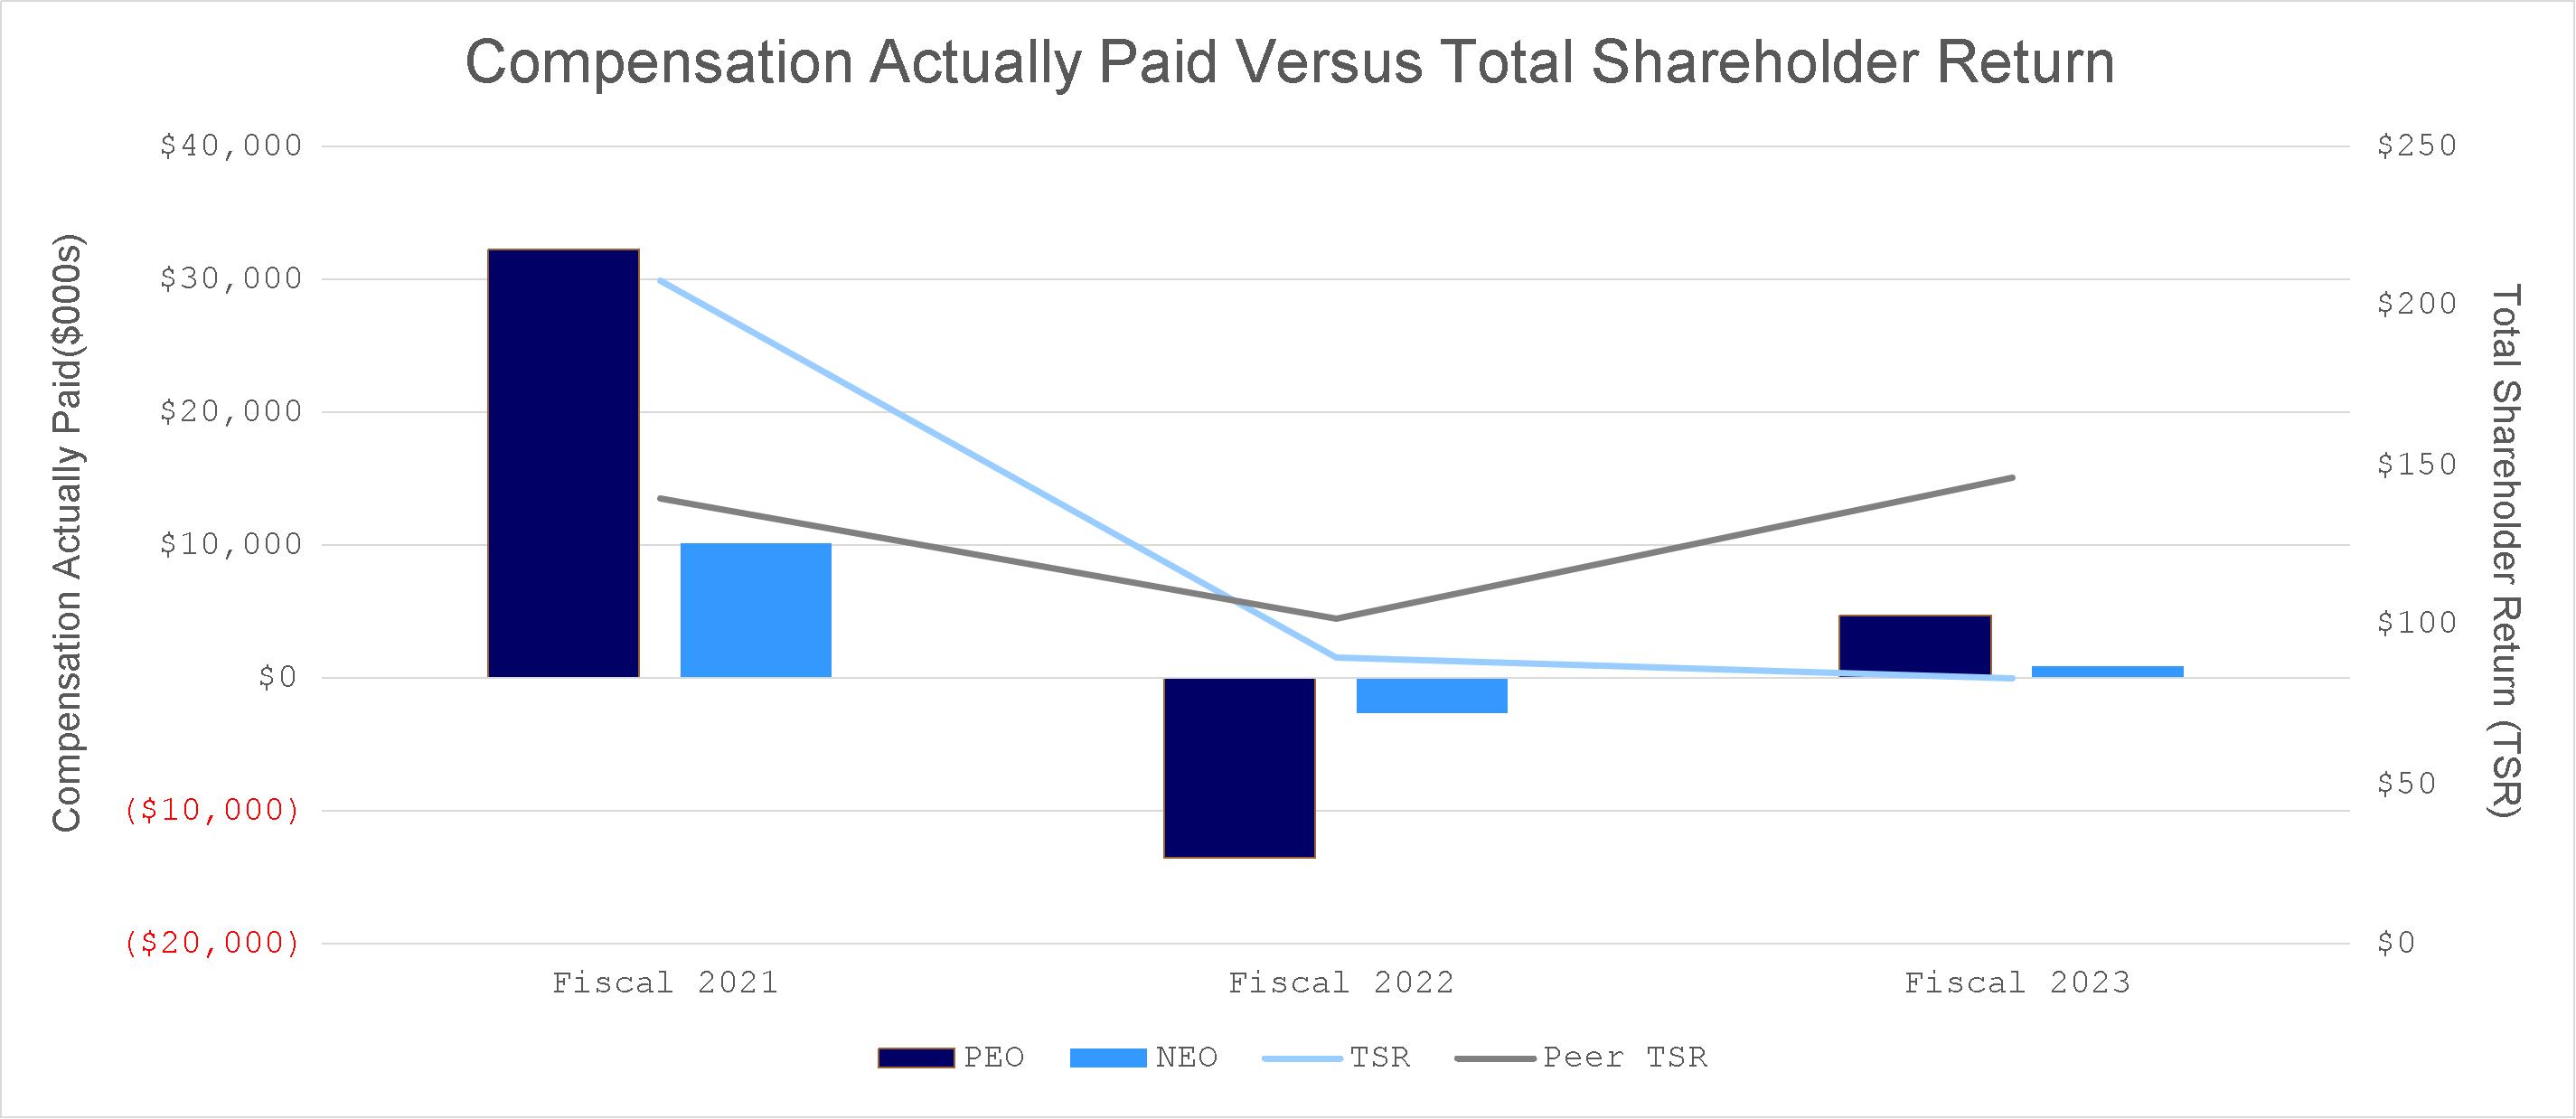
70
Chart 2: Compensation Actually Paid Versus Net Income
SEC rules require that net income be presented as a performance measure in the Pay Versus Performance table. No portion of our compensation is directly tied to net income results.
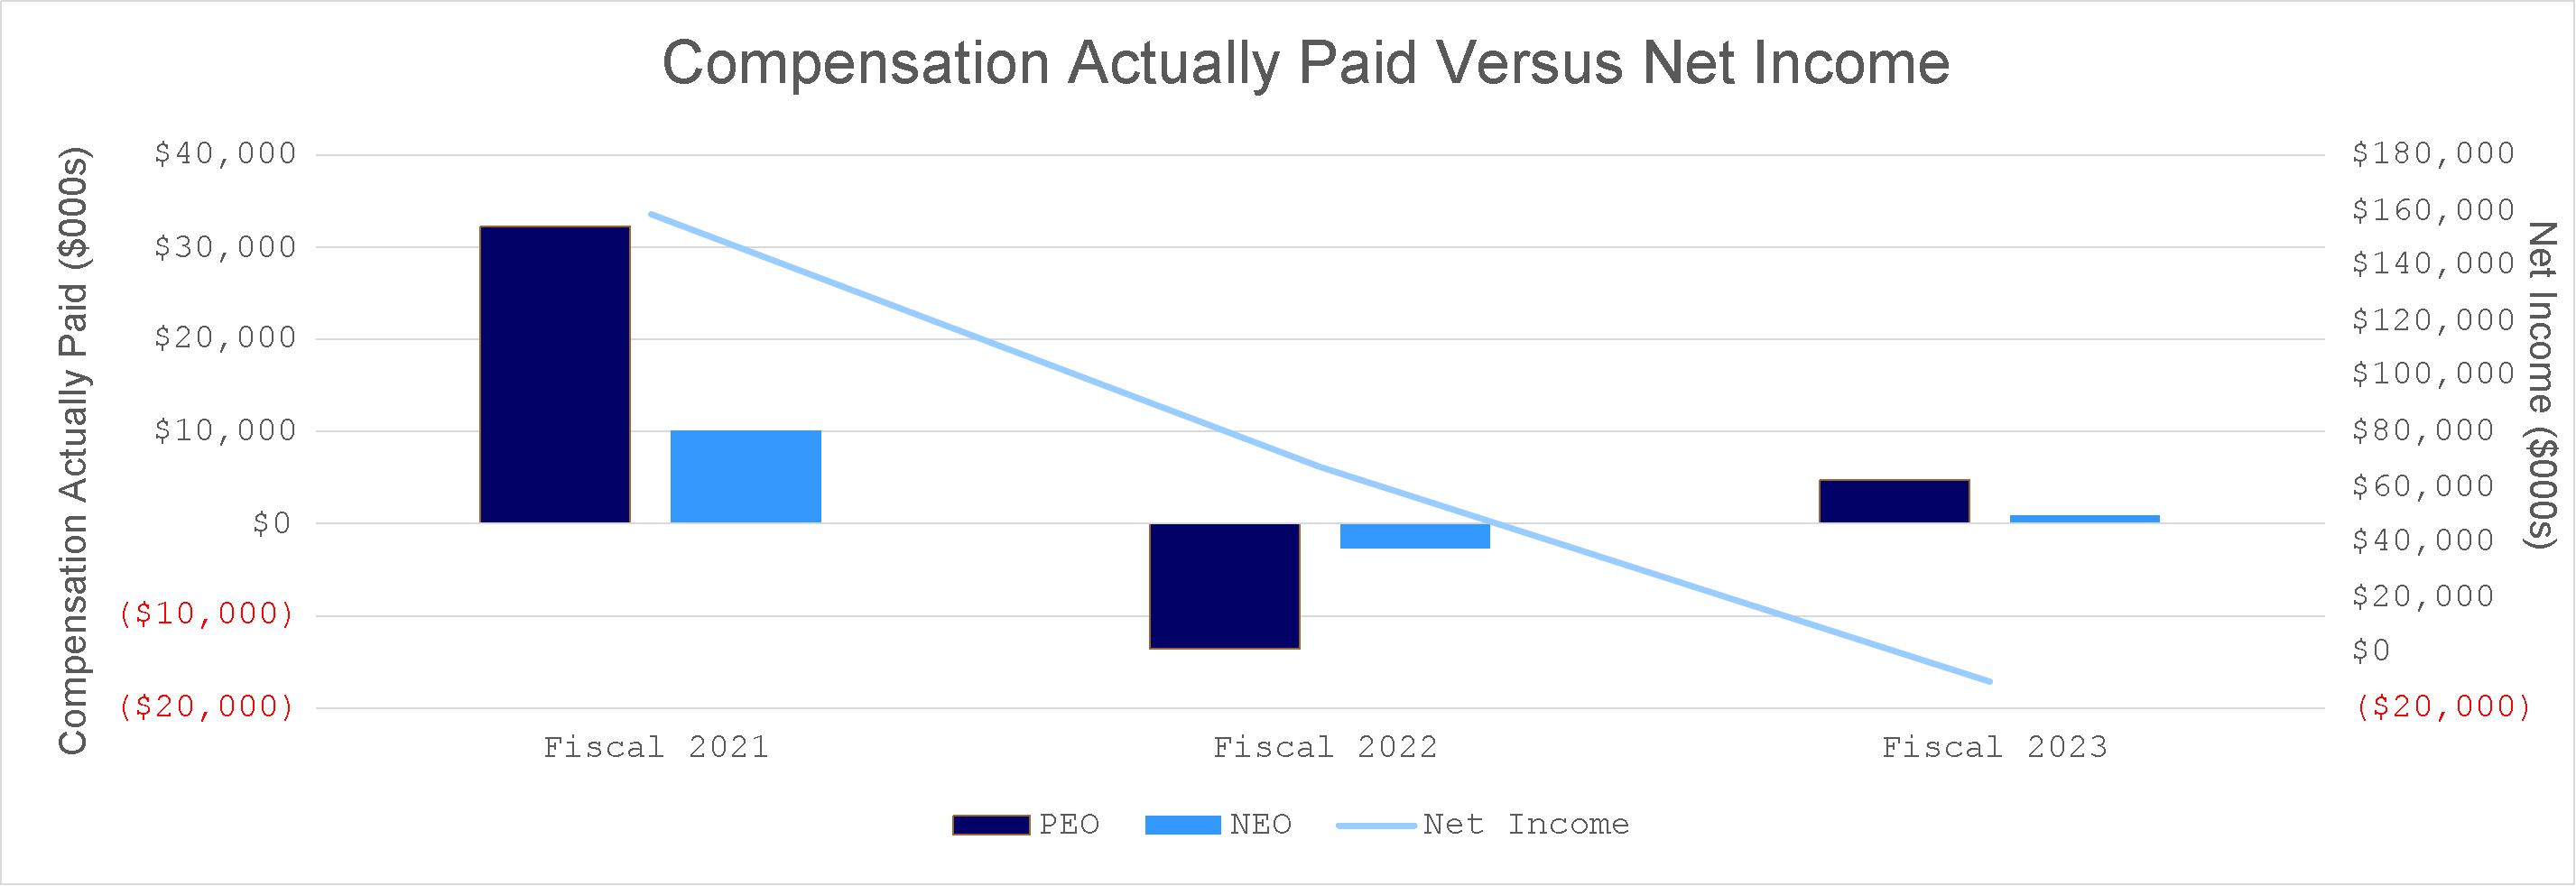
Chart 3: Compensation Actually Paid Versus Adjusted EBITDA Margin
We identified Adjusted EBITDA margin as our Company-Selected Measure that represents, in our view, the most important financial performance measure used to link Compensation Actually Paid in Fiscal 2023 to our performance. Adjusted EBITDA margin was one of two financial performance measures used in our annual cash incentive program, as well as one of two of our PSU measures, for Fiscal 2023. Compensation Actually Paid for 2021 was positive, which is partially attributable to strong Adjusted EBITDA margin results relative to our incentive targets for that year and Adjusted EBITDA margin’s correlation with our stock price. Our Adjusted EBITDA margin results declined in Fiscal 2022 and Fiscal 2023, which partially contributed to negative Compensation Actually Paid in Fiscal 2022 and more modest Compensation Actually Paid in Fiscal 2023.
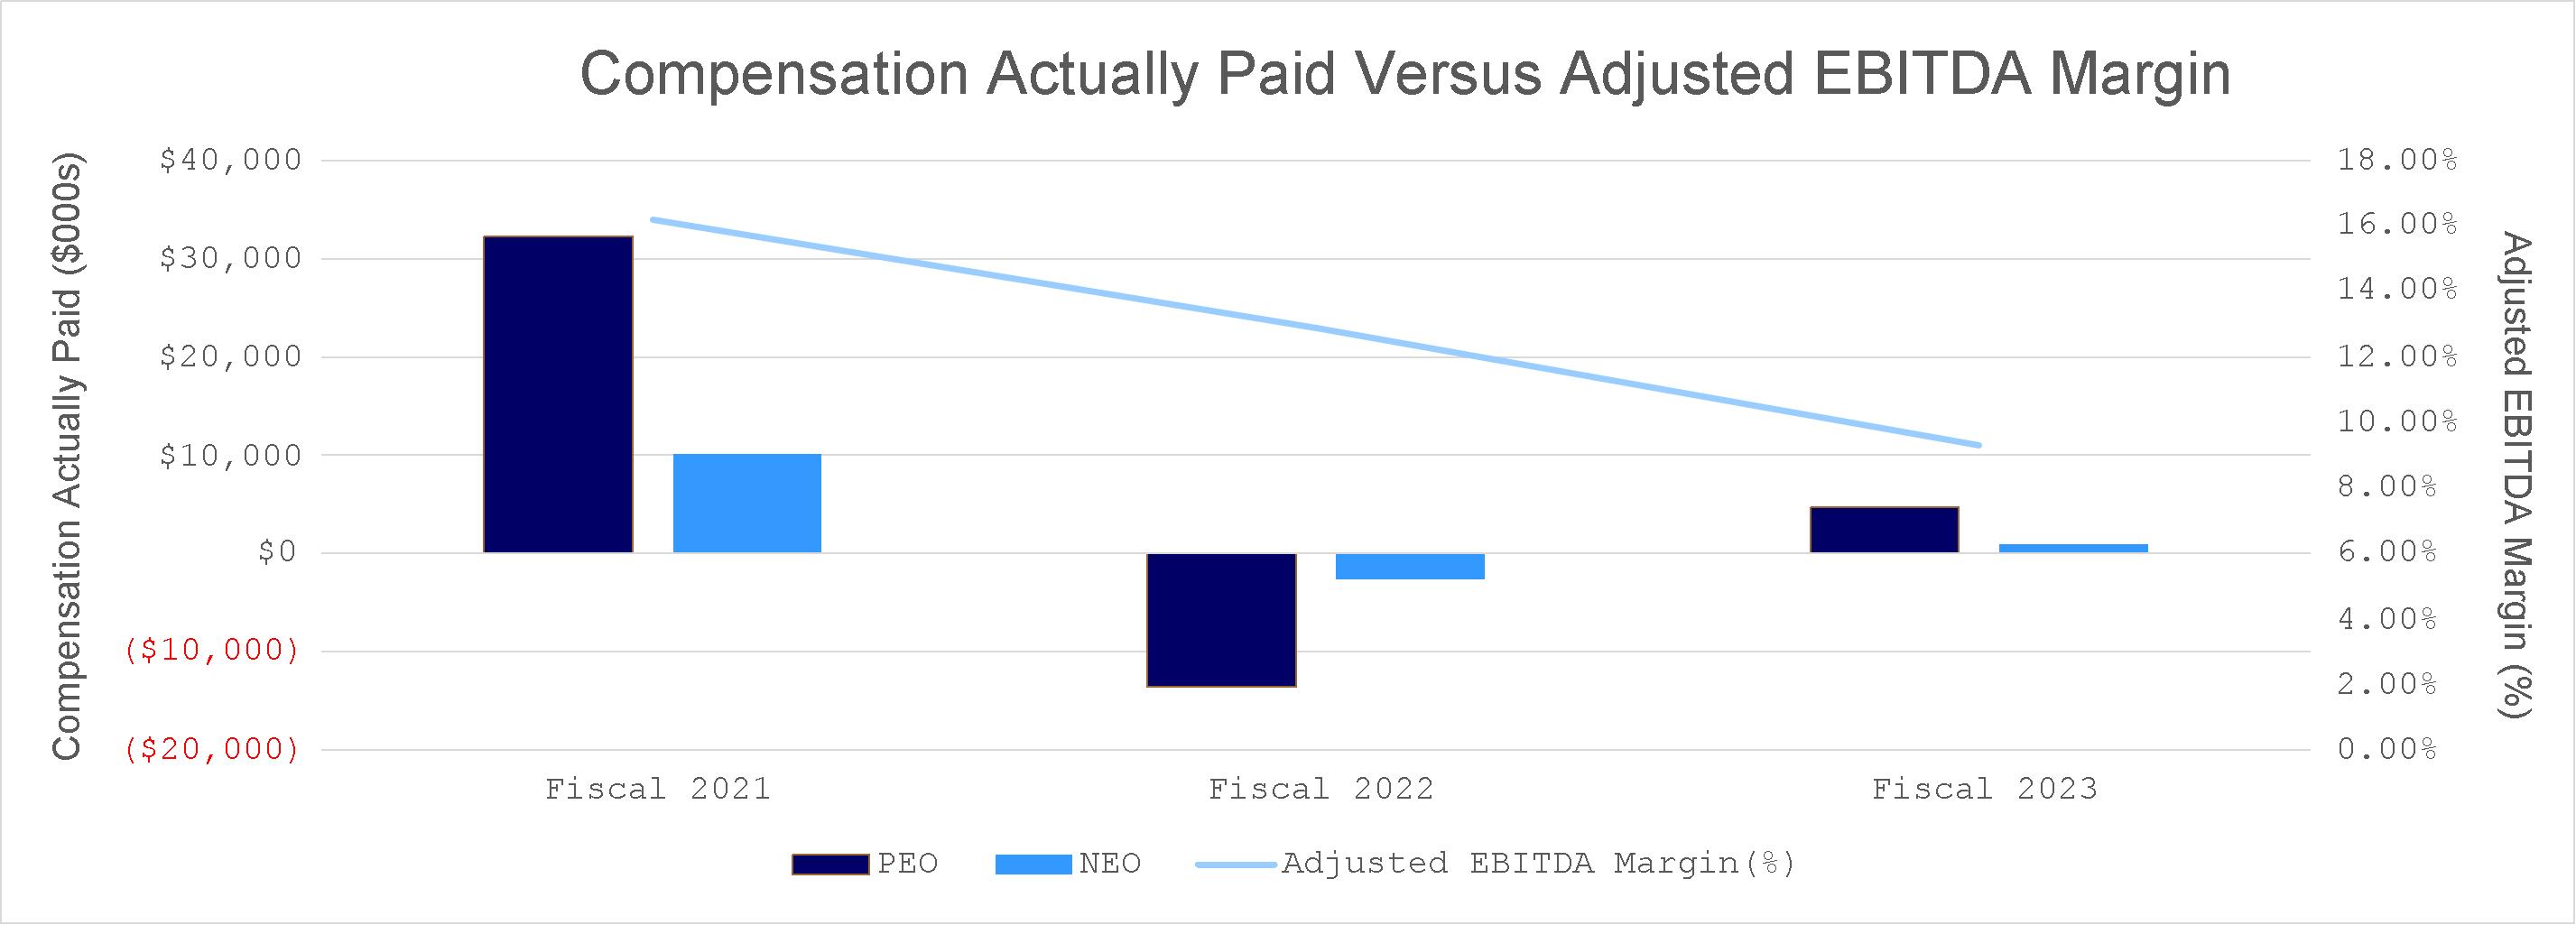
71
Performance Measures
The most important financial performance measures used by the Company for Fiscal 2023 to link compensation actually paid to the Company’s named executive officers to Company performance are as follows:
72
EQUITY COMPENSATION PLAN INFORMATION
The following table presents information as of September 30, 2023 with respect to compensation plans under which shares of our common stock may be issued. The equity compensation plans approved by our stockholders include our 2003 Plan, our 2018 Plan and our 2018 Employee Stock Purchase Plan (the “ESPP”).
|
|
|
|
|
|
|
|
|
(a) |
|
(b) |
|
(c) |
Plan Category |
|
Number of securities to be issued upon exercise of outstanding options, warrants and rights |
|
Weighted-average exercise price of outstanding options, warrants and rights ($) |
|
Number of securities remaining available for future issuance under equity compensation plans (excluding securities reflected in column(a)) |
Equity compensation plans approved by security holders |
|
16,477,183 (1) |
|
13.99 (2) |
|
60,247,362 (3) |
Equity compensation plans not approved by security holders |
|
— |
|
N/A |
|
— |
Total |
|
16,477,183 |
|
13.99 |
|
60,247,362 |
(1)Includes 8,549,957 stock options outstanding under the 2003 Plan and the 2018 Plan, and 7,662,035 RSUs and 265,191 PSUs outstanding under the 2018 Plan, each as of September 30, 2023.
(2)The weighted-average exercise price is calculated based solely on the exercise prices of the outstanding options and do not reflect the shares that will be issued upon the vesting of outstanding awards of RSUs or PSUs, which each have no exercise price.
(3)Includes 42,317,925 shares available for issuance under the 2018 Plan and 17,929,437 shares available for issuance under the ESPP. There are no shares of common stock available for issuance under the 2003 Plan, but the 2003 Plan will continue to govern the terms of stock options granted thereunder. Any shares of common stock that are subject to outstanding awards under the 2003 Plan or the 2018 Plan that cease to be subject to such awards or that are forfeited or repurchased at their original issue price, and any shares of common stock that are subject to outstanding awards under the 2018 Plan that are surrendered pursuant to an exchange program or otherwise terminate without being reissued, in each case, will generally be available for future grant and issuance as shares of common stock under the 2018 Plan; however, shares subject to awards under the 2003 Plan or the 2018 Plan that are used to pay the exercise price of an option or withheld to satisfy the tax withholding obligations related to any award will not become available for future grant or sale under the 2018 Plan. In addition, the number of shares reserved for issuance under the 2018 Plan automatically increases on January 1 of each year through 2028 by a number of shares of common stock equal to the lesser of (i) 5% of the total outstanding shares of our common stock and common stock equivalents as of the immediately preceding December 31 (rounded to the nearest whole share) and (ii) a number of shares determined by our Board. The ESPP is not currently in effect, but rather allows our CPD&I Committee to select a future date, if at all, upon which to implement the ESPP. The number of shares reserved for issuance under the ESPP automatically increases on January 1 of each year through 2028 by the number of shares equal to 2% of the total number of outstanding shares of our common stock and common stock equivalents as of the immediately preceding December 31. However, our Board may reduce the amount of the increase in any particular year. The aggregate number of shares issued over the term of the ESPP will not exceed 40,000,000 shares of our common stock. Pursuant to these provisions, an additional 7,458,207 and 2,983,283 shares of common stock were added to the 2018 Plan and ESPP, respectively, effective January 1, 2023, which are reflected in the table above.
73
CERTAIN RELATIONSHIPS AND RELATED PARTY TRANSACTIONS
Review, Approval or Ratification of Transactions with Related Parties
Our written related party transactions policy states that a “Related Party” is not permitted to enter into a material related party transaction with us without the prior review and approval of our Audit Committee. Pursuant to the policy, our Audit Committee must review, consider and approve any request for us to enter into a transaction with any Related Party in which the amount involved exceeds $120,000. In approving or rejecting any such proposal, our Audit Committee considers the relevant facts and circumstances available and deemed relevant to the committee, including, but not limited to, the relationship of the Related Party to us, the Related Party’s interest in the transaction, the approximately dollar value of the transaction, the potential benefit to us, and the terms of the transaction and the terms available from unrelated third parties. In the event it is inappropriate for our Audit Committee to review such transaction due to a conflict of interest, a committee comprised solely of independent directors will review such transaction request.
A “Related Party” is any of our executive officers, directors, nominees for election as a director, beneficial owners of more than 5% of our common stock and any immediate family members of the foregoing persons.
In Fiscal 2023, we were not party to any transaction or series of transactions which required review or approval under our related party transactions policy or disclosure under applicable SEC rules.
74
DELINQUENT SECTION 16(A) REPORTS
Section 16(a) of the Exchange Act requires our directors, executive officers and any persons who own more than 10% of our common stock to file initial reports of ownership and reports of changes in ownership with the SEC. Such persons are required by SEC regulation to furnish us with copies of all Section 16(a) forms that they file. Based solely on our review of the copies of such forms furnished to us and written representations from the directors and executive officers, we believe that all Section 16(a) filing requirements were timely met in the fiscal year ended September 30, 2023, other than a Form 3 for Shamayne Braman that was filed late as a result of an inadvertent delay in obtaining EDGAR codes for Ms. Braman.
75
REPORT OF THE AUDIT COMMITTEE
Our Audit Committee has reviewed and discussed with our management and PricewaterhouseCoopers LLP our audited consolidated financial statements for the fiscal year ended September 30, 2023. Our Audit Committee has also discussed with PricewaterhouseCoopers LLP the matters required to be discussed by applicable requirements of the Public Company Accounting Oversight Board and the SEC.
Our Audit Committee has received and reviewed the written disclosures and the letter from PricewaterhouseCoopers LLP required by applicable requirements of the Public Company Accounting Oversight Board regarding the independent accountant’s communications with our Audit Committee concerning independence, and has discussed with PricewaterhouseCoopers LLP its independence from us.
Based on the review and discussions referred to above, our Audit Committee recommended to our Board of Directors that the audited consolidated financial statements be included in our annual report on Form 10-K for the fiscal year ended September 30, 2023 for filing with the SEC.
Submitted by the Audit Committee
Karen Boone, Chair
Julius Genachowski
Joanna Coles
76
ADDITIONAL INFORMATION
Stockholder Proposals and Nominations for the 2025 Annual Meeting
Our restated bylaws provide that stockholders may present proposals for inclusion in our proxy statement by submitting their proposals in writing to our Corporate Secretary at our principal executive offices. In order to be included in the proxy statement for our Annual Meeting of Stockholders to be held in 2025 (the “2025 Annual Meeting”), stockholder proposals must be received by our Corporate Secretary no later than October 1, 2024 and must otherwise comply with the requirements of Rule 14a-8 of the Exchange Act.
Our restated bylaws provide that stockholders may present a proposal to be considered at an annual meeting or nominate a director by providing timely notice to our Corporate Secretary. To be timely for our 2025 Annual Meeting, a stockholder’s notice must be delivered to or mailed and received by our Corporate Secretary at our principal executive offices between 5:00 p.m. Pacific Time on November 26, 2024 and 5:00 p.m. Pacific Time on December 26, 2024. For each matter the stockholder proposes to bring before the annual meeting, a stockholder’s notice to the Corporate Secretary must set forth the information required by our restated bylaws.
Until April 30, 2024, the address for our principal executive offices is: Sonos, Inc., 614 Chapala Street, Santa Barbara, CA 93101, Attn: Corporate Secretary. As of May 1, 2024, the address for our principal executive offices will be: Sonos, Inc., 301 Coromar Drive, Goleta, CA 93117, Attn: Corporate Secretary.
In addition to satisfying the requirements under our restated bylaws, stockholders who intend to solicit proxies in support of director nominees other than Sonos’ nominees must provide notice that sets forth the information required by Rule 14a-19 under the Exchange Act (including a statement that such stockholder intends to solicit the holders of shares representing at least 67% of the voting power of the Company’s shares entitled to vote on the election of directors in support of director nominees other than Sonos’ nominees) to comply with the universal proxy rules, which notice must be postmarked or transmitted electronically to Sonos at its principal executive offices no later than 60 calendar days prior to the anniversary date of the Annual Meeting (for the 2025 Annual Meeting, no later than January 10, 2025). However, if the date of the 2025 Annual Meeting is changed by more than 30 calendar days from such anniversary date, then notice must be provided by the later of 60 calendar days prior to the date of the 2025 Annual Meeting and the 10th calendar day following the day on which public announcement of the date of the 2025 Annual Meeting is first made.
We reserve the right to reject, rule out of order, or take other appropriate action with respect to any director nomination or stockholder proposal that does not comply with our restated bylaws and other applicable requirements.
A copy of our restated bylaws is available as Exhibit 3.2 to our Form 10-Q filed September 11, 2018.
Available Information
We will mail, without charge, upon written request, a copy of our annual report on Form 10-K for the fiscal year ended September 30, 2023, including the financial statements and list of exhibits, and any exhibit specifically requested. Until April 30, 2024, requests should be sent to:
Sonos, Inc.
614 Chapala Street
Santa Barbara, CA 93101
77
Attn: Investor Relations
As of May 1, 2024, the address for these requests will be:
Sonos, Inc.
301 Coromar Drive
Goleta, CA 93117
Attn: Investor Relations
Our annual report on Form 10-K for Fiscal 2023 is also available at https://investors.sonos.com under “SEC Filings” in the “Reports & Filings” section of our website.
Electronic Delivery of Stockholder Communications
We encourage you to help us conserve natural resources, as well as significantly reduce printing and mailing costs, by signing up to receive your stockholder communications electronically via email. With electronic delivery, you will be notified via email as soon as future annual reports and proxy statements are available via the internet, and you can submit your stockholder votes online or by telephone. Electronic delivery can also eliminate duplicate mailings and reduce the amount of bulky paper documents you maintain in your personal files. To sign up for electronic delivery:
•Registered Owner (you hold our common stock in your own name through our transfer agent, Equiniti Trust Company, LLC, or you are in possession of stock certificates): visit https://www.shareowneronline.com and log into your account to enroll.
•Beneficial Owner (your shares are held by a brokerage firm, a bank, a trustee or a nominee): If you hold shares beneficially, please follow the instructions provided to you by your broker, bank, trustee or nominee.
Your electronic delivery enrollment will be effective until you cancel it. Stockholders who are record owners of shares of our common stock may contact Equiniti Trust Company, LLC, through its website at https://www.shareowneronline.com or by phone at (800) 937-5449.
“Householding”: Stockholders Sharing the Same Last Name and Address
The SEC has adopted rules that permit companies and intermediaries (such as brokers) to implement a delivery procedure called “householding.” Under this procedure, multiple stockholders who reside at the same address may receive a single copy of our annual report and proxy materials, including the Notice of Internet Availability, unless the affected stockholder has provided contrary instructions. This procedure reduces printing costs and postage fees, and helps protect the environment as well.
This year, a number of brokers with account holders who are our stockholders will be “householding” our annual report and proxy materials, including the Notice of Internet Availability. A single Notice of Internet Availability and, if applicable, a single set of annual report and other proxy materials will be delivered to multiple stockholders sharing an address unless contrary instructions have been received from the affected stockholders. Once you have received notice from your broker that it will be “householding” communications to your address, “householding” will continue until you are notified otherwise or until you revoke your consent. Stockholders may revoke their consent at any time by contacting Broadridge Financial Solutions,
78
Inc. by calling 1-866-540-7095 or in writing at 51 Mercedes Way, Edgewood, New York 11717, Attention: Householding Department.
Upon written or oral request, we will promptly deliver a separate copy of the Notice of Internet Availability and, if applicable, our annual report and other proxy materials to any stockholder at a shared address to which a single copy of any of those documents was delivered. To receive a separate copy of the Notice of Internet Availability and, if applicable, annual report and other proxy materials, you may write our Investor Relations department via email at IR@sonos.com, by mail at, until April 30, 2024, Sonos, Inc., 614 Chapala Street, Santa Barbara, CA 93101, Attn: Investor Relations, or by telephone at (805) 965-3001, and, as of May 1, 2024, Sonos, Inc., 301 Coromar Drive, Goleta, CA 93117, Attn: Investor Relations.
Any stockholders who share the same address and receive multiple copies of our Notice of Internet Availability or annual report and other proxy materials who wish to receive only one copy in the future can contact their bank, broker or other holder of record to request information about householding or our Investor Relations department at the address or telephone number listed above.
79
OTHER MATTERS
As of the date of this Proxy Statement, our Board does not intend to present, and has not been informed that any other person intends to present, any matter before the Annual Meeting other than those matters specified in the Notice of Annual Meeting of Stockholders. If any other matters properly come before the Annual Meeting, it is intended that the holders of the proxies will vote in respect thereof in accordance with their best judgment.
By Order of the Board of Directors,

Edward Lazarus
Chief Legal and Strategy Officer and Corporate Secretary
Santa Barbara, California
January 29, 2024
80
Annex A: Reconciliation of Non-GAAP Items
We have provided in this Proxy Statement financial information that has not been prepared in accordance with generally accepted accounting principles (“U.S. GAAP”). These non-GAAP financial measures are not based on any standardized methodology prescribed by U.S. GAAP and are not necessarily comparable to similarly titled measures presented by other companies. We use these non-GAAP financial measures to evaluate our operating performance and trends and make planning decisions. We believe that these non-GAAP financial measures help identify underlying trends in our business that could otherwise be masked by the effect of the expenses and other items that we exclude in these non-GAAP financial measures. Accordingly, we believe that these non-GAAP financial measures provide useful information to stockholders and others in understanding and evaluating our operating results, enhancing the overall understanding of our past performance and future prospects, and allowing for greater transparency with respect to a key financial metric used by our management in its financial and operational decision-making.
Non-GAAP financial measures should not be considered in isolation of, or as an alternative to, measures prepared in accordance with U.S. GAAP. Stockholders are encouraged to review the reconciliation of these financial measures to their nearest U.S. GAAP financial equivalents provided in the tables below. The most directly comparable financial measure calculated under U.S. GAAP for Adjusted EBITDA is net income (loss). We define Adjusted EBITDA as net income (loss) adjusted to exclude the impact of depreciation and amortization, stock-based compensation expense, interest income, interest expense, other income (expense), income taxes, restructuring and abandonment costs and other items that we do not consider representative of our underlying operating performance. We define Adjusted EBITDA margin as Adjusted EBITDA divided by revenue. We define free cash flow as net cash from operations less purchases of property and equipment and intangible assets.
|
|
|
|
|
|
|
|
|
Reconciliation of Net Income (Loss) to Adjusted EBITDA |
(unaudited, dollars in thousands except percentages) |
|
|
Three Months Ended |
|
Twelve Months Ended |
|
|
September 30, 2023 |
|
October 1, 2022 |
|
September 30, 2023 |
|
October 1, 2022 |
Net income (loss) |
|
$ (31,239) |
|
$ (64,067) |
|
$ (10,274) |
|
$ 67,383 |
Add (deduct): |
|
|
|
|
|
|
|
|
Depreciation and amortization |
|
13,915 |
|
10,805 |
|
48,969 |
|
38,504 |
Stock-based compensation expense |
|
17,308 |
|
18,177 |
|
76,857 |
|
75,640 |
Interest income |
|
(2,661) |
|
(1,070) |
|
(10,201) |
|
(1,655) |
Interest expense |
|
149 |
|
168 |
|
733 |
|
552 |
Other (income) expense, net |
|
6,696 |
|
8,364 |
|
(15,473) |
|
21,905 |
Provision for (benefit from) income taxes |
|
(1,306) |
|
(3,459) |
|
14,668 |
|
1,347 |
Restructuring and related expenses(1) |
|
474 |
|
— |
|
15,649 |
|
— |
Legal and transaction related costs(2) |
|
2,944 |
|
5,529 |
|
32,950 |
|
22,873 |
Adjusted EBITDA |
|
$ 6,280 |
|
$ (25,553) |
|
$ 153,878 |
|
$ 226,549 |
Revenue |
|
$ 305,147 |
|
$ 316,290 |
|
$ 1,655,255 |
|
$ 1,752,336 |
Net income (loss)margin |
|
(10.2)% |
|
(20.3)% |
|
(0.6)% |
|
(3.8)% |
Adjusted EBITDA margin |
|
2.1% |
|
(8.1)% |
|
9.3% |
|
12.9% |
81
|
(1) On June 14, 2023, the Company initiated a restructuring plan to reduce its cost base (the “2023 restructuring plan”). The 2023 restructuring plan included a reduction in force involving approximately 7% of the Company’s employees, further reducing the Company’s real estate footprint, and re-evaluating certain program spend. Total pre-tax restructuring and abandonment costs under the 2023 restructuring plan were $11.4 million, substantially all of which were incurred in the third quarter of Fiscal 2023, with nominal amounts to be incurred through the first quarter of Fiscal 2024. Total restructuring and abandonment costs for the twelve months ended September 30, 2023, include $4.8 million non-recurring lease abandonment charges that were incurred in March 2023, when the Company abandoned portions of its office spaces for the remainder of their respective lease terms in support of operational efficiencies. |
(2) Legal and transaction related costs consist of expenses related to our intellectual property litigation against Alphabet Inc. and Google LLC as well as legal and transaction costs associated with our acquisition activity, which we do not consider representative of our underlying operating performance. |
|
|
|
|
|
|
|
|
|
Reconciliation of GAAP Net Income (Loss) to Non-GAAP Net Income (Loss) |
(unaudited, in thousands, except share and per share amounts) |
|
|
Three Months Ended |
|
Twelve months ended |
|
|
September 30, 2023 |
|
October 1, 2022 |
|
September 30, 2023 |
|
October 1, 2022 |
Reconciliation of GAAP net income (loss) |
|
|
|
|
|
|
|
|
GAAP net income (loss) |
|
$ (31,239) |
|
$ (64,067) |
|
$ (10,274) |
|
$ 67,383 |
Stock-based compensation expense |
|
17,308 |
|
18,177 |
|
76,857 |
|
75,640 |
Restructuring and related expenses |
|
474 |
|
— |
|
15,649 |
|
— |
Amortization of intangibles |
|
1,493 |
|
2,046 |
|
6,182 |
|
5,206 |
Legal and transaction related costs |
|
2,944 |
|
5,529 |
|
32,950 |
|
22,873 |
Non-GAAP net income (loss) |
|
$ (9,020) |
|
$ (38,315) |
|
$ 121,364 |
|
$ 171,102 |
|
|
|
|
|
|
|
|
|
Reconciliation of net income (loss) per share |
|
|
|
|
|
|
|
|
GAAP net income (loss) per share, diluted |
|
$ (0.25) |
|
$ (0.50) |
|
$ 0.49 |
|
$ 0.49 |
Non-GAAP adjustments to net income (loss) per share |
|
$ 0.18 |
|
$ 0.20 |
|
$ 0.72 |
|
$ 0.72 |
Non-GAAP net income (loss) per share, diluted |
|
$ (0.07) |
|
$ (0.30) |
|
$ 1.20 |
|
$ 1.20 |
Weighted-average shares used in GAAP per share calculation, diluted |
|
127,335,311 |
|
127,104,659 |
|
127,702,885 |
|
137,762,078 |
Weighted-average shares used in non-GAAP per share calculation, diluted |
|
127,335,311 |
|
127,104,659 |
|
131,947,092 |
|
137,762,078 |
Note: Certain figures may not sum due to rounding |
|
|
|
|
|
|
|
|
|
Reconciliation of Cash Flows Provided by (Used in) Operating Activities to Free Cash Flow |
(unaudited, dollars in thousands) |
|
|
Three Months Ended |
|
Twelve months ended |
|
|
September 30, 2023 |
|
October 1, 2022 |
|
September 30, 2023 |
|
October 1, 2022 |
Cash flows provided by (used in) operating activities |
|
$22,195 |
|
$ (103,917) |
|
$ 100,406 |
|
$ (28,260) |
Less: Purchases of property and equipment, intangible and other assets |
|
(10,201) |
|
(21,269) |
|
(50,286) |
|
(46,216) |
Free cash flow |
|
$ 11,994 |
|
$ (125,186) |
|
$ 50,120 |
|
$(74,476) |
SCAN TO VIEW MATERIALS & VOTE SONOS, INC. 614 CHAPALA STREET SANTA BARBARA, CA 93101 VOTE BY INTERNET Before The Meeting - Go to www.proxyvote.com or scan the QR Barcode above Use the Internet to transmit your voting instructions and for electronic delivery of information up until 11:59 p.m. Eastern Time on March 10, 2024. Have your proxy card in hand when you access the web site and follow the instructions to obtain your records and to create an electronic voting instruction form. During The Meeting - Go to www.virtualshareholdermeeting.com/SONO2024 You may attend the meeting via the Internet and vote during the meeting. Have the information that is printed in the box marked by the arrow available and follow the instructions. VOTE BY PHONE - 1-800-690-6903 Use any touch-tone telephone to transmit your voting instructions up until 11:59 p.m. Eastern Time on March 10, 2024. Have your proxy card in hand when you call and then follow the instructions. VOTE BY MAIL Mark, sign and date your proxy card and return it in the postage-paid envelope we have provided or return it to Vote Processing, c/o Broadridge, 51 Mercedes Way, Edgewood, NY 11717. V29373-Z86877 For All Withhold All For All Except To withhold authority to vote for any individual nominee(s), mark "For All Except" and write the number(s) of the nominee(s) on the line below. SONOS, INC. The Board of Directors recommends you vote FOR ALL NOMINEES for the election of the two Class III directors ! ! ! 1. Election of Directors Nominees: 01) Jonathan Mildenhall 02) Patrick Spence For Against Abstain The Board of Directors recommends you vote FOR proposals 2 and 3. ! ! ! 2. Ratification of the appointment of PricewaterhouseCoopers LLP as Sonos' independent registered accounting firm for the fiscal year ending September 28, 2024 ! ! ! 3. Advisory approval of the named executive officer compensation (the say-on-pay vote) NOTE: Such other business as may properly come before the meeting or any adjournment thereof. Please sign exactly as your name(s) appear(s) hereon. When signing as attorney, executor, administrator, or other fiduciary, please give full title as such. Joint owners should each sign personally. All holders must sign. If a corporation or partnership, please sign in full corporate or partnership name by authorized officer.
Important Notice Regarding the Availability of Proxy Materials for the Annual Meeting: The Notice and Proxy Statement and Annual Report are available at www.proxyvote.com. V29374-Z86877 SONOS, INC. Annual Meeting of Stockholders March 11, 2024 10:00 AM Pacific Time This proxy is solicited by the Board of Directors The undersigned hereby appoints Patrick Spence and Edward Lazarus, and each of them, with power to act without the other and with power of substitution, as proxies and attorneys-in-fact and hereby authorizes them to represent and vote, as provided herein, all the shares of the common stock of Sonos, Inc. to which the undersigned is entitled to vote, and, in their discretion, to vote upon such other business as may properly come before the Annual Meeting of Stockholders of Sonos, Inc. to be held on March 11, 2024 or at any adjournment or postponement thereof, with all powers that the undersigned would possess if present at the Annual Meeting. This proxy, when properly executed, will be voted in the manner directed herein. If no such direction is made, this proxy will be voted in accordance with the Board of Directors' recommendations (i.e. FOR ALL NOMINEES listed in Proposal One, FOR Proposal
82
Two and FOR Proposal Three). In their discretion, the proxies are authorized to vote upon such other business as may properly come before the meeting. Continued and to be signed on reverse side
83
84