Bitcoin Fear & Greed Index Reaches Highest Level Since 2021, What To Expect Next
February 27 2024 - 8:00AM
NEWSBTC
The Bitcoin Fear & Greed Index has risen to its highest level
in almost three years, hitting Extreme Greed at rocket speed. Using
past performance and indicators, it is possible to deduce where the
BTC price is headed next after reaching this new milestone. Bitcoin
Fear & Greed Index At New 2-Year High The Bitcoin Fear &
Greed Index is a measure of investor sentiment and how they are
looking at the market. This can help to figure out if investors are
currently putting money into the market or if they are taking money
out of it. Related Reading: OG Ethereum ERC-404 Token PANDORA Is
Rallying Again, What’s Behind It? There are five major categories
across the Fear & Greed Index, including Extreme Fear, Fear,
Neutral, Greed, and Extreme Greed. The index is ranked on a scale
of 0-100, with a range of numbers representing a category of
investor sentiment. Extreme Fear is the lowest on this scale, which
ranges from 0 to 25. Then, from 26 to 46, we have the Fear. Both of
these categories indicate an unwillingness of investors to enter
the market and have often presented as the best time to invest in
crypto. Next on the scale is 47 to 52, which represents the Neutral
territory. Then 53 to 75 is Greed when investors are beginning to
feel confident in the market. Finally, 76 to 100 is Extreme Greed,
which represents peak bullishness. As the Bitcoin Fear & Greed
Index currently sits at 79, which is Extreme Greed, it could carry
some implications for the market. BTC price pushes toward $57,000 |
Source: BTCUSD on Tradingview.com Extreme Greed Marks The Top? Just
as the Bitcoin Fear & Greed Index can be helpful in determining
what is a good time to buy, it can also provide pointers for when a
market top might be in. Looking through the historical performance
of the crypto market compared to the Fear & Greed Index, we see
a persistent correlation between peak euphoria and the market top.
Related Reading: The Polygon Vesting Contract Is Officially Empty,
Will This Send MATIC Price To $3? The most recent example of this
is November 2021, when the index’s score climbed to as high as 84,
just 5 points shy of the current 79 score. At this point, the price
of Bitcoin had risen to $69,000 before meeting resistance, which it
will eventually succumb to, In the following days, sentiment would
begin turning, as did the price of Bitcoin. A similar pattern was
also seen in February and March 2021 when the index hit a high of
94. The next few days saw interest taper off, marking the peak at
that particular point. If the same pattern were to be repeated in
this scenario, then Bitcoin could have another few days of runway
before it blows off top. Presently, the cryptocurrency is already
seeing significant resistance at $57,000, which could suggest that
the top is near. Follow Best Owie on X (formerly Twitter) for
market insights, updates, and the occasional funny tweet… Featured
image from Publish0x, chart from TradingView.com
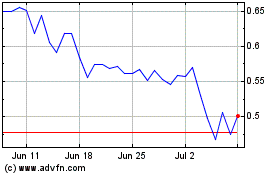
Polygon (COIN:MATICUSD)
Historical Stock Chart
From Mar 2024 to Apr 2024

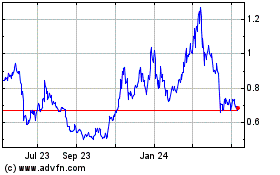
Polygon (COIN:MATICUSD)
Historical Stock Chart
From Apr 2023 to Apr 2024
