TIDMRNO
RNS Number : 1533K
Renold PLC
27 August 2019
Renold plc
Completion of investigation
27 August 2019
Renold plc ("Renold" or "the Group"), a leading international
supplier of industrial chains and related power transmission
products, today issues the following statement.
Summary
On 9 July 2019, the Group announced the postponement of the
Annual General Meeting ("AGM") to permit the preparation of revised
audited financial statements for the year ended 31 March 2019,
following the identification of historical accounting issues in the
Gears business unit, which is part of the Torque Transmission
division.
In order to prepare accurate revised financial statements, an
independent internal audit investigation, supported by PwC, has
been undertaken to assess the extent and impact of the historical
misstatement of results. This independent investigation has now
been concluded and the Board can confirm that these issues, the
nature of which were as set out in the announcement of 9 July 2019,
were confined to the Gears business unit.
With the independent investigation complete, revised financial
statements have been prepared and audited. The over-statements of
profit for the years ended 31 March 2018 and 2019 are broadly
consistent with the guidance provided on 9 July 2019 and the final
outcome of the investigation does not affect the outlook commentary
provided at that time. A summary of the adjustments made to the
historic accounts as a result of this investigation is provided
below.
Investigation and findings
A review of the Gears business unit was initially undertaken
following comments made by the Auditor to the Audit Committee
regarding application of accounting controls in the business unit.
The initial management investigation identified intentional
misstatement of results at a local level, and as a result the Board
immediately initiated an independent internal audit investigation,
supported by PwC, reporting directly to the Audit Committee.
In the announcement on 9 July 2019, the Company reported that
the initial investigation had identified a total overstatement of
the balance sheet at 31 March 2019 of GBP1.8m. The more extensive
independent investigation largely corroborated the initial
findings, in addition to identifying further errors which
principally impact profit in the year to 31 March 2017. The
cumulative effect of these misstatements resulted in net assets at
31 March 2019 being overstated by GBP2.5m in total, and adjusted
operating profit in the year to 31 March 2019 being overstated by
GBP1.0m.
This independent investigation concluded that the misstatement
was a result of intentional mis-reporting of financial information
at a local level. The misstatement comprised many adjustments
across a number of balance sheet categories. The impact on cash and
net debt of GBP0.3m is unchanged from the announcement on 9 July
2019.
Robert Purcell, Chief Executive of Renold, said:
"These events are frustrating and deeply disappointing but the
Board, in conjunction with the Audit Committee, have acted swiftly
to fully investigate all matters. We are working closely with
Deloitte, the Group's Auditor, to ensure that recommended
improvements to the internal control environment are quickly and
effectively implemented.
"With the investigation and audit of the revised accounts
completed, we can refocus our efforts on operational improvement
and generating value for shareholders."
Impact of findings on historical financial results
A summary of the impact of the adjustments is set out below.
More detail is included in notes 27 and 28 of the revised 2019
annual report and accounts which can be found on the Group's
website at www.renold.com.
Consolidated statement of comprehensive income (extract):
                                  2017                                   2018                                2019
                 -------------------------------------  -------------------------------------  --------------------------------
                          As                                     As                                     As
                  previously                      2017   previously                      2018   previously                 2019
                    reported   Restate-ment   restated     reported   Restate-ment   restated     reported   Revision   revised
                        GBPm           GBPm       GBPm         GBPm           GBPm       GBPm         GBPm       GBPm      GBPm
---------------  -----------  -------------  ---------  -----------  -------------  ---------  -----------  ---------  --------

 Revenue               183.4              -      183.4        191.6              -      191.6        202.4          -     202.4
 Operating
  costs
  before
  adjusting
  items              (168.9)          (1.0)    (169.9)      (177.4)          (0.5)    (177.9)      (186.0)      (1.0)   (187.0)
---------------  -----------  -------------  ---------  -----------  -------------  ---------  -----------  ---------  --------
 Adjusted
  operating
  profit                14.5          (1.0)       13.5         14.2          (0.5)       13.7         16.4      (1.0)      15.4
 Adjusting
  items                (3.5)              -      (3.5)        (8.6)              -      (8.6)        (0.2)          -     (0.2)
---------------  -----------  -------------  ---------  -----------  -------------  ---------  -----------  ---------  --------
 Operating
  profit                11.0          (1.0)       10.0          5.6          (0.5)        5.1         16.2      (1.0)      15.2
 Net financing
  costs                (4.3)              -      (4.3)        (4.2)              -      (4.2)        (5.0)          -     (5.0)
---------------  -----------  -------------  ---------  -----------  -------------  ---------  -----------  ---------  --------
 Profit before
  tax                    6.7          (1.0)        5.7          1.4          (0.5)        0.9         11.2      (1.0)      10.2
 Taxation              (1.9)              -      (1.9)        (3.6)              -      (3.6)        (3.5)          -     (3.5)
---------------  -----------  -------------  ---------  -----------  -------------  ---------  -----------  ---------  --------
 Profit/(loss)           4.8          (1.0)        3.8        (2.2)          (0.5)      (2.7)          7.7      (1.0)       6.7
Consolidated balance sheet (extract):
                                2017                                   2018                                2019
               -------------------------------------  -------------------------------------  --------------------------------
                        As                                     As                                     As
                previously                      2017   previously                      2018   previously                 2019
                  reported   Restate-ment   restated     reported   Restate-ment   restated     reported   Revision   revised
                      GBPm           GBPm       GBPm         GBPm           GBPm       GBPm         GBPm       GBPm      GBPm
-------------  -----------  -------------  ---------  -----------  -------------  ---------  -----------  ---------  --------
 ASSETS
 Non-current
  assets             104.2          (0.4)      103.8         98.2          (0.4)       97.8        107.0      (0.3)     106.7
 Current
 assets
 Inventories          40.4          (0.2)       40.2         41.0          (0.2)       40.8         44.8      (0.5)      44.3
 Trade and
  other
  receivables         36.8          (0.1)       36.7         36.4          (0.3)       36.1         37.8      (0.3)      37.5
 Cash and
  cash
  equivalents         16.4              -       16.4         14.3              -       14.3         17.9      (0.3)      17.6
-------------  -----------  -------------  ---------  -----------  -------------  ---------  -----------  ---------  --------
 Current
  assets              93.6          (0.3)       93.3         91.7          (0.5)       91.2        100.5      (1.1)      99.4
 Non-current
  assets               0.3              -        0.3            -              -          -            -          -         -
-------------  -----------  -------------  ---------  -----------  -------------  ---------  -----------  ---------  --------
 TOTAL ASSETS        198.1          (0.7)      197.4        189.9          (0.9)      189.0        207.5      (1.4)     206.1


 LIABILITIES
 Current
 liabilities
 Trade and
  other
  payables          (41.9)          (0.3)     (42.2)       (39.6)          (0.6)     (40.2)       (41.0)      (1.1)    (42.1)
 Other
  current
  liabilities        (8.7)              -      (8.7)        (7.1)              -      (7.1)        (1.6)          -     (1.6)
-------------  -----------  -------------  ---------  -----------  -------------  ---------  -----------  ---------  --------
 Current
  liabilities       (50.6)          (0.3)     (50.9)       (46.7)          (0.6)     (47.3)       (42.6)      (1.1)    (43.7)
 Non-current
  liabilities      (139.7)              -    (139.7)      (142.1)              -    (142.1)      (163.3)          -   (163.3)
-------------  -----------  -------------  ---------  -----------  -------------  ---------  -----------  ---------  --------
 NET ASSETS            7.8          (1.0)        6.8          1.1          (1.5)      (0.4)          1.6      (2.5)     (0.9)
-------------  -----------  -------------  ---------  -----------  -------------  ---------  -----------  ---------  --------
ENQUIRIES:
 Renold plc                             0161 498 4500
 Robert Purcell, Chief Executive
 Ian Scapens, Group Finance Director

 Peel Hunt LLP                          020 7418 8900
 Mike Bell
 Ross Allister
 Ed Allsopp

 Instinctif Partners                    020 7457 2020
 Mark Garraway
 Rosie Driscoll
Cautionary statement regarding forward-looking statements
Some of the information in this document may contain projections
or other forward-looking statements regarding future events or the
future financial performance of Renold Plc and its subsidiaries
(the Group). You can identify forward-looking statements by terms
such as "expect", "believe", "anticipate", "estimate", "intend",
"will", "could", "may" or "might", the negative of such terms or
other similar expressions. Renold Plc (the Company) wishes to
caution you that these statements are only predictions and that
actual events or results may differ materially. The Company does
not intend to update these statements to reflect events and
circumstances occurring after the date hereof or to reflect the
occurrence of unanticipated events. Many factors could cause the
actual results to differ materially from those contained in
projections or forward-looking statements of the Group, including
among others, general economic conditions, the competitive
environment as well as many other risks specifically related to the
Group and its operations. Past performance of the Group cannot be
relied on as a guide to future performance.
NOTES FOR EDITORS
Renold is a global leader in the manufacture of industrial
chains and also manufactures a range of torque transmission
products which are sold throughout the world to a broad range of
original equipment manufacturers and distributors. The Company has
a well-deserved reputation for quality that is recognised
worldwide. Its products are used in a wide variety of industries
including manufacturing, transportation, energy, steel and
mining.
Further information about Renold can be found on the website at:
www.renold.com
This information is provided by RNS, the news service of the
London Stock Exchange. RNS is approved by the Financial Conduct
Authority to act as a Primary Information Provider in the United
Kingdom. Terms and conditions relating to the use and distribution
of this information may apply. For further information, please
contact rns@lseg.com or visit www.rns.com.
END
MSCDMGZRLVDGLZM
(END) Dow Jones Newswires
August 27, 2019 02:02 ET (06:02 GMT)
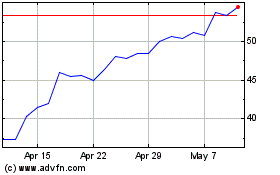
Renold (LSE:RNO)
Historical Stock Chart
From Mar 2024 to Apr 2024

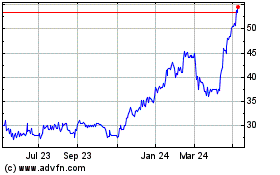
Renold (LSE:RNO)
Historical Stock Chart
From Apr 2023 to Apr 2024
