Final Results -5-
February 27 2012 - 2:01AM
UK Regulatory
       14.55 pence                         resulted in a significant increase
   (2010 - 12.01 pence)         +21%       in earnings per share.                           1,2
                            -----------  -------------------------------------------  ---------
Return on revenue margin
                            -----------  -------------------------------------------  ---------
                                          A record Group adjusted operating
                                           margin of 13.8% was achieved in
                                           2011, with both the Aerospace
                                           and Flexonics Divisions posting
                                           record figures, principally due
                                           to a combination of increased
                                           activity on major OEM programmes,
                                           effective and sustained cost controls,
                                           and operational efficiency gains
                                           based on further progress with
                                           the Group's ongoing Lean Manufacturing
          13.8%                 +0.5       continuous improvement initiatives.            1,2,4
      (2010 - 13.3%)            PPTS
                            -----------  -------------------------------------------  ---------
Net cash from operating
 activities
                            -----------  -------------------------------------------  ---------
                                          The Group generated significant
                                           cash from operating activities
                                           in 2011 of GBP77.1m, driven by
                                           strong earnings growth and effective
                                           control over working capital.
                                           This level of cash conversion
                                           has enabled the Group to propose
                                           a 22% dividend increase and fund
         GBP77.1m                          increased capital expenditure
     (2010 - GBP70.2m)          +10%       of 1.2 times depreciation.                         1
                            -----------  -------------------------------------------  ---------
Return on capital employed
                            -----------  -------------------------------------------  ---------
                                          The increase in the group's return
                                           on capital employed in 2011 to
                                           26.8% (a record level) was achieved
                                           through a combination of the earnings
                                           enhancements set out above and
                                           increased balance sheet efficiency,
                                           in particular effective allocation
                                           of capital expenditure to increasingly
                                           profitable programmes and control
                                           over working capital requirements
          26.8%                 +0.7       at an operational level.                     1,2,3,4
      (2010 - 26.1%)            PPTS
                            -----------  -------------------------------------------  ---------
Carbon dioxide emissions
                            -----------  -------------------------------------------  ---------
 94 tonnes / GBPm revenue       -3%       Through more efficient use of                       4
  (2010 - 97 tonnes/GBPm                   resources and improved asset utilisation,
         revenue)                          the Group has made good early
                                           progress on its published five
                                           year target of improving energy
                                           efficiency by 10% between 2011
                                           and 2015. This is the sixth consecutive
                                           year that Senior has reduced its
                                           environmental impact.
                            -----------  -------------------------------------------  ---------
Lost time injury frequency
 rate
                            -----------  -------------------------------------------  ---------
                                          The Group takes a proactive approach
                                           to the health and safety of all
                                           employees, as described more fully
                              Reduced      in the Corporate Social Responsibility
                               by 0.62     Report in the Annual Report &
   0.98 incidents per 100     incidents    Accounts 2011. A reduction of
       employees p.a.          per 100     39% in the number of recordable
    (2010 - 1.6 incidents     employees    injuries which incurred lost time
   per 100 employees p.a.)      p.a.       was achieved in 2011.                              4
                            -----------  -------------------------------------------  ---------
The Group has had considerable success in implementing its
strategy over the last five years. A summary of the five-year
average annual movements from 2006 to 2011 in the Group's KPIs is
set out in the table below:
                                               Five-year average annual
                                            movement - 2006 to 2011 (7)
 Organic revenue growth (1)                                    +5% p.a.
 Adjusted earnings per share growth (2)                       +29% p.a.
 Return on revenue margin increase (3)                   +1.4 ppts p.a.
 Net cash from operating activities                           +24% p.a.
 Return on capital employed increase (4)                 +2.6 ppts p.a.
 CO(2) emissions / GBPm revenue (5)                            -4% p.a.
 Lost time injury frequency rate (6)           0.4 fewer incidents p.a.


 (1)   Organic revenue growth is the rate of growth in Group revenue,
        at constant exchange rates, excluding the effect of acquisitions
        and disposals.
 (2)   Adjusted earnings per share is the profit after taxation (adjusted
        for the profit or loss on disposal of fixed assets, amortisation
        of intangible assets arising on acquisitions, acquisition costs,
        goodwill impairment charge and exceptional pension gains) divided
        by the average number of shares in issue in the period.
 (3)   Return on revenue margin is the Group's adjusted operating profit
        divided by its revenue.
 (4)   Return on capital employed is the Group's adjusted operating
        profit divided by the average of the capital employed at the
        start and end of the period. Capital employed is total assets
        less total liabilities, except for those of an interest-bearing
        nature.
 (5)   CO(2) emissions / GBPm revenue is an estimate of the Group's
        carbon dioxide emissions in tonnes divided by the Group's revenue
        in GBPm.
 (6)   Lost time injury frequency rate is the number of OSHA (or equivalent)
        recordable injury or illness cases involving days away from
        work per 100 employees.
 (7)   Calculated as the simple average of year-on-year movements in
        these KPIs over the five years, as published.
The application of the Group's four key principles in strategy
implementation outlined above has resulted in the development of
the following strategic objectives in each of the Group's five key
market sectors. The Group's progress against these objectives is
also included in the table below:
 What is the strategy?                                          Progress
 Structures
                                                               -------------------------------------------------------------

    *    Growth in higher value kitting and assemblies to         *    Weston acquisition brings increased exposure to
         deliver market share gains                                    Airbus, hard metal machining capabilities and
                                                                       facilities in Europe and south-east Asia

    *    Develop hard metal machining capabilities
                                                                  *    New programme wins with key customers in Mexico

    *    Diversify customer base via increased collaboration
         between operations                                       *    Improvements in operational execution is a key driver
                                                                       of margin progression

    *    Invest in well-funded military programmes
                                                                  *    Increased market share on large commercial aircraft
                                                                       platforms via acquisitions of Damar and Weston
    *    Continue focus on operational excellence to drive
         customer value and market share
                                                                  *    Robust performance on key military programmes

    *    Selective acquisitions to complement growth strategy
                                                                  *    Prospect of continued growth via build rate increases
                                                                       and new platforms coming through in medium-term
                                                               -------------------------------------------------------------
 Fluid conveyance systems
Senior (LSE:SNR)
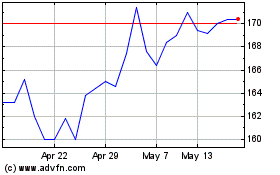
Historical Stock Chart
From Jun 2024 to Jul 2024

Senior (LSE:SNR)
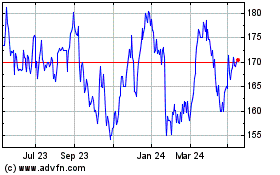
Historical Stock Chart
From Jul 2023 to Jul 2024
