Mandalay Resources Corporation Announces Production and Sales Results for the First Quarter of 2019
April 10 2019 - 4:30PM

Mandalay Resources Corporation ("Mandalay" or the "Company") (TSX:
MND, OTCQB: MNDJF) announced today its production and sales results
for the first quarter of 2019.
In the first quarter of 2019, Mandalay produced
21,940 saleable ounces of gold equivalent and sold 23,007 ounces of
gold equivalent.
Dominic Duffy, President and Chief Executive
Officer of Mandalay, commented, “Mandalay’s consolidated production
was a significant improvement on recent quarters, due in large part
to a strong quarter at Björkdal, where trucking and haulage of
higher-grade underground material returned to expected levels
following the arrival of the entire underground haulage fleet.
Björkdal was also positively impacted by the mining of higher-grade
underground ore, which is the successful result of our geology
team’s primary focus of identifying higher-grade ore sources. We
expect the higher production levels at Björkdal to remain stable
for the remainder of 2019.”
Mr. Duffy continued, “While the production was
lower at Costerfield compared to the previous quarter, the
operation continued with its capital development towards the
high-grade Youle lode, scheduled to be producing by year-end.
Production was also ramping up on the Brunswick lode, which will be
the primary source of Costerfield production over 2019.”
Mr. Duffy concluded, “We view the first quarter
as an excellent start to 2019. Our performance during the quarter
marks the second consecutive quarter of operational improvement, as
consolidated production and sales increased by approximately 15%
and 25%, respectively, in the first quarter of 2019 versus the
fourth quarter of 2018. The major areas of focus over the remainder
of 2019 are to advance capital development to the Youle lode at
Costerfield and to continue developing operational improvements at
Björkdal to lift the processed grade higher. We will also restart
our exploration program in the second quarter of 2019, which
includes deeper exploration drilling at Costerfield and step-out
drilling around the Aurora zone at Björkdal.”
Saleable production for the three months
ended March 31, 2019:
- In the first quarter of 2019, the
Company produced a total of 18,490 ounces of gold and 575 tonnes of
antimony, representing a total of 21,940 ounces of gold equivalent,
versus 19,303 ounces of gold and 605 tonnes of antimony in the
first quarter of 2018, representing a total of 23,172 ounces of
gold equivalent.
- Production at Björkdal was 14,385
ounces of gold in the first quarter of 2019, as compared to 12,716
ounces of gold in the first quarter of 2018.
- Production at Costerfield was 4,105
ounces of gold and 575 tonnes of antimony in the first quarter of
2019, versus 6,587 ounces of gold and 605 tonnes of antimony in the
first quarter of 2018.
Table 1 – Saleable Production for the First Quarter 2019
and 2018, and Fourth Quarter 2018
|
Metal |
Source |
Three months endedMarch 31
2019 |
Three months endedMarch 31
2018 |
Three months ended December 31 2018 |
| Gold
(oz) |
Björkdal |
14,385 |
12,716 |
10,482 |
|
|
Costerfield |
4,105 |
6,587 |
4,948 |
|
|
Total |
18,490 |
19,303 |
15,430 |
|
Antimony (t) |
Costerfield |
575 |
605 |
561 |
|
Average quarterly prices: |
|
|
|
|
| Gold
US$/oz |
|
1,303 |
1,329 |
1,229 |
|
Antimony US$/t |
|
7,817 |
8,499 |
8,204 |
|
Au Eq. (oz)1 |
Björkdal |
14,385 |
12,716 |
10,482 |
|
|
Costerfield |
7,555 |
10,456 |
8,691 |
|
|
Total |
21,940 |
23,172 |
19,173 |
1 Quarterly gold equivalent ounces (“Au Eq.
oz”) produced is calculated by multiplying the saleable quantities
of gold (“Au”) and antimony (“Sb”) in the period by the respective
average market prices of the commodities in the period, adding the
two amounts to get a “total contained value based on market price”,
and then dividing that total contained value by the average market
price of Au in the period. Average Au price in the period is
calculated as the average of the daily LME PM fixes in the period,
with price on weekend days and holidays taken of the last business
day; average Sb price in the period is calculated as the average of
the daily average of the high and low Rotterdam warehouse prices
for all days in the period, with price on weekend days and holidays
taken from the last business day. The source for all prices is
www.metalbulletin.com.
Sales for the three months ended March
31, 2019:
- In the first quarter of 2019, the
Company sold a total of 19,857 ounces of gold and 525 tonnes of
antimony, representing a total of 23,007 ounces of gold equivalent,
versus 24,808 ounces of gold and 679 tonnes of antimony in the
first quarter of 2018, representing a total of 29,151 ounces of
gold equivalent.
- Björkdal sold 15,778 ounces of gold
in the first quarter of 2019, versus 17,677 ounces of gold in the
first quarter of 2018.
- Costerfield sold 4,079 ounces of
gold and 525 tonnes of antimony in the first quarter of 2019,
versus 7,131 ounces of gold and 679 tonnes of antimony in the first
quarter of 2018.
Table 2 – Sales for the First Quarter
2019 and 2018, and Fourth Quarter 2018
|
Metal |
Source |
Three months endedMarch 31
2019 |
Three months endedMarch 31
2018 |
Three months ended December 31 2018 |
| Gold
(oz) |
Björkdal |
15,778 |
17,677 |
9,557 |
|
|
Costerfield |
4,079 |
7,131 |
4,957 |
|
|
Total |
19,857 |
24,808 |
14,514 |
|
Antimony (t) |
Costerfield |
525 |
679 |
582 |
|
Average quarterly prices: |
|
|
|
|
| Gold
US$/oz |
|
1,303 |
1,329 |
1,229 |
|
Antimony US$/t |
|
7,817 |
8,499 |
8,204 |
|
Au Eq. (oz)1 |
Björkdal |
15,778 |
17,677 |
9,557 |
|
|
Costerfield |
7,229 |
11,474 |
8,842 |
|
|
Total |
23,007 |
29,151 |
18,399 |
1 Quarterly Au Eq. oz sold is calculated by
multiplying the saleable quantities of Au and Sb in the period by
the respective average market prices of the commodities in the
period, adding the two amounts to get a “total contained value
based on market price”, and then dividing that total contained
value by the average market price of Au for the period. The source
for all prices is www.metalbulletin.com with price on weekend days
and holidays taken of the last business day.
For Further Information:
Dominic DuffyPresident and Chief Executive
Officer
Greg DiTomasoDirector of Investor Relations
Contact: 647.260.1566
About Mandalay Resources
Corporation:
Mandalay Resources is a Canadian-based natural
resource company with producing assets in Australia and Sweden, and
care and maintenance and development projects in Chile. The Company
is focused on growing production at its gold and antimony operation
in Australia, and gold production from its operation in Sweden to
generate near-term cash flow.
Forward-Looking Statements:
This news release contains "forward-looking
statements" within the meaning of applicable securities laws,
including statements regarding the Company’s production of goldand
antimony for the 2019 fiscal year. Readers are cautioned not to
place undue reliance on forward-looking statements. Actual results
and developments may differ materially from those contemplated by
these statements depending on, among other things, changes in
commodity prices and general market and economic conditions. The
factors identified above are not intended to represent a complete
list of the factors that could affect Mandalay. A description of
additional risks that could result in actual results and
developments differing from those contemplated by forward-looking
statements in this news release can be found under the heading
“Risk Factors” in Mandalay’s annual information form dated March
28, 2019, a copy of which is available under Mandalay’s profile at
www.sedar.com. In addition, there can be no assurance that any
inferred resources that are discovered as a result of additional
drilling will ever be upgraded to proven or probable reserves.
Although Mandalay has attempted to identify important factors that
could cause actual actions, events or results to differ materially
from those described in forward-looking statements, there may be
other factors that cause actions, events or results not to be as
anticipated, estimated or intended. There can be no assurance that
forward-looking statements will prove to be accurate, as actual
results and future events could differ materially from those
anticipated in such statements. Accordingly, readers should not
place undue reliance on forward-looking statements.
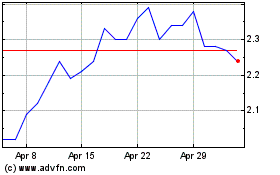
Mandalay Resources (TSX:MND)
Historical Stock Chart
From Mar 2024 to Apr 2024

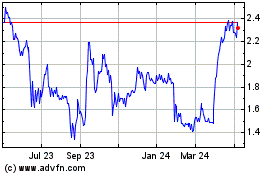
Mandalay Resources (TSX:MND)
Historical Stock Chart
From Apr 2023 to Apr 2024
